Article

Improved Organic Fertilisers Made from Combinations of Compost, Biochar, and Anaerobic Digestate: Evaluation of Maize Growth and Soil Metrics

by
Noemí Ortiz-Liébana
*,
Andrea Crespo-Barreiro
,
Ismael Mazuecos-Aguilera
and
Fernando González-Andrés
Chemical, Environmental and Bioprocess Engineering Group, Institute of Environment, Natural Resources and Biodiversity, University of León, Av. Portugal, 41, 24009 León, Spain
*
Author to whom correspondence should be addressed.
Agriculture 2023, 13(8), 1557; https://doi.org/10.3390/agriculture13081557
Submission received: 24 June 2023 / Revised: 17 July 2023 / Accepted: 18 July 2023 / Published: 4 August 2023
(This article belongs to the Section Agricultural Soils)

Abstract

:
Treated bio-residues can be used as biostimulants in crops within the circular economy approach to reduce the use of traditional fertilisers. In this work, we optimised the combination rates for three types of treated bio-residues (compost, biochar, and anaerobic digestate (AD)) in two microcosm trials, one with a combination of compost and biochar and other with biochar and AD. The crop used was maize, and the variables analysed were plant growth, and soil chemical and biological properties. The combination of bio-residues improved plant growth and soil biological activity to a greater extent than one product alone; that is, compost and biochar performed better than compost alone and biochar, and AD performed better than biochar alone. However, while the concentration in the plant biomass of several essential nutrients for crops increased in the treatments with compost and biochar, and with biochar and AD, compared to the untreated controls, the nitrogen concentration was reduced. This was due to the competition for nitrogen between the plant and the soil microbiome, whose activity was activated. Due to the importance of nitrogen in plant growth, the increase in biomass production could be explained not only by the higher availability of other nutrients but also by the plant-growth-promoting activity exerted by the more active soil microbiome. Further research should focus on validating this hypothesis and unravelling the mechanisms involved. From the environmental site, the presence of biochar in the mixtures of organic residues reduced the soil nitrogen at risk of lixiviation and sequestered carbon, which partially compensated for the increased CO2 emissions because labile forms of carbon were present in the remaining organic residues.

1. Introduction

As a result of the increasing demand for food due to the continuous growth of the human population [1], the need for fertilisers has exponentially increased in the last decade to cope with crop requirements [2,3]. The process of fertilising crops involves adding appropriate mineral and/or organic compounds in order to provide nutrients for plants [4]. The use of mineral fertilisers supports current crop yields, but their abuse can cause water and soil pollution and disrupt natural environments [5,6]. Furthermore, less technologically advanced mineral fertilisers quickly release nutrients into the soil, and plants are unable to suitably assimilate them [1]; in such cases, an appropriate management method consisting of a strict dosage along the crop cycle is necessary to avoid the loss of nutrients at a high economic and environmental cost. Organic fertilisers not only improve soil biological activity, but also provide biostimulants for crops that, together with a slower release of nutrients, enhance the nutrients used by crops. Thus, organic fertilisers are featured contributors to sustainable agriculture [2].
The circular economy approach involves the conditioning of bio-residues intended for use as agricultural inputs, e.g., as organic fertilisers [7]. Much research is being focused on the development of technologically advanced organic fertilisers. Three environmentally friendly technologies for treating bio-residues are composting, anaerobic digestion, and pyrolysis. Composts are still the most frequently used products by farmers as organic fertilisers [1] due to the high quality of the nutrients they provide to plants and other good agronomic properties [8,9,10]. Anaerobic digestate (AD) is a nutrient-rich residue in either a solid or liquid state (depending on the processing) that has potential to be used as a fertiliser in agriculture [11]. Treated bio-residues not only provide nutrients to the crops but also improve the physical soil properties, such as the structure, and consequently improve the aeration and water holding capacity. They can also increase the biological activity, which is being considered in this case, as a soil amendment or conditioner. Biochar is obtained by pyrolysis of bio-residues, and although it provides reduced quantities of nutrients for crops, it improves their physical, chemical, and biological properties, indirectly affecting their fertility [2] and becoming an innovative and highly promising soil conditioner for sustainable agriculture [12,13]. Given the low quantity of assimilable nutrients provided by the biochar, but its well-known role as an agronomic enhancer, biochar has been selected in this work to improve the agronomic performance of compost on the one hand and of AD on the other. In the case of the combination of biochar and AD, biochar was the carrier of AD, resulting in a solid product.
However, there are few scientific studies on the optimisation of the combination of treated bio-residues for agriculture. The main aim of this work was to evaluate the combination of bio-residues, assessing the effects on the soil through the evaluation of biological and chemical parameters and on the crop as indicators of their performance. The goal was to optimise the combination of compost with biochar on the one hand and biochar with AD on the other by testing them at the microcosm scale with maize plants. Thus, this work contributes to the global search for improved organic fertilisers within a circular economy context. The optimisation consisted of the determination of the most effective dose and bio-residue combination, and the evaluation of their effects on biomass production by plants and on the chemical and biological parameters of the soil.

2. Materials and Methods

2.1. Components Production

The components used were compost, biochar, and AD. The raw material for compost was a mixture of de-alcoholised grape pomace combined with vinasses of lees and crushed plant biomass (Table S1). The biochar was produced from the wood of the vine shoots (Table S2) by slow pyrolysis in a pilot pyroliser with an electrically heated reactor and a semi-continuous feeding system. The characteristics of the pyroliser and the system for biochar production are described in [14]. The raw material for the AD was organic residue from local hotels, restaurants, and cafes (HORECA channel), and it was produced in a 25 L anaerobic continuously stirred tank reactor (CSTR). The average composition of the feed consisted of fruit peels from pineapples and apples (31.8%); vegetables, including pumpkin peels, sweet pepper, and cauliflower (46.7%); meat (9.3%); fish (4.2%); and bread (8%). The material was crushed and homogenised to achieve a particle size of less than 1 cm. The reactor was operated with a hydraulic retention time (HRT) of 30 days under semi-continuous operation at 35 °C. The reactor was supplemented with NH4Cl and KH2PO4 weekly dissolved in a solution containing micronutrients, with the composition suggested by [15]. The final composition of the AD is described in Table S3. To further reduce the particle size and obtain a liquid stream with solid particles smaller than 3 mm, the AD obtained from the reactor was homogenised and ground. For the combination of compost and biochar, both components were mixed in a rotary drum and stored at room temperature.

2.2. Fertilising Products Description

Several fertilising products were designed based on the combination of the components in varying proportions, as described in Section 2.1. Two different families of organic fertilisers were designed: “compost + biochar” and “biochar + AD” (Table 1).

2.3. Phytotoxicity Test and Toxicity Test on Soil Rhizobacteria

The phytotoxicity of the fertilising products resulting from the combination of compost with biochar as additive and biochar with AD as additive was evaluated for the different doses of additives by means of the Zucconi test [16], modified by [17]; i.e., compost + B3 and compost + B6, biochar + AD5, and biochar + AD10 were evaluated for phytotoxicity. Briefly, seeds of lettuce (Lactuca sativa L.), radish (Raphanus sativus L.), cress (Lepidium sativum L.), tomato (Solanum lycopersicum L.), and sweet pepper (Capsicum annuum L.) plants were surface-sterilised by soaking for 20 min in 2% (v/v) sodium hypochlorite, following soaking for 10 min in 70% (v/v) ethanol, then rinsed in sterile distilled water. Five replicates with 10 seeds each for germination tests were carried out with three concentrations (product/sterile distilled water) of the products to be tested: 1:5 (w/v) ratio, 1:10 (w/v) ratio, and 1:25 (w/v) ratio. A control treatment was also performed using sterile distilled water. The seeds of each species were placed on filter paper (Prat Dumas medium flow) in 9 cm Petri dishes containing 5 mL of the product to be tested. The Petri dishes were hermetically sealed and kept in a growth chamber at 25 °C under artificial light. Seeds were considered germinated when the radicle extended to at least 2 mm. The number of germinated seeds was recorded daily until the control reached 100% germination. The germination index (GI), expressed as a percentage, was calculated as the product of the relative germination percentage (RGP) and relative radicle growth (RRG) according to the formula presented by [16].
The toxicity test on soil rhizobacteria was evaluated using modified version of the methodology of [18]. This test is a kind of antibiogram that analyses whether a product placed in a located area of a Petri dish previously inoculated with a bacterium produces growth inhibition halos around the placed product. The bacteria used were Bacillus sp., Pseudomonas sp., and Rhizobium sp. The experimental design was 2 replicates per product and bacterium. The culture media used were Triptic Soy Agar (TSA; Darmstadt, Germany, Sigma-Aldrich) for Bacillus sp. and Pseudomonas sp., and Yeast Mannitol Agar (YMA; Darmstadt, Germany, Sigma-Aldrich) for Rhizobium sp. Each Petri dish was inoculated with 100 μL from the bacterium, distributed with sterile saline solution 0.8% (w/v) onto the dish and dried using a laminar flow hood. Three autoclaved 5 mm circles of filter paper (Prat Dumas medium flow rate) were soaked in the product to be evaluated in each Petri dish, forming a triangle. The Petri dishes were dried again, hermetically sealed, and incubated for 3 days (Bacillus sp. and Pseudomonas sp.) and 7 days (Rhizobium sp.) at 28 °C.

2.4. Microcosm Trial

Two greenhouse microcosm trials were carried out for fertiliser products with maize (Zea mays L.) cultivar ‘Antalya’ from the company ‘Euralis Semillas, SA’. In the first trial, the family of products designated as compost + biochar was evaluated, and in the second one, biochar + AD was evaluated (Table 1 for a description of the treatments evaluated for each family). In both trials, the performance of the products was compared with a control that did not receive any organic fertiliser.
The experiment was performed in pots (0.021 m2 in surface and 0.20 m in height) filled with 400 g of a substrate consisting of a mix of vermiculite/soil (1:4 v:v, respectively). The soil characteristics are shown in Table S4. The experimental design was a randomised complete block with three blocks and ten replicates (pots) per treatment. The total number of pots was 210 for trial 1 and 270 for trial 2. The corresponding treatments were applied to the substrate before sowing the seeds. Two maize seeds were sown in each pot, and after germination, only one seedling was left in each pot. The experiment was carried out under controlled conditions at 20 °C with 60% relative humidity in October and November 2017 for a period of five weeks; the substrate was maintained at field capacity.
At harvest, each plant was collected, and its height and fresh weight were measured. Subsequently, samples were oven-dried at 60 °C for 48 h to measure dry aerial biomass and to analyse the content of nitrogen (N), phosphorous (P), potassium (K), calcium (Ca), and magnesium (Mg).
The C-CO2 released was determined in one pot for each treatment and block using the soil respiration method proposed by [19] and modified by [20]. After the C-CO2 measurement, three soil replicates per treatment and block were dried at room temperature, homogenised, and sieved to 2 mm to analyse the following parameters: soil pH in KCl 1M (1:5 w/v) using a pH-meter 781 pH/Ion Meter (Metrohm, Herisau, Switzerland); electrical conductivity (EC) (1:5 (w/v) using a conductivity meter (Cond 3210, Weilheim, Germany); and total oxidisable organic carbon (TOC) according to Walkley and Black (1934) as described by [21]. Fluorescein diacetate hydrolytic activity (FDA) was determined following [22].
One-way analysis of variance (ANOVA) and orthogonal contrasts were carried out using the treatment as a single fixed factor irrespective of the type of dose in the treatment. Following, a two-way ANOVA was performed using the treatments (compost dose and biochar dose for the trial 1, and biochar dose and AD dose for the trial 2) as fixed factors and the block as a random factor. In trial 1, the effects of the compost dose, the biochar dose, and their interaction were analysed, and in trial 2, the biochar dose and the AD dose were evaluated. Tukey’s test was performed for mean comparisons. IBM-SPSS software (v.26.0, IBM Corporation, Armonk, NY, USA) was used for all statistical analyses.

3. Results

3.1. Phytotoxicity Test and Toxicity Test on Soil Rhizobacteria

A dilution rate of 1:25 (w:v) in distilled water was a stimulant for all tested products and all plant species, with the highest stimulant effect encountered for the product compost + B3 (Table 2). Conversely, a dilution rate of 1:5 (w:v) produced high phytotoxicity for all products (Table 2). An intermediate dilution rate of 1:10 produced intermediate phytotoxicity, i.e., the products compost + B6 and biochar + AD10 were moderately phytotoxic for lettuce and tomato; biochar + AD5 was moderately phytotoxic for lettuce, tomato, and cress; and compost + B3 was moderately phytotoxic only for tomato. For the remaining plant species, these products were non-phytotoxic.
There was no sign of toxicity in soil rhizobacteria for any of the products or any of the dilution rates (i.e., no inhibition halos were found; images not shown).

3.2. Plant Parameters in Microcosm Trial: Biomass Production, Height, and Chemical Analysis of Aerial Biomass

In trial 1, which evaluated the products from the compost + biochar family, the treatments with compost + biochar and the treatment with compost alone showed significantly higher aerial biomass than the control and no differences in height (Figure 1; Table S5). Furthermore, the treatments with compost + biochar produced significantly higher aerial biomass than the treatment with only compost (Table S5).
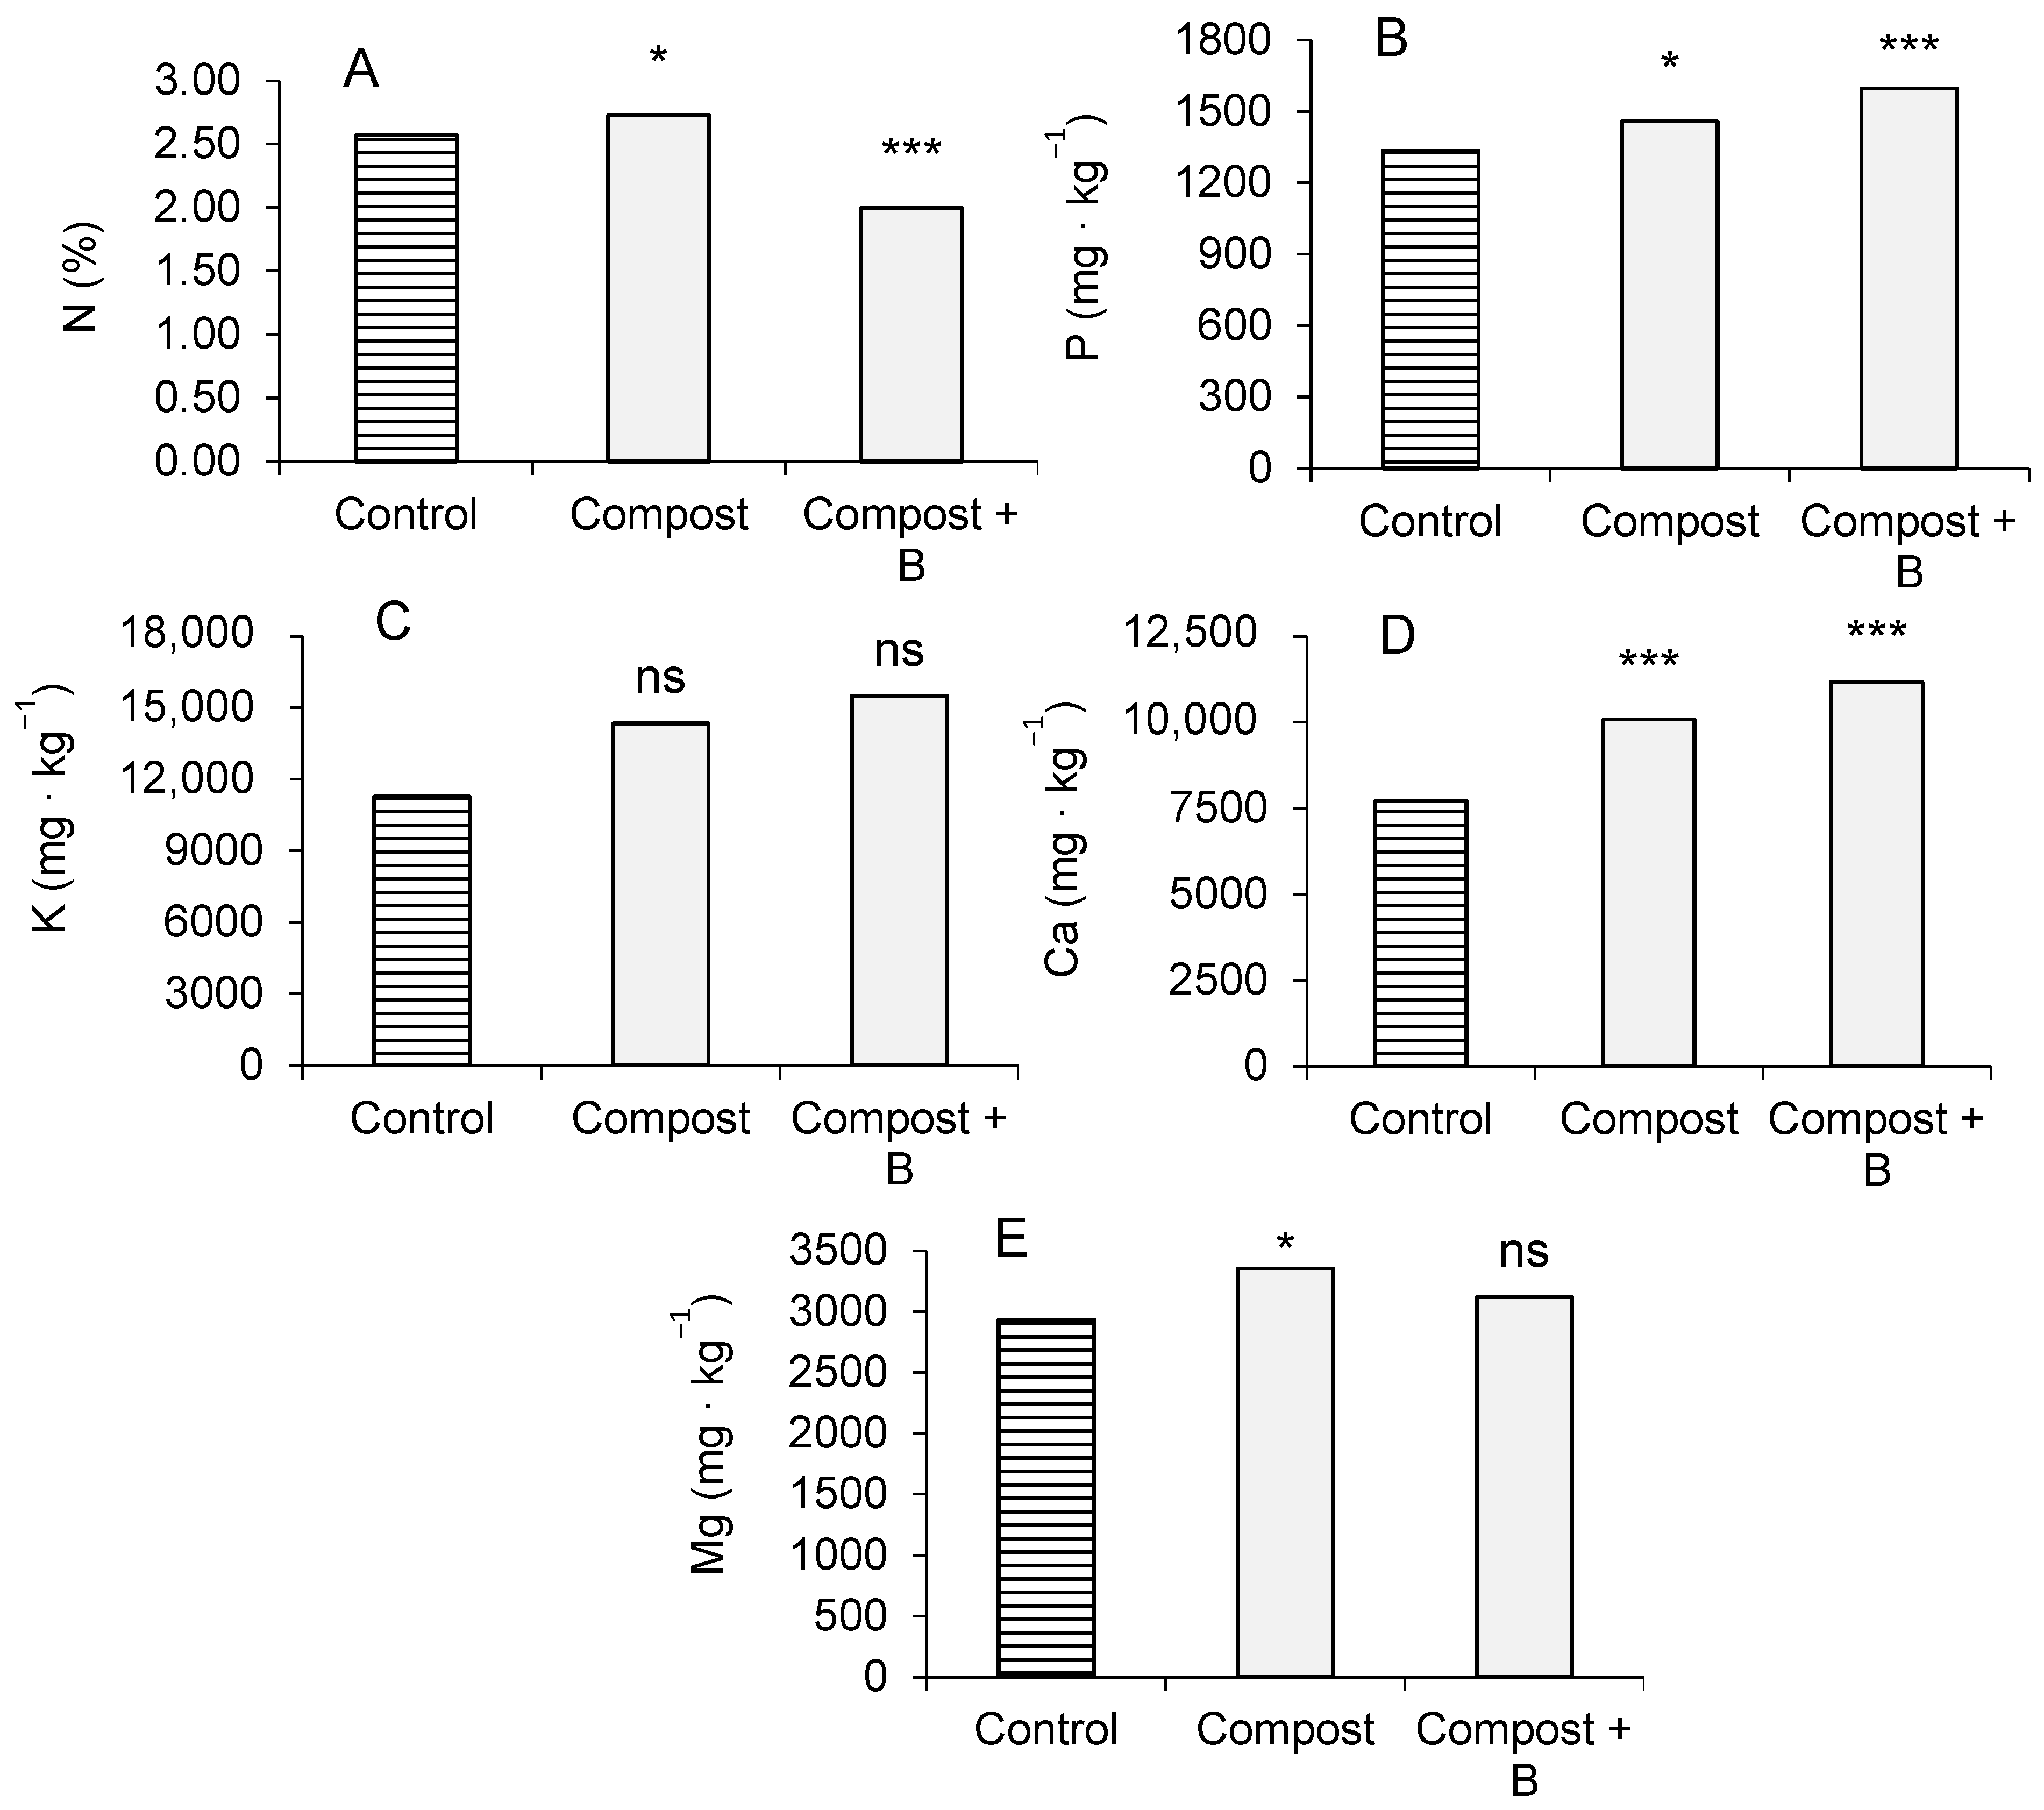
P and Ca content in the aerial biomass (Figure 2; Table S5) was significantly higher in the treatments with compost and with compost + biochar than in the control. Conversely, for N and Mg, although the treatments with compost showed a significantly higher content than the control, the treatments with compost + biochar presented a similar Mg content and a lower N content than the control. Comparing the treatments with compost and the treatments with compost + biochar, there were significant differences for all nutrients except for K and Mg (Table S5), while the content of P and K was higher in the treatments with compost + biochar than in the treatments with compost alone; the N content contrasted with these results.
The ANOVA results for the factors compost dose and biochar dose in trial 1 are described in Table S6. The two factors produced significant differences in most of the dependent variables, except for the height and the Mg content. The interaction between the compost and biochar doses was significant only for Ca content. For the compost dose 2 t ha−1, the 3% and 6% biochar doses produced significantly higher values than the absence of biochar for the fresh aerial biomass and K and Ca content, and conversely produced significantly lower values for the N content (Table 3). The P content was higher for the treatments with biochar, but the significance of the differences was restricted to the comparison between the 6% biochar dose and the absence of biochar (Table 3). Similarly, for the 5 t ha−1 compost dose, 3% and 6% biochar doses produced significantly higher values than the 0% biochar dose for the Ca content and significantly lower values for the N content; moreover, for the P content, only the 6% dose produced significantly higher values than the absence of biochar. For the remaining dependent variables, in the 5 t ha−1 compost dose, there were no significant differences between the different biochar doses (Table 3).
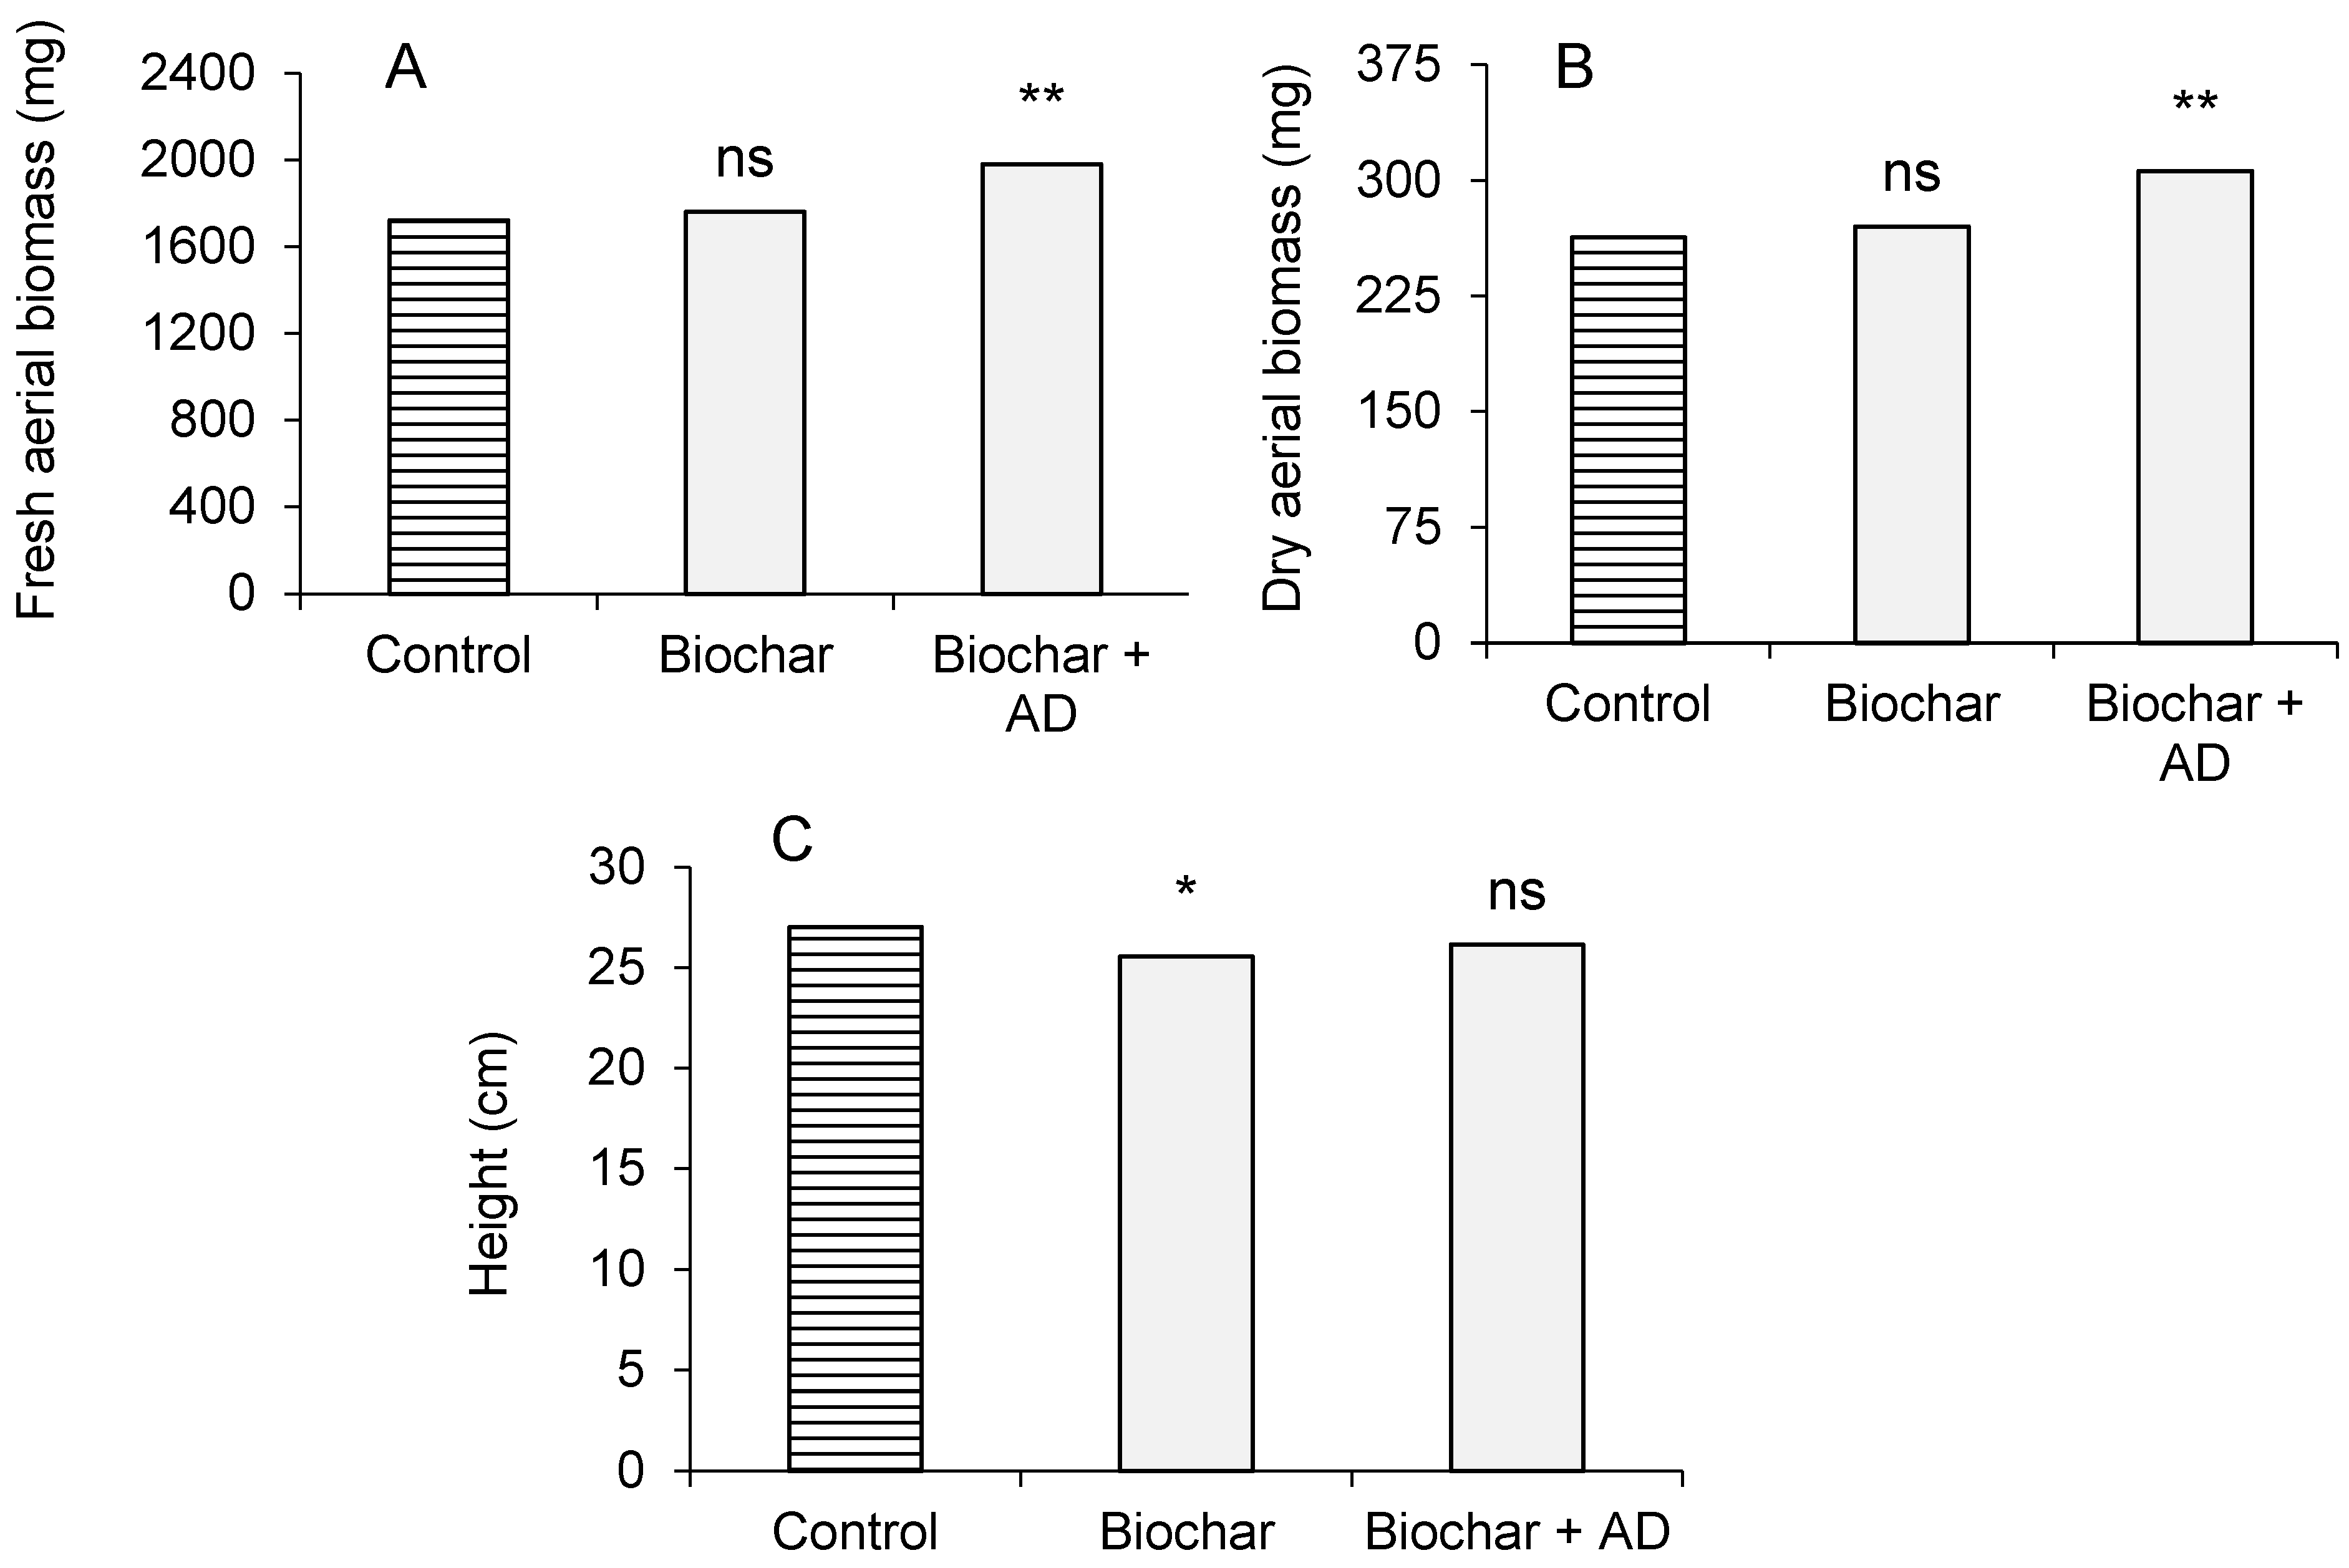
In trial 2, which evaluated the products from the family biochar + AD, the treatments with biochar + AD presented significantly higher aerial biomass than the control, while the treatments with biochar only showed no differences with respect to the control. The treatments with biochar presented significantly shorter plants in terms of height than the control (Figure 3; Table S7). Moreover, the biochar + AD treatments produced significantly higher aerial biomass than the biochar-only treatments (Table S7).
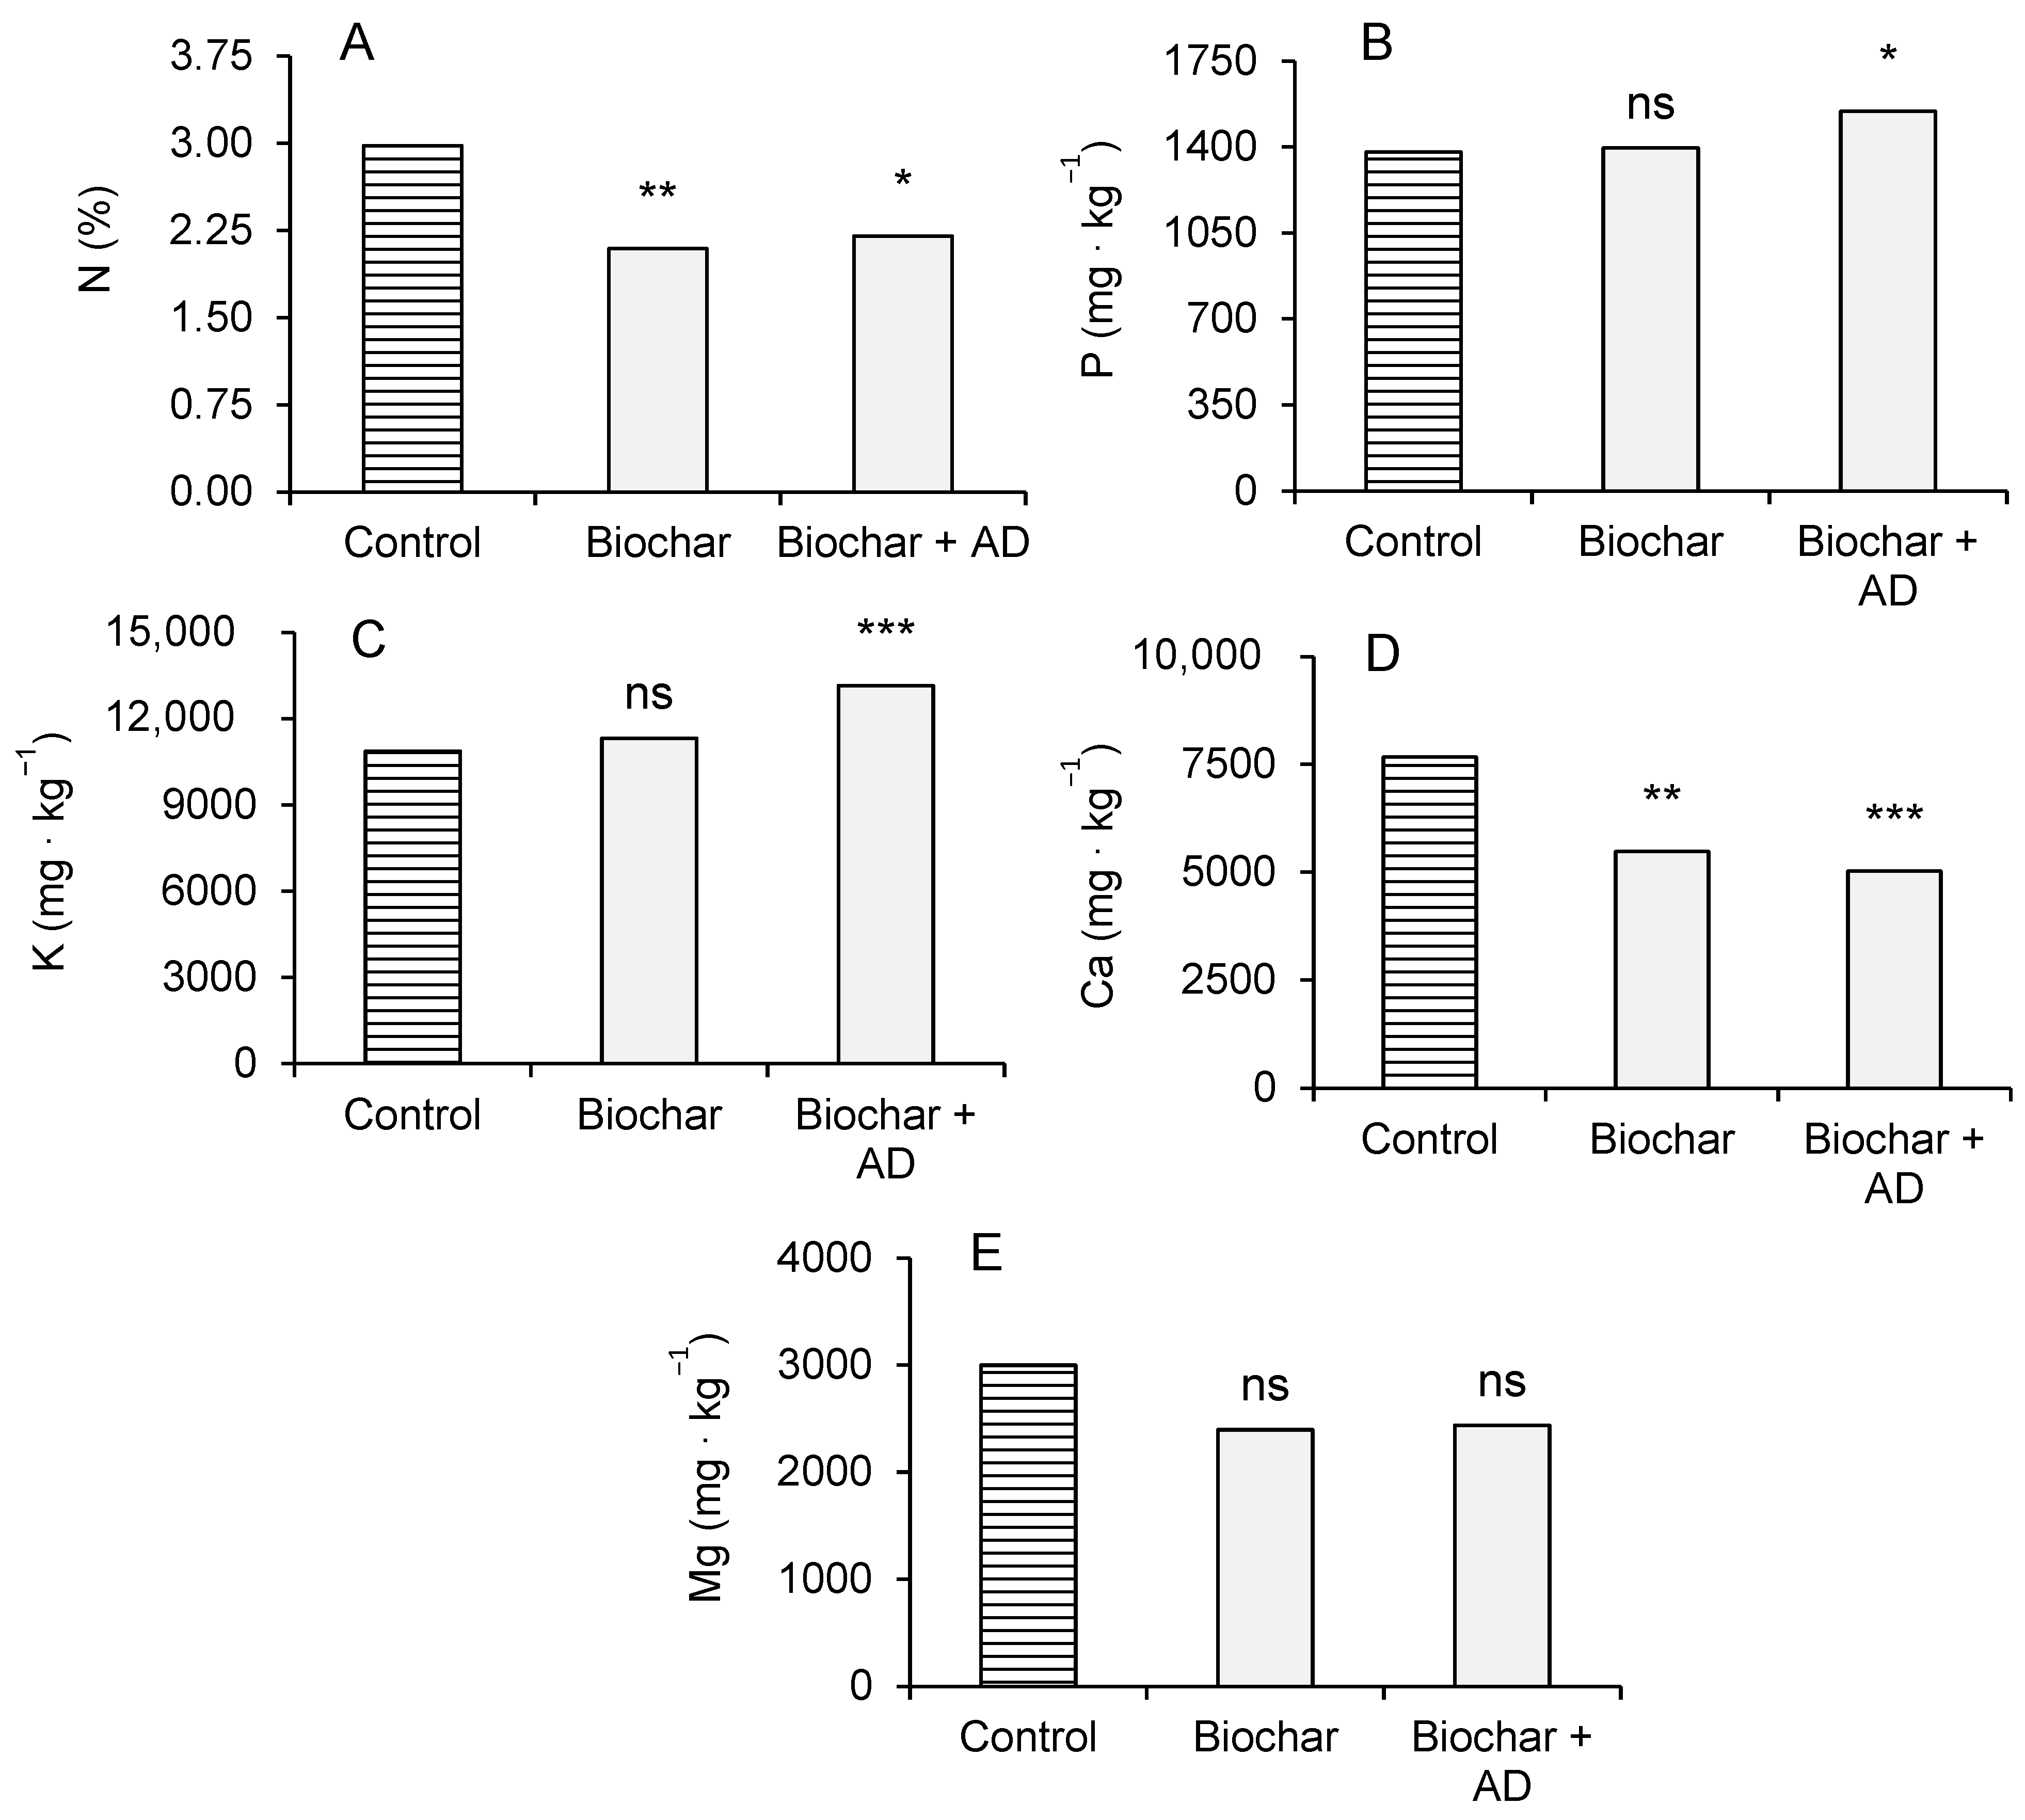
The content of P and K in the plant tissues were significantly higher in the treatments with biochar + AD than in the control. Conversely, the N and the Ca contents, were significantly lower in the treatments with biochar and in the treatments with biochar + AD than in the control (Figure 4; Table S7). The N, P, and K contents were significantly higher in the treatments with biochar + AD than in the biochar-only treatments (Table S7).
The results of ANOVA for the factors biochar dose and AD dose in trial 2 are shown in Table S8. Both factors produced significant differences in most of the dependent variables analysed, except for the height and the Mg content. In contrast, only the biochar dose produced significant differences in the Ca content, as did the AD dose in the P content. The interaction between biochar and AD doses was significant only for the K content. For the 250 kg ha−1 biochar dose, the 10% AD dose produced significantly higher N, P, and K contents in the biomass compared to the biochar without AD. For the remaining variables, there were no significant differences between the different AD doses (Table 4). For the 500 kg ha−1 biochar dose, the 10% AD dose produced significantly higher aerial biomass than the 0% and 1% AD doses; conversely, the 10% AD dose produced a significantly lower Ca content than the biochar without AD. Interestingly, the 5% and 10% AD doses produced significantly higher K content than the other AD doses (Table 4).

3.3. Soil Chemical and Biological Parameters

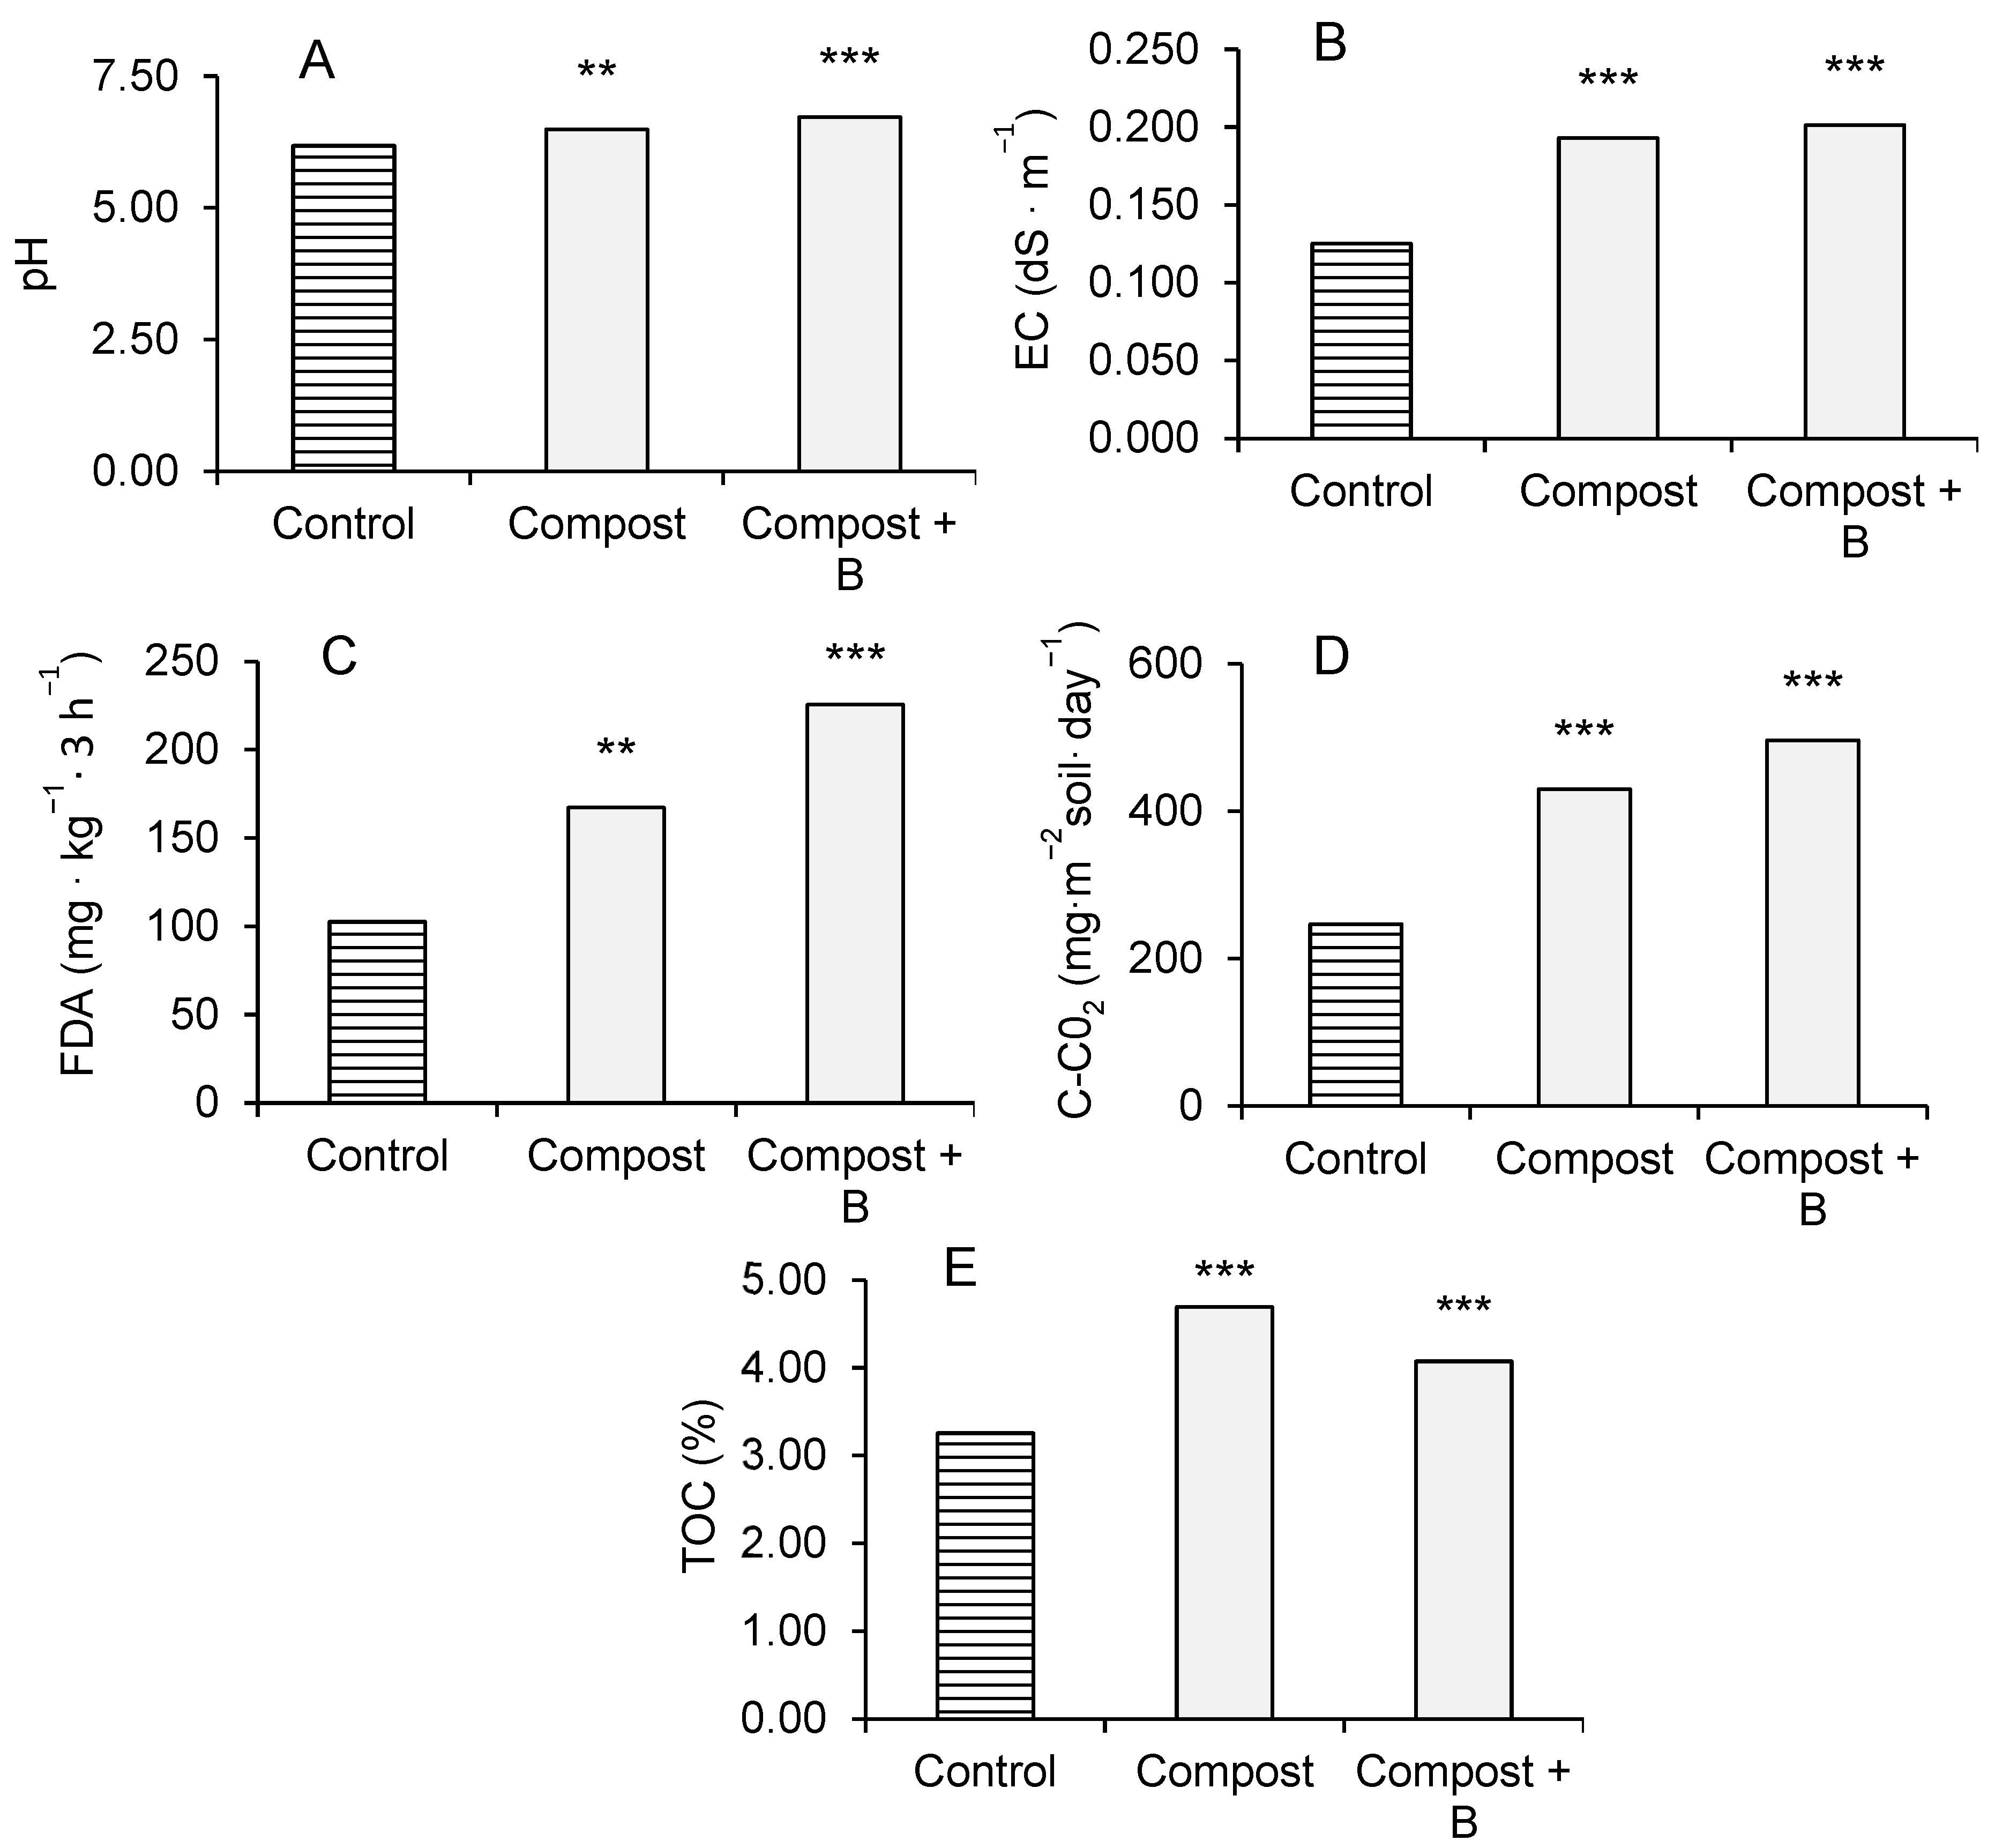
In trial 1, the treatments with compost and the treatments with compost + biochar presented significantly higher values than the control for all soil parameters (Figure 5; Table S9). Furthermore, the treatments with compost + biochar produced significantly higher values than the treatments with only compost for the FDA and C-CO2 released, and significantly lower values for the TOC (Figure 5; Table S9).
The ANOVA results for the factors compost dose and biochar dose in trial 1 are shown in Table S10. The two factors produced significant differences in the FDA, the C-CO2 released, and the TOC, while the EC was only affected by the compost dose, and the pH was only affected by the biochar dose. For the 2 t ha−1 compost dose, the 6% biochar dose resulted in significantly higher values of FDA and lower values of TOC, with respect to the other two doses, and of C-CO2 released, with respect to the 0% biochar dose (Table 5). For the 5 t ha−1 compost dose, the addition of biochar to the compost released a significantly higher amount of C-CO2, regardless of the dose. Moreover, the addition of each increasing dose of biochar to the compost produced a significant increase in the FDA compared to the immediately lower dose. Furthermore, 6% biochar in the compost reduced the TOC compared to compost without biochar (Table 5). Finally, there were no significant differences between the biochar doses for the pH and the EC for both compost doses (Table 5).
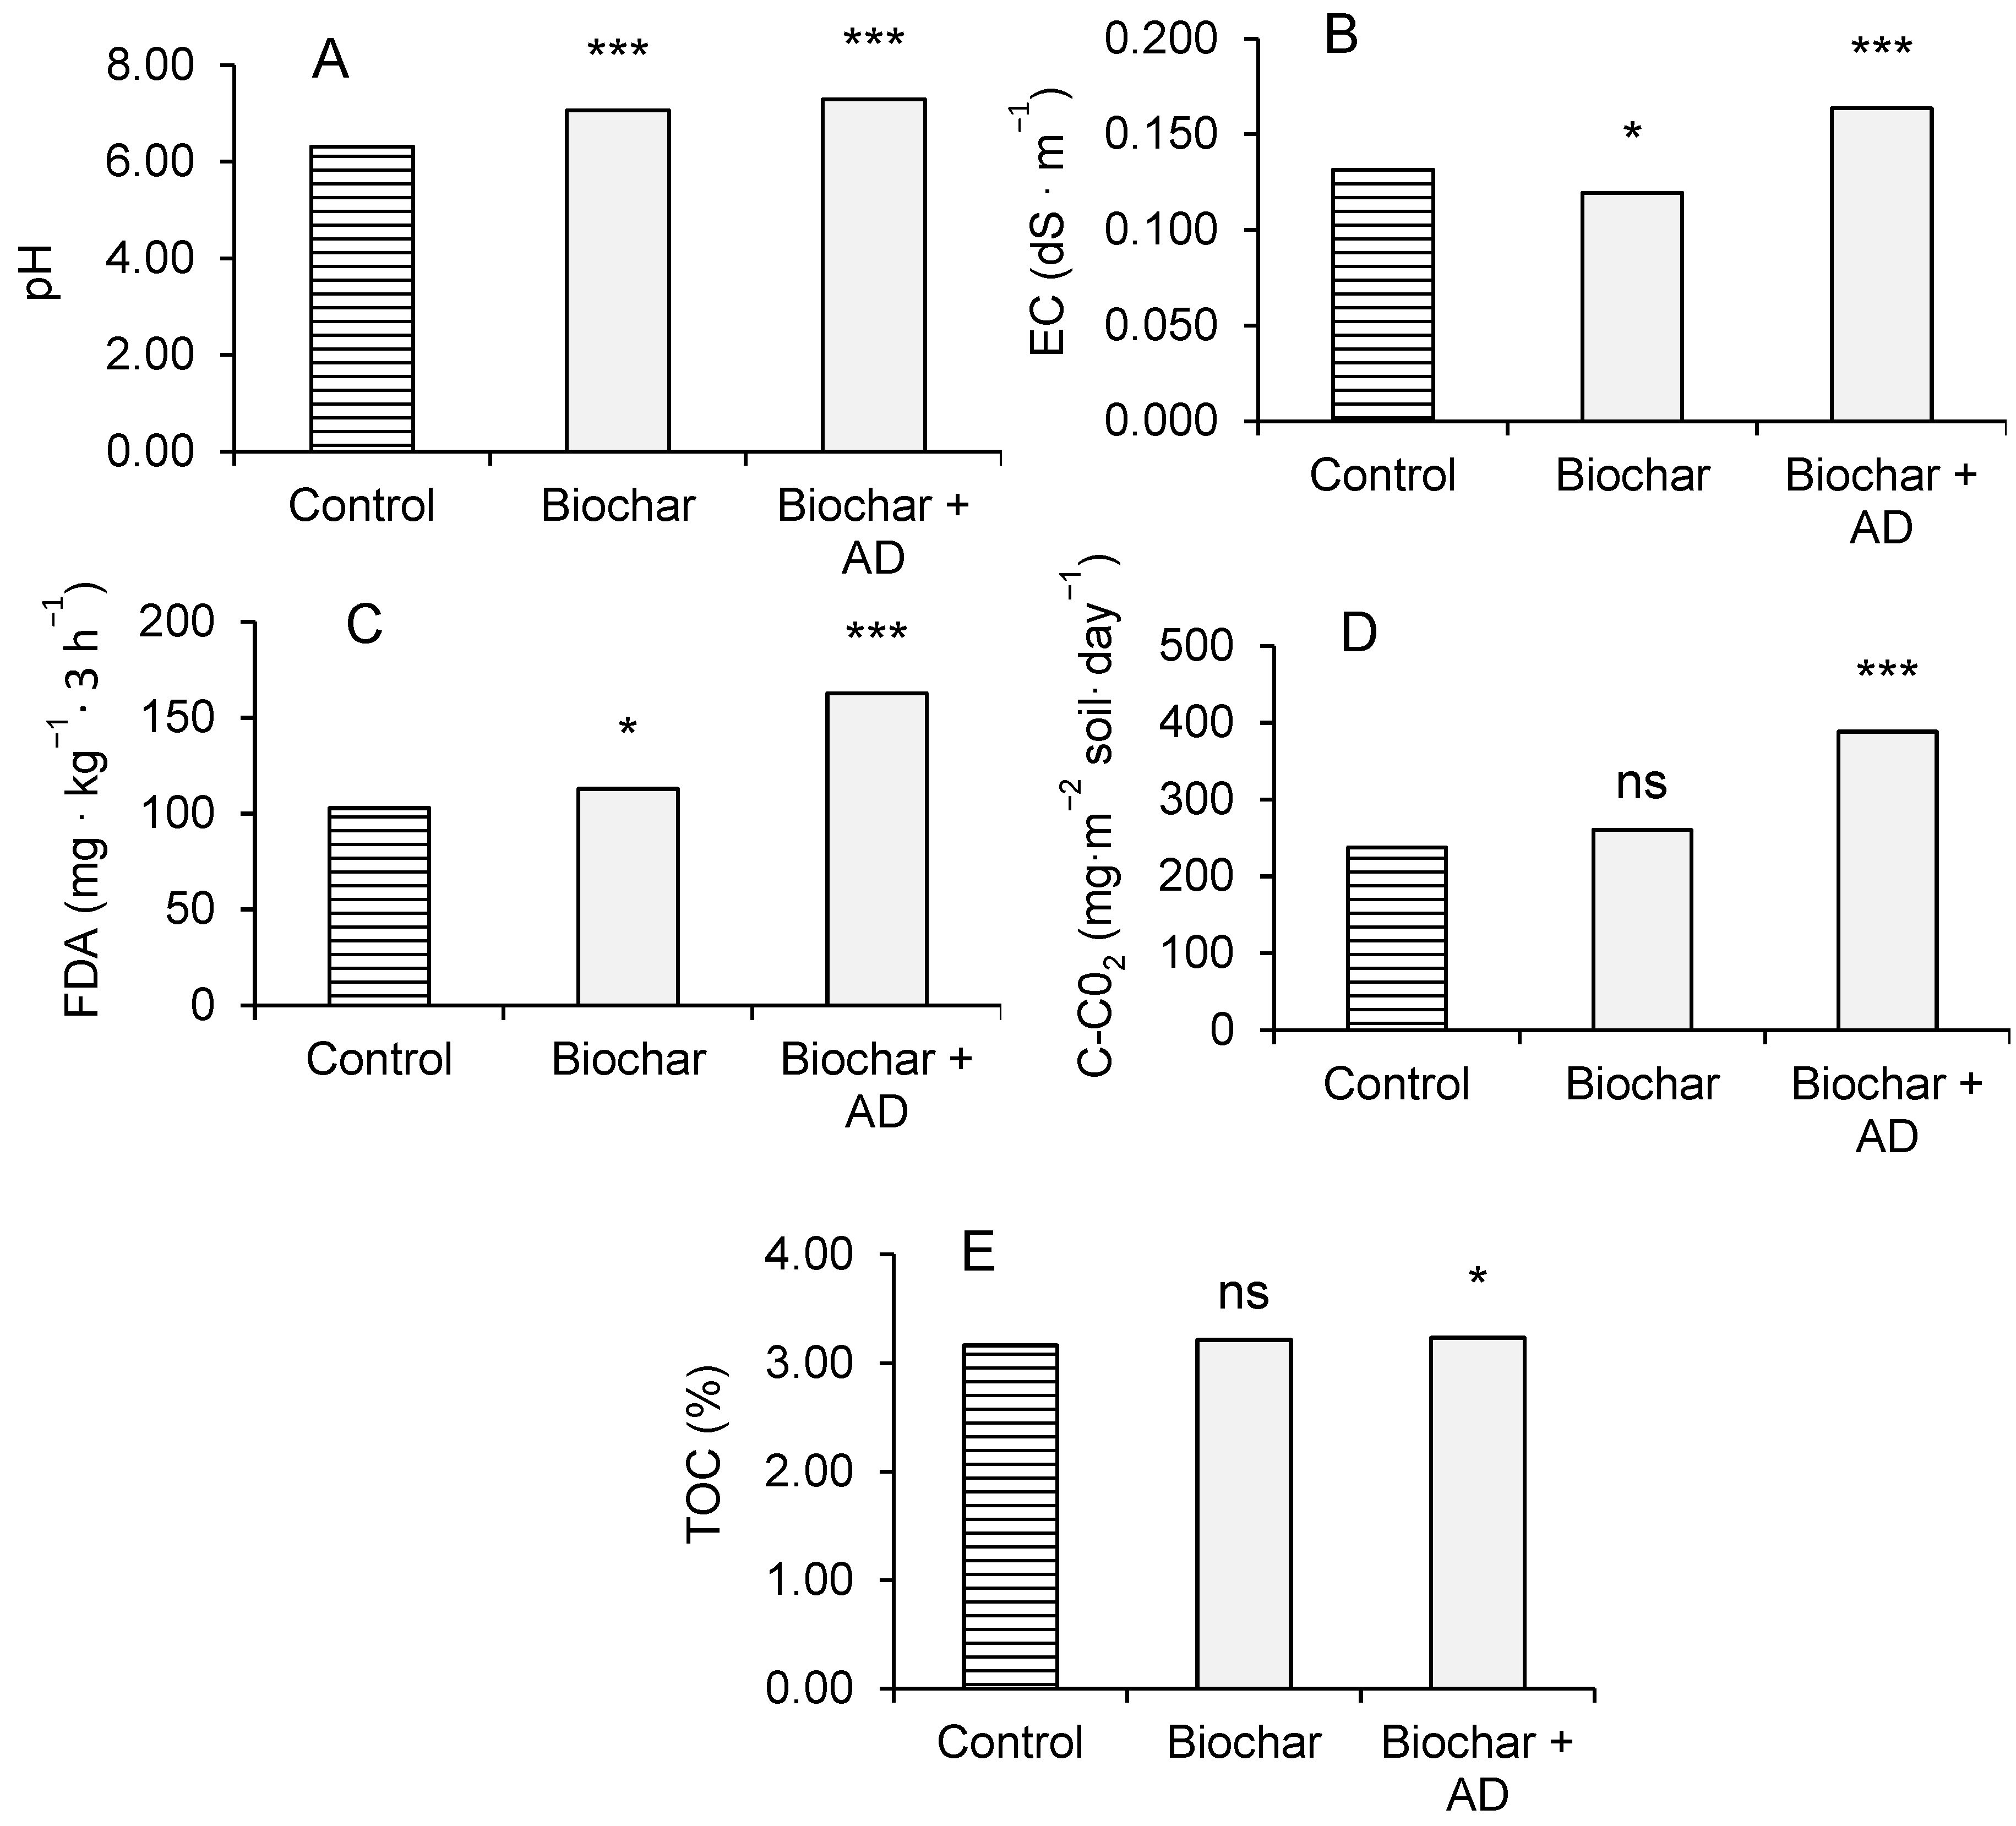
In trial 2, the treatments with biochar + AD showed significantly higher values than the control for all soil parameters. The biochar without AD only increased the pH and the FDA, while it decreased the EC (Figure 6; Table S11). Moreover, the treatments with biochar + AD presented significantly higher values than the treatments with only biochar for all soil parameters (Table S11).
The results of the ANOVA for the factors biochar dose and AD dose in trial 2 are shown in Table S12. The two factors produced significant differences in all soil parameters, but the interaction of both factors was significant only for the FDA. For the two biochar doses, 250 kg ha−1 and 500 kg ha−1, the responses of the soil parameters to the different AD doses were similar for the pH, the FDA, and the C-CO2 released. For the pH, the 10% AD dose produced significantly higher values than the other AD doses. For the FDA and the C-CO2 released, the 5% and 10% AD doses produced significantly higher values than the other AD doses (Table 6). Interestingly, the TOC was significantly higher for the 1% and 5% AD doses with respect to the biochar alone for the 250 kg ha−1 biochar dose and for the 10% AD dose for the 500 kg ha−1 biochar dose (Table 6).

4. Discussion

4.1. Phytotoxicity Test and Toxicity Test on Soil Rhizobacteria of the Products Tested

As expected, in Zucconi’s test, a highly concentrated aqueous extract from the evaluated products exerted phytotoxicity, but under appropriate dilution, they all showed a biostimulant effect. Thus, the products tested are suitable as organic fertilisers as is and as feedstocks for organic fertilisers because when used at adequate doses, they are phytostimulants. The doses used in the microcosm test were adequate to produce a positive effect on the crop (see Section 4.2 for further discussion). The phytotoxicity observed for concentrated aqueous extracts from biochar in Zucconi’s test has been previously observed by [23,24], who reported slower germination for the highest concentrations. Accordingly, in our experiments, the aqueous extract from compost + biochar produced a lower GI for a higher biochar rate; that is, compost + B6 (with 6% of biochar in weight with respect to the final product) was more phytotoxic than compost + B3 (with 3% of biochar), and the former had less of a phytostimulant effect than the latter (the phytotoxic or phytostimulant effect depends on the concentration of the aqueous extract). These results indicate that biochar is not a good substrate for seeds germination, but it is a good component for organic fertilisers because the biomass produced by plants fertilised with compost + biochar was higher than those fertilised with compost alone (see Section 4.2 for further discussion).
For AD, there was a similar situation, i.e., while a highly concentrated aqueous extract from AD exerted phytotoxicity in Zucconi’s test, a low concentration was phytostimulatory. Therefore, our results are consistent with those of other authors who also observed that the application of undiluted AD produced phytotoxicity [25]. High pH, EC [26,27], and NH4+ [28] have been recognised as potential sources of phytotoxicity in digestates. Additionally, other authors have also observed that diluted AD is a stimulant [29,30,31], producing a GI of up to 140% [30], 150% [29], and even 341% [31], with this last value for a diluted combination of AD with molasses. However, interestingly, AD was less phytotoxic than biochar because an aqueous extract of biochar + AD5 (with 5% AD in volume with respect to the weight of the final product) was more phytotoxic and less phytostimulant (GI 52% to 82% and 114% to 178%, respectively) than the extract of biochar + AD10 (with 10% AD) (GI 63% to 89%, and 174% to 288%, respectively). As indicated by [31], this could be due to hormone-like substances that can be harboured by AD.
Finally, the absence of toxicity in soil Rhizobacteria makes the combination of bio-residues suitable for the development of organic fertilisers.

4.2. Plants Growth and Biomass Composition in the Microcosm Trial

The addition of compost to the soil increased the plant biomass compared with the unfertilised control, as expected due to the nutrients provided to the crop by the compost, as reported elsewhere [1,9,10]. Interestingly, the addition of biochar to the finished compost further increased the biomass compared with plain compost. Another work [32] combined compost and biochar, but unlike ours, biochar was added before the composting process and thus there was a co-composting process; in that work, the authors added the resulting product into the soil and cultivated a halophyte plant, observing that for a 10% addition in weight with respect to the soil weight, biomass production increased.
Unexpectedly, in trial 2, the addition of biochar to the soil did not increase plant biomass production; however, other authors such as those in [33] also found no significant impact of biochar on plant growth. Nevertheless, it is more common to observe a plant biomass increase because of biochar addition (e.g., [23,34,35]). In contrast, in our experiment, the addition of biochar + AD produced a significant increase on plant biomass, similar to that previously reported by [23,35]. The explanation for the biomass increase with biochar + AD and not with biochar alone could be the presence of more nutrients for the crop in the AD [11,36]. Complementarily, another explanation could be the presence of hormone-like substances in AD that act as plant growth stimulants [31].
In both trials, the increase in biomass triggered by compost + biochar with respect to compost alone and by biochar + AD with respect to the control with no treatment was accompanied by a decrease in the N concentration in the biomass. A reduction in the N concentration when biomass production increases is quite common because there is a ‘dilution effect’ of this element in the biomass, although usually the total amount of N extracted by the plant from the soil increases. However, in our case, there was a decrease not only in the N concentration in the biomass but also in the total N extracted from the soil. This result is similar to that obtained by [37], which showed a decrease in shoot N concentration and in soil NH4+ and NO3 concentration for a treatment that received biochar compared to a control with no biochar incorporated. Some authors consider it possible that biochar’s high surface charge density enhances N retention through an improved cation and anion exchange capacity [38,39]. This explanation is based on the fact that some biochars have polar and non-polar sites on their surfaces that can adsorb NH4+-N to NO3-N because of the feedstock and processing circumstances [38,40,41,42,43,44]. However, there is another possible explanation for the reduction in the N concentration in the plant biomass, and it is related to the increase in soil biological activity, resulting in a consumption of the soil N that reduces its availability for the plants (see Section 4.4 for further details). Irrespective of the explanation for the lower N concentration, the fact is that there is less soil N available for plant absorption, and thus, there are also less ionic forms of N prone to be leached. Moreover, increased biomass production for less N availability avoids overconsumption by plants.
However, unlike N, the P concentration was higher in compost + biochar compared to compost alone; considering that biochar does not provide more P in assimilable forms than compost, this increase could be due to the improvement in the assimilation of soil nutrients by plants because of the recognised beneficial effects of biochar in the soil [45,46]. Alternatively, it could be a consequence of the direct interaction between biochar and the plant, which can improve the efficiency in nutrient uptake because of increased activity in membrane transporters for nutrients in plants treated with biochar, as already reported by [47]. Conversely, the observed increase in P and K concentrations in the biomass of plants that received biochar + AD compared to the biochar alone and to the control with no treatment is easily explained by the nutrients provided by the AD. Our results are in accordance with those reported by [23] but only partially because they showed that biochar alone does not increase the concentration of P and K in the plant biomass, but unexpectedly, they showed a reduction in the P and K concentration when they added a combination of biochar and AD to the soil, which clearly differs from our results.
Finally, the addition of biochar and biochar + AD generally reduced the concentrations of Ca and Mg in the biomass, as observed by [23]. We hypothesise that such a decrease might be associated for both treatments with an increase in the soil pH because of the biochar addition, which favours the formation of carbonates, making calcium unavailable for plant uptake [10].

4.3. Soil Chemical and Biological Parameters

The soil was slightly acidic (pH 6.23), and the pH increased for all treatments in the two microcosm trials compared to the untreated control. This should be due to the basic condition of the compost, the biochar, and the AD, but according to some authors [33,48,49,50,51], it could also be favoured by the increased soil microbial activity experienced as a consequence of the addition of organic substances to the soil. This result is similar to that obtained by [23], who observed the highest significance values for the soil pH with biochar addition and especially biochar with AD addition.
The significant increase in EC observed in the treatments with compost, compost + biochar, and biochar + AD compared to the untreated control is quite common, as previously observed by [9,52] for compost and biochar and by [23] for a combination of wood biochar and AD. The main reason is the presence of nutrients in the compost and AD that increase the ions present in the soil, but it has also been reported that an increase in the EC can be due to the presence of functional groups (e.g., hydroxyl and carboxylate) in compost and AD [53,54,55] and also to the release of organic substances of low molecular weight as a result of organic matter mineralisation [53,56]. Conversely, for the biochar alone, the EC decreased, which is consistent with the results obtained by [34] using rates of 1% and 5% biochar, similar to ours. This decrease could be due to the lower available ions in the soil because of the ion adsorption by biochar.
In general, the biological activity of the soil increased with the addition of compost, compost + biochar, and biochar + AD, and to a lesser extent with the addition of biochar alone. The biological activity has been estimated in this work from the FDA and C-CO2 released, with the former being directly related to the total microbial activity in the soil and the latter to the activity of soil edaphofauna, including microorganisms. The increase in FDA as a result of compost addition, which we observed, has also been reported by [57], who detected a direct correlation between the FDA and the compost application rate. Moreover, it has been demonstrated that compost and AD increase the nutrients available in the soil for use by microorganisms [53,58], thus promoting soil microbial activity, which is detected by an increase in the amount of C-CO2 released [52]. More controversial is the effect of biochar alone on soil microbial activity; in our case, the FDA increased slightly but significantly, but the C-CO2 released was not affected. In fact, some works have reported that biochar increases microbial activity in the soil [9,55], but others have observed no significant effect in the FDA for biochar additions compared to a control [59] or even a decrease in basal respiration of biochar alone compared to the control [60]. It seems that biochar does not exert a direct effect on the soil microbial activity, but rather exerts an indirect effect consisting of an increase in the soil microbial biomass and its microbiological activity in the long term [61] because of the improvement of the soil physico-chemical conditions, e.g., the regulation of the pH and the increase in the water holding capacity [62].
The significant increase in TOC observed for the treatments with compost and biochar + AD compared to the control without fertilisation is undoubtedly due to the carbon provided by the organic products added to the soil as previously observed by [52] and [63]. The addition of biochar alone to the soil usually increases the TOC because it provides organic carbon [34]; consequently, there is an increase in the TOC value [52]. However, in our experiment, even if the addition of biochar alone to the soil slightly increased the TOC compared with the control, the increase was not significant. Moreover, unexpectedly, the treatment with compost + biochar showed a significantly lower TOC than the treatment with compost alone, even if the biochar had a higher concentration of carbon than the compost. This result could be due to the higher microbial activity of the treatment with compost + biochar, which is explained by the higher FDA and C-CO2 released; the increased microbial activity liberates the easily assimilable fraction of C contained in the compost in the form of CO2, and the consequence is the reduction in TOC in the soil.

4.4. Agronomic and Environmental Effects of the Addition of Compost with Biochar and the Use of Biochar as a Carrier for AD

The agronomic performance of compost in maize plants was improved by the addition of biochar to the compost in terms of crop biomass production. However, the N concentration in the biomass decreased, both when compared to compost alone and even to the untreated control. Concomitantly, the P and Ca concentrations increased, and the K concentration was not affected. Thus, despite the increase in the content of plant nutrients in the plant due to the addition of organic products, there was less assimilation of N by plants, and this could be due to the competition with microorganisms for N because of the increase in soil microbial activity. Due to the importance of N in plant growth, the increase in biomass production for less available N was unexpected, which could be explained by the higher availability of other nutrients. Moreover, we hypothesise that better crop performance could be due to the plant-growth-promoting activity exerted by the soil microbiome, which has been activated by biochar addition to the compost. Such beneficial microorganisms can stimulate plant growth and solubilise phosphates and Ca, which are typical modes of action of Plant Growth Promoting Rhizobacteria (PGPR) [64,65,66].
Unexpectedly, the addition of biochar alone to the soil did not increase the agronomic performance of the crop in terms of biomass production, but rather decreased the N concentration in the biomass; in this case, there was no significant increase in soil microbiome activity. The most likely explanation of the reduced N availability to the crop is the adsorption of the soil NH4+-N and NO3N by biochar. Despite this result, biochar has been demonstrated to be a good carrier for AD because the addition of low AD doses (between 5% and 10%) improved agronomic and environmental parameters, namely increased crop biomass, and increased soil microbiome activity for a reduced N concentration in plant biomass. In this case, the explanation for this result could be the same as that for compost + biochar, consisting of increased soil microbial activity with a predominance of PGPR.
From the environmental site, biochar reduces the N at risk of lixiviation and sequesters carbon because it is a carbon sink [24]; the carbon sequestered by biochar partially compensates for the increased CO2 emissions because of the higher microbial activity due to the addition of compost, making the use of compost as fertiliser more sustainable.

5. Conclusions

The organic products tested exerted a phytostimulatory effect at appropriate dilution rates, as proven by Zucconi’s test, and this could be due to the stimulant substances (some of which are hormone-like products) contained in the extracts from the organic products. In addition, the microcosm trials demonstrated that compost + biochar improved the biomass production of maize plants compared to the treatment that received only compost; moreover, biochar + AD improved the biomass production compared to the treatment that received only biochar. In both cases, these effects were accompanied by improved soil biological activity. Concomitantly, a reduction in the N concentration in the plant biomass with respect to the control that did not receive any organic substance was observed; however, the P concentration increased.
Regarding doses, the best agronomic results for compost + biochar were obtained for the highest biochar dose (6%) and a dose between 2 and 5 t ha−1 of the final fertiliser product. In the case of biochar + AD, the best results were for an AD dose between 5% and 10% and a dose of 500 kg ha−1 of the final fertiliser product.
The combination of bio-residues tested improved plants growth to a greater extent than one product alone. Further research should be focused on validating the hypothesis that the PGPR population improves as a result of the addition of organic mixes and on unravelling the mechanisms involved in plant-growth promotion for reduced rates of available N.

Supplementary Materials

The following supporting information can be downloaded at: https://www.mdpi.com/article/10.3390/agriculture13081557/s1, Table S1: Composition of the compost used for the experiment; Table S2: Composition of the biochar used for the experiment; Table S3: Composition of the anaerobic digestate used for the experiment; Table S4: Soil analysis prior to the experiment in the microcosm trial; Table S5: ANOVA and contrasts for the dependent variables: biomass production, height, and in-plant ionomic analysis. The plot was considered a random factor. Values correspond to the F-statistic (ANOVA) and t-statistic (orthogonal contrasts), followed by the level of significance (*** p ≤ 0.001; ** 0.001 < p ≤ 0.01; * 0.01 < p ≤ 0.05. ns, not significant). df: degrees of freedom; Table S6: ANOVA carried out for the independent variables, compost dose, biochar dose, and the compost dose × biochar dose interaction, on different dependent variables measured in maize plants. Values correspond to the F-statistic, followed by the level of significance (*** p ≤ 0.001; ** 0.001 < p ≤ 0.01. ns, not significant). df: degrees of freedom; Table S7: ANOVA and contrasts for the dependant variables: biomass production, height, and in-plant ionomic analysis. The plot was considered a random factor. Values correspond to the F-statistic (ANOVA) and t-statistic (orthogonal contrasts), followed by the level of significance (*** p ≤ 0.001; ** 0.001 < p ≤ 0.01; * 0.01 < p ≤ 0.05. ns, not significant). df: degrees of freedom; Table S8: ANOVA performed for the independent variables, biochar dose, AD dose, and the biochar x AD dose interaction, on different dependent variables measured in maize plants. Values correspond to the F-statistic, followed by the level of significance (*** p ≤ 0.001; ** 0.001 < p ≤ 0.01; * 0.01 < p ≤ 0.05. ns, not significant). df: degrees of freedom; Table S9: ANOVA and contrasts for the dependent variables: pH, Electrical conductivity (EC), FDA, Carbon as CO2 (C-CO2), and Total organic carbon (TOC). The plot was considered a random factor. Values correspond to the F-statistic (ANOVA) and t-statistic (orthogonal contrasts), followed by the level of significance (*** p ≤ 0.001; ** 0.001 < p ≤ 0.01. ns, not significant). df: degrees of freedom. Table S10: ANOVA performed for the independent variables, compost dose, biochar dose, and the compost x biochar dose interaction, on different dependent variables measured in the soil. Values correspond to the F-statistic, followed by the level of significance (*** p ≤ 0.001; ** 0.001 < p ≤ 0.01; * 0.01 < p ≤ 0.05. ns, not significant). df: degrees of freedom; Table S11: ANOVA and contrasts for the dependant variables: pH, Electrical conductivity (EC), FDA, Carbon as CO2 (C-CO2) and Total organic carbon (TOC). The plot was considered a random factor. Values correspond to the F-statistic (ANOVA) and t-statistic (orthogonal contrasts), followed by the level of significance (*** p ≤ 0.001; ** 0.001 < p ≤ 0.01. ns, not significant). df: degrees of freedom. Table S12: ANOVA performed for the independent variables, biochar dose, AD dose, and the biochar dose x AD dose interaction, on different dependent variables measured in the soil. Values correspond to the F-statistic, followed by the level of significance (*** p ≤ 0.001; ** 0.001 < p ≤ 0.01; * 0.01 < p ≤ 0.05. ns, not significant). df: degrees of freedom.

Author Contributions

Conceptualisation, F.G.-A.; formal analysis, N.O.-L., A.C.-B. and F.G.-A.; investigation, N.O.-L. and I.M.-A.; writing—original draft preparation, N.O.-L.; writing—review and editing, all; supervision, F.G.-A.; funding acquisition, F.G.-A. All authors have read and agreed to the published version of the manuscript.

Funding

This research was funded by the Spanish Ministry of Economy and Competitiveness (project ‘LIGNOxBIOp’ RTC 2016-5834-5) and by the University of León, León, Spain.

Institutional Review Board Statement

Not applicable.

Data Availability Statement

All relevant data supporting the findings of this study are included in this article. Correspondence and requests for materials should be addressed to N.O.-L.

Acknowledgments

N.O.-L. was granted a fellowship from the FPU programme by the Spanish Ministry of Education (FPU 17/04201).

Conflicts of Interest

The authors certify that they have no affiliations with or involvement in any organisation or entity with any financial interest (such as honoraria; educational grants; participation in speakers’ bureaus; membership, employment, consultancies, stock ownership, or other equity interest; and expert testimony; or patent-licensing arrangements) or non-financial interest (such as personal or professional relationships, affiliations, knowledge, or beliefs) in the subject matter or materials discussed in this manuscript.

References

  1. Rombel, A.; Krasucka, P.; Oleszczuk, P. Sustainable Biochar-Based Soil Fertilizers and Amendments as a New Trend in Biochar Research. Sci. Total Environ. 2022, 816, 151588. [Google Scholar] [PubMed]
  2. Czekała, W.; Jezowska, A.; Chełkowski, D. The Use of Biochar for the Production of Organic Fertilizers. J. Ecol. Eng. 2019, 20, 1–8. [Google Scholar] [CrossRef]
  3. Hazra, G. Different Types of Eco-Friendly Fertilizers: An Overview. Sustain. Environ. 2016, 1, 54. [Google Scholar] [CrossRef] [Green Version]
  4. Igalavithana, A.D.; Ok, Y.S.; Usman, A.R.A.; Al-Wabel, M.I.; Oleszczuk, P.; Lee, S.S. The Effects of Biochar Amendment on Soil Fertility. In Agricultural and Environmental Applications of Biochar: Advances and Barriers; Wiley: Hoboken, NJ, USA, 2015; pp. 123–144. ISBN 9780891189671. [Google Scholar]
  5. Backer, R.; Rokem, J.S.; Ilangumaran, G.; Lamont, J.; Praslickova, D.; Ricci, E.; Subramanian, S.; Smith, D.L. Plant Growth-Promoting Rhizobacteria: Context, Mechanisms of Action, and Roadmap to Commercialization of Biostimulants for Sustainable Agriculture. Front. Plant Sci. 2018, 9, 1473. [Google Scholar] [CrossRef] [Green Version]
  6. Wezel, A.; Goris, M.; Bruil, J.; Félix, G.F.; Peeters, A.; Bàrberi, P.; Bellon, S.; Migliorini, P. Challenges and Action Points to Amplify Agroecology in Europe. Sustainability 2018, 10, 1598. [Google Scholar] [CrossRef] [Green Version]
  7. De Corato, U. Towards New Soil Management Strategies for Improving Soil Quality and Ecosystem Services in Sustainable Agriculture: Editorial Overview. Sustainability 2020, 12, 9398. [Google Scholar] [CrossRef]
  8. Arif, M.S.; Shahzad, S.M.; Riaz, M.; Yasmeen, T.; Shahzad, T.; Akhtar, M.J.; Bragazza, L.; Buttler, A. Nitrogen-Enriched Compost Application Combined with Plant Growth-Promoting Rhizobacteria (PGPR) Improves Seed Quality and Nutrient Use Efficiency of Sunflower. Z. Pflanzenernahr. Bodenkd. 2017, 180, 464–473. [Google Scholar] [CrossRef]
  9. Liu, D.; Ding, Z.; Ali, E.F.; Kheir, A.M.S.; Eissa, M.A.; Ibrahim, O.H.M. Biochar and Compost Enhance Soil Quality and Growth of Roselle (Hibiscus sabdariffa L.) under Saline Conditions. Sci. Rep. 2021, 11, 8739. [Google Scholar] [CrossRef]
  10. Siedt, M.; Schäffer, A.; Smith, K.E.C.; Nabel, M.; Roß-Nickoll, M.; van Dongen, J.T. Comparing Straw, Compost, and Biochar Regarding Their Suitability as Agricultural Soil Amendments to Affect Soil Structure, Nutrient Leaching, Microbial Communities, and the Fate of Pesticides. Sci. Total Environ. 2021, 751, 141607. [Google Scholar] [CrossRef]
  11. Song, S.; Lim, J.W.; Lee, J.T.E.; Cheong, J.C.; Hoy, S.H.; Hu, Q.; Tan, J.K.N.; Chiam, Z.; Arora, S.; Lum, T.Q.H.; et al. Food-Waste Anaerobic Digestate as a Fertilizer: The Agronomic Properties of Untreated Digestate and Biochar-Filtered Digestate Residue. Waste Manag. 2021, 136, 143–152. [Google Scholar] [CrossRef]
  12. Smith, P. Soil Carbon Sequestration and Biochar as Negative Emission Technologies. Glob. Chang. Biol. 2016, 22, 1315–1324. [Google Scholar] [CrossRef] [PubMed]
  13. Kapoor, A.; Sharma, R.; Kumar, A.; Sepehya, S. Biochar as a Means to Improve Soil Fertility and Crop Productivity: A Review. J. Plant Nutr. 2022, 45, 2380–2388. [Google Scholar] [CrossRef]
  14. Rosas, J.G.; Gómez, N.; Cara, J.; Ubalde, J.; Sort, X.; Sánchez, M.E. Assessment of Sustainable Biochar Production for Carbon Abatement from Vineyard Residues. J. Anal. Appl. Pyrolysis 2015, 113, 239–247. [Google Scholar] [CrossRef]
  15. Gonzalez-Gil, G.; Kleerebezem, R.; Lettinga, G. Effects of Nickel and Cobalt on Kinetics of Methanol Conversion by Methanogenic Sludge as Assessed by On-Line CH4 Monitoring. Appl. Environ. Microbiol. 1999, 65, 1789–1793. [Google Scholar] [CrossRef]
  16. Zucconi, F.; Pera, A.; Forte, M.; DeBertolli, M. Evaluating Toxicity of Immature Compost. Biocycle 1981, 22, 54–57. [Google Scholar]
  17. Varnero, M.T.; Orellana, R.; Rojas, C.; Santibáñez, C.; Gallardo Lancho, J.F. Evaluación de Especies Sensibles a Metabolitos Fitotóxicos Mediante Bioensayos de Germinación. In Medioambiente en Iberoamérica. Visión Desde la Física y la Química en los Albores del Siglo XXI; Gallardo-Lancho, J.F., Ed.; Diputación provincial de Cáceres: Cáceres, Spain, 2006; Volume III, pp. 363–369. [Google Scholar]
  18. Mulas-García, D. Caracterización y Selección de Rizobios Que Nodulan Alubia (Phaseolus vulgaris L.) En La IGP “Alubia de La Bañeza-León”. Ph.D. Thesis, University of León, León, Spain, 2010. [Google Scholar]
  19. Anderson, J.P.E. Soil Respiration. In Methods of Soil Analysis, Part 2. Chemical and Microbiological Properties, Agronomy Monograph; Page, A.L., Miller, R.H., Keeney, D.R., Eds.; American Society of Agronomy: Madison, WI, USA, 1982; Volume 9, pp. 831–871. [Google Scholar]
  20. Alef, K. Soil Respiration. In Methods in Applied Soil Microbiology and Biochemistry; Kassen, A., Nannipieri, P., Eds.; Academic Press: London, UK, 1995; pp. 214–219. [Google Scholar]
  21. Ryan, J.; Estefan, G.; Rashid, A. Soil and Plant Analysis Laboratory Manual, 2nd ed.; International Center for Agricultural Research in the Dry Areas (ICARDA) and the National Agricultural Research Center (NARC): Aleppo, Syria, 2001. [Google Scholar]
  22. Green, V.S.; Stott, D.E.; Diack, M. Assay for Fluorescein Diacetate Hydrolytic Activity: Optimization for Soil Samples. Soil Biol. Biochem. 2006, 38, 693–701. [Google Scholar] [CrossRef]
  23. Gulyás, M.; Someus, E.; Klátyik, S.; Fuchs, M.; István Varga, Z.; Dér, S.; Fekete, G.; Czinkota, I.; Székács, A.; Gyuricza, C.; et al. Effects of Combined Application of Solid Pyrolysis Products and Digestate on Selected Soil Properties of Arenoso! And Plant Growth and Composition in Laboratory Experiments. Agronomy 2022, 12, 1440. [Google Scholar] [CrossRef]
  24. Crespo-Barreiro, A.; Gómez, N.; González-Arias, J.; Ortiz-Liébana, N.; González-Andrés, F.; Cara-Jiménez, J. Scaling-Up of the Production of Biochar from Olive Tree Pruning for Agricultural Use: Evaluation of Biochar Characteristics and Phytotoxicity. Agriculture 2023, 13, 1064. [Google Scholar] [CrossRef]
  25. Kataki, S.; Hazarika, S.; Baruah, D.C. Investigation on By-Products of Bioenergy Systems (Anaerobic Digestion and Gasification) as Potential Crop Nutrient Using FTIR, XRD, SEM Analysis and Phyto-Toxicity Test. J. Environ. Manag. 2017, 196, 201–216. [Google Scholar] [CrossRef]
  26. Mclachlan, K.L.; Chong, C.; Voroney, R.P.; Liu, H.W.; Holbein, B.E.; Canada, C. Assessing the Potential Phytotoxicity of Digestates during Processing of Municipal Solid Waste by Anaerobic Digestion: Comparison to Aerobic Composts. In XXVI International Horticultural Congress: Sustainability of Horticultural Systems in the 21st Century 638; ISHS Acta Horticulturae: Leuven, Belgium, 2004; pp. 225–230. [Google Scholar] [CrossRef]
  27. Stefaniuk, M.; Bartmiński, P.; Rózyło, K.; Debicki, R.; Oleszczuk, P. Ecotoxicological Assessment of Residues from Different Biogas Production Plants Used as Fertilizer for Soil. J. Hazard. Mater. 2015, 298, 195–202. [Google Scholar] [CrossRef]
  28. Tam, N.F.Y.; Tiquia, S. Assessing Toxicity of Spent Pig Litter Using a Seed Germination Technique. Resour. Conserv. Recycl. 1994, 11, 261–274. [Google Scholar] [CrossRef]
  29. Alburquerque, J.A.; de la Fuente, C.; Ferrer-Costa, A.; Carrasco, L.; Cegarra, J.; Abad, M.; Bernal, M.P. Assessment of the Fertiliser Potential of Digestates from Farm and Agroindustrial Residues. Biomass Bioenergy 2012, 40, 181–189. [Google Scholar] [CrossRef]
  30. Pivato, A.; Vanin, S.; Raga, R.; Lavagnolo, M.C.; Barausse, A.; Rieple, A.; Laurent, A.; Cossu, R. Use of Digestate from a Decentralized On-Farm Biogas Plant as Fertilizer in Soils: An Ecotoxicological Study for Future Indicators in Risk and Life Cycle Assessment. Waste Manag. 2016, 49, 378–389. [Google Scholar] [CrossRef] [PubMed] [Green Version]
  31. Pastor-Bueis, R.; Mulas, R.; Gómez, X.; González-Andrés, F. Innovative Liquid Formulation of Digestates for Producing a Biofertilizer Based on Bacillus Siamensis: Field Testing on Sweet Pepper. J. Plant Nutr. Soil Sci. 2017, 180, 748–758. [Google Scholar] [CrossRef]
  32. Luo, X.; Liu, G.; Xia, Y.; Chen, L.; Jiang, Z.; Zheng, H.; Wang, Z. Use of Biochar-Compost to Improve Properties and Productivity of the Degraded Coastal Soil in the Yellow River Delta, China. J. Soils Sediments 2016, 17, 780–789. [Google Scholar] [CrossRef]
  33. Liao, H.; Zheng, C.; Long, J.; Guzmán, I. Effects of Biochar Amendment on Tomato Rhizosphere Bacterial Communities and Their Utilization of Plant-Derived Carbon in a Calcareous Soil. Geoderma 2021, 396, 115082. [Google Scholar] [CrossRef]
  34. Zheng, H.; Wang, X.; Chen, L.; Wang, Z.; Xia, Y.; Zhang, Y.; Wang, H.; Luo, X.; Xing, B. Enhanced Growth of Halophyte Plants in Biochar-Amended Coastal Soil: Roles of Nutrient Availability and Rhizosphere Microbial Modulation. Plant Cell Environ. 2018, 41, 517–532. [Google Scholar] [CrossRef]
  35. Calamai, A.; Palchetti, E.; Masoni, A.; Marini, L.; Chiaramonti, D.; Dibari, C.; Brilli, L. The Influence of Biochar and Solid Digestate on Rose-Scented Geranium (Pelargonium graveolens L’Hér.) Productivity and Essential Oil Quality. Agronomy 2019, 9, 260. [Google Scholar] [CrossRef] [Green Version]
  36. Qiao, Y.; Zhang, S.; Quan, C.; Gao, N.; Johnston, C.; Wu, C. One-Pot Synthesis of Digestate-Derived Biochar for Carbon Dioxide Capture. Fuel 2020, 279, 118525. [Google Scholar] [CrossRef]
  37. Mickan, B.S.; Ren, A.T.; Buhlmann, C.H.; Ghadouani, A.; Solaiman, Z.M.; Jenkins, S.; Pang, J.; Ryan, M.H. Closing the Circle for Urban Food Waste Anaerobic Digestion: The Use of Digestate and Biochar on Plant Growth in Potting Soil. J. Clean. Prod. 2022, 347, 131071. [Google Scholar] [CrossRef]
  38. Liang, B.; Lehmann, J.; Solomon, D.; Kinyangi, J.; Grossman, J.; O’Neill, B.; Skjemstad, J.O.; Thies, J.; Luizão, F.J.; Petersen, J.; et al. Black Carbon Increases Cation Exchange Capacity in Soils. Soil Sci. Soc. Am. J. 2006, 70, 1719–1730. [Google Scholar] [CrossRef] [Green Version]
  39. Singh, B.P.; Hatton, B.J.; Singh, B.; Cowie, A.L.; Kathuria, A. Influence of Biochars on Nitrous Oxide Emission and Nitrogen Leaching from Two Contrasting Soils. J. Environ. Qual. 2010, 39, 1224–1235. [Google Scholar] [CrossRef] [PubMed]
  40. Mizuta, K.; Matsumoto, T.; Hatate, Y.; Nishihara, K.; Nakanishi, T. Removal of Nitrate-Nitrogen from Drinking Water Using Bamboo Powder Charcoal. Bioresour. Technol. 2004, 95, 255–257. [Google Scholar] [CrossRef] [PubMed]
  41. Hu, X.; Zhang, X.; Ngo, H.H.; Guo, W.; Wen, H.; Li, C.; Zhang, Y.; Ma, C. Comparison Study on the Ammonium Adsorption of the Biochars Derived from Different Kinds of Fruit Peel. Sci. Total Environ. 2020, 707, 135544. [Google Scholar] [CrossRef]
  42. Borchard, N.; Schirrmann, M.; Cayuela, M.L.; Kammann, C.; Wrage-Mönnig, N.; Estavillo, J.M.; Fuertes-Mendizábal, T.; Sigua, G.; Spokas, K.; Ippolito, J.A.; et al. Biochar, Soil and Land-Use Interactions That Reduce Nitrate Leaching and N2O Emissions: A Meta-Analysis. Sci. Total Environ. 2019, 651, 2354–2364. [Google Scholar] [CrossRef]
  43. Taghizadeh-Toosi, A.; Clough, T.J.; Sherlock, R.R.; Condron, L.M. A Wood Based Low-Temperature Biochar Captures NH 3-N Generated from Ruminant Urine-N, Retaining Its Bioavailability. Plant Soil 2012, 353, 73–84. [Google Scholar] [CrossRef]
  44. Paramashivam, D.; Clough, T.J.; Dickinson, N.M.; Horswell, J.; Lense, O.; Clucas, L.; Robinson, B.H. Effect of Pine Waste and Pine Biochar on Nitrogen Mobility in Biosolids. J. Environ. Qual. 2016, 45, 360–367. [Google Scholar] [CrossRef] [Green Version]
  45. Ghassemi-Golezani, K.; Farhangi-Abriz, S. Solid and Modified Biochars Mitigate Root Cell Lignification and Improve Nutrients Uptake in Mint Plants under Fluoride and Cadmium Stresses. Plant Physiol. Biochem. 2023, 200, 107757. [Google Scholar] [CrossRef] [PubMed]
  46. Nadeem Shah, M.; Wright, D.L.; Hussain, S.; Koutroubas, S.D.; Seepaul, R.; George, S.; Ali, S.; Naveed, M.; Khan, M.; Tanveer Altaf, M.; et al. Organic Fertilizer Sources Improve the Yield and Quality Attributes of Maize (Zea mays L.) Hybrids by Improving Soil Properties and Nutrient Uptake under Drought Stress. J. King Saud Univ.-Sci. 2023, 35, 102570. [Google Scholar] [CrossRef]
  47. Viger, M.; Hancock, R.D.; Miglietta, F.; Taylor, G. More Plant Growth but Less Plant Defence? First Global Gene Expression Data for Plants Grown in Soil Amended with Biochar. GCB Bioenergy 2015, 7, 658–672. [Google Scholar] [CrossRef]
  48. Verheijen, F.; Jeffery, S.L.; Bastos, A.C.; van der Velde, M.; Diafas, L. Biochar Application to Soils—A Critical Scientific Review of Effects on Soil Properties, Processes and Functions. Eur. Comm. 2010, 24099, 2183–2207. [Google Scholar] [CrossRef]
  49. Galvez, A.; Sinicco, T.; Cayuela, M.L.; Mingorance, M.D.; Fornasier, F.; Mondini, C. Short Term Effects of Bioenergy By-Products on Soil C and N Dynamics, Nutrient Availability and Biochemical Properties. Agric. Ecosyst. Environ. 2012, 160, 3–14. [Google Scholar] [CrossRef]
  50. Jones, D.L.; Rousk, J.; Edwards-Jones, G.; DeLuca, T.H.; Murphy, D.V. Biochar-Mediated Changes in Soil Quality and Plant Growth in a Three Year Field Trial. Soil Biol. Biochem. 2012, 45, 113–124. [Google Scholar] [CrossRef]
  51. Gul, S.; Whalen, J.K.; Thomas, B.W.; Sachdeva, V.; Deng, H. Physico-Chemical Properties and Microbial Responses in Biochar-Amended Soils: Mechanisms and Future Directions. Agric. Ecosyst. Environ. 2015, 206, 46–59. [Google Scholar] [CrossRef]
  52. Ozdemir, S.; Nuhoglu, N.N.; Dede, O.H.; Yetilmezsoy, K. Mitigation of Soil Loss from Turfgrass Cultivation by Utilizing Poultry Abattoir Sludge Compost and Biochar on Low-Organic Matter Soil. Environ. Technol. 2020, 41, 466–477. [Google Scholar] [CrossRef]
  53. Mahmoud, E.; Ibrahim, M.; Ali, N.; Ali, H. Effect of Biochar and Compost Amendments on Soil Biochemical Properties and Dry Weight of Canola Plant Grown in Soil Contaminated with Heavy Metals. Commun. Soil Sci. Plant Anal. 2020, 51, 1561–1571. [Google Scholar] [CrossRef]
  54. Liu, J.; Schulz, H.; Brandl, S.; Miehtke, H.; Huwe, B.; Glaser, B. Short-Term Effect of Biochar and Compost on Soil Fertility and Water Status of a Dystric Cambisol in NE Germany under Field Conditions. J. Plant Nutr. Soil Sci. 2012, 175, 698–707. [Google Scholar] [CrossRef]
  55. Mahmoud, E.; Ibrahim, M.; Ali, N.; Ali, H. Spectroscopic Analyses to Study the Effect of Biochar and Compost on Dry Mass of Canola and Heavy Metal Immobilization in Soil. Commun. Soil Sci. Plant Anal. 2018, 49, 1990–2001. [Google Scholar] [CrossRef]
  56. Ding, Z.; Zhou, Z.; Lin, X.; Zhao, F.; Wang, B.; Lin, F.; Ge, Y.; Eissa, M.A. Biochar Impacts on NH3-Volatilization Kinetics and Growth of Sweet Basil (Ocimum basilicum L.) under Saline Conditions. Ind. Crops Prod. 2020, 157, 112903. [Google Scholar] [CrossRef]
  57. Hosam, B.H. Soil Biological Parameters Inluenced by Various Nitrogen Sources. In Proceedings of the CTEP 2019—International Council on Technologies of Environmental Protection (ICTEP), Stary Smokovec, Slovakia, 23–25 October 2019; pp. 121–127. [Google Scholar]
  58. Rekaby, S.A.; Awad, M.Y.; Hegab, S.A.; Eissa, M.A. Effect of Some Organic Amendments on Barley Plants under Saline Condition. J. Plant Nutr. 2020, 12, 1840–1851. [Google Scholar] [CrossRef]
  59. Abujabhah, I.S.; Bound, S.A.; Doyle, R.; Bowman, J.P. Effects of Biochar and Compost Amendments on Soil Physico-Chemical Properties and the Total Community within a Temperate Agricultural Soil. Appl. Soil Ecol. 2016, 98, 243–253. [Google Scholar] [CrossRef]
  60. Hammerschmiedt, T.; Holatko, J.; Sudoma, M.; Kintl, A.; Vopravil, J.; Ryant, P.; Skarpa, P.; Radziemska, M.; Latal, O.; Brtnicky, M. Biochar and Sulphur Enriched Digestate: Utilization of Agriculture Associated Waste Products for Improved Soil Carbon and Nitrogen Content, Microbial Activity, and Plant Growth. Agronomy 2021, 11, 2041. [Google Scholar] [CrossRef]
  61. Jílková, V.; Angst, G. Biochar and Compost Amendments to a Coarse-Textured Temperate Agricultural Soil Lead to Nutrient Leaching. Appl. Soil Ecol. 2022, 173, 104393. [Google Scholar] [CrossRef]
  62. Al-Wabel, M.I.; Hussain, Q.; Usman, A.R.A.; Ahmad, M.; Abduljabbar, A.; Sallam, A.S.; Ok, Y.S. Impact of Biochar Properties on Soil Conditions and Agricultural Sustainability: A Review. Land Degrad. Dev. 2018, 29, 2124–2161. [Google Scholar] [CrossRef]
  63. Nobile, C.; Lebrun, M.; Védère, C.; Honvault, N.; Aubertin, M.L.; Faucon, M.P.; Girardin, C.; Houot, S.; Kervroëdan, L.; Dulaurent, A.M.; et al. Biochar and Compost Addition Increases Soil Organic Carbon Content and Substitutes P and K Fertilizer in Three French Cropping Systems. Agron. Sustain. Dev. 2022, 42, 119. [Google Scholar] [CrossRef]
  64. Aseri, G.K.; Jain, N.; Panwar, J.; Rao, A.V.; Meghwal, P.R. Biofertilizers Improve Plant Growth, Fruit Yield, Nutrition, Metabolism and Rhizosphere Enzyme Activities of Pomegranate (Punica granatum L.) in Indian Thar Desert. Sci. Hortic. 2008, 117, 130–135. [Google Scholar] [CrossRef]
  65. Patani, A.; Prajapati, D.; Ali, D.; Kalasariya, H.; Yadav, V.K.; Tank, J.; Bagatharia, S.; Joshi, M.; Patel, A. Evaluation of the Growth-Inducing Efficacy of Various Bacillus Species on the Salt-Stressed Tomato (Lycopersicon esculentum Mill.). Front. Plant Sci. 2023, 14, 1168155. [Google Scholar] [CrossRef]
  66. Volkogon, V.V.; Potapenko, L.V.; Volkogon, M.V. Vertical Migration of Nutrients and Water-Soluble Organic Matter in the Soil Profile under Pre-Sowing Seed Treatment with Plant Growth Promoting Rhizobacteria. Front. Sustain. Food Syst. 2023, 6, 1054113. [Google Scholar] [CrossRef]
Figure 1. Mean values of each treatment for plant dependent variables: fresh aerial biomass (A), dry aerial biomass (B), and height (C). The treatment compost encompasses the treatments compost 2 and compost 5; the treatment compost + B encompasses the treatments compost 2 + biochar 3, compost 2 + biochar 6, compost 5 + biochar 3, and compost 5 + biochar 6. Comparison with the control was performed using orthogonal contrasts (see Table S5) (significance level: *** p ≤ 0.001. ns, not significant).
Agriculture 13 01557 g001
Figure 2. Mean values of each treatment for the nutrient content in the plant tissue: nitrogen (A), phosphorus (B), potassium (C), calcium (D), and magnesium (E). The treatment compost encompasses the treatments compost 2 and compost 5; the treatment compost + B encompasses the treatments compost 2 + biochar 3, compost 2 + biochar 6, compost 5 + biochar 3, and compost 5 + biochar 6. Comparison with the control was performed using orthogonal contrasts (see Table S5) (significance level: *** p ≤ 0.001; * 0.01 < p ≤ 0.05. ns, not significant).
Agriculture 13 01557 g002
Figure 3. Mean values of each treatment for the nutrient content in the plant tissue: fresh aerial biomass (A), dry aerial biomass (B), and height (C). The treatment biochar encompasses the treatments biochar 250 and biochar 500; the treatment biochar + B encompasses the treatments biochar 250 + AD5, biochar 250 + AD10, biochar 500 + AD5, and biochar 500 + AD10. Comparison against control was performed with orthogonal contrasts (see Table S7) (significance level: ** 0.001 < p ≤ 0.01; * 0.01 < p ≤ 0.05. ns, not significant).
Agriculture 13 01557 g003
Figure 4. Mean values of each treatment for the nutrient content in the plant tissue: nitrogen (A), phosphorus (B), potassium (C), calcium (D), and magnesium (E). The treatment biochar encompasses the treatments biochar 250 and biochar 500; the treatment biochar + B encompasses the treatments biochar 250 + AD5, biochar 250 + AD10, biochar 500 + AD5, and biochar 500 + AD10. Comparison with the control was performed using orthogonal contrasts (see Table S7) (significance level: *** p ≤ 0.001; ** 0.001 < p ≤ 0.01; * 0.01 < p ≤ 0.05. ns, not significant).
Agriculture 13 01557 g004
Figure 5. Mean values of each treatment for the following soil parameters: pH (A), EC (B), FDA (C), C-CO2 (D), and TOC (E). The treatment compost encompasses the treatments compost 2 and compost 5; the treatment compost + B encompasses the treatments compost 2 + biochar 3, compost 2 + biochar 6, compost 5 + biochar 3, and compost 5 + biochar 6. Comparison with the control was performed using orthogonal contrasts (see Table S9) (significance level: *** p ≤ 0.001; ** 0.001 < p ≤ 0.01.).
Agriculture 13 01557 g005
Figure 6. Mean values of each treatment for the soil parameters: pH (A), EC (B), FDA (C), C-CO2 (D), and TOC (E). The treatment biochar encompasses the treatments biochar 250 and biochar 500; the treatment biochar + AD encompasses the treatments biochar 250 + AD5, biochar 250 + AD10, biochar 500 + AD5, and biochar 500 + AD10. Comparison with the control was performed using orthogonal contrasts (see Table S11) (significance level: *** p ≤ 0.001; * 0.01 < p ≤ 0.05. ns, not significant).
Agriculture 13 01557 g006
Table 1. Designed fertilisers, treatments, and doses used in the microcosm trial with maize and nutrients provided with the treatment.
Product FamilyTreatment/
Fertilising Product
Treatment CodeDose (kg ha−1) of the Fertilising ProductCorresponding Percentage of Biochar in the Final Product (w:w) or AD in the Final Product (v:w)N-P-K-Ca-Mg Provided by the Fertiliser
(Expressed in kg ha−1)
Compost + biocharCompost 2Compost 2000042-9-41-152-12
Compost 5Compost 50000104-23-103-381-30
Compost 2 + biochar 3Compost + B32000342-10-42-154-12
Compost 2 + biochar 6Compost + B62000643-10-43-155-13
Compost 5 + biochar 3Compost + B350003106-24-106-384-31
Compost 5 + biochar 6Compost + B650006107-24-109-387-32
Biochar + ADBiochar 250Biochar 25025002.6-0.6-4.7-5.2-1.2
Biochar 500Biochar 50050005.1-1.2-9.3-10.5-2.5
Biochar 250 + AD 1Biochar + AD125012.9-0.8-4.9-5.3-1.3
Biochar 250 + AD 5Biochar + AD525054.1-1.5-5.9-5.7-1.5
Biochar 250 + AD 10Biochar + AD10250105.6-2.3-7.2-6.2-1.8
Biochar 500 + AD 1Biochar + AD150015.7-1.6-9.8-10.7-2.6
Biochar 500 + AD 5Biochar + AD550058.2-2.9-11.9-11.4-3.1
Biochar 500 + AD 10Biochar + AD105001011.3-4.7-14.4-12.4-3.6
Table 2. Germination index (GI) (%) according to Zucconi et al. (1981) [16] used to estimate the phytotoxicity of the indicated products in the plants used. A GI below 50% corresponds to highly phytotoxic materials, between 50% and 80% corresponds to moderately phytotoxic materials, and above 80% corresponds to non-phytotoxic materials.
PlantCompost + B3Compost + B6Biochar + AD5Biochar + AD10
1:51:101:251:51:101:251:51:101:251:51:101:25
Lettuce2610247917733098571321566154
Tomato1076442967296052114763161
Cress2911050329953438711421084174
Radish441155413810446413821782089288
Table 3. Mean values for the dependent variables measured in maize plants. Means followed by the same letter did not differ significantly at p ≤ 0.05 in Tukey’s test.
Compost Dose (t ha−1)Biochar Dose
(%)
Fresh Aerial Biomass (mg)Dry Aerial
Biomass (mg)
Height
(cm)
N
(%)
P
(mg kg−1)
K
(mg kg−1)
Ca
(mg kg−1)
Mg
(mg kg−1)
202585 a322.4 a28.36 a2.75 b1413 a12,969 a8921 a2961 a
32982 b351.4 ab28.52 a2.15 a1465 ab14,082 b9571 b3204 a
63092 b381.8 b28.83 a1.90 a1527 b14,573 b9858 b3423 a
503079 a373.9 a28.87 a2.71 b1503 a15,707 a11,247 a3091 a
33113 a387.5 a29.19 a2.09 a1645 ab16,385 a12,225 b3216 a
63285 a401.5 a29.55 a1.84 a1752 b16,906 a13,019 c3279 a
Table 4. Mean values for the dependent variables measured in maize plants. Means followed by the same letter did not differ significantly at p ≤ 0.05 in Tukey’s test.
Biochar Dose (kg ha−1)AD Dose
(%)
Fresh Aerial Biomass (mg)Dry Aerial
Biomass (mg)
Height
(cm)
N
(%)
P
(mg kg−1)
K
(mg kg−1)
Ca
(mg kg−1)
Mg
(mg kg−1)
25001738 a266.5 a26.23 a2.29 a1393 a11,167 a5725 a2420 a
11907 a282.5 a26.39 a2.43 ab1468 ab12,047 ab5688 a2500 a
51916 a297.9 a26.41 a2.47 ab1502 ab12,120 ab5628 a2471 a
101964 a298.5 a26.55 a2.52 b1587 b13,770 b5619 a2440 a
50001791 a275.3 a25.10 a1.90 a1400 a11,478 a5231 b2370 a
11897 a294.4 ab25.46 a1.88 a1498 a12,057 a4971 ab2358 a
52000 ab320.2 bc25.90 a1.93 a1550 a12,903 b4484 ab2399 a
102246 b335.7 c25.95 a1.99 a1663 a16,041 c3758 a2447 a
Table 5. Mean values for the dependent variables measured in the soil. Means followed by the same letter did not differ significantly at p ≤ 0.05 in Tukey’s test.
Compost Dose
(t ha−1)
Biochar Dose
(%)
pHEC
(dS·m−1)
FDA
(mg·kg−1·3 h−1)
C-CO2
(mg·m−2 soil·day−1)
TOC
(%)
206.46 a0.168 a143.8 a411.5 a4.74 b
36.63 a0.168 a179.4 a457.2 ab4.61 b
66.76 a0.191 a235.9 b466.4 b4.10 a
506.51 a0.218 a190.7 a448.1 a4.65 b
36.70 a0.218 a217.6 b512.1 b3.90 ab
66.79 a0.228 a269.2 c548.7 b3.68 a
Table 6. Mean values for the dependent variables measured in the soil. Means followed by the same letter did not differ significantly at p ≤ 0.05 in Tukey’s test.
Biochar Dose
(kg ha−1)
AD Dose
(%)
pHEC
(dS∙m−1)
FDA
(mg∙kg−1∙3 h−1)
C-CO2
(mg∙m−2 soil∙day−1)
TOC
(%)
25006.55 a0.122 a106.5 a246.9 a3.18 a
16.63 a0.143 b117.5 a301.8 b3.23 b
56.75 ab0.164 c158.4 b374.9 c3.21 ab
106.90 b0.173 c172.3 c438.9 d3.18 a
50007.57 a0.117 a119.3 a274.3 a3.22 a
17.68 ab0.155 b124.9 a329.2 a3.25 a
57.82 bc0.166 b194.6 b429.8 b3.27 a
107.97 c0.182 c208.6 c457.2 b3.30 b
Disclaimer/Publisher’s Note: The statements, opinions and data contained in all publications are solely those of the individual author(s) and contributor(s) and not of MDPI and/or the editor(s). MDPI and/or the editor(s) disclaim responsibility for any injury to people or property resulting from any ideas, methods, instructions or products referred to in the content.