
Working Load Analysis of a 42 kW Class Agricultural Tractor According to Tillage Type and Gear Selection during Rotary Tillage Operation


 , ,
, ,
Abstract
1. Introduction
2. Materials and Methods
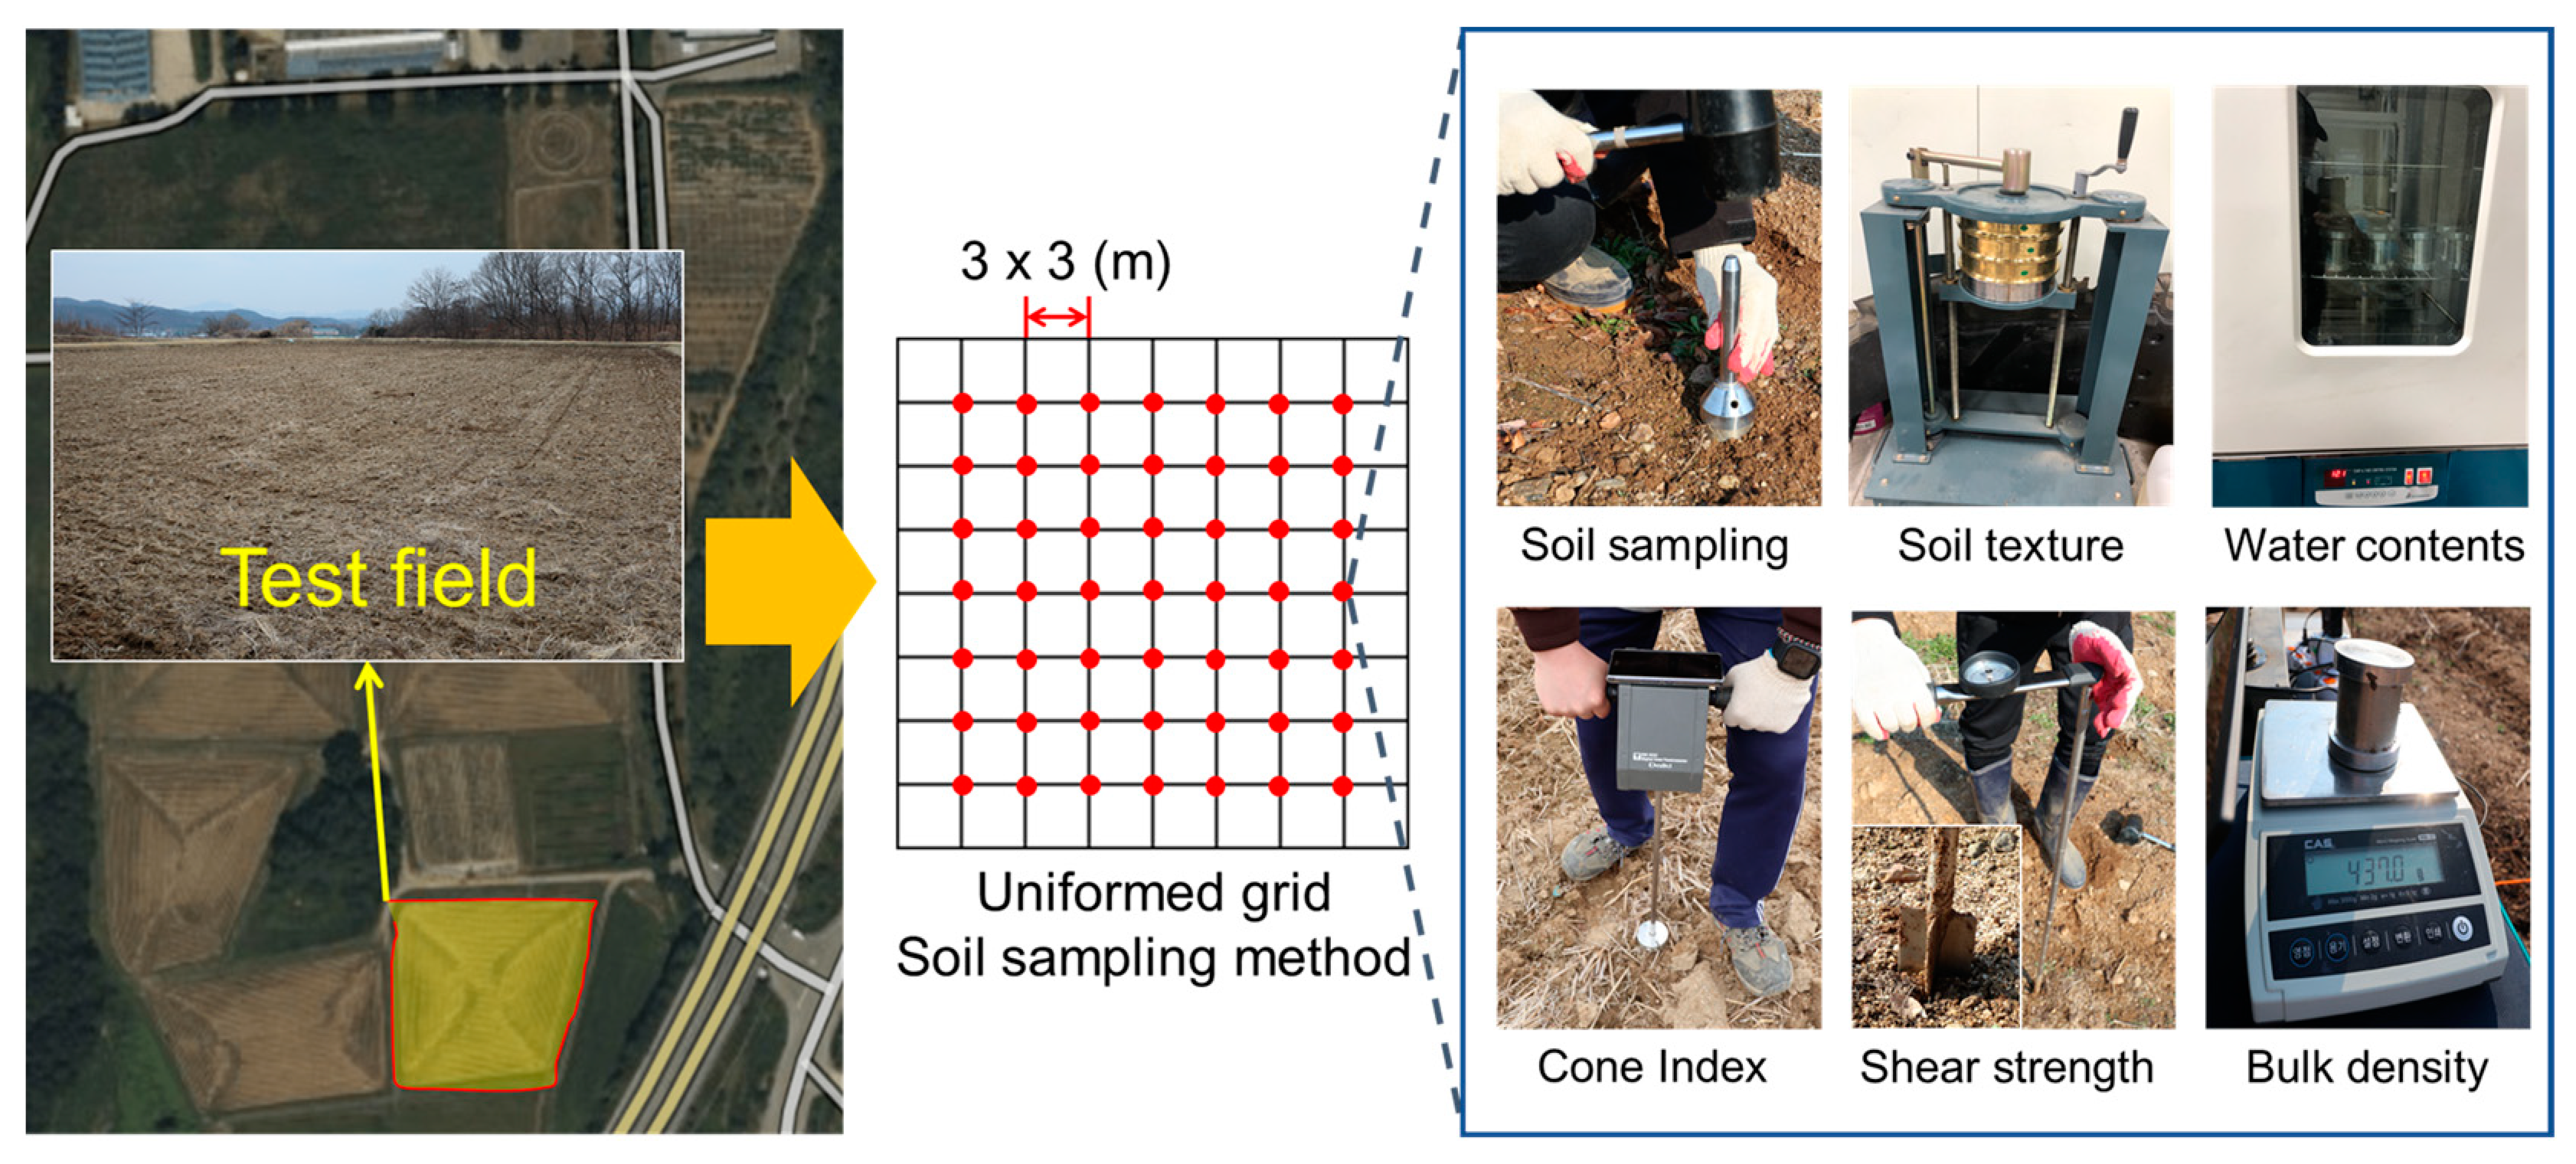
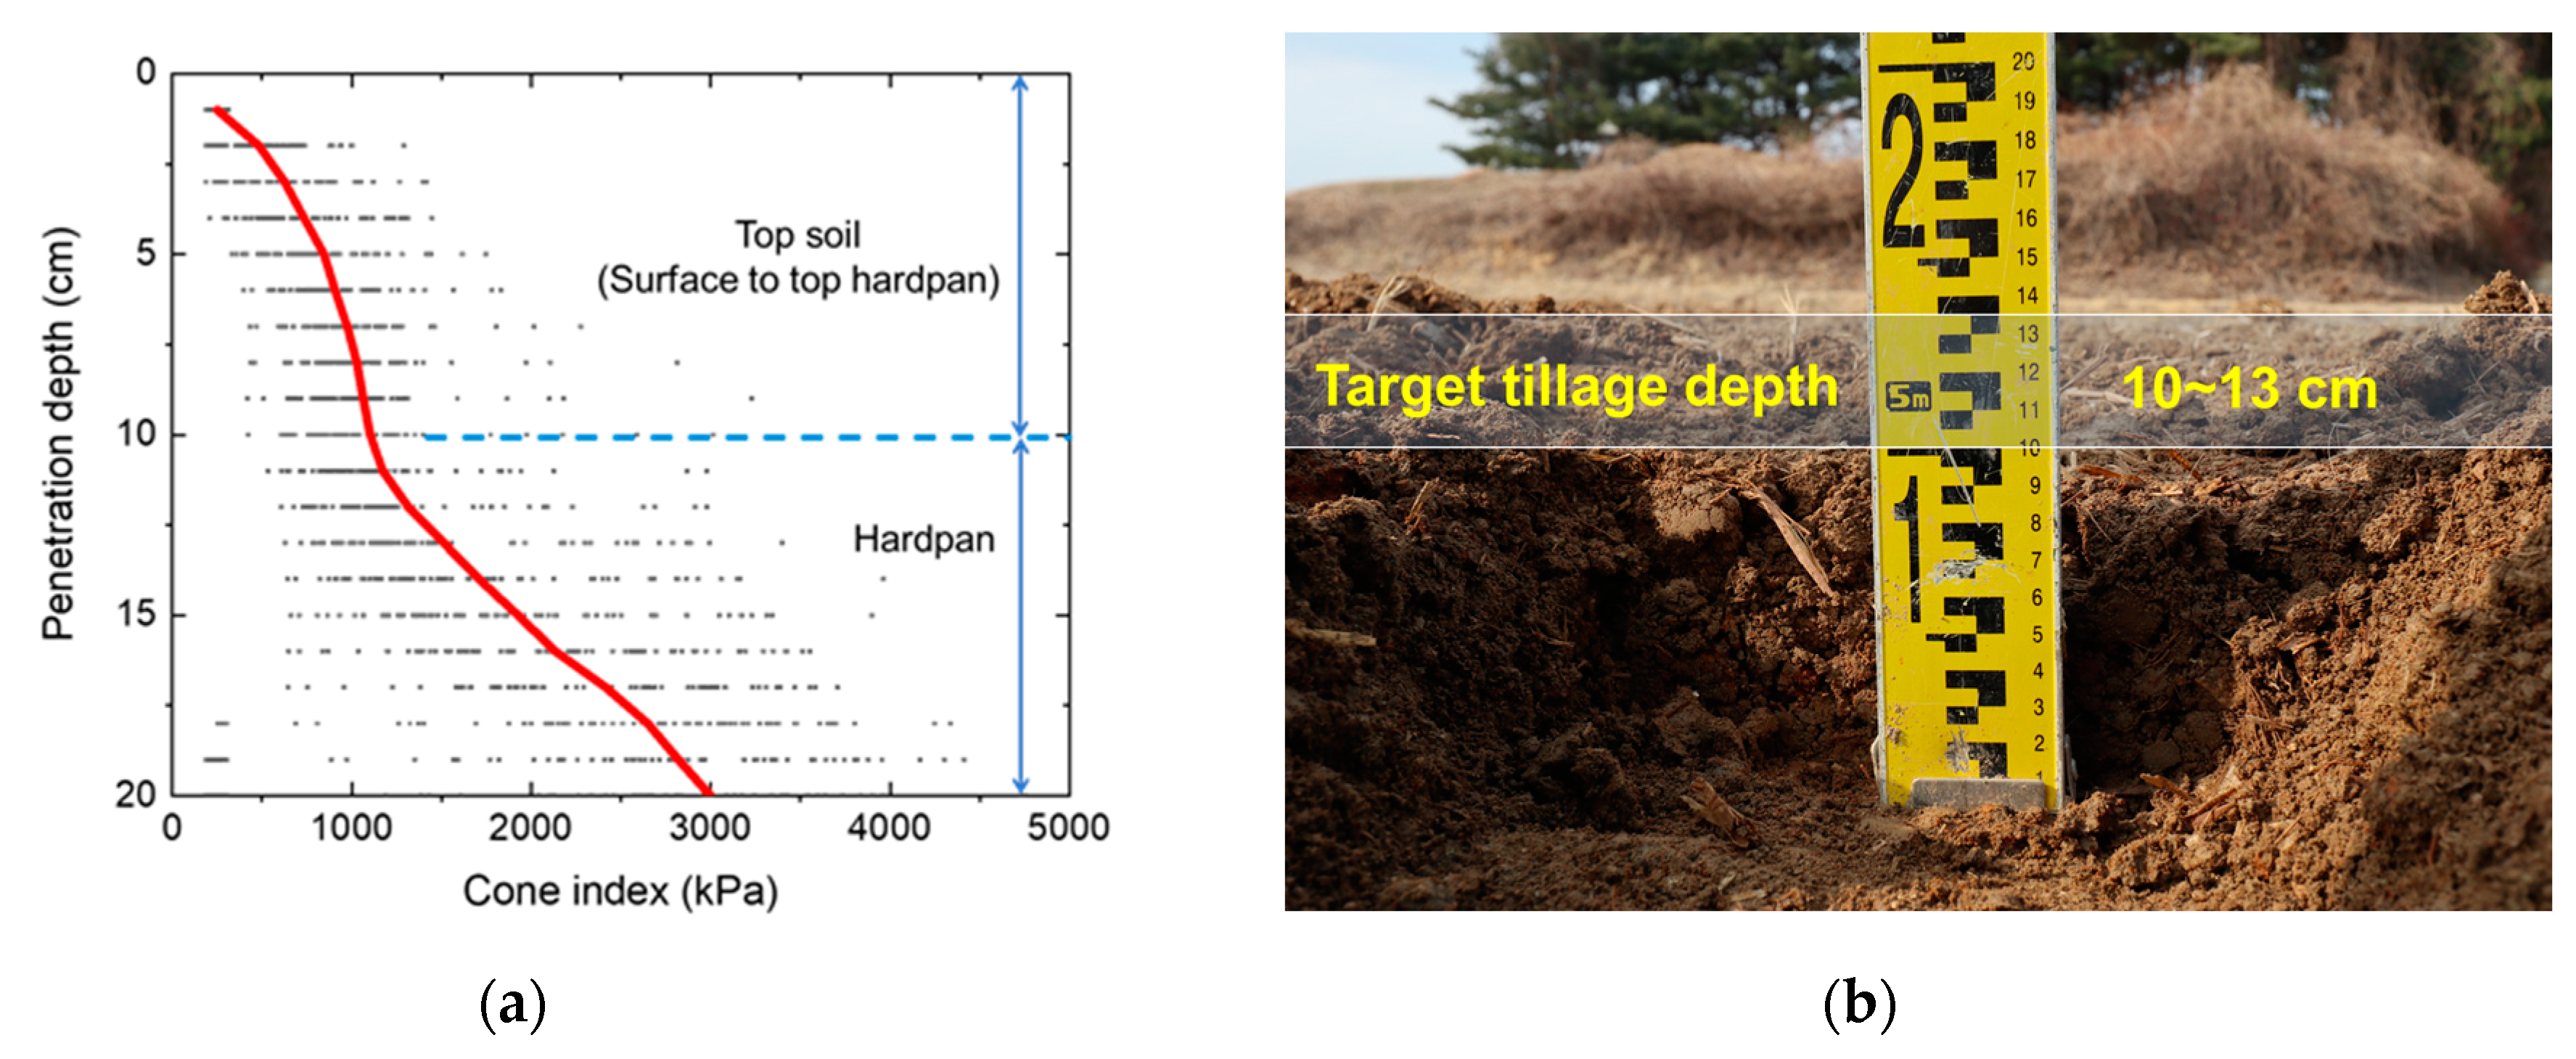
2.1. Measurement of Field Soil Properties
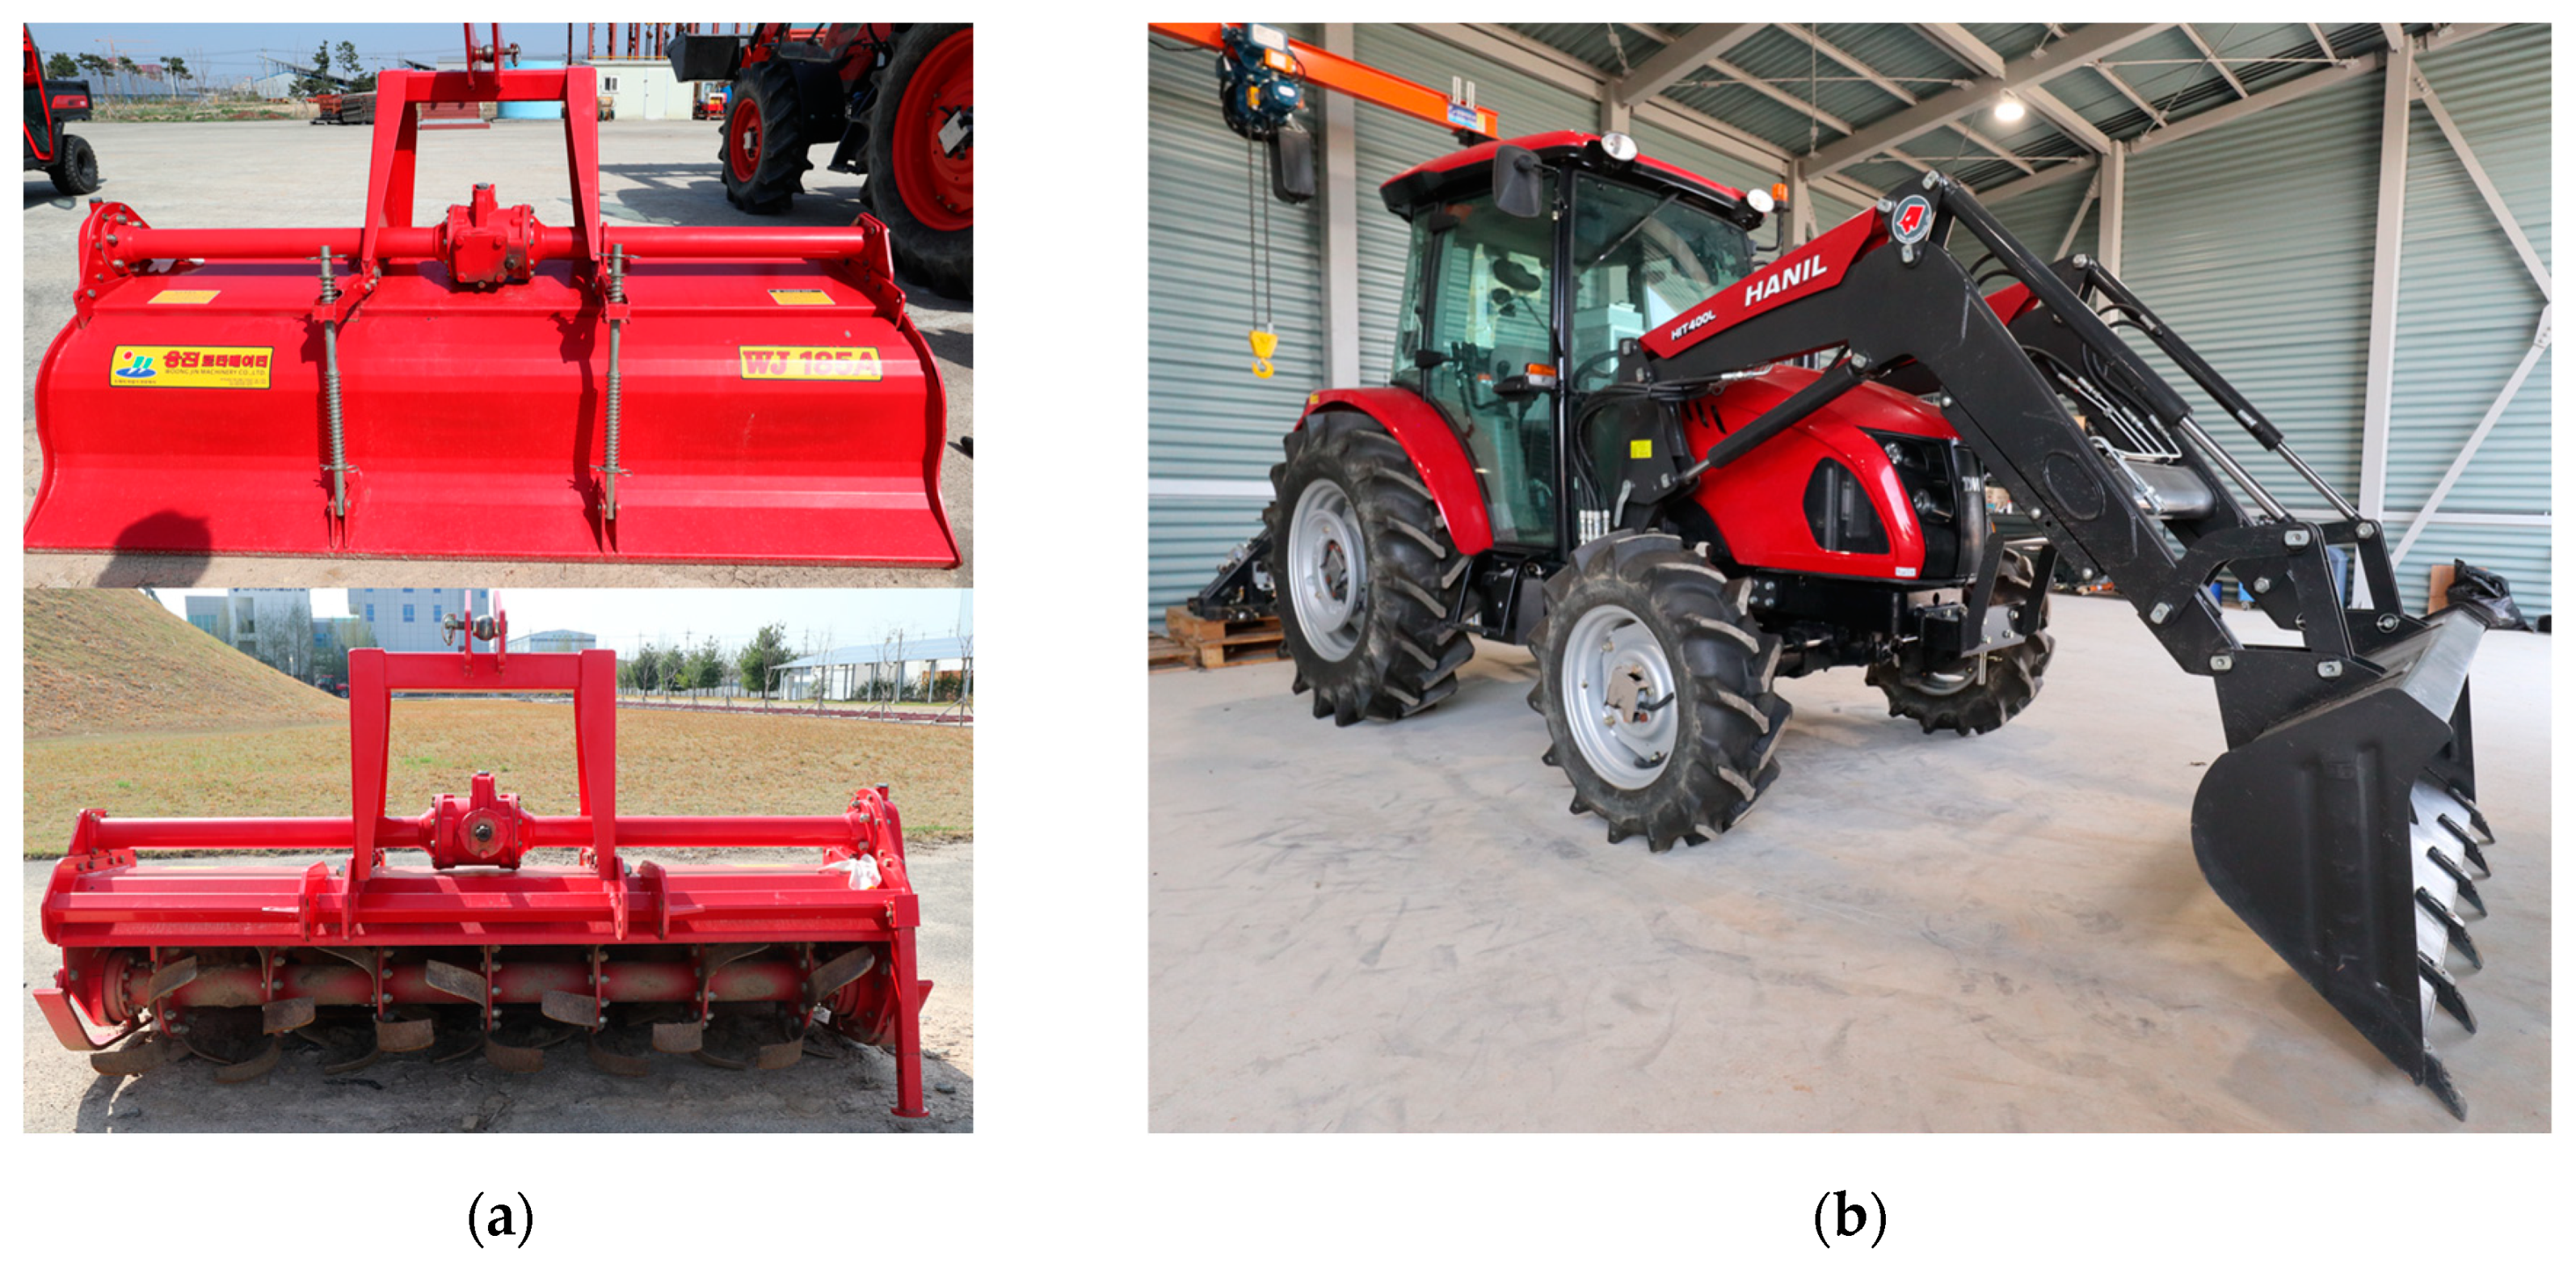
2.2. Tractor–Implement System
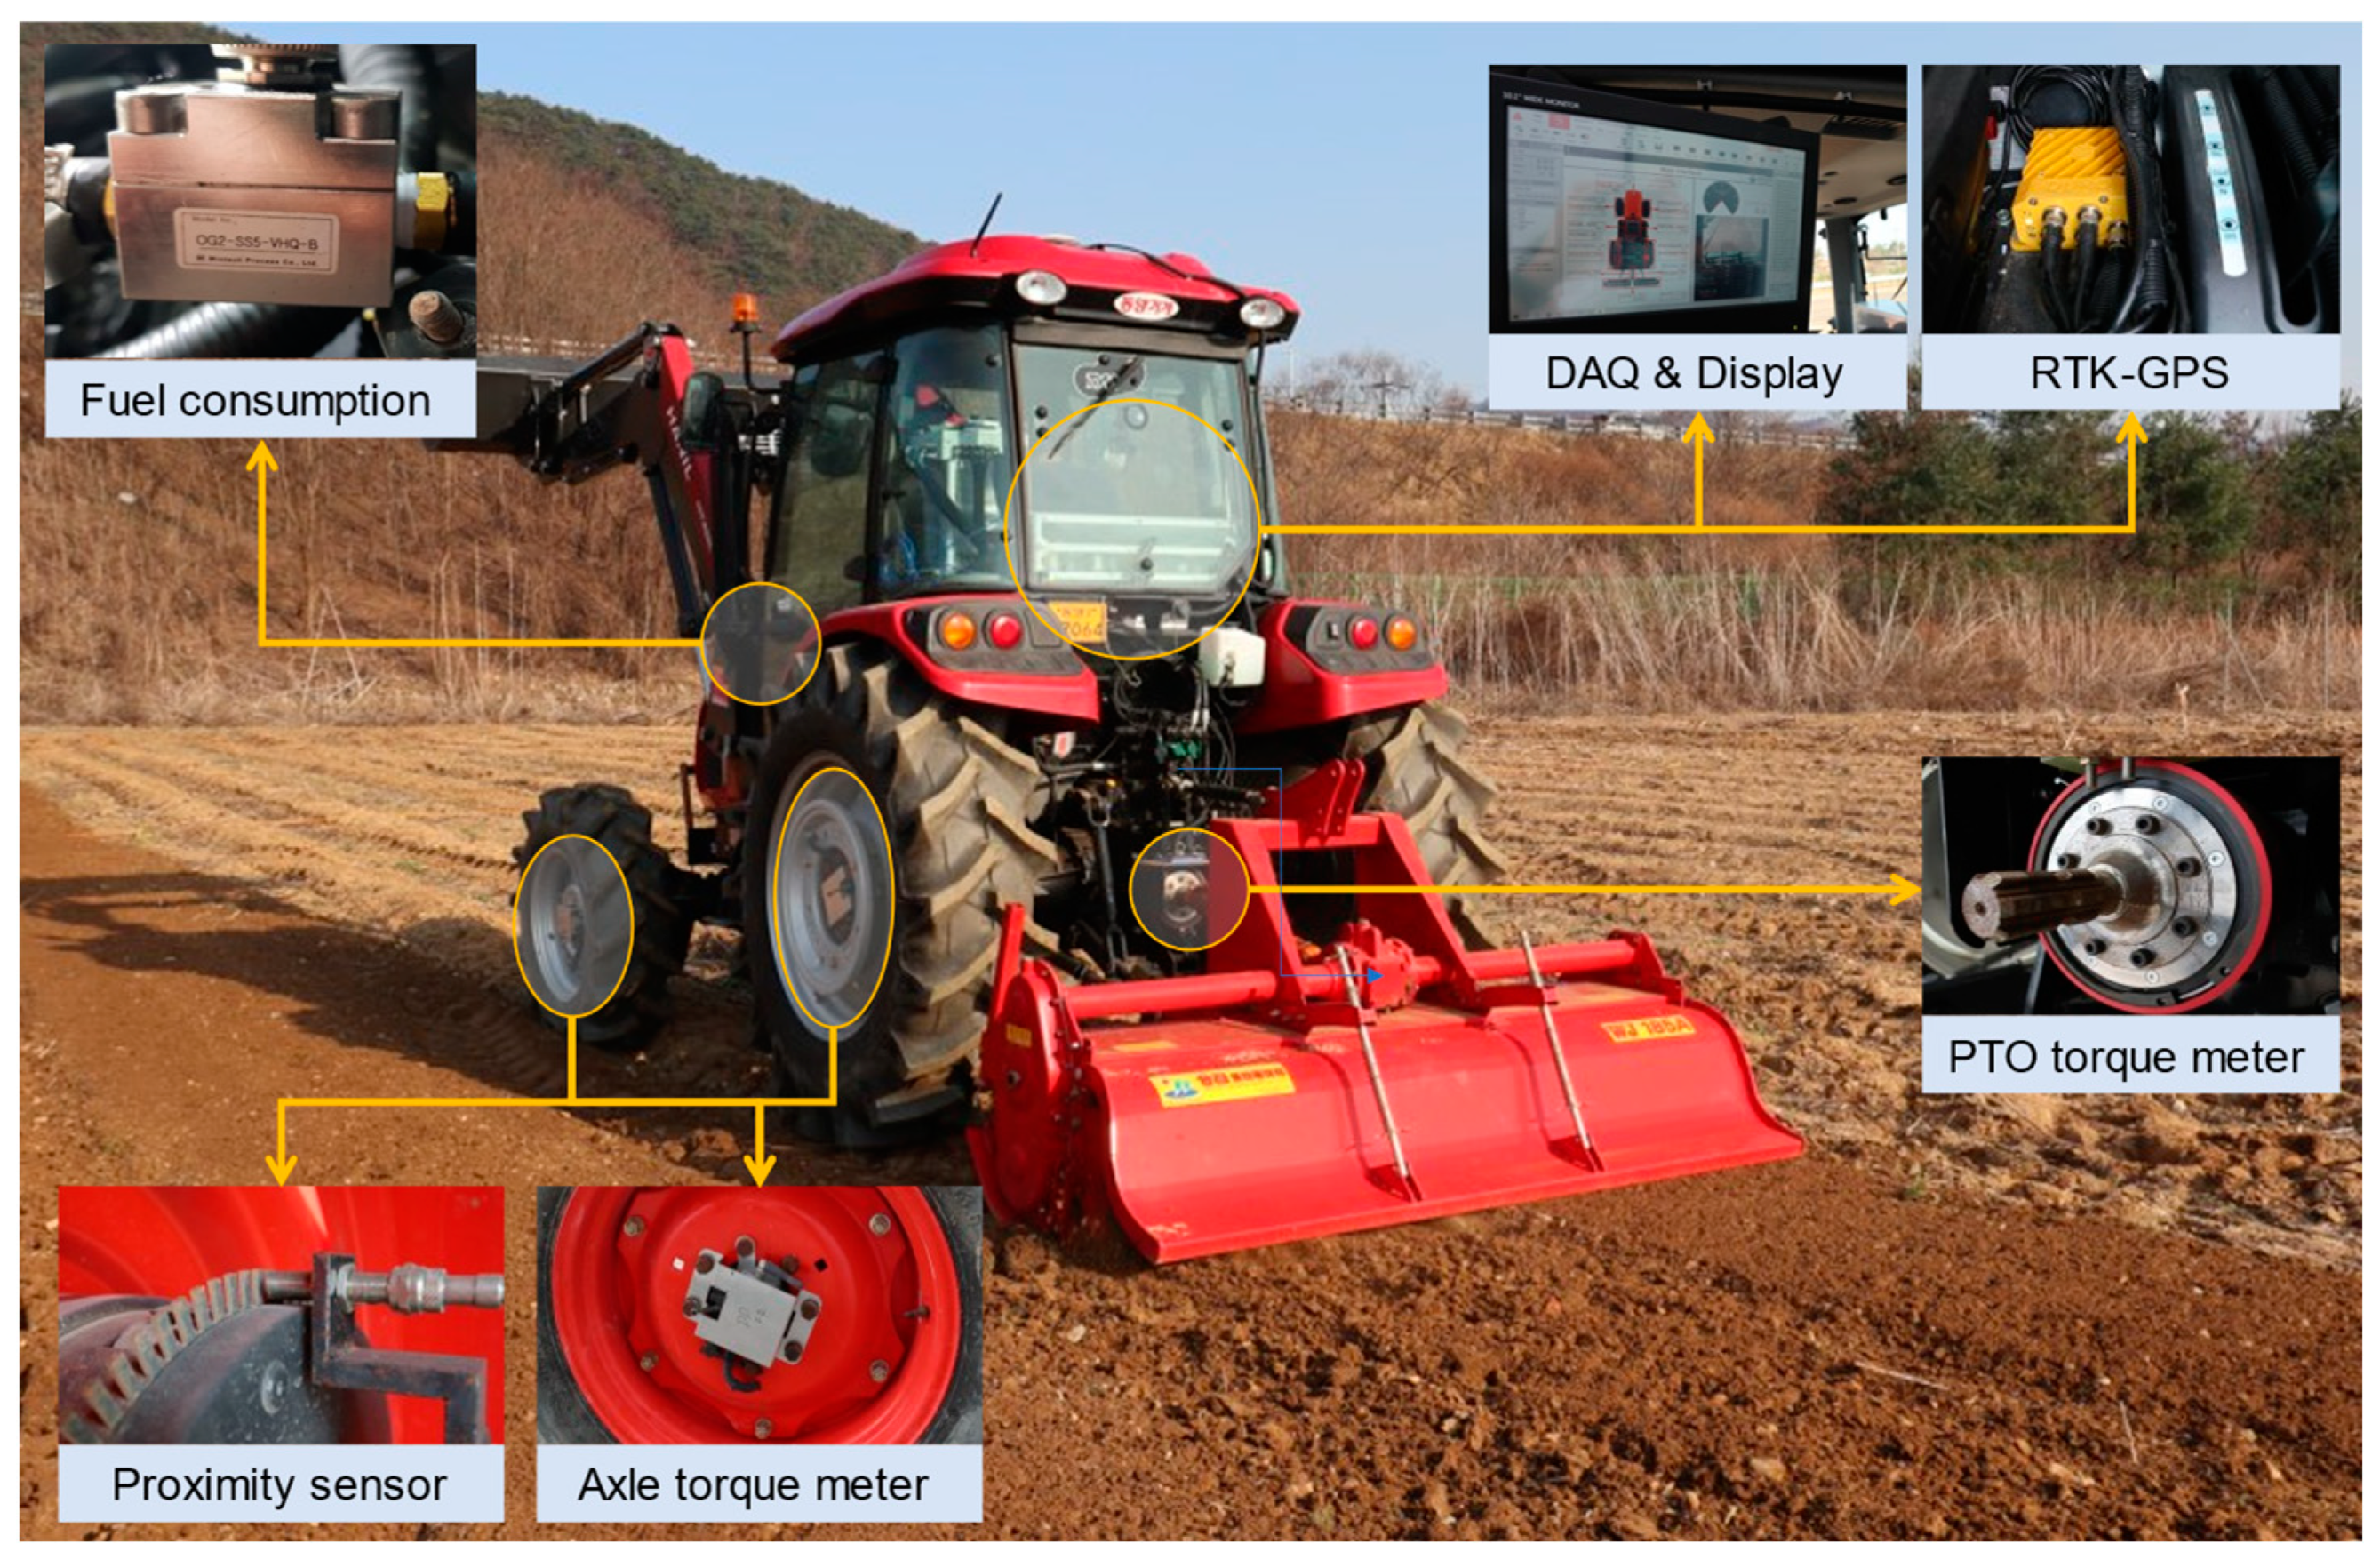
2.3. Working Load Measurement System
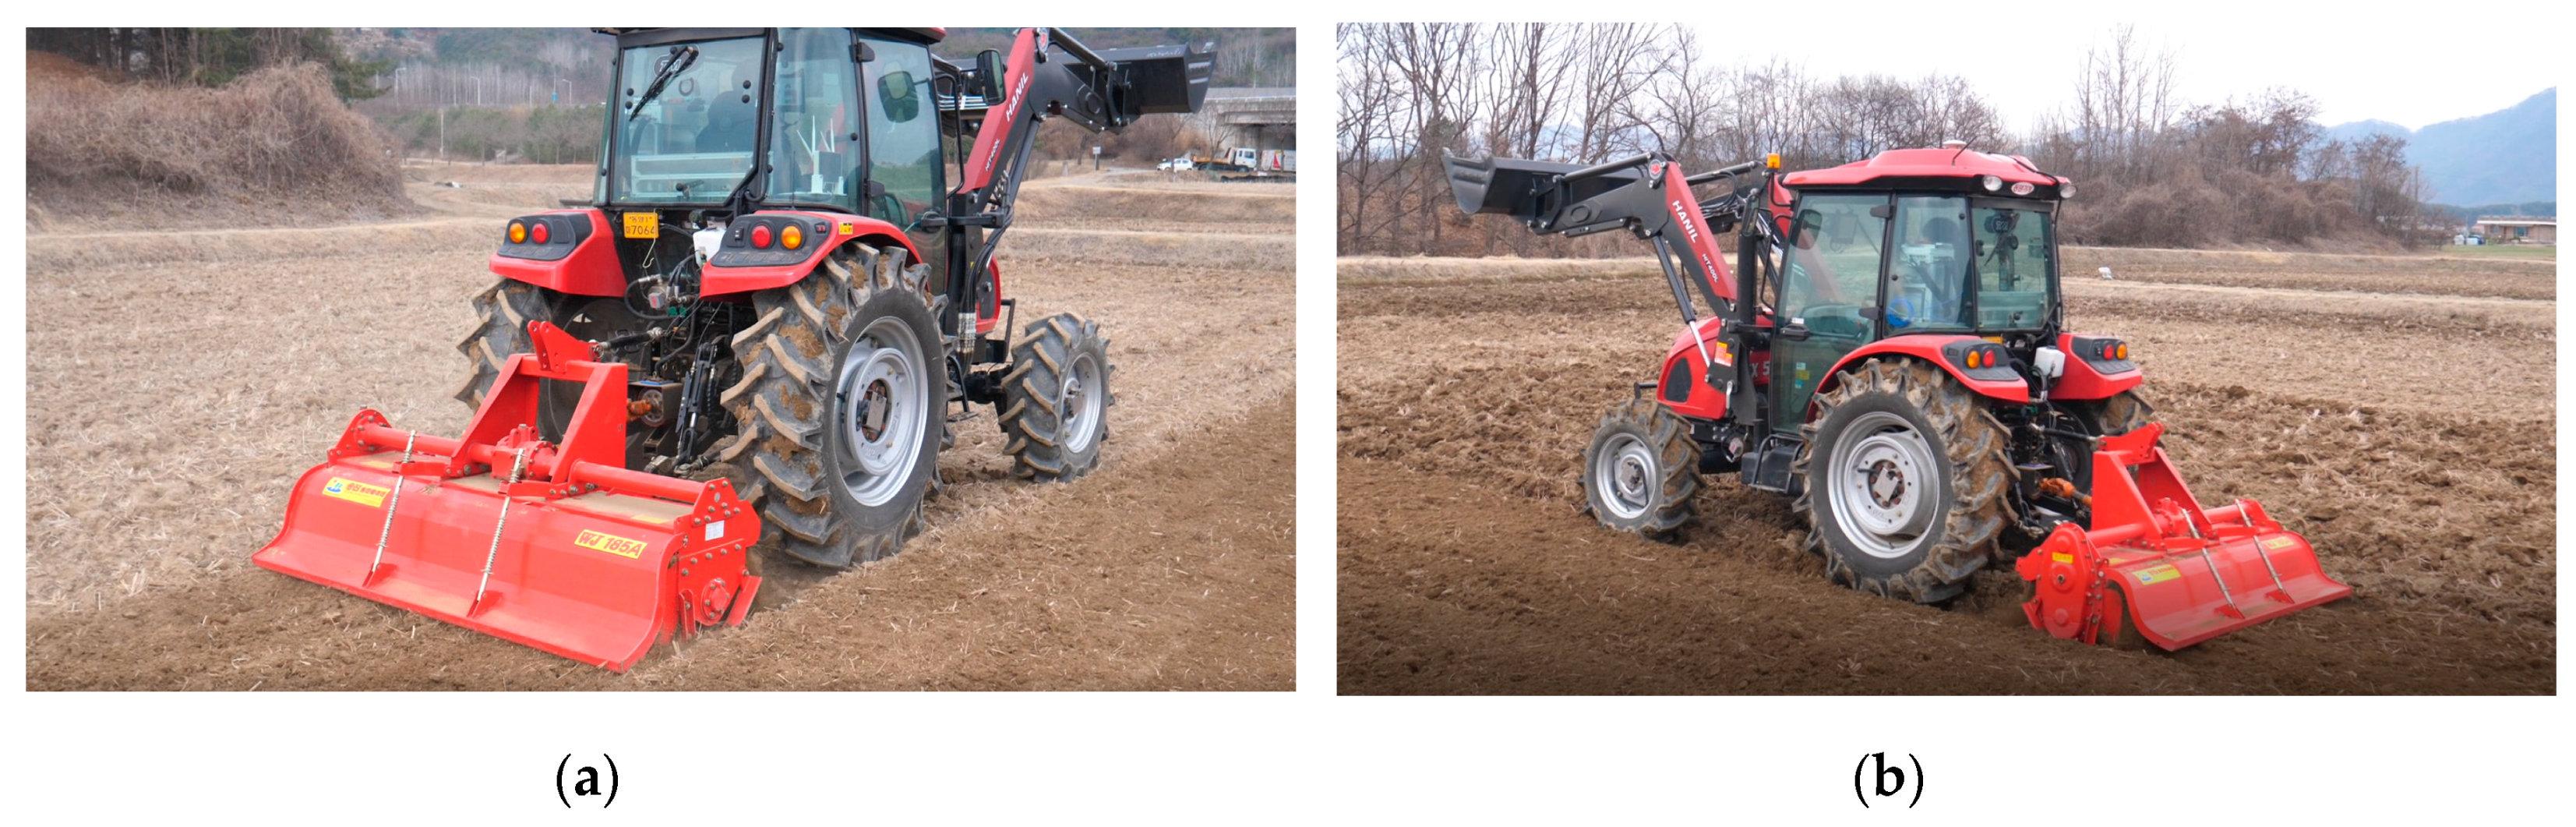
2.4. Field Experimental Design
3. Results
3.1. Analysis of Soil Properties
3.2. Travel Speed with Wheel Slippage
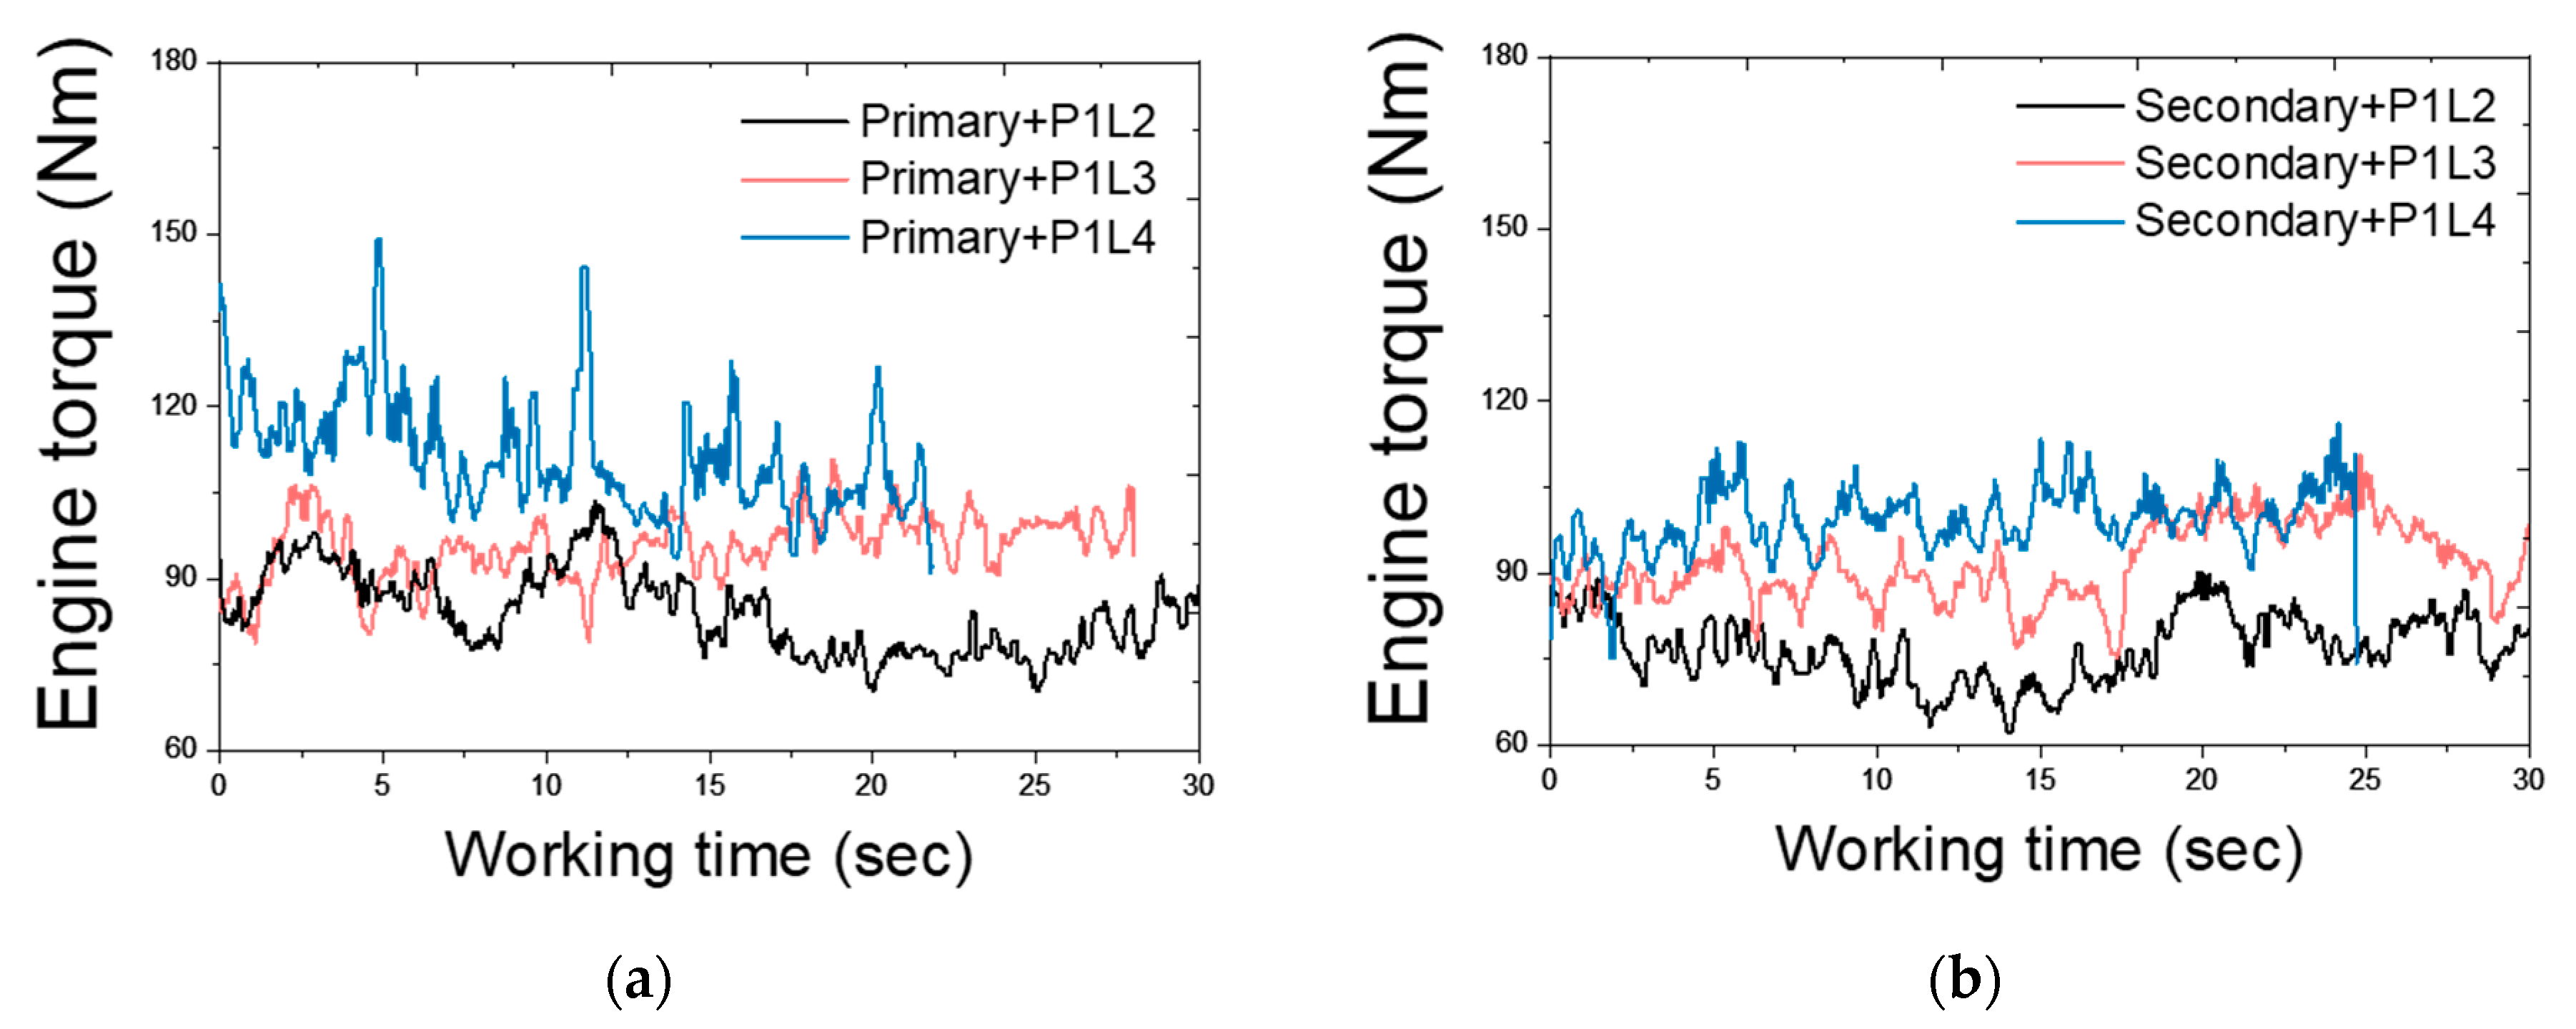
3.3. Engine Load
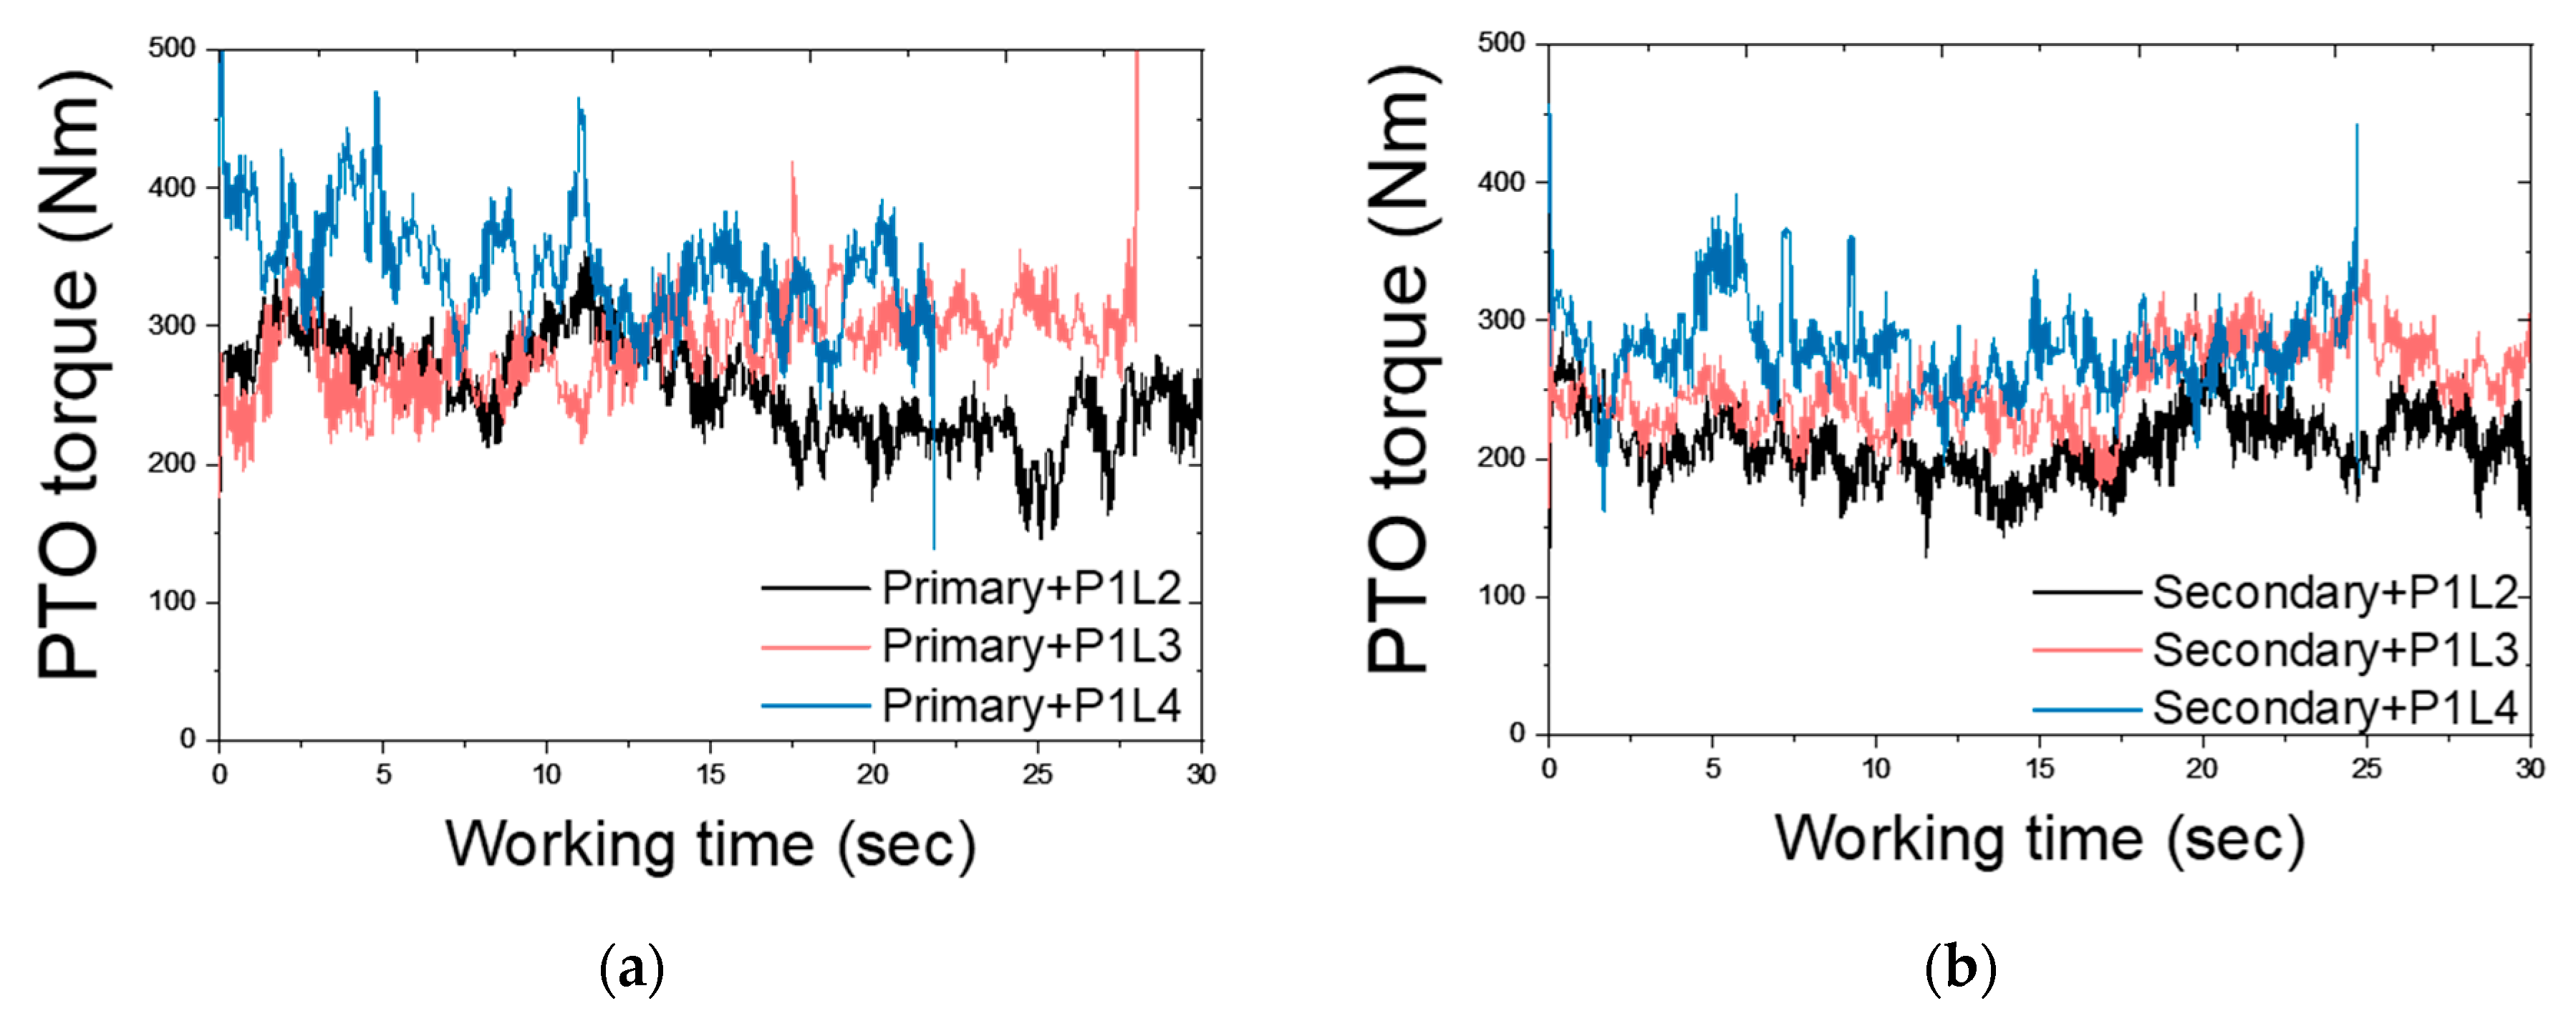
3.4. PTO Shaft Load
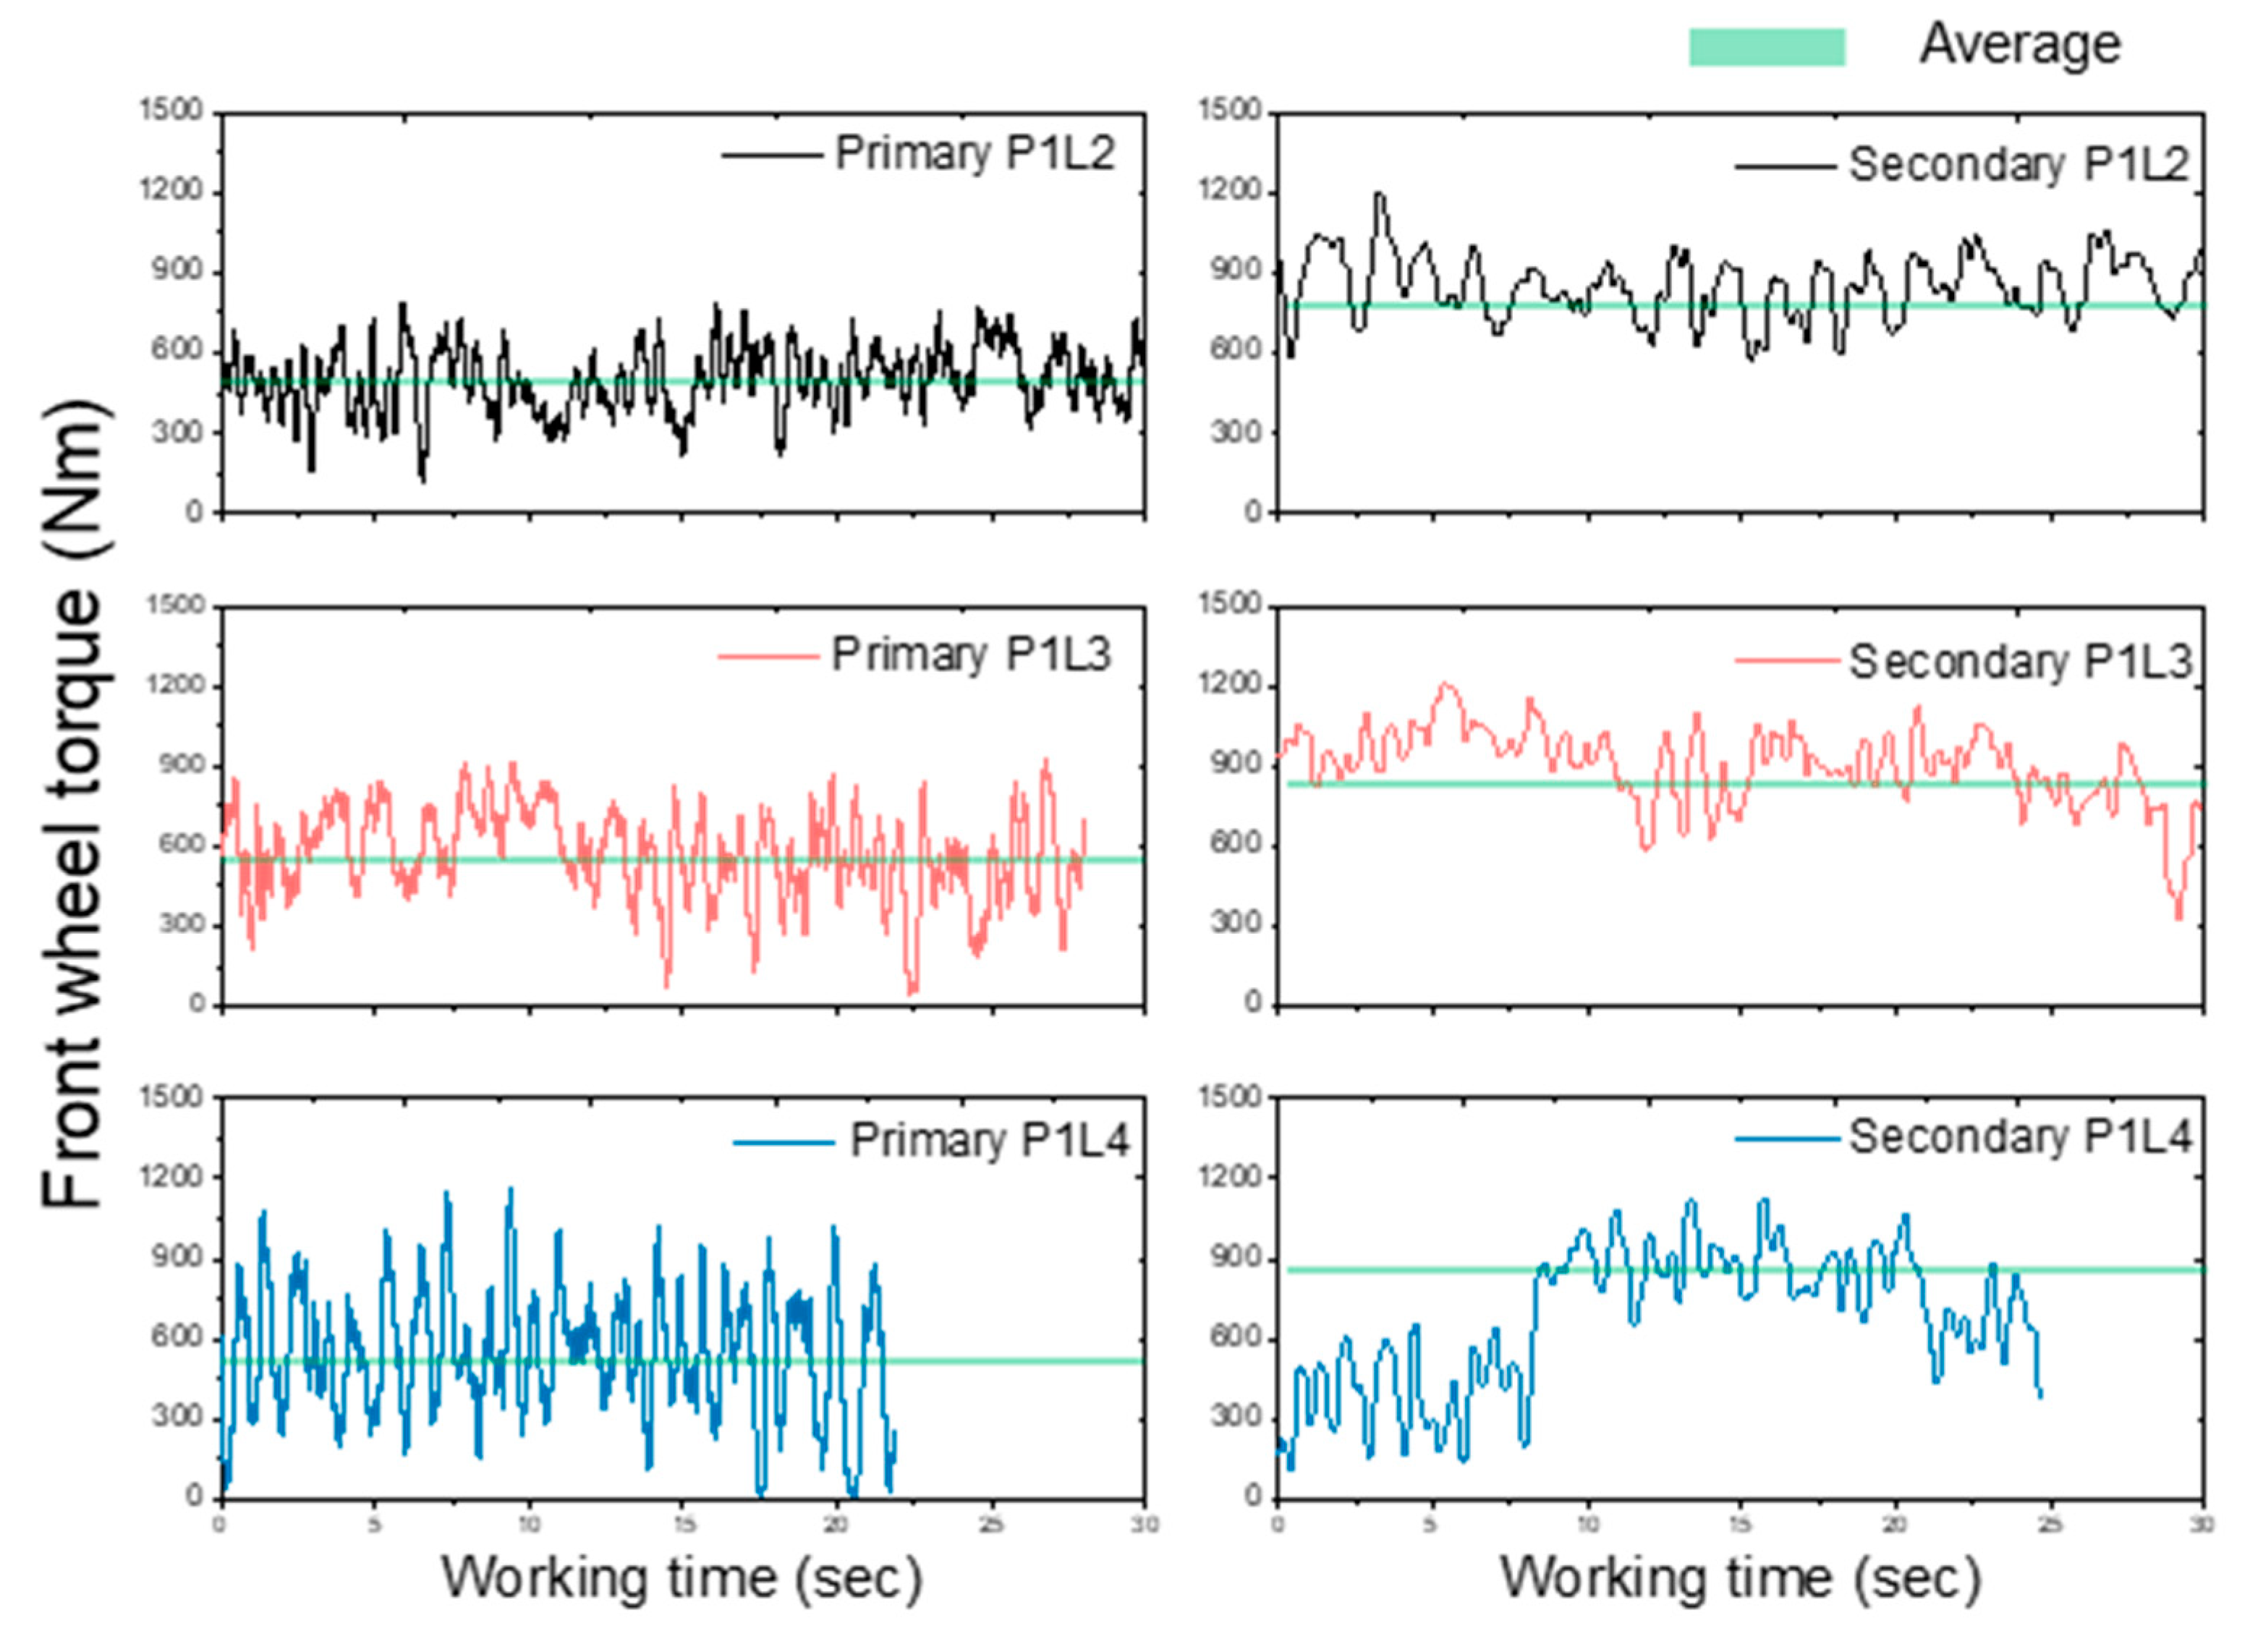
3.5. Axle Shaft Load
3.5.1. Front Wheel Axle
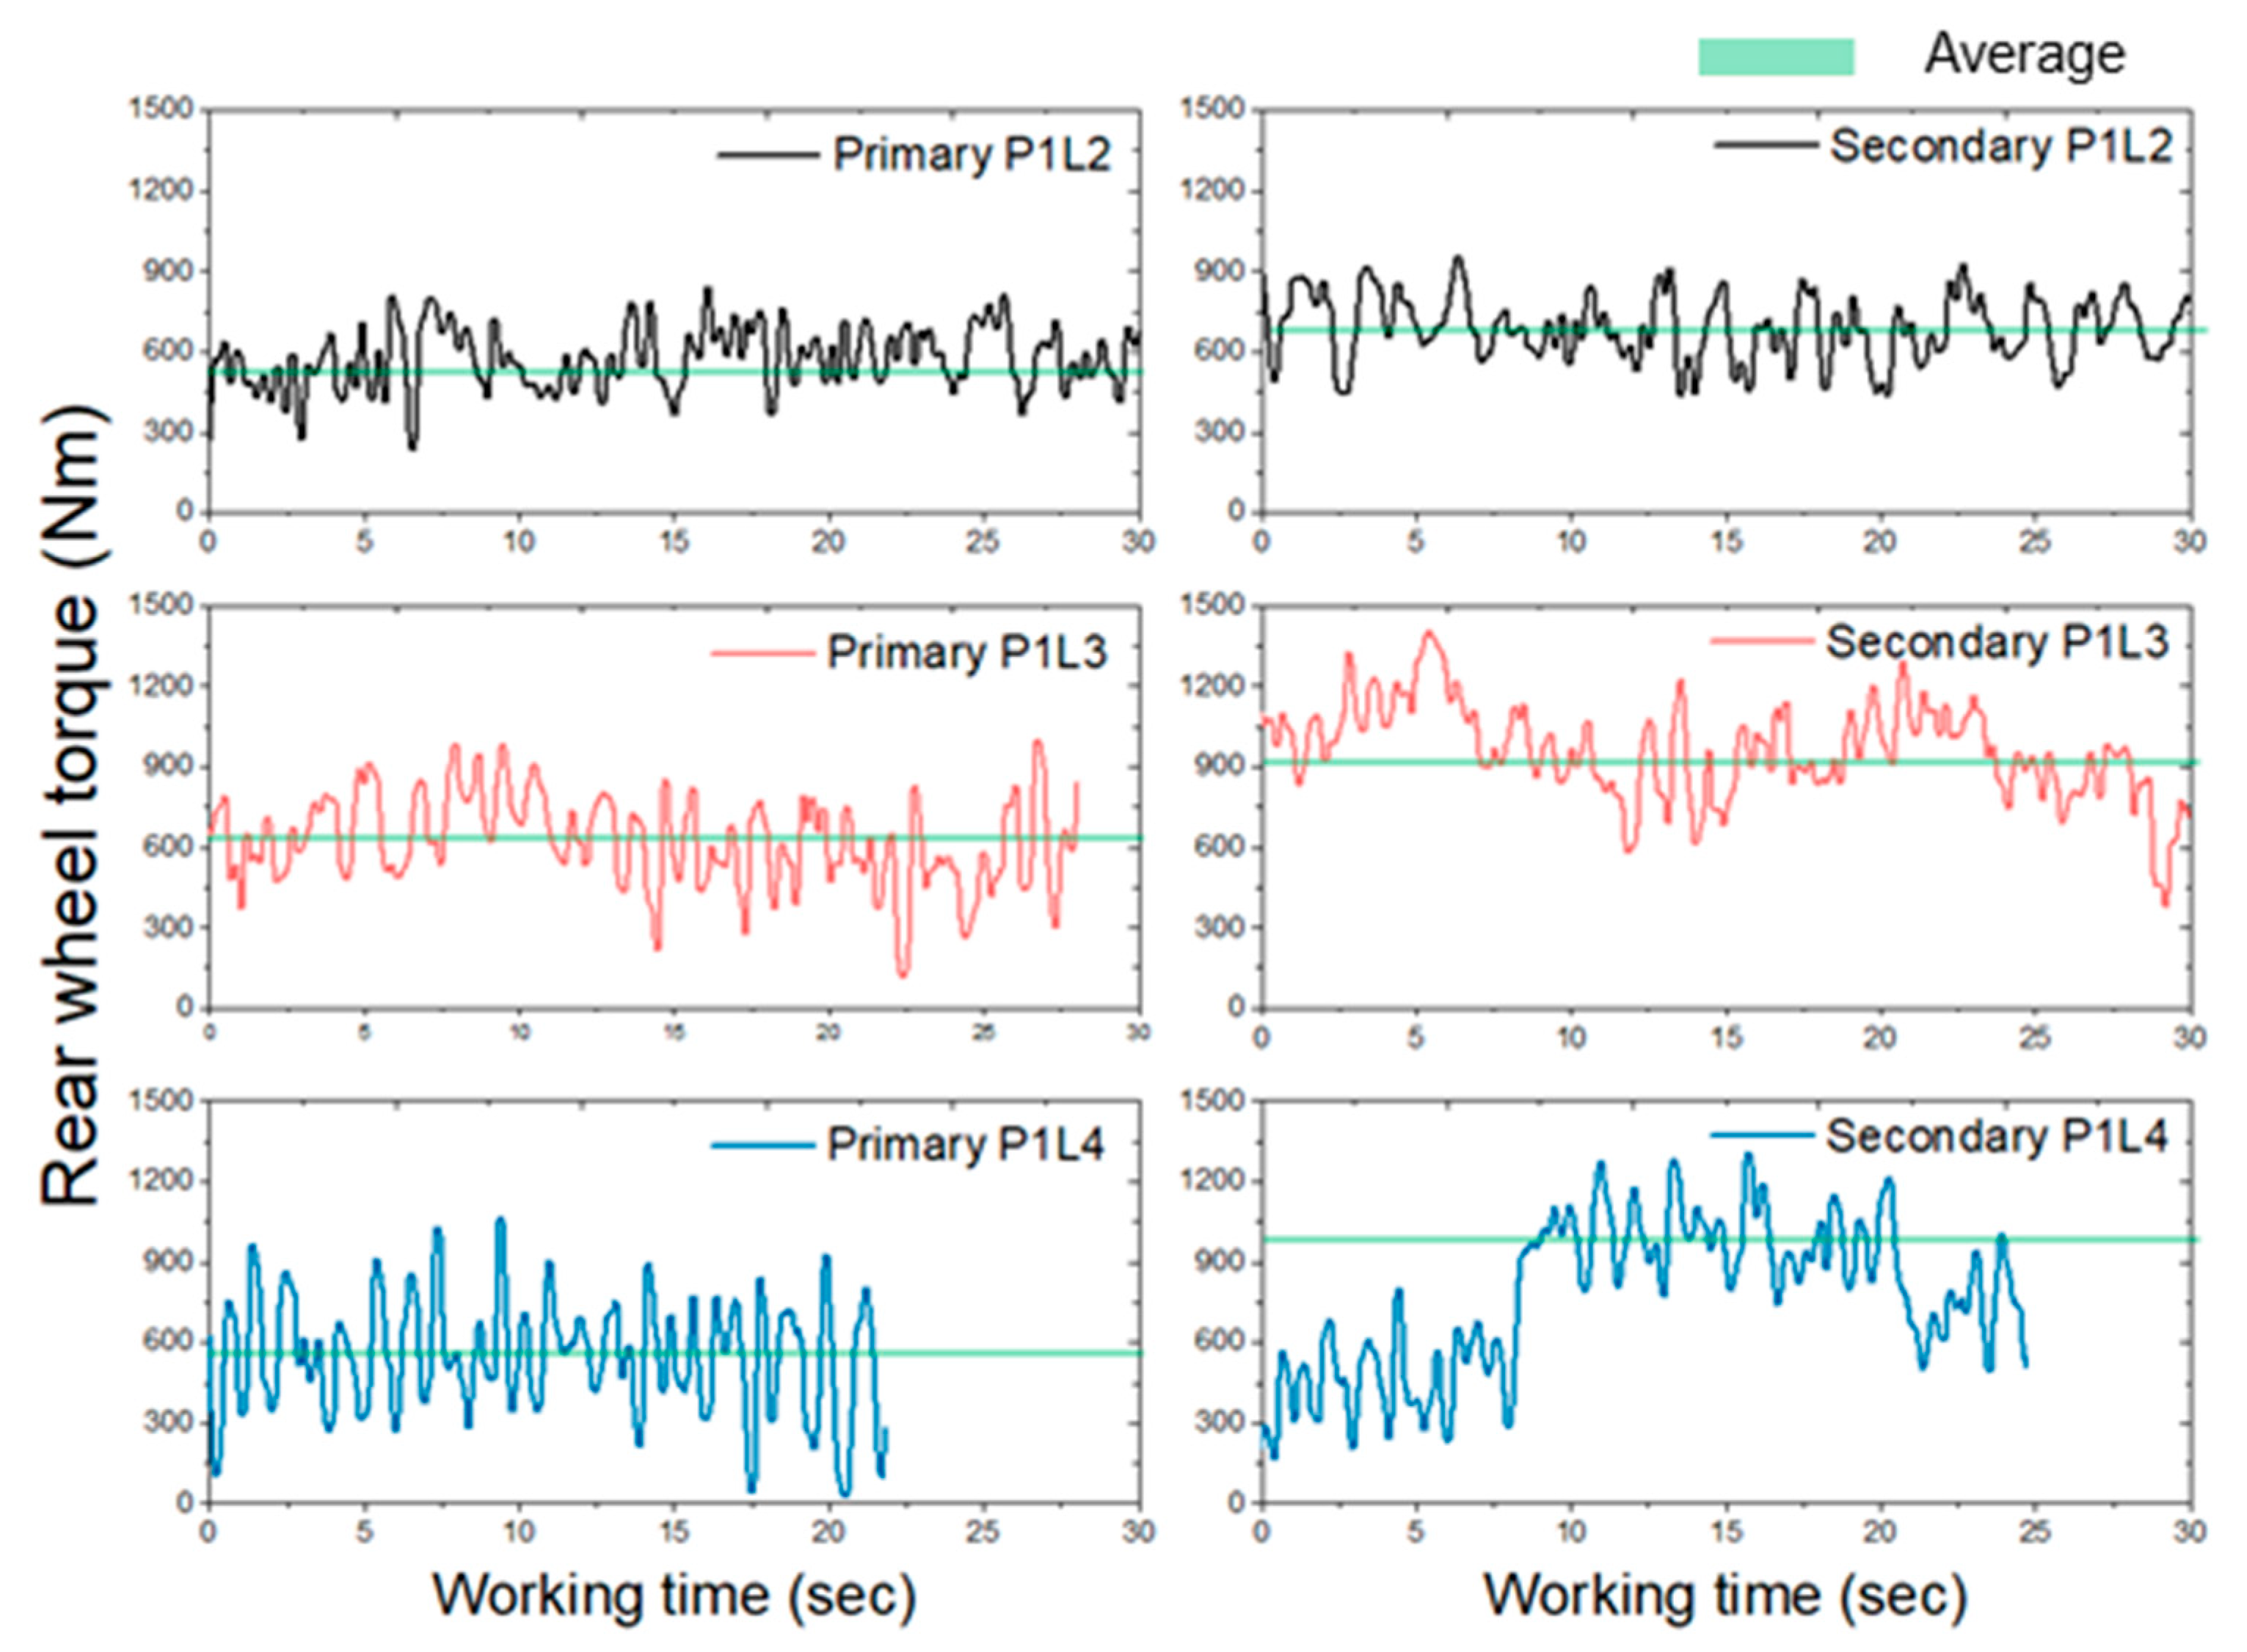
3.5.2. Rear Wheel Axle
3.6. Fuel Efficiency
4. Discussion
5. Conclusions
- By measuring the soil properties according to depth, it was confirmed that the core index, shear strength, and water content, which are the main properties that affect the load of cultivation work, changed in accordance with the change in depth. In particular, soil bulk density was measured to decrease by 9–19% under rotary operation. Therefore, soil properties as a function of tillage type, which is a typical soil–tool interaction process, should be considered first when evaluating the performance of the operation of agricultural machinery or in field tests.
- Overall average torque was higher by up to 14% (engine) and 29.1% (PTO shaft) in primary tillage than in secondary tillage when the selected gear was the same. When the tillage type was the same, it was found that the overall average torque increased as a result of gear selection by up to 35.9% (engine) and 33.9% (PTO shaft) in P1L4 compared to P1L2.
- In the case of fuel efficiency, it was revealed that the effect of gear selection was greater than the effect of the tillage type. When working on loam field (soil water content of 17–20%, bulk density of 1571–1830 , and cone index of 801–2065 kPa), the most suitable gear for reducing fuel consumption was found to be P1L4.
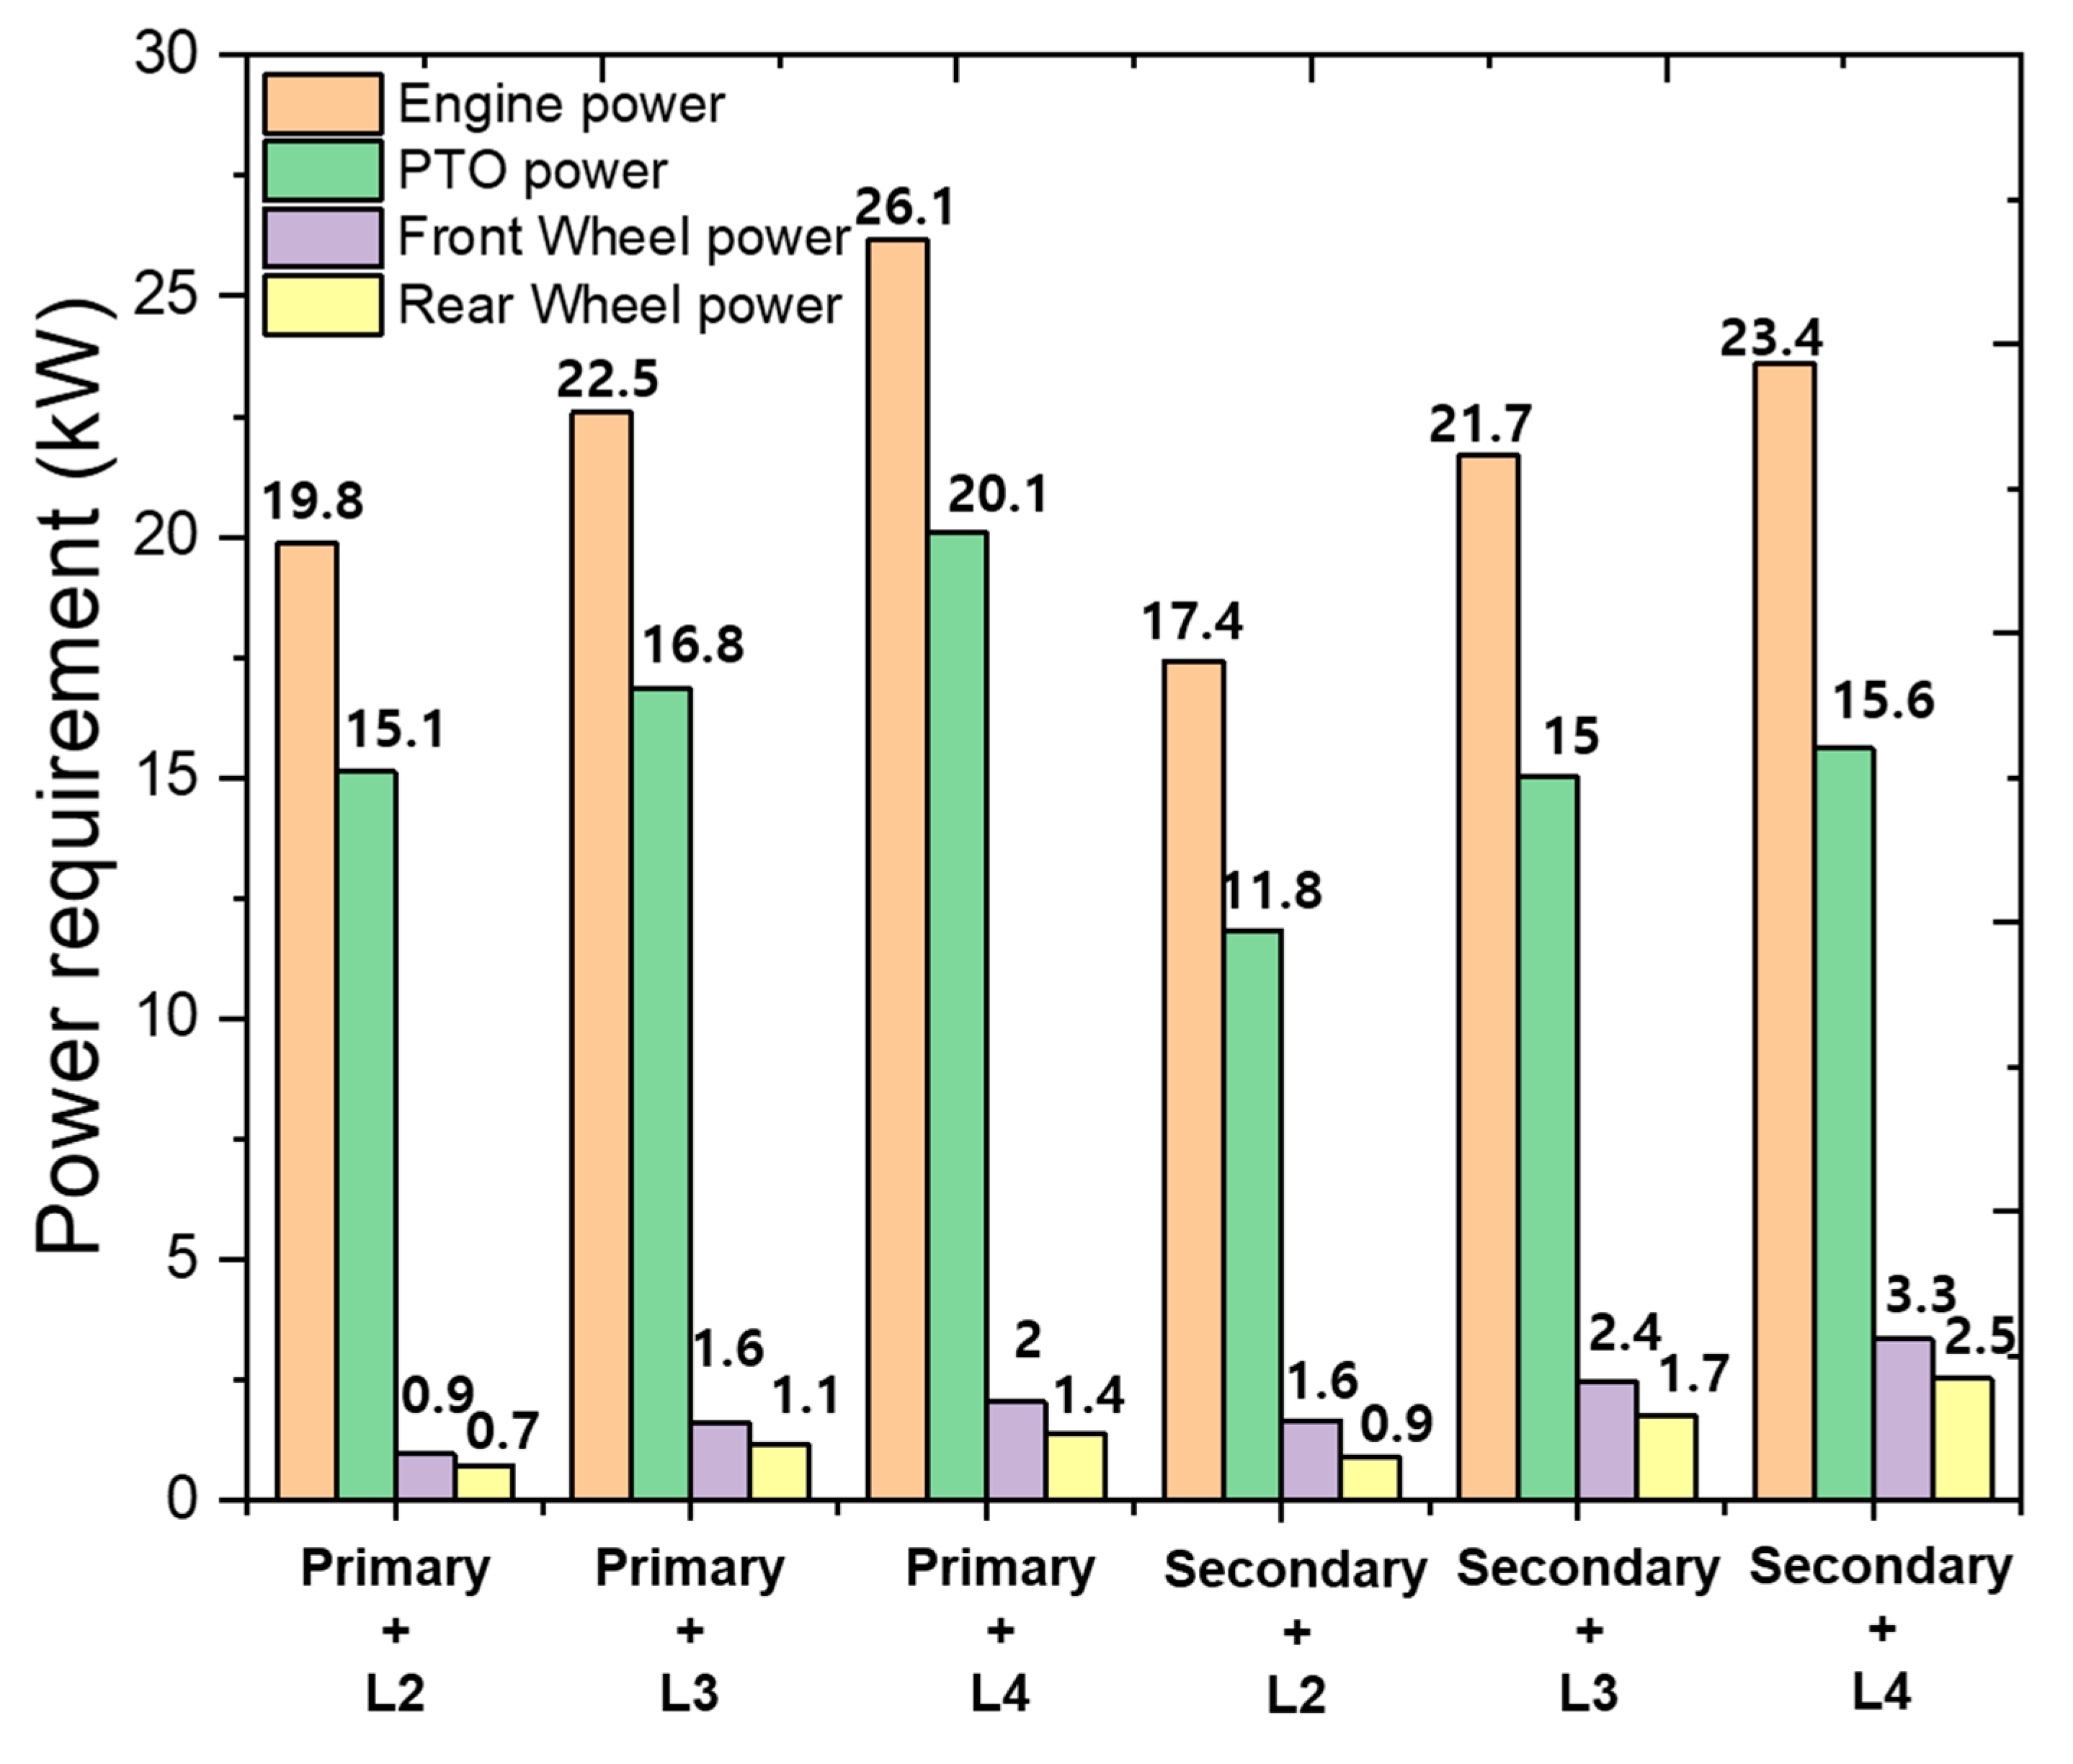
- In addition, based on the power requirement results, from the perspective of the machine, when working on loamy soil with a tillage depth of 10 to 13 cm, 66.7–77% of the power generated by the engine was consumed by the PTO shaft. This shows that the force applied to the implements during rotary operation is greater than the traction load.
- In the case of the power requirements, the power required on the same tillage type increased with increasing gear ratio. During secondary tillage, the overall power required decreased due to changes in key soil properties such as bulk density, cone index, and vane shear torque. Therefore, it was judged that design modification is necessary in order to have a wide working width, and that in some cases, rotary tillage will be possible at a deeper tillage depth or at a higher travel speed. It is expected that performance evaluation and optimal design of soil operation machinery in various working environments will be possible through similar field verification procedures in future studies.
Author Contributions
Funding
Institutional Review Board Statement
Data Availability Statement
Conflicts of Interest
References
- Kim, W.S.; Kim, Y.J.; Park, S.U.; Hong, S.J.; Kim, Y.S. Evaluation of PTO Severeness for 78 KW-Class Tractor According to Disk Plow Tillage and Rotary Tillage. J. Drive Control 2019, 16, 23–31. [Google Scholar] [CrossRef]
- Lim, S.; Kwon, H.; Kang, Y.; Lee, P.; Kim, T.; Kim, Y.; Kim, Y. Power Analysis of a 3-KW Class Motor-Driven Multipurpose Walking-Type Transplanter. J. Biosyst. Eng. 2019, 44, 135–145. [Google Scholar] [CrossRef]
- Kim, Y.J.; Chung, S.O.; Park, S.J.; Choi, C.H. Analysis of Power Requirement of Agricultural Tractor by Major Field Operation. J. Biosyst. Eng. 2011, 36, 79–88. [Google Scholar] [CrossRef][Green Version]
- Han, K.H.; Kim, K.U.; Wu, Y.G. Severness of Transmission Loads of Agricultural Tractor for Rotary Operations in Poorly Drained Paddy Field. J. Biosyst. Eng. 1999, 24, 293–300. [Google Scholar]
- Raper, R.L. Force requirements and soil disruption of straight and bentleg subsoilers for conservation tillage systems. Appl. Eng. Agric. 2005, 21, 787–794. [Google Scholar] [CrossRef]
- Naderloo, L.; Alimadani, R.; Akram, A.; Javadikia, P.; Zeinali Khanghah, H. Tillage Depth and Forward Speed Effects on Draft of Three Primary Tillage Implements in Clay Loam Soil. J. Food Agric. Environ. 2009, 7, 382–385. [Google Scholar]
- Moeenifar, A.; Mousavi-Seyedi, S.R.; Kalantari, D. Influence of Tillage Depth, Penetration Angle and Forward Speed on the Soil/Thin-Blade Interaction Force. Agric. Eng. Int. CIGR J. 2014, 16, 69–74. [Google Scholar]
- Aday, S.H.; Ramadhan, M.N. Comparison between the Draft Force Requirements and the Disturbed Area of a Single Tine, Parallel Double Tines and Partially Swerved Double Tines Subsoilers. Soil Tillage Res. 2019, 191, 238–244. [Google Scholar] [CrossRef]
- Kichler, C.M.; Fulton, J.P.; Raper, R.L.; McDonald, T.P.; Zech, W.C. Effects of Transmission Gear Selection on Tractor Performance and Fuel Costs during Deep Tillage Operations. Soil Tillage Res. 2011, 113, 105–111. [Google Scholar] [CrossRef]
- Kim, W.S.; Kim, Y.J.; Park, S.U.; Kim, Y.S. Influence of Soil Moisture Content on the Traction Performance of a 78-KW Agricultural Tractor during Plow Tillage. Soil Tillage Res. 2020, 207, 104851. [Google Scholar] [CrossRef]
- Kim, Y.S.; Kim, W.S.; Baek, S.Y.; Baek, S.M.; Kim, Y.J.; Lee, S.D.; Kim, Y.J. Analysis of Tillage Depth and Gear Selection for Mechanical Load and Fuel Efficiency of an Agricultural Tractor Using an Agricultural Field Measuring System. Sensors 2020, 20, 2450. [Google Scholar] [CrossRef]
- Kim, Y.S.; Lee, S.D.; Baek, S.M.; Baek, S.Y.; Jeon, H.H.; Lee, J.H.; Kim, W.S.; Shim, J.Y.; Kim, Y.J. Analysis of the Effect of Tillage Depth on the Working Performance of Tractor-Moldboard Plow System under Various Field Environments. Sensors 2022, 22, 2750. [Google Scholar] [CrossRef]
- Lee, D.H.; Kim, Y.J.; Chung, S.O.; Choi, C.H.; Lee, K.H.; Shin, B.S. Analysis of the PTO Load of a 75 KW Agricultural Tractor during Rotary Tillage and Baler Operation in Korean Upland Fields. J. Terramech. 2015, 60, 75–83. [Google Scholar] [CrossRef]
- Behera, A.; Raheman, H.; Thomas, E.V. A Comparative Study on Tillage Performance of Rota-Cultivator (a Passive—Active Combination Tillage Implement) with Rotavator (an Active Tillage Implement). Soil Tillage Res. 2021, 207, 104861. [Google Scholar] [CrossRef]
- Kim, Y.J.; Chung, S.K.; Choi, C.H.; Lee, D.H. Evaluation of Tractor PTO Severeness during Rotary Tillage Operation. J. Biosyst. Eng. 2011, 36, 163–170. [Google Scholar] [CrossRef]
- Kim, Y.J.; Chung, S.O.; Choi, C.H. Effects of Gear Selection of an Agricultural Tractor on Transmission and PTO Load during Rotary Tillage. Soil Tillage Res. 2013, 134, 90–96. [Google Scholar] [CrossRef]
- Kim, Y.S.; Lee, P.U.; Kim, W.S.; Kwon, O.W.; Kim, C.W.; Lee, K.H.; Kim, Y.J. Strength Analysis of a PTO (Power Take-Off) Gear-Train of a Multi-Purpose Cultivator during a Rotary Ditching Operation. Energies 2019, 12, 1100. [Google Scholar] [CrossRef]
- Tan, K.H. Soil Sampling, Preparation, and Analysis; CRC Press: New York, NY, USA, 1995; ISBN 0-8247-9675-6. [Google Scholar]
- O’Kelly, B.C.; Sivakumar, V. Water Content Determinations for Peat and Other Organic Soils Using the Oven-Drying Method. Dry. Technol. 2014, 32, 631–643. [Google Scholar] [CrossRef]
- Ditzler, C.; Scheffe, K.; Monger, H.C. USDA Handbook 18; Government Printing Office: Washington, DC, USA, 2017. [Google Scholar]
- Thien, S.J. A Flow Diagram for Teaching Texture-by-Feel Analysis. J. Agron. Educ. 1979, 8, 54–55. [Google Scholar] [CrossRef]
- ASABE Standards EP542; Procedure for Using and Reporting Data Obtained with the Soil Cone Penetrometer. ASAE, Ed.: St. Joseph, MI, USA, 2009; Volume 1999.
- ASABE Standards S313.3; Soil Cone Penetrometer. ASAE, Ed.: St. Joseph, MI, USA, 2005; Volume 1999.
- Park, J.G. Bio-Production Machinery Engineering, 1st ed.; CIR: Seoul, Republic of Korea, 2008. [Google Scholar]
- Srivastava, A.K.; Goering, C.E.; Rohrbach, R.P.; Buckmaster, D.R. Engineering Principles of Agricultural Machines, 2nd ed.; American Society of Agricultural and Biological Engineers (ASABE): St. Joseph, MI, USA, 2006. [Google Scholar]
- Nataraj, E.; Sarkar, P.; Raheman, H.; Upadhyay, G. Embedded Digital Display and Warning System of Velocity Ratio and Wheel Slip for Tractor Operated Active Tillage Implements. J. Terramech. 2021, 97, 35–43. [Google Scholar] [CrossRef]
- Rasool, S.; Raheman, H.; Upadhyay, G. Development of an Instrumentation System for Evaluating the Tractive Performance of Walking Tractors. Int. J. Curr. Microbiol. Appl. Sci. 2017, 6, 759–770. [Google Scholar] [CrossRef]
- Chung, S.O.; Sudduth, K.A. Soil Failure Models for Vertically Operating and Horizontally Operating Strength Sensors. Trans. ASABE 2006, 49, 851–863. [Google Scholar] [CrossRef]
- Farid Eltom, A.E.; Ding, W.; Ding, Q.; Ali, A.B.B.; Eisa Adam, B. Effect of Trash Board on Moldboard Plough Performance at Low Speed and under Two Straw Conditions. J. Terramech. 2015, 59, 27–34. [Google Scholar] [CrossRef]
- Kim, Y.S.; Kim, W.S.; Siddique, A.A.; Baek, S.Y.; Baek, S.M.; Cheon, S.H.; Lee, S.D.; Lee, K.H.; Hong, D.H.; Park, S.U.; et al. Power Transmission Efficiency Analysis of 42 KW Power Agricultural Tractor According to Tillage Depth during Moldboard Plowing. Agronomy 2020, 10, 1263. [Google Scholar] [CrossRef]
- Upadhyay, G.; Raheman, H. Performance of Combined Offset Disc Harrow (Front Active and Rear Passive Set Configuration) in Soil Bin. J. Terramech. 2018, 78, 27–37. [Google Scholar] [CrossRef]
- Grisso, R.; Pitman, R.; Perumpral, J.V.; Vaughan, D.; Roberson, G.T.; Hoy, R.M. “Gear up and Throttle down” to Save Fuel; Virginia Cooperative Extension Publication: Blacksburg, VA, USA, 2011; pp. 442–450. [Google Scholar]
- Nyéki, A.; Milics, G.; Kovács, A.J.; Neményi, M. Effects of Soil Compaction on Cereal Yield: A Review. Cereal Res. Commun. 2017, 45, 1–22. [Google Scholar] [CrossRef]
- USDA. Soil Mechanics Level I. Module 3—USDA Textural Soil Classification. Study Guide; USDA, Soil Convervation Service: Stillwater, OK, USA, 1987. [Google Scholar]
- Park, J.G.; Lee, K.S.; Cho, S.C.; Noh, K.M.; Chung, S.O.; Chang, Y.C. Analysis of Variations in Mechanical Properties of Soil by Tillage Operations. J. Biosyst. Eng. 2007, 32, 215–222. [Google Scholar]
- Kim, W.S.; Kim, Y.S.; Kim, Y.J. Development of Prediction Model for Axle Torque of Agricultural Tractors. Trans. ASABE 2020, 63, 1773–1786. [Google Scholar] [CrossRef]


| Item | Specification |
|---|---|
| Company | Woongjin |
| Model | WJ185A |
| Required power (kW) | 35~45 |
| Length (mm) × width (mm) × height (mm) | 810 × 2020 × 1130 |
| Tillage width (mm) | 1820 |
| Weight (kg) | 405 |
| Max. tillage depth (mm) | 200 |
| Number of flanges | 7 |
| Number of blades | 42 |
| Parameters | Soil Depth: 0 to 10 cm | Soil Depth: 10 to 20 cm |
|---|---|---|
| Water contents (WC, %) | 20.6 1.2 | 17.7 1.1 |
| Bulk density () | 1571.7 75.2 | 1830 30.6 |
| Cone index (CI, kPa) | 801.8 277.6 | 2065.9 643.1 |
| Shear strength (, kPa) | 25.1 7.2 | 64.3 14.4 |
| Driving Conditions | Theoretical Speed (km/h) | Travel Speed (km/h) | Slip Ratio (%) |
|---|---|---|---|
| Primary P1L2 | 1.73 0.03 | 1.7 0.14 | 1.42 5.31 |
| Primary P1L3 | 2.47 0.04 | 2.44 0.16 | 1.27 6.21 |
| Primary P1L4 | 3.29 0.06 | 3.26 0.25 | 0.51 6.54 |
| Secondary P1L2 | 1.73 0.02 | 1.68 0.08 | 2.43 4.63 |
| Secondary P1L3 | 2.47 0.02 | 2.42 0.12 | 2.04 4.81 |
| Secondary P1L4 | 3.29 0.05 | 3.24 0.17 | 1.43 4.99 |
| Driving Conditions | FC 1 (kg/h) | SFC 2 (g/kWh) | PR 3 (ha/h) | Fuel Cost ($/ha) |
|---|---|---|---|---|
| Primary P1L2 | 7.19 | 358.07 | 0.31 | 30.38 |
| Primary P1L3 | 7.56 | 336.10 | 0.44 | 22.51 |
| Primary P1L4 | 7.84 | 326.73 | 0.59 | 17.41 |
| Secondary P1L2 | 6.87 | 396.58 | 0.31 | 29.03 |
| Secondary P1L3 | 7.73 | 338.62 | 0.44 | 23.01 |
| Secondary P1L4 | 7.85 | 329.73 | 0.59 | 17.43 |
Disclaimer/Publisher’s Note: The statements, opinions and data contained in all publications are solely those of the individual author(s) and contributor(s) and not of MDPI and/or the editor(s). MDPI and/or the editor(s) disclaim responsibility for any injury to people or property resulting from any ideas, methods, instructions or products referred to in the content. |
© 2023 by the authors. Licensee MDPI, Basel, Switzerland. This article is an open access article distributed under the terms and conditions of the Creative Commons Attribution (CC BY) license (https://creativecommons.org/licenses/by/4.0/).
Share and Cite
Kim, Y.-S.; Bae, B.-M.; Kim, W.-S.; Kim, Y.-J.; Lee, S.-D.; Kim, T.-J. Working Load Analysis of a 42 kW Class Agricultural Tractor According to Tillage Type and Gear Selection during Rotary Tillage Operation. Agriculture 2023, 13, 1556. https://doi.org/10.3390/agriculture13081556
Kim Y-S, Bae B-M, Kim W-S, Kim Y-J, Lee S-D, Kim T-J. Working Load Analysis of a 42 kW Class Agricultural Tractor According to Tillage Type and Gear Selection during Rotary Tillage Operation. Agriculture. 2023; 13(8):1556. https://doi.org/10.3390/agriculture13081556
Chicago/Turabian StyleKim, Yeon-Soo, Bo-Min Bae, Wan-Soo Kim, Yong-Joo Kim, Sang-Dae Lee, and Taek-Jin Kim. 2023. "Working Load Analysis of a 42 kW Class Agricultural Tractor According to Tillage Type and Gear Selection during Rotary Tillage Operation" Agriculture 13, no. 8: 1556. https://doi.org/10.3390/agriculture13081556
APA StyleKim, Y.-S., Bae, B.-M., Kim, W.-S., Kim, Y.-J., Lee, S.-D., & Kim, T.-J. (2023). Working Load Analysis of a 42 kW Class Agricultural Tractor According to Tillage Type and Gear Selection during Rotary Tillage Operation. Agriculture, 13(8), 1556. https://doi.org/10.3390/agriculture13081556