Abstract
Some wheat cultivars show a linear relationship between grain protein concentration (GPC) and baking volume, but others display a saturation curve. Such a saturation curve could be general, but in some cultivars it might only appear at GPC > 17%. However, such GPC is mostly not achieved in the field. Pot experiments with high nitrogen application reliably result in GPC > 17%. In a pot experiment with a high (N1) and an excessive N level (N2) and four cultivars (Akteur, Arnold, Discus and Hystar), the change in grain protein composition and the relationship between different protein fractions and baking volume at GPC > 17% was investigated. GPC ranged from 17 to 24% and mean nitrogen content per grain from 1.2 to 1.8 mg. The N2 treatment increased GPC and mean nitrogen content per grain in the Akteur and Discus cultivar, but not in Arnold and Hystar. N2 increased concentration of gliadin by 10 to 34% and glutenin macropolymer (GMP) in all cultivars by 12 to 73%. Glutenin concentration was increased by N2 in Akteur and Discus (19 to 36%), but was decreased by N2 in the Arnold and Hystar cultivar. Baking volume was moderately increased by N2 in all cultivars by 6 to 9% and correlated significantly with most glutenin fractions in the Akteur and Discus cultivar, with GMP in Arnold and with HMW-GS to LMW-GS ratio in Hystar. Thus, specific effects on grain protein by N2 were responsible for the increased baking volume in each cultivar. However, as gliadin and its sub-fractions hardly correlated with baking volume, a positive effect of increasing gliadin proteins on baking quality was not obvious.
1. Introduction
Wheat (Triticum aestivum L.) is one of the most important food crops in the world [1]. Bread wheat is characterized by a uniquely good baking quality and thus a large part of wheat grain is processed to obtain baked products. However, the requirements for grain quality in the baking industry are high. Grain protein concentration (GPC) is used as the main indicator of baking quality, where a linear relationship between GPC and baking volume is assumed when trading. Recent studies showed, however, that although there is a strong correlation between GPC and baking volume at low GPC, that correlation becomes weaker for several cultivars at GPC > 12% [2,3].
In addition to GPC, grain protein composition is important for baking quality [4,5]. The grain proteome of wheat can be classified into three main fractions: albumins/globulins (ALGL), glutenins (GLUT) and gliadins (GLIA). Whereas ALGL are proteins that are considered unimportant for baking, GLUT are responsible for the elasticity and stability and GLIA for the viscosity of the dough. GLUT are composed of large disulfide-linked aggregates of different subunits of high (HMW-GS) and of low molecular weight (LMW-GS). HMW-GS make up about 30% and LMW-GS 60% of GLUT aggregates [6]. Both fractions contribute to the elasticity and stability of the dough, but about twice the amount of LMW-GS is needed to have the same effect compared to HMW-GS [7]. Recent rheological work showed that HMW-GS, LMW-GS and GLIA behave and interact differently in soft and durum wheat doughs [8]. According to molecular weight and amino acid composition, HMW-GS can be divided into an x- and y-type of which, depending on cultivar, three to five subunits are expressed, and within LMW-GS fractions D, B and C are distinguished [9]. Moreover, GLUT can be classified into an SDS-soluble fraction with relatively low and an SDS-insoluble fraction with high molecular weight. The SDS-insoluble fraction consists of spherical GLUT particles [10] and is called glutenin macropolymer (GMP). GLIA are monomers that attach to the GLUT polymers via non-covalent bonds [11]. GLIA are divided into sulfur (S)-poor ω-GLIA with high molecular weight and S-rich, γ- and α-GLIA with lower molecular weight.
Nitrogen (N) supply (e.g., 60 or 80 kg N ha−1 at booting) and cultivar strongly determine the content and composition of grain protein and thereby baking quality [12,13,14]. However, it is still unclear what changes in protein composition, induced by N supply, are associated with an improvement or a decline in baking quality. For instance, a field study indicated that an increase of the proportion of HMW-GS and ω-GLIA and a decrease of that of LMW-GS and α-/γ-GLIA of grain protein lead to an increased baking volume [13]. In contrast, in another field study, baking volume was positively associated with an increased LMW- to HMW-GS and GLIA to HMW-GS ratio [4]. According to [3] at a high GPC level, baking volume is positively associated with GLUT concentration, whereas an increase of GLIA concentration downgrades protein baking quality.
The correlation between GPC and baking volume decreases markedly, when GPC exceeds 12% in several cultivars [2,3]. According to Bekes [15], this is due to a saturation effect in the relationship between baking volume and GPC. Nevertheless, other cultivars such as Akteur and Discus still showed a linear baking volume and GPC relationship in the high GPC area from 12% to 17% [3,16]. Single grain weight can affect GPC markedly [17], and one variable that describes the grain N status regardless of single grain weight is mean N content per grain. Under field conditions, it appears that the maximum achievable N content per grain is around 1 mg [17,18]. Therefore, in some cultivars, a saturation effect in the relationship between baking volume and GPC might only occur or become visible if mean N content per grain clearly exceeds 1 mg.
In this work, four wheat cultivars were grown in a pot experiment with a high and an excessive N level, to obtain high GPC and to investigate the relationship between these high GPC levels and baking volume. Pot experiments were chosen, because in contrast to field grown wheat, a GPC up to 22 % can reliably achieved with such a system [19]. The cultivars used were one from the German quality group E with excellent baking quality (Akteur), one from quality group A with good baking quality (Discus), an Austrian protein-rich cultivar (Arnold; Austrian baking quality group 8) and a hybrid cultivar (Hystar, German quality group B). The following research questions were addressed: (i) how grain protein composition is changed by N supply when GPC exceeds 17%, (ii) whether baking volume is increasable at GPC > 17%, and (iii) which protein fractions correlate with baking volume at the very high GPC levels above 17%.
2. Material and Methods
2.1. Plant Cultivation
The experiment consisted of four winter wheat cultivars (Akteur, Arnold, Discus and Hystar), two N fertilizer treatments with a high (2.2 g N pot−1) and an excessive level (4.3 g N pot−1), respectively, and 6 pots (replications) per cultivar × N fertilizer combination.
The plants were grown from 27 November 2019 to 25 July 2020 in Mitscherlich pots in an open greenhouse at the University of Hohenheim (Stuttgart). Each pot was filled with 6 kg of dry topsoil and 500 mL of water and then 21 seeds were sown at a depth of 2–3 cm and the soil surface was covered with sand. All plants of each cultivar had reached the first leaf stage (EC10, according to Meier et al. [20]) on 10 December 2019. The number of plants in each pot was reduced to 12 in the middle of tillering. N fertilization was conducted with ammonium nitrate and was split over several growth stages according to Table 1. At each growth stage, the corresponding amount of ammonium nitrate was dissolved in 5 L of water and 100 mL of this solution was applied to each pot. At the beginning of stem elongation (EC39), the plants received an additional 1.2 g calcium, 1.8 g potassium, 0.2 g magnesium, 0.9 g phosphorus and 0.2 g sulfur per pot. The plants were irrigated to avoid drought stress and an insecticide treatment (dimethoat, 1 L ha−1) was conducted in June. Moderate infestations with Blumeria graminis occurred in the cultivar Hystar from middle of June, but this was not treated with fungicides. The degree of infestation did not differ between the two N levels.

Table 1.
Time course and quantities of N fertilization.
2.2. Determination of Yield Variables, and Grain N and S Concentration
The plants were harvested at grain maturity on July 25 and the harvested ears were dried at 35 °C for two weeks. Then, the grains were threshed out of the ears followed by determination of grain yield and thousand grain weight (TGW) using a seed counter (CONTADOR, Pfeuffer, Kitzingen, Germany).
Grain N and S concentration was measured according to ICC Standard No. 167 [21] (Dumas method) by the use of a Variomax CNS-analyzer (Elementar Analysesysteme, Langenselbold, Germany) and protein concentration was calculated by multiplying grain N concentration by the conversation factor of 5.7.
2.3. Quantification of Grain Protein Sub Fractions
2.3.1. Osborne Fractionation
An aliquot of 10 g of grains were first ground in an analytical mill (A10, IKA, Germany) and then in a ball mill (MM301, Retsch, Haan, Germany). ALGL, GLIA and GLUT were stepwise extracted from 100 mg of whole grain flour according to Wieser and Seilmeier [22]. The concentrations of the protein fractions were determined photometrically with ALGL, GLIA and GLUT standards, respectively, according to Dier et al. [2]. The ALGL, GLIA and GLUT standards were prepared according to Schalk et al. [23] and were provided by Professor Katharina Scherf (Karlsruhe Institute of Technology, Karlsruhe, Germany).
2.3.2. SDS-PAGE
The GLIA and GLUT fraction were separated using discontinuous SDS-PAGE with a Dual Cooled Vertical Unit (SE600, Hoefer, Taufkirchen, Germany) with polyacrylamide gels with the size of 16 × 18 cm. The separation gel (12% polyacrylamide; 1.5 mol/L Tris-Base, pH 8.8; 0.1% SDS) covered about three quarters of the gel area and the stacking gel (3% polyacrylamide; 0.5 M Tris-Base, pH 6.8; 0.1% SDS) the remaining area. The gels were loaded with 12 µg GLIA in 35 µL sample buffer (20% glycerol; 2% SDS; 2.5% ß-mercaptoethanol; 50 mmol/L Tris-HCl, pH 6.8; bromophenol blue) and 12 µg GLUT in 25 µL sample buffer. This was done after the mixture of protein and sample buffer was incubated for 5 min at 95 °C for the purpose of protein denaturation. On each gel, a protein standard (Protein-Marker II, VWR Peqlab) was applied. The running conditions were at 18 °C 400 V for 90 min and then 480 V for 120 min. After the run, the gels were fixed in 40% ethanol and 10% acetic acid for overnight, stained with hot Coomassie R 250 for 30 min and de-stained with 1% acetic acid for 48 h. One technical gel replication was used.
2.3.3. Quantification of GLIA and GLUT Fractions
The gels were scanned in a transmission and grayscale mode (300 dpi, 16 bits per pixel) and were analyzed with the freely available software Gel Analyzer 19.1 [24]. The bands were detected automatically or manually. Correction of the background was made using the morphological method. Afterwards, the proportion of each band in the total protein was calculated, followed by summing the proportions of the individual bands up to certain GLIA and GLUT fractions according to Shewry et al. [25] and as illustrated in Figure 1. Finally, the proportions of the individual subfractions of GLIA and GLUT were converted to absolute values using the data originating from the protein determination of the total GLIA and GLUT fractions.
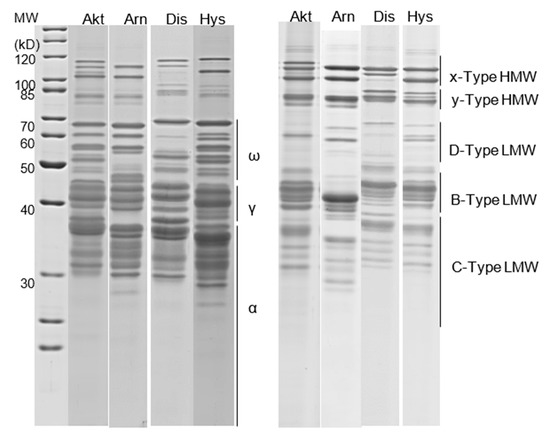
Figure 1.
Separation of the GLIA (left) and GLUT fraction (right) by SDS-PAGE. Each line represents the band pattern of a cultivar (Akt, Akteur; Arn, Arnold; Dis, Discus; Hys, Hystar) grown at the high N level. The lines indicate the protein bands that were combined into the GLIA fractions ω, γ and α and into the GLUT fractions x- and y-type HMW-GS and D-, B- and C-type LMW-GS.
2.4. Quantification of GLUT Macropolymer
GLUT macropolymer were extracted from 100 mg of wholemeal flour and analyzed by SEC-HPLC according to Thanhaeuser et al. [26]. PWG-GLIA (DIGeFa GmbH, Detmold, Germany), ref. [27] was used as calibration standard in the SEC-HPLC analysis.
2.5. Micro-Scale Baking Tests
Micro-scale baking tests were conducted according to Rekowski et al. [12] with some modifications, as well as the use of ascorbic acid as (0.002%) as a flour improver, kneading in a promylograph (Labortechnik Egger, Altenbach, Austria) for 2 min and proofing at 32 °C for 50 min.
2.6. Statistical Analysis
Two-way analysis of variance (ANOVA) was implemented with SAS proc mixed (version 9.4) and mean comparison by least squares differences (LSD) test with SAS (version 9.4) proc glimmix. Regardless of the two-way ANOVA result, the single means of each cultivar × N combination were compared for each variable by LSD test. If the p-value was smaller than 0.05, then the mean values were regarded as significantly different. Pearson correlation coefficients were calculated with SAS proc corr.
3. Results
3.1. Grain Yield, Grain Protein Concentration and Mean N and S Content per Grain
Grain yield was higher in the Discus and Hystar than in the Akteur and Arnold cultivar, but thousand grain weight (TGW) was the same among the cultivars (Table 2 and Table 3). As shown by two-way ANOVA (Table 2), excessive N supply (N2) did not significantly influence grain yield, but significantly (p < 0.05) decreased TGW. Nevertheless, the cultivar Arnold showed increased grain yield under N2 (Table 3). TGW was reduced at N2 by 3 to 7% (Table 3).
Table 2.
Two-way ANOVA result of the effect of cultivar and excessive N supply on grain yield, thousand grain weight (TGW), grain protein concentration (GPC), N and S content per grain, grain N to S ratio, concentration of different grain protein fractions and ratios between different protein fractions. *, p < 0.05; **, p < 0.01; ***, p < 0.001; ns, not significant (p ≥ 0.05).
Table 3.
Effect of excessive N supply (N2) and cultivar on grain yield, thousand grain weight (TGW), grain protein concentration (GPC), mean N and S content per grain, and N to S ratio (N:S) in four wheat cultivars. Means are presented. Different letters indicate significant differences (p < 0.05). Percent difference (%) between N1 and N2 is given.
GPC ranged from 16.6% to 23.9%, mean N contents per grain from 1.21 mg to 1.78 mg, and mean S contents per grain from 0.066 mg to 0.101 mg. The first two variables were significantly increased by N2 in the Akteur and Discus cultivar, but not in Arnold and Hystar (Table 2 and Table 3). The cultivars Akteur and Arnold had a higher maximum mean N content per grain (~1.7 mg) than Discus and Hystar (~1.4 mg). Grain N to S ratio ranged from 15.4 to 18.0 and was significantly (p < 0.05) increased by N2 in the cultivars Akteur und Discus, but was not different in Arnold and Hystar.
3.2. Concentration of Grain Protein Fractions and GMP
Cultivar differences in ALGL concentration were relatively small. In contrast, there were strong differences between the cultivars in the concentrations of GLIA, GLUT and GMP and their subfractions. (Table 2 and Figure 2).
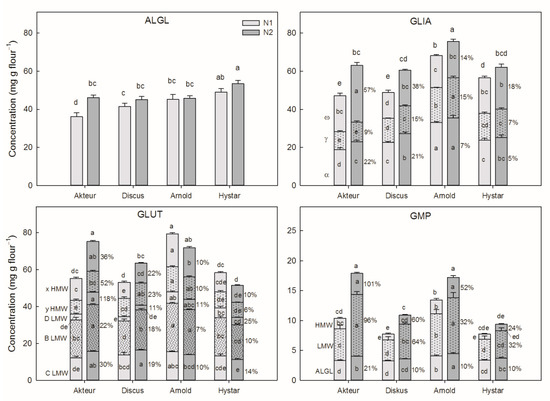
Figure 2.
Effect of N2 and cultivar on ALGL concentration, and on concentration of the fractions of GLIA, GLUT and GMP. On the left side of the diagrams, it is indicated which protein fractions belong to which bar section. The numbers indicate the effect of N2 (in percent) on the different fractions. The cultivar names are displayed on the x-axis. Different letters indicate significant differences (p < 0.05) (within the bar sections between the individual fraction means and on the bars between total concentrations). Error bars (S.E.M) for the fraction means are displayed.
Except for Akteur, with a marked increase, N2 hardly influenced ALGL concentration in the other cultivars. Concentrations of all GLIA fractions were increased by N2 in all cultivars, with a stronger increase of ω-GLIA (18–57%) than γ- (7–15%) and α-GLIA (5–22%) in the Akteur, Discus and Hystar cultivar. GLUT concentration markedly increased at N2 in Akteur and Discus with significant increases of all but one GLUT fraction. The exception was that the concentration of D-type LMW-GS in Discus was not significantly affected. In contrast, concentration of GLUT and all its subfractions decreased at N2 in the Arnold and Hystar cultivar, but only the decrease in x-type HMW-GS in Arnold being significant.
The GMP fraction consisted mostly of LMW-GS followed by ALGL and HMW-GS. At N2, the GMPs were increased in all cultivars, but the magnitude of increase was considerably smaller and not significant in the Hystar cultivar. The increase was stronger in LMW- and HMW-GS fractions compared to the ALGL fraction.
3.3. Ratios between Different Gluten Fractions
There were marked cultivar differences when comparing ratios of different gluten fractions (Table 4).
Table 4.
Effect of N2 on gliadin to glutenin ratio (GLIA: GLUT), gliadin to HMW-GS ratio (GLIA: HMW), HMW- to LMW-GS ratio (HMW: LMW), x- to y-type HMW-GS ratio, and HMW-GS to LMW-GS ratio within GMP. Different letters indicate significant differences (p < 0.05). Percent difference (%) between N1 and N2 is given.
In the Arnold and Hystar cultivar at N2, the GLIA to GLUT ratio and the GLIA to HMW-GS ratio were significantly increased, whereas in Akteur and Discus, the same parameters did not change between N1 and N2 (Table 2 and Table 4). The ratio between HMW-GS and LMW-GS and the ratio between x- and y-type HMW-GS was significantly increased from 0.54 to 0.58 and decreased from 1.59 to 1.42, respectively, by N2 in Akteur, although no N and cultivar × N effect was detected for the former variable by two-way ANOVA (Table 2). The Arnold cultivar was the only cultivar with a significant increase at N2 for the ratio of HMW- to LMW-GS originating from the GMP analysis.
3.4. Baking Volume
Baking volume was highest in the Akteur followed by the Arnold and then by the Discus and Hystar cultivar (Figure 3A).
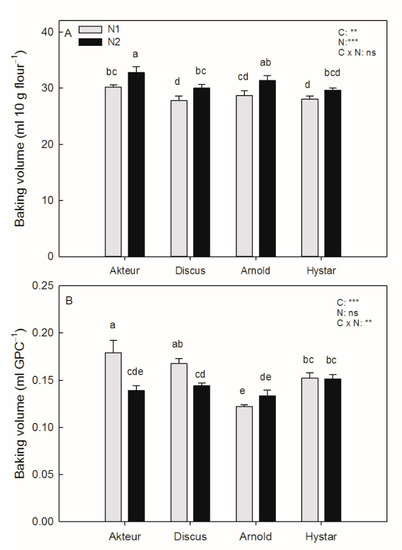
Figure 3.
Effect of N2 and genotype on baking volume (A) and baking volume per GPC (B) (mean + S.E.M). The cultivar names are displayed on the x-axis. Different letters indicate significant differences (p < 0.05). Two-way ANOVA results are given on the top right: **, p < 0.01; ***, p < 0.001; ns, not significant (p ≥ 0.05).
Baking volume was increased at N2 in all cultivars by 6% to 9%, but the LSD test resulted in a significant N effect for Akteur, Discus and Arnold only. Baking volume per GPC decreased strongly by N2 in the Akteur and Discus cultivar (Figure 3B), where GPC increased under N2 (Table 3). In Arnold, where GPC was not affected by N2, baking volume per GPC was slightly increased by N2.
3.5. Effect of Grain Protein Fractions on Baking Volume
In the Akteur and Discus cultivar, where N2 increased GPC (Table 3), concentrations of total GLUT and almost all GLUT fractions correlated positively with baking volume (Table 5). In contrast, with the exception of the relatively weak correlation of total GLIA and ω-GLIA in Discus, the concentration of total GLIA and all other GLIA fractions did not correlate with baking volume in the other cultivars. Moreover, there were negative correlations between baking volume and the ratio of GLIA to GLUT in Akteur and the ratio of GLIA to HMW in the Akteur and Discus cultivar.
Table 5.
Pearson correlation coefficients between baking volume and GPC, N to S ratio of the grain, amount of the different grain protein fractions, and ratios between different grain protein fractions. Asterisks and bold numbers indicate significant correlations (*, p < 0.05; **, p < 0.01; ***, p < 0.001).
For Arnold and Discus, there were positive correlations between baking volume and GMP concentration as well as GMP to GPC ratio, but for Discus these correlation coefficients were lower compared to those of most GLUT fractions with baking volume. Moreover, there was a positive correlation between baking volume and HMW-GS to LMW-GS ratio (r = 0.66) as well as GMP concentration (r = 0.61) in Hystar.
4. Discussion
The N fertilization shortly before or at anthesis is used to raise GPC and thereby baking quality. However, the effectiveness of this late N fertilization can be limited by restricted grain N uptake under field conditions [17] or low correlation between GPC and baking volume at high GPC [3]. In this pot experiment, very high GPC values of over 17% were studied in four cultivars. In particular, (i) the change of protein composition, (ii) whether baking volume still increases with rising GPC, and (iii) which protein fractions correlate with baking volume at GPC ≥ 17% were investigated.
The GPC (17–24%) and N content per grain (1.2 mg–1.8 mg) of this pot experiment were clearly above the values of 8–17% and 0.6 mg–1.0 mg usually achieved in field experiments [3,17,18]. This suggests that under field conditions, GPC is limited by the ability of the plant to take up or to supply the grains with N (source limitation), as other studies have suggested [28,29]. In the present study, however, although the excessive N treatment (N2) increased GPC and N content per grain in the Akteur and Discus cultivar, N2 did not change these variables in Arnold and Hystar, suggesting that GPC was limited by the grain sink capacity for N uptake at least in the Arnold and Hystar cultivar. Interestingly, the sink capacity was obviously larger in Akteur and Arnold (~1.7 mg N per grain) than in the Discus and Hystar cultivar (~1.4 mg N per grain). However, compared to the grain sink capacity, the plant’s ability to take up N and to partition this N to grains is of greater importance for GPC. This process was obviously more efficient in the Arnold and Hystar cultivar than in Akteur and Discus, as in the former cultivars the grain sink capacity was obviously reached in the N1 treatment.
The N2 treatment increased GLIA concentration and the proportion of ω-GLIA in grain protein, which is consistent with other studies covering GPC < 17% (e.g., [22,30]). However, while N2 increased GLUT concentration in the Akteur and Discus cultivar, N2 reduced GLUT concentration, though not significantly, in Arnold and Hystar. In the Arnold and Hystar cultivar, the grain N sink-capacity was probably reached earlier during grain filling under N2 than under N1 due to the much higher N availability. Triboi et al. [31] showed that accumulation of GLUT in the grain starts earlier than that of GLIA, but an increase in N supply at anthesis under low N availability pre-anthesis increases the rate of GLIA accumulation more than twice than that of GLUT. Thus, in Arnold and Hystar under N2, more GLIA than GLUT was probably accumulated until the grain sink capacity was reached. However, in the other cultivars, the GLIA to GLUT ratio was not changed by N2, possibly because initially faster accumulation of GLIA was matched by longer lasting GLUT synthesis during grain development.
In the present study, ratio of GLIA to GLUT ranged from 0.84 to 1.21, and these values are consistent with those (0.77–1.10) obtained with the same method in a two-year field study with the wheat cultivar Batis and three highly contrasting N levels [2]. However, based on RP-HPLC analysis, in other studies, similar ratios (0.9–1.9) [32] and much higher GLIA to GLUT ratios (2.0 to 3.2) [33,34] were found in modern wheat cultivars. These differences in the GLIA to GLUT ratio suggest an influence of protein extraction procedures in different laboratories or an effect of the analytical method in determining GLIA and GLUT.
In accordance with Pechanek et al. [35] and Pronin et al. [34], there were clear cultivar differences in GLUT (and GLIA) composition, such as between the HMW-GS to LMW-GS ratio or the x- to y-type HMW-GS ratio. Moreover, N2 increased the proportion of D-type LMW-GS and decreased the ratio of x- to y-type HMW-GS only in Akteur and increased the ratio of HMW-GS to LMW-GS in GMP only in Arnold. Change of GLUT composition by N supply also seems to be cultivar-specific in studies with GPC < 17% [22,35,36]. For instance, in a field study, increased N supply decreased HMW-GS to LMW-GS ratio in the cultivar Rinconada, but not in Bancal [36], and in another field experiment increased N supply decreased the x- to y-type HMW-GS ratio in two out of three cultivars [35].
Although GLUT concentration was decreased in the Arnold and Hystar cultivar, GMP concentration was increased by the N2 treatment, in all genotypes (not significant in Hystar) (Figure 2). Yue et al. [14] found that the effect of N supply on final GMP concentration is strongly associated with the N effect on initial rate of HMW-GS accumulation. Thus, it is conceivable that final GMP concentration is mainly influenced by N supply at relative early grain filling, which might explain the increase of GMP concentration by N2 also in Arnold and Hystar.
Some modern wheat cultivars, including Akteur and Discus, show a linear relationship between GPC and baking volume at a GPC of 8% to 17%, usually achieved under field conditions [3,16]. However, other cultivars show a curvilinear relationship with a weak or even no correlation between GPC and baking volume at high GPC (11%–17%) [2,3]. According to Bekes [15], the reason for such a curvilinear relationship is a saturation effect in the baking volume and GPC relationship. Accordingly, there could be a saturation effect for each cultivar, but for some, such as Akteur, this might only occur at very high GPC > 17%. In the present study, baking volume was increased by N2 in all cultivars, though not significantly for Hystar. For Akteur and Discus, where GPC increased with N2, this result suggests that in these cultivars baking volume increases with GPC up to the maximal achievable GPC of ~24% and ~21%, respectively. However, considering N2, the relatively small increase of baking volume by 6 to 9% and the strong decrease of baking volume per GPC indicate that the gain of GPC was not efficiently converted to baking quality. In Arnold, on the other hand, N2 slightly increased baking volume per GPC, indicating that, here, a change in protein composition at N2 led to improved baking quality.
In the Akteur and Discus cultivar, baking volume correlated with the concentration of most GLUT fractions. However, baking volume correlated only slightly with GLIA and ω-GLIA in Discus, but not with total GLIA or individual GLIA fractions in the other cultivars. This result suggests that at a certain GPC (about 17% in Akteur and Discus), a saturation effect of the GLIA content on baking performance was reached, so that increases in GLIA above this saturation do not improve baking quality, but reduce the conversion efficiency of GPC into baking volume. However, at GPC < 15% baking volume correlated even stronger with fractions of GLIA than those of GLUT in two field studies [4,13]. For example, an increased GLIA to HMW-GS ratio was associated with increased baking volume [4], whereas in the present study, it was the reverse in the Akteur and Discus cultivar. Gabriel et al. [3] proposed that a saturation curve for GLUT concentration and GPC, which occurs in some cultivars [37], might explain a saturation curve for baking volume and GPC. However, this was not confirmed in a field study, in which a saturation curve for baking volume and GPC, but a linear relationship for GLUT concentration and GPC, was found [2].
GMP concentration showed a close correlation with baking volume (r = 0.80) in a study with 13 cultivars exhibiting a narrow GPC range (8–11%) [26]. In the present study, cultivar differences in the importance of GMP on baking quality were detected, even when the reduction of GLUT concentration by N2 in the Arnold and Hystar cultivar might distort this result to some degree. While GMP content was the only apparent reason for the increased baking volume in Arnold, GMP content was secondary for Akteur and Discus. In Hystar, baking volume correlated more strongly with HMW to LMW-GS ratio than with GMP.
Author Contributions
Conceptualization, M.D. and C.Z.; data curation, M.D., A.H. and S.M.; formal analysis, M.D.; investigation, M.D.; methodology, M.D., A.H. and S.M.; supervision, C.Z.; visualization, M.D.; writing—original draft, M.D.; writing—review and editing, G.L. and M.D. All authors have read and agreed to the published version of the manuscript.
Funding
This research was funded by the Deutsche Forschungsgemeinschaft (DFG) (grant no. DI 2893/1–1).
Institutional Review Board Statement
Not applicable.
Data Availability Statement
The data presented in this study are available on request from the corresponding author.
Acknowledgments
Christiane Beierle and Fiona Ott are acknowledged for excellent technical assistance in the protein analytics and Nikolaus Merkt and Melissa Kleb for help in the plant cultivation. We are grateful to Hans Grameier and Norbert Ruhland for performing the baking tests.
Conflicts of Interest
The authors declare no conflict of interest.
References
- Shewry, P.R.; Hey, S.J. The contribution of wheat to human diet and health. Food Energy Secur. 2015, 4, 178–202. [Google Scholar] [CrossRef] [PubMed]
- Dier, M.; Hüther, L.; Schulze, W.X.; Erbs, M.; Köhler, P.; Weigel, H.J.; Zörb, C. Elevated atmospheric CO2 concentration has limited effect on wheat grain quality regardless of nitrogen supply. J. Agric. Food Chem. 2020, 68, 3711–3721. [Google Scholar] [CrossRef] [PubMed]
- Gabriel, D.; Pfitzner, C.; Haase, N.U.; Hüsken, A.; Prüfer, H.; Greef, J.M.; Rühl, G. New strategies for a reliable assessment of baking quality of wheat–Rethinking the current indicator protein content. J. Cereal Sci. 2017, 77, 126–134. [Google Scholar] [CrossRef]
- Rossmann, A.; Buchner, P.; Savill, G.P.; Hawkesford, M.J.; Scherf, K.A.; Mühling, K.H. Foliar N application at anthesis alters grain protein composition and enhances baking quality in winter wheat only under a low N fertiliser regimen. Eur. J. Agron. 2019, 109, 125909. [Google Scholar] [CrossRef]
- Zörb, C.; Ludewig, U.; Hawkesford, M.J. Perspective on Wheat Yield and Quality with Reduced Nitrogen Supply. Trends Plant Sci. 2018, 23, 1029–1037. [Google Scholar] [CrossRef]
- Lafiandra, D.; Shewry, P.R. Wheat Glutenin polymers 2, the role of wheat glutenin subunits in polymer formation and dough quality. J. Cereal Sci. 2022, 106, 103487. [Google Scholar] [CrossRef]
- Wieser, H.; Kieffer, R. Correlations of the amount of gluten protein types to the technological properties of wheat flours determined on a micro-scale. J. Cereal Sci. 2001, 34, 19–27. [Google Scholar] [CrossRef]
- Bonilla, J.C.; Erturk, M.Y.; Kokini, J.L. Understanding the role of gluten subunits (LMW, HMW glutenins and gliadin) in the networking behavior of a weak soft wheat dough and a strong semolina wheat flour dough and the relationship with linear and non-linear rheology. Food Hydrocoll. 2020, 108, 106002. [Google Scholar] [CrossRef]
- Gianibelli, M.C.; Larroque, O.R.; MacRitchie, F.; Wrigley, C.W. Biochemical, genetic, and molecular characterization of wheat endosperm proteins. Cereal Chem. 2001, 78, 635–646. [Google Scholar] [CrossRef]
- Don, C.; Lookhart, G.; Naeem, H.; MacRitchie, F.; Hamer, R.J. Heat stress and genotype affect the glutenin particles of the glutenin macropolymer-gel fraction. J. Cereal Sci. 2005, 42, 69–80. [Google Scholar] [CrossRef]
- Shewry, P.R.; Popineau, Y.; Lafiandra, D.; Belton, P. Wheat glutenin subunits and dough elasticity: Findings of the EUROWHEAT project. Trends Food Sci. Technol. 2000, 11, 433–441. [Google Scholar] [CrossRef]
- Rekowski, A.; Wimmer, M.A.; Henkelmann, G.; Zörb, C. Is a change of protein composition after late application of nitrogen sufficient to improve the baking quality of winter wheat? Agriculture 2019, 9, 101. [Google Scholar] [CrossRef]
- Rossmann, A.; Scherf, K.A.; Rühl, G.; Greef, J.M.; Mühling, K.H. Effects of a late N fertiliser dose on storage protein composition and bread volume of two wheat varieties differing in quality. J. Cereal Sci. 2020, 93, 102944. [Google Scholar] [CrossRef]
- Yue, H.; Jiang, D.; Dai, T.; Qin, X.; Jing, Q.; Cao, W. Effect of nitrogen application rate on content of glutenin macropolymer and high molecular weight glutenin subunits in grains of two winter wheat cultivars. J. Cereal Sci. 2007, 45, 248–256. [Google Scholar] [CrossRef]
- Békés, F. New aspects in quality related wheat research: II. New methodologies for better quality wheat. Cereal Res. Commun. 2012, 40, 307–333. [Google Scholar] [CrossRef][Green Version]
- Henkelmann, G.; Volkheimer, B.; Zörb, C.; von Tucher, S.; Haase, N.U. Backversuche im Vergleich: Rapid-Mix-Test, Mikro- und Kleinbackversuch. Getreide Mehl Brot. 2020, 2, 50–57. [Google Scholar]
- Dier, M.; Sickora, J.; Erbs, M.; Weigel, H.J.; Zörb, C.; Manderscheid, R. Positive effects of free air CO2 enrichment on N remobilization and post-anthesis N uptake in winter wheat. Field Crops Res. 2019, 234, 107–118. [Google Scholar] [CrossRef]
- Gooding, M.J.; Gregory, P.J.; Ford, K.E.; Ruske, R.E. Recovery of nitrogen from different sources following applications to winter wheat at and after anthesis. Field Crops Res. 2007, 100, 143–154. [Google Scholar] [CrossRef]
- Terman, G.L. Yields and Protein Content of Wheat Grain as Affected by Cultivar, N, and Environmental Growth Factors 1. Agron. J. 1979, 71, 437–440. [Google Scholar] [CrossRef]
- Meier, U.; Bleiholder, H.; Buhr, L.; Feller, C.; Hack, H.; Hess, M.; Klose, R.; Lancashire, P.D.; Edmunds, B.S.; Stauss, R.; et al. Growth Stages of Mono-and Dicotyledonous Plants. BBCH Monograph; Federal Biological Research Centre for Agriculture and Forestry-Julius Kühn-Institut: Quedlinburg, Germany, 2001; Available online: https://www.julius-kuehn.de/media/Veroeffentlichungen/bbch%20epaper%20en/page.pdf (accessed on 20 January 2021).
- ICC 167-2000; Determination of Crude Protein in Grain and Grain Products for Food and Feed by the Dumas Combustion Principle. International Association for Cereal Science and Technology: Vienna, Austria, 2000.
- Wieser, H.; Seilmeier, W. The influence of nitrogen fertilisation on quantities and proportions of different protein types in wheat flour. J. Sci. Food Agric. 1998, 76, 49–55. [Google Scholar] [CrossRef]
- Schalk, K.; Lexhaller, B.; Koehler, P.; Scherf, K.A. Isolation and characterization of gluten protein types from wheat, rye, barley and oats for use as reference materials. PLoS ONE 2017, 12, e0172819. [Google Scholar] [CrossRef] [PubMed]
- Available online: http://www.gelanalyzer.com/index.html (accessed on 14 December 2020).
- Shewry, P.R.; Tatham, A.S.; Halford, N.G. Nutritional control of storage protein synthesis in developing grain of wheat and barley. Plant. Growth Regul. 2001, 34, 105–111. [Google Scholar] [CrossRef]
- Thanhaeuser, S.M.; Wieser, H.; Koehler, P. Correlation of quality parameters with baking performance of wheat flours. Cereal Chem. 2014, 91, 333–341. [Google Scholar] [CrossRef]
- Van Eckert, R.; Berghofer, E.; Ciclitira, P.J.; Chirdo, F.; Denery-Papini, S.; Ellis, H.J.; Ferranti, P.; Goodwin, P.; Immer, U.; Wieser, H.; et al. Towards a new gliadin reference material–isolation and characterisation. J. Cereal Sci. 2006, 43, 331–341. [Google Scholar] [CrossRef]
- Martre, P.; Porter, J.R.; Jamieson, P.D.; Triboï, E. Modeling grain nitrogen accumulation and protein composition to understand the sink/source regulations of nitrogen remobilization for wheat. Plant. Physiol. 2003, 133, 1959–1967. [Google Scholar] [CrossRef]
- Martre, P.; Jamieson, P.D.; Semenov, M.A.; Zyskowski, R.F.; Porter, J.R.; Triboi, E. Modelling protein content and composition in relation to crop nitrogen dynamics for wheat. Eur. J. Agron. 2006, 25, 138–154. [Google Scholar] [CrossRef]
- Wan, Y.; Gritsch, C.S.; Hawkesford, M.J.; Shewry, P.R. Effects of nitrogen nutrition on the synthesis and deposition of the ω-gliadins of wheat. Ann. Bot. 2014, 113, 607–615. [Google Scholar] [CrossRef]
- Triboï, E.; Martre, P.; Triboï-Blondel, A.M. Environmentally-induced changes in protein composition in developing grains of wheat are related to changes in total protein content. J. Exp. Bot. 2003, 54, 1731–1742. [Google Scholar] [CrossRef]
- Call, L.; Kapeller, M.; Grausgruber, H.; Reiter, E.; Schoenlechner, R.; D’Amico, S. Effects of species and breeding on wheat protein composition. J. Cereal Sci. 2020, 93, 102974. [Google Scholar] [CrossRef]
- Geisslitz, S.; Wieser, H.; Scherf, K.A.; Koehler, P. Gluten protein composition and aggregation properties as predictors for bread volume of common wheat, spelt, durum wheat, emmer and einkorn. J. Cereal Sci. 2018, 83, 204–212. [Google Scholar] [CrossRef]
- Pronin, D.; Börner, A.; Weber, H.; Scherf, K.A. Wheat (Triticum aestivum L.) breeding from 1891 to 2010 contributed to increasing yield and glutenin contents but decreasing protein and gliadin contents. J. Agric. Food Chem. 2020, 68, 13247–13256. [Google Scholar] [CrossRef]
- Pechanek, U.; Karger, A.; Gröger, S.; Charvat, B.; Schöggl, G.; Lelley, T. Effect of nitrogen fertilization on quantity of flour protein components, dough properties, and breadmaking quality of wheat. Cereal Chem. 1997, 74, 800–805. [Google Scholar] [CrossRef]
- Triboi, E.; Abad, A.; Michelena, A.; Lloveras, J.; Ollier, J.L.; Daniel, C. Environmental effects on the quality of two wheat genotypes: 1. Quantitative and qualitative variation of storage proteins. Eur. J. Agron. 2000, 13, 47–64. [Google Scholar] [CrossRef]
- Godfrey, D.; Hawkesford, M.J.; Powers, S.J.; Millar, S.; Shewry, P.R. Effects of crop nutrition on wheat grain composition and end use quality. J. Agric. Food Chem. 2010, 58, 3012–3021. [Google Scholar] [CrossRef]


Disclaimer/Publisher’s Note: The statements, opinions and data contained in all publications are solely those of the individual author(s) and contributor(s) and not of MDPI and/or the editor(s). MDPI and/or the editor(s) disclaim responsibility for any injury to people or property resulting from any ideas, methods, instructions or products referred to in the content. |
© 2022 by the authors. Licensee MDPI, Basel, Switzerland. This article is an open access article distributed under the terms and conditions of the Creative Commons Attribution (CC BY) license (https://creativecommons.org/licenses/by/4.0/).