Article

Genome-Wide Identification and Expression Analysis of the PIN Auxin Transporter Gene Family in Zanthoxylum armatum DC

Key laboratory of Plant Resource Conservation and Germplasm Innovation in Mountainous Region, Ministry of Education, College of Life Sciences, Institute of Agro-Bioengineering, Guizhou University, Guiyang 550025, China
*
Author to whom correspondence should be addressed.
Agriculture 2022, 12(9), 1318; https://doi.org/10.3390/agriculture12091318
Submission received: 1 August 2022 / Revised: 22 August 2022 / Accepted: 24 August 2022 / Published: 26 August 2022
(This article belongs to the Section Genotype Evaluation and Breeding)

Abstract

:
PIN-formed (PIN) proteins are important auxin carriers that participate in the polar distribution of auxin in plants. In this study, 16 ZaPIN genes were identified from the whole genome of Zanthoxylum armatum DC. The physicochemical properties and structure of PIN proteins were determined, and the gene sequences and promoter regions were analyzed to identify cis-acting elements and conserved motifs. The transcript profiles of ZaPIN genes in different tissues and in response to auxin and gibberellin treatments were also analyzed. A phylogenetic analysis separated the 16 ZaPIN genes into four groups. The ZaPIN genes showed the closest evolutionary relationship to those of Citrus sinensis and the most distant evolutionary relationship to those of Oryza sativa. A cis-element analysis revealed a large number of cis elements in ZaPIN promoter regions related to plant hormones, plant growth and development, and stress stimuli, suggesting that ZaPINs have a wide range of biological activities. Additionally, gene expression profiling revealed that ZaPINs had different expression patterns in nine tissues. Further qRT-PCR analyses revealed that most ZaPINs were upregulated by auxin and gibberellin in young leaves. Our results provide useful information for further structural and functional analyses of the ZaPIN gene family in Z. armatum.

1. Introduction

Auxin plays an important role in plant development, apical dominance, inflorescence development, leaf order, embryo development, main root development, lateral and adventitious root initiation, lupeol synthesis, tropic growth, and vascular tissue differentiation [1,2]. Auxin is mainly synthesized in the shoot apical meristem, young leaves, and developing seeds, and is then transported to other parts of the plant via polar distribution to form a concentration gradient, thereby regulating a series of auxin-related physiological responses [3]. Previous studies found that the concentration gradient of auxin is jointly established by its synthesis and polar transport [4]. Polar auxin transport mainly depends on three auxin transporters: the internal transporter AUXIN1/LIKE-AUX1 (AUX/LAX), the external transporter PIN, and the ATP-binding cassette (ABC) transporters [5,6,7,8].
PINs are plant-specific transmembrane efflux carriers that have redundant functions, and mutation of multiple PINs results in severe growth and differentiation defects [9]. PINs asymmetrically localize in the plasma membrane and organelle membranes. Plasma membrane PINs are polarly distributed in the plasma membrane and transport auxin from the intracellular to extracellular region, thus regulating directional auxin transport within the plant body [10]. Organelle membrane PINs regulate cellular homeostasis [11]. The first PIN to be cloned was PIN1 from Arabidopsis thaliana. The pin1 mutant exhibited defective inflorescence development, lacked cauline leaves and floral organs, and had a pin-head trait [12]. Subsequently, seven more PINs were identified in Arabidopsis [13]. In addition to the in-depth studies of PINs in Arabidopsis, other studies have identified and cloned PIN gene families in diverse plant species, including rice [9], maize [14], wheat [15], poplar [16], soybean [17], cotton [18], tobacco [19], and potato [20]. ChPIN1 is involved in the promotion of young leaf growth in Cardamine hirsuta [21]. OsPIN2 is expressed in the epidermal and cortical cells of rice roots and controls root configuration and geotropism responses [22]. In tomato, SlPIN1 negatively regulates auxin accumulation in the ovary and also participates in flower abscission [23]. In Nicotiana tabacum, the expression of NtPIN4 is induced by auxin and its encoded protein participates in auxin-dependent branching by negatively regulating the growth of axillary buds [19].
Zanthoxylum armatum DC belongs to the Rutaceae family and has a long history of use as a food and medicine in Asia, America, and Africa [24]. In addition to the fruit husk, the seeds, roots, leaves, and other parts of Z. armatum are used as traditional medicines [25]. Previous research on Zanthoxylum focused on its cultivation and medicinal uses, but relatively few studies focus on the functions of its genes. In this study, the PIN gene family members of Z. armatum DC were identified, their expression patterns determined, and gene structures and promoter cis-acting elements analyzed. The physicochemical properties and structures of the encoded proteins, and their phosphorylation sites, phylogenetic relationships, and conserved structural domains were also determined. The results of this study provide a rationale for further analyses of ZaPIN functions, and provide a reference for further studies on this family in other plants.

2. Materials and Methods

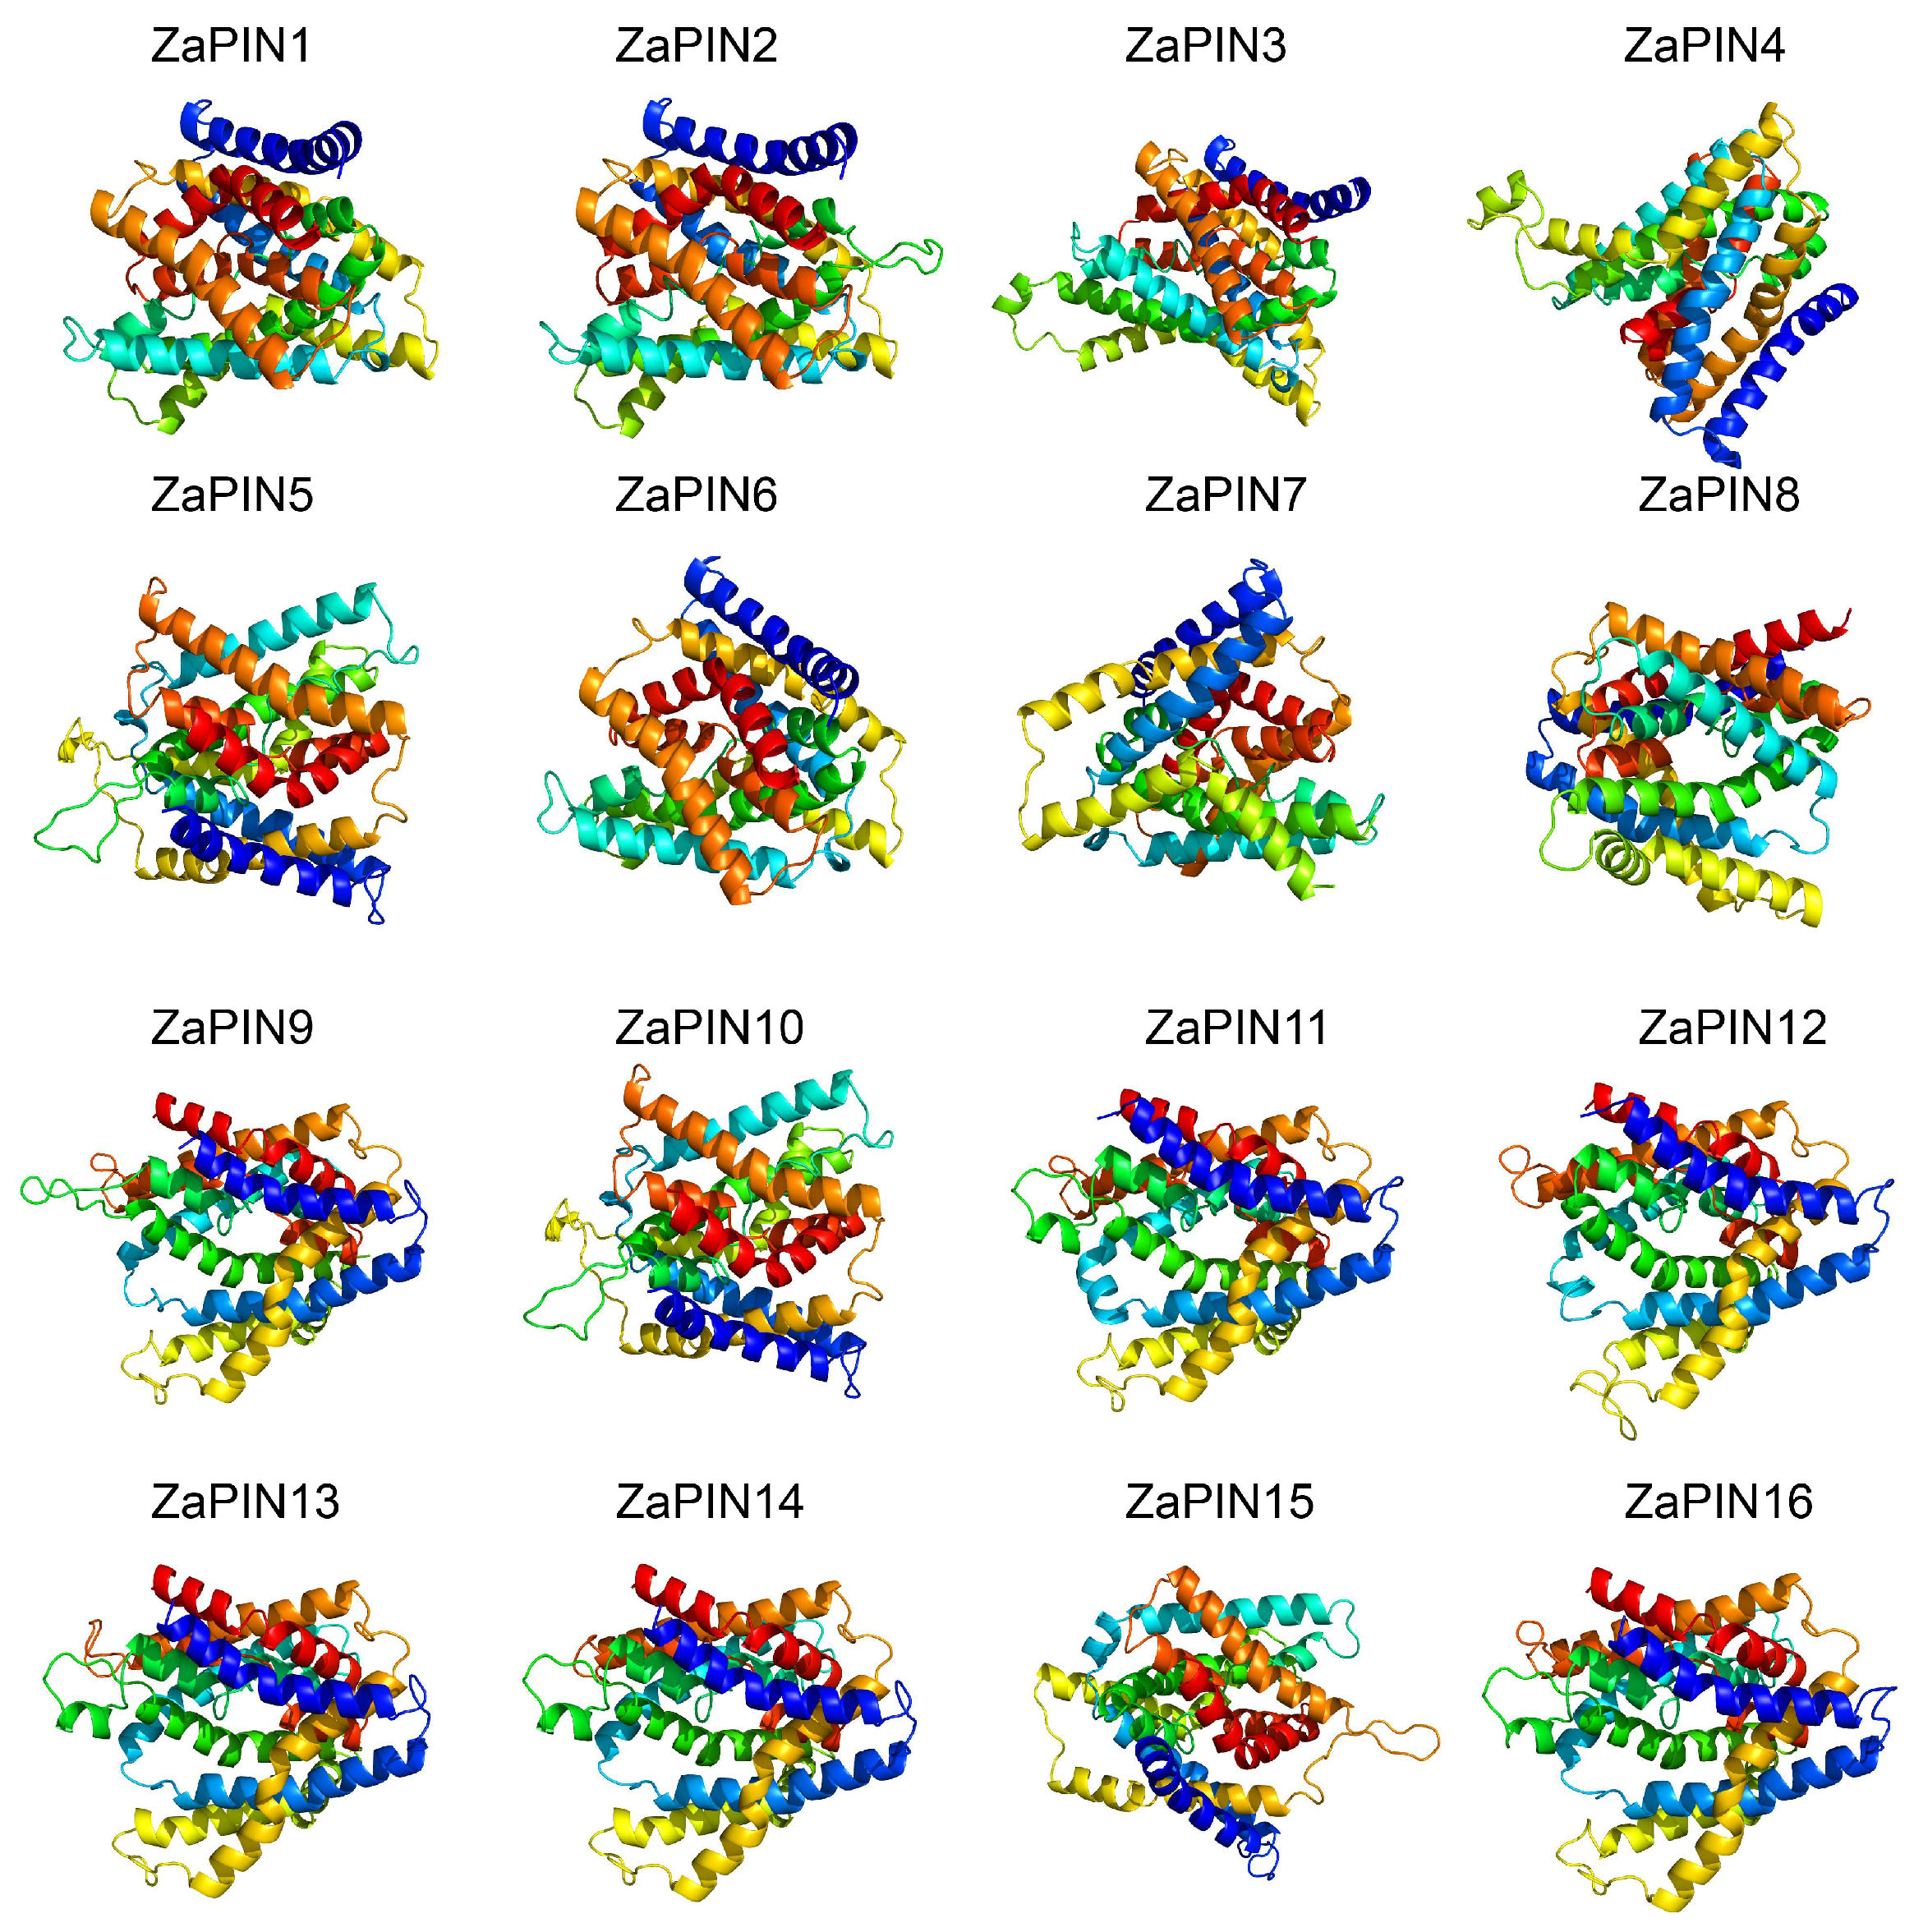
2.1. Physicochemical Characteristics, Subcellular Localization, and Three-Dimensional Structure Analysis

The nucleotide sequences of PIN genes in Z. armatum and the amino acid sequences of their encoded proteins were retrieved from the Z. armatum genome database (https://doi.org/10.1111/1755-0998.13449 accessed on 6 November 2021) [26]. The Hidden Markov Model (HMM) [27] of the PIN domain (PF03547) was downloaded from the Pfam database (http://pfam.xfam.org/ accessed on 10 November 2021). After initial screening and identification using the HMMER software [28], tools on the NCBI CDD [29] (https://www.ncbi.nlm.nih.gov/cdd, accessed on 11 November 2021) and the SMART website (http://smart.embl-heidelberg.de/, accessed on 12 November 2021) were used to compare and analyze the obtained PIN gene family members to ensure complete PIN domains. The ExPASy online program ProtParam [30] (http://web.expasy.org/protparam, accessed on 15 November 2021) was used to analyze the physicochemical characteristics of putative ZaPIN proteins, including the isoelectric point, number of amino acids, molecular weight, and instability index. The online tool PSORT [31] (https://wolfpsort.hgc.jp/, accessed on 21 November 2021) was used to predict the subcellular localization of each PIN protein. The transmembrane helixes of ZaPINs were predicted using TMHMM [32] (http://www.cbs.dtu.dk/services/TMHMM/, accessed on 21 November 2021). The secondary and tertiary structures of PIN proteins were predicted using tools at MEMSAT-SVM [33] available at the Phyre2 server [34], SOPMA [35] (https://npsa-prabi.ibcp.fr/cgi-bin/npsa_automat.pl?page=npsa_sopma.html, accessed on 24 November 2021), and the Phyre2 server (http://www.sbg.bio.ic.ac.uk/phyre2/html/page.cgi?id=index, accessed on 25 November 2021).

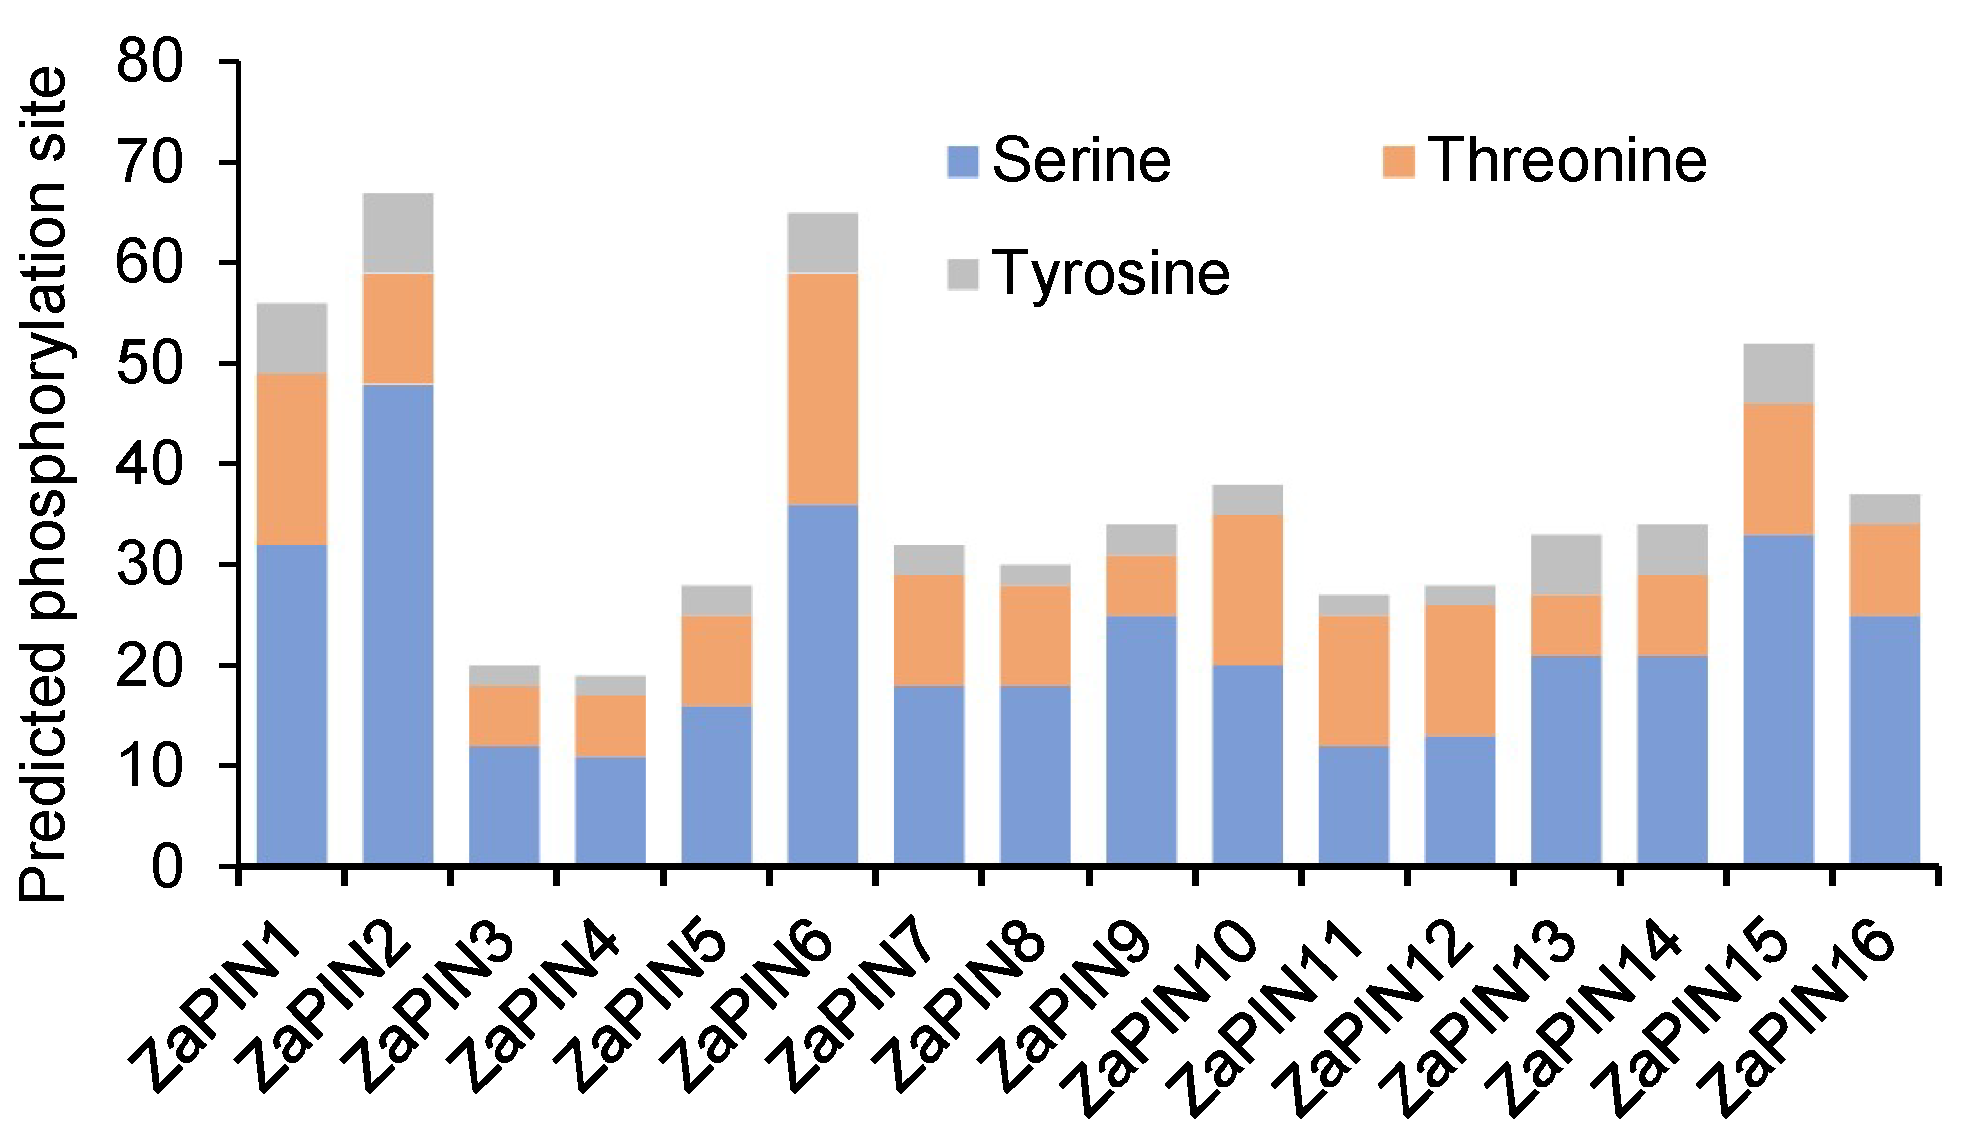
2.2. Prediction of Phosphorylation Modification Sites

The potential protein phosphorylation sites of PIN proteins were predicted using the NetPhos 3.1 Server software [36] (http://www.cbs.dtu.dk/services/NetPhos-3.1/, accessed on 28 November 2021) with default parameters.

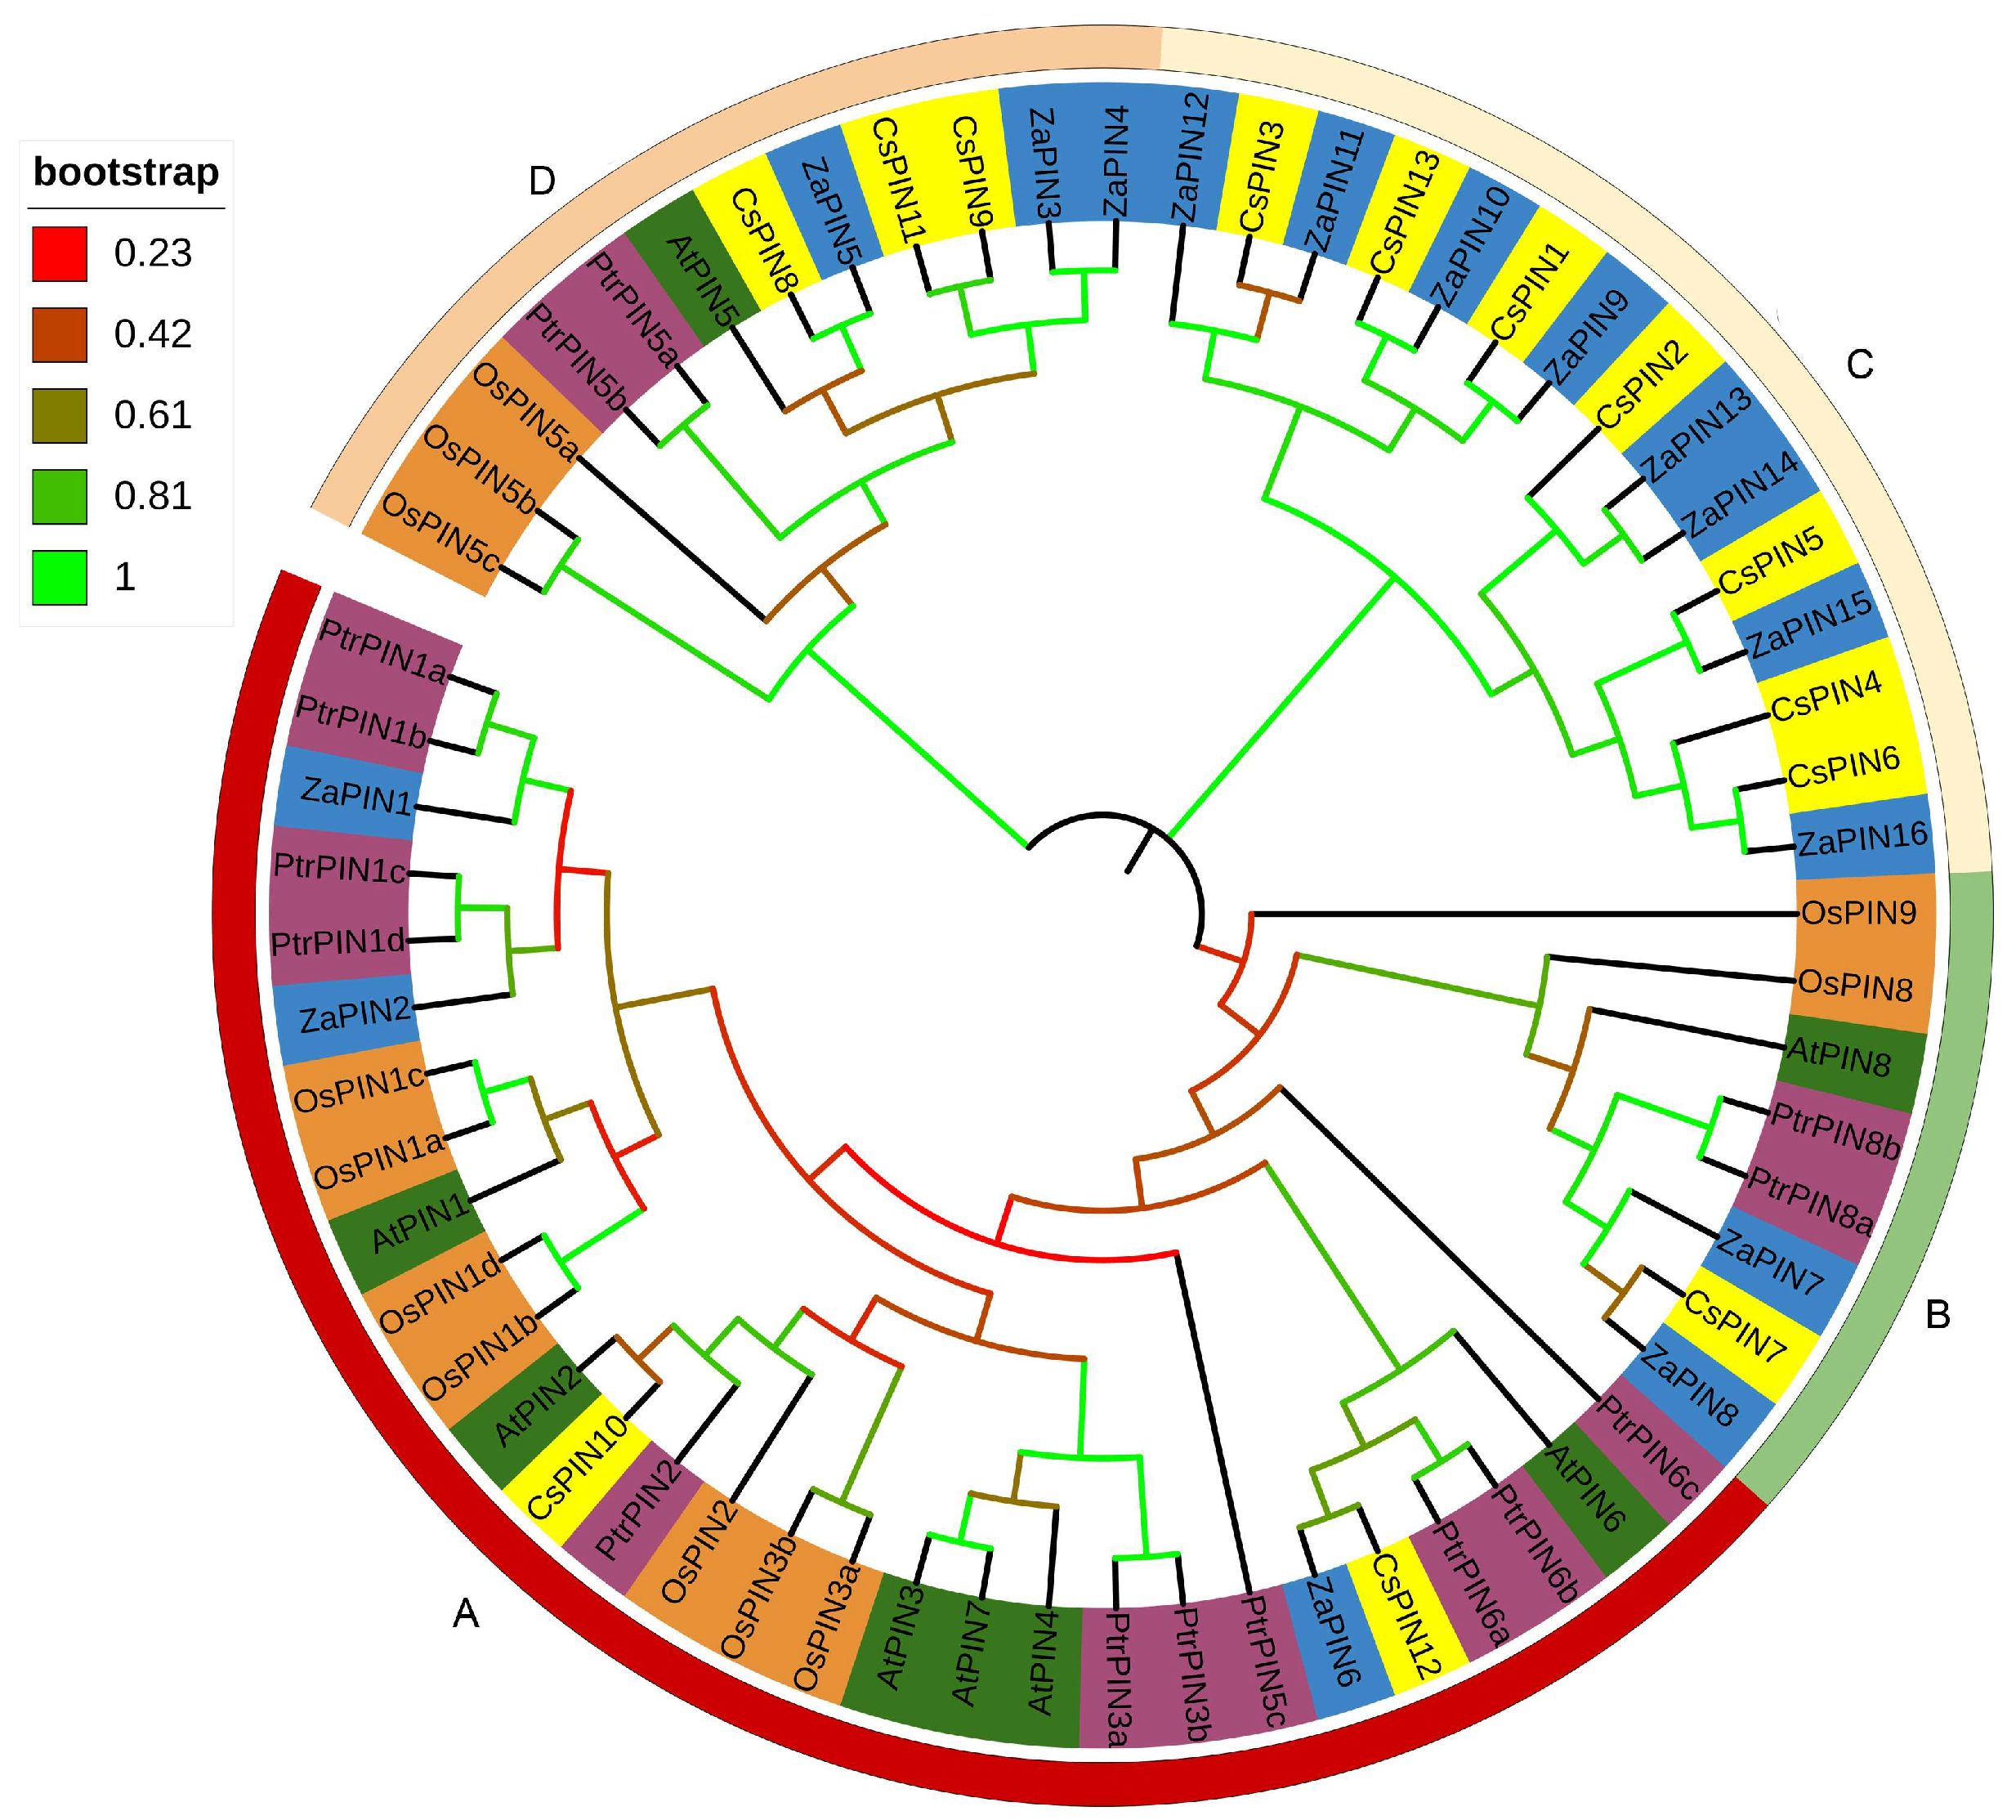
2.3. Phylogenetic Analysis

The amino acid sequences of PIN proteins from Arabidopsis, rice, Populus trichocarpa, and Citrus sinensis were downloaded from the TAIR website (https://www.arabidopsis.org/, accessed on 5 December 2021), the Rice Genome Annotation Project website (http://rice.uga.edu/index.shtml, accessed on 6 December 2021), the popgenie.ORG website (http://popgenie.org/, accessed on 8 December 2021), and the Citrus sinensis v3.0 database (http://citrus.hzau.edu.cn/download.php, accessed on 9 December 2021), respectively. Phylogenetic analysis was carried out using the Neighbor-Joining method with the MEGA7 software [37].

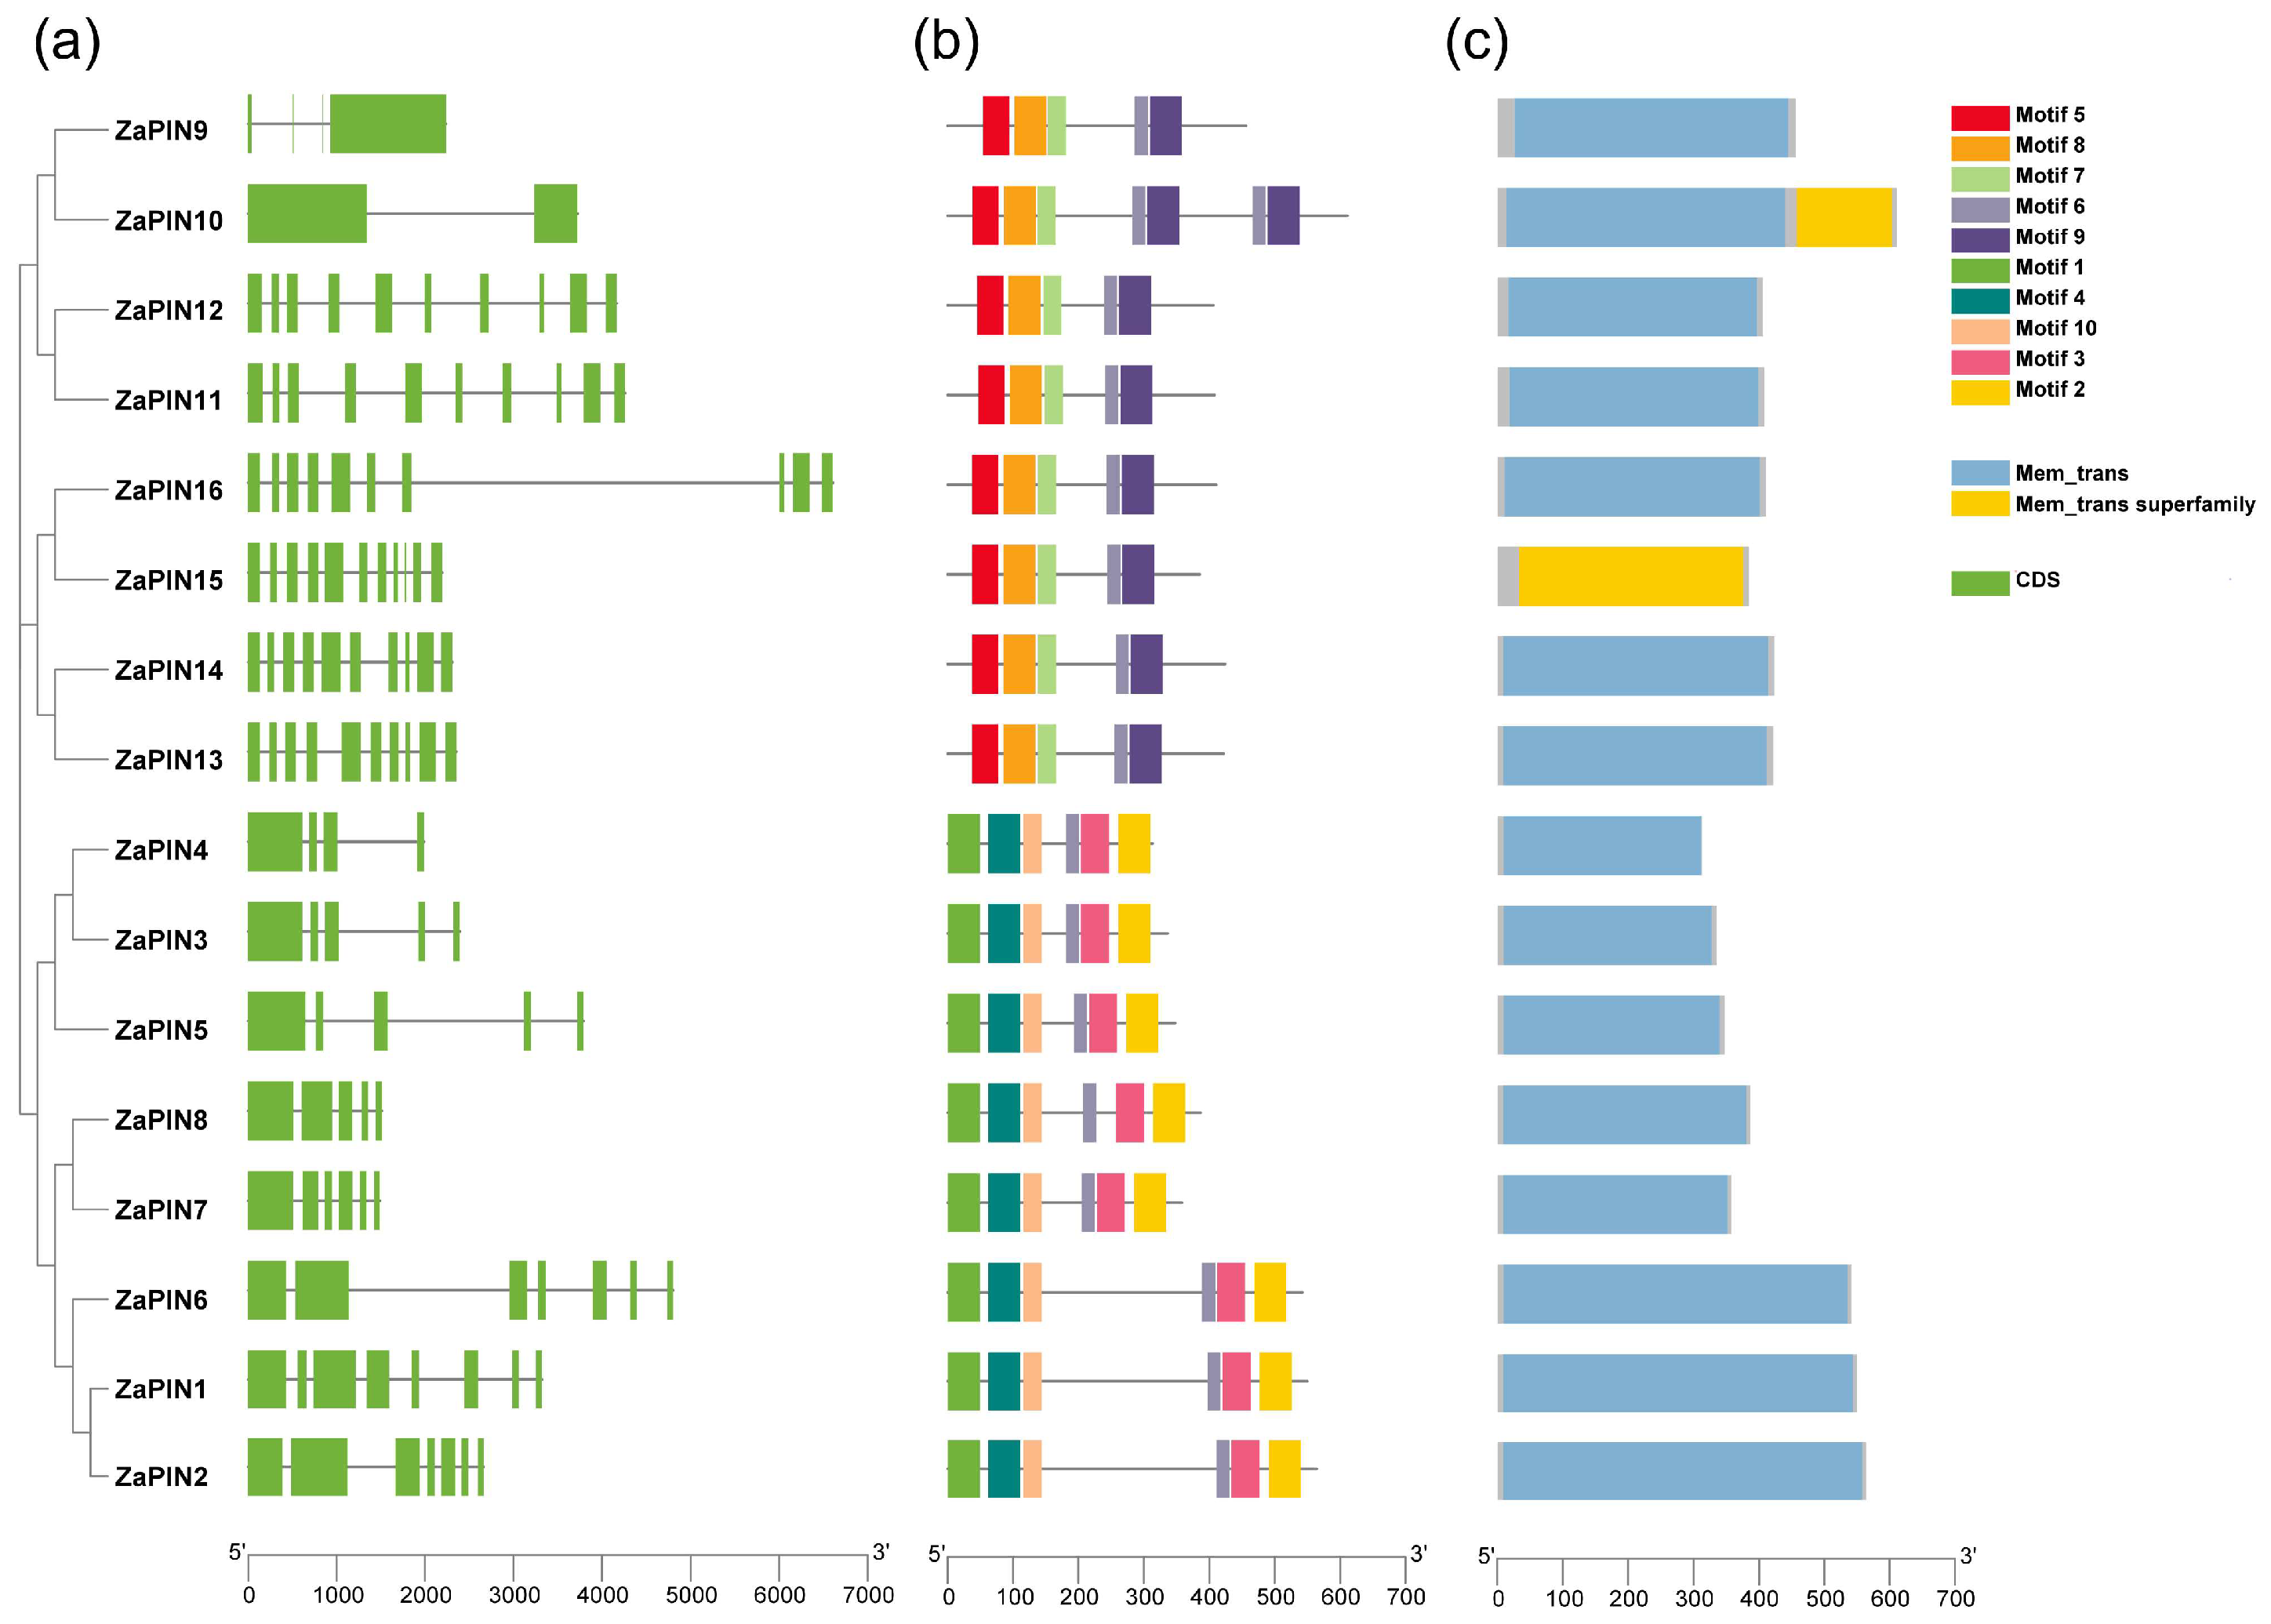
2.4. Gene Structure and Conserved Motif Analysis

The GFF file with annotation information for Z. armatum genes and gene structures was acquired from the Z. armatum genome database [26]. The annotations for the gene structures of ZaPINs were extracted from the GFF3 file. NCBI CDD (https://www.ncbi.nlm.nih.gov/cdd, accessed on 10 December 2021) and MEME (http://meme-suite.org/tools/meme, accessed on 12 December 2021) were used to predict the conserved domains (Mem_trans domain) in PIN proteins. The results were visualized using the TBtools software [38].

2.5. Chromosomal Location, Gene Duplication, and Collinearity Analysis

The Multiple Collinearity Scan Toolkit (MCScanX) [39] was used to analyze the homology relationships of members of the PIN family of Zanthoxylum. Orthologous pairs of PINs among Z. armatum, A. thaliana, O. sativa, and C. sinensis were identified using Text Merge for MCScanX and Text Transform for MicroSynteny Viewer in TBtools [40]. The results were visualized using Advance Circos in TBtools. Synonymous (Ks) and nonsynonymous (Ka) substitution rates were calculated using the Simple Ka/Ks Calculator (NG) in TBtools. The patterns of selection were detected on the basis of the Ka/Ks ratio between paralogs.

2.6. Cis-Acting Regulatory Elements (CAREs) Analysis

TBtools software was used to extract the promoter (2000 bp upstream) region of each PIN gene from the genomic sequence. PlantCARE (http://bioinformatics.psb.ugent.be/webtools/plantcare/html/, accessed on 16 December 2021) was used to identify the putative cis-elements in each promoter. The results were visualized using Simple BioSequence Viewer in TBtools.

2.7. Gene Expression Analysis

To determine the transcriptional profiles of ZaPINs in Z. armatum tissues, Sequence Read Archive (SRA) data (PRJNA721257) for nine tissues of Z. armatum were downloaded from the SRA database using SRAToolkit [41]. The SRA files were converted to Fastq files using the fastq-dump command. The data were quality-checked using the FastQC software [42], and the sequencing data were data-filtered using Trimmomatic [43] to remove adapters. The data were quantified with Kallisto [44]. Heatmap in Tbtools was used to construct the heatmap of gene expression.

2.8. Plant Treatments, RNA Extraction, and qRT-PCR Analysis

Three-year-old Dingtan pepper plants (Z. armatum var. dintanensis) were selected for plant hormone treatments. The young leaves were sprayed with 300 µg/L naphthalene acetic acid (NAA) or 400 µg/L gibberellin (GA3). Leaf samples (0.2 g) were collected at 0, 2, 4, 6, 12, 24, 48, and 72 h after the hormone treatments. The leaf samples were immediately snap-frozen in liquid nitrogen and then stored at −80 °C until analysis. Total RNA was extracted using the Plant RNA Kit (Omega Bio-Tek, Doraville, GA, USA) according to the manufacturer’s instructions. The cDNAs were generated by RT-PCR using a StarScript III RT Mix Kit (GenStar, Beijing, China). qRT-PCR analysis was performed using a qTower3G Real-time PCR System (Analytik Jena AG, Jena, Germany) and SYBR Green Fast Mixture (GenStar). The ZaActin and NbActin genes were used as an internal reference to normalize gene transcript levels. Relative gene transcript levels were calculated using the 2−ΔΔCt method [45]. The primers used for real-time PCR are listed in Table 1.

3. Results

3.1. Identification of PIN Family Members in Z. armatum

In total, 16 PIN genes were identified in Z. armatum, with nucleotide sequence lengths ranging from 938 to 1832 bp. Their encoded proteins ranged from 312 to 610 amino acids in length. The ZaPIN proteins had an average molecular weight of 47.16 kD. The isoelectric point (pI) of ZaPINs ranged from 4.85 (ZaPIN15) to 9.67 (ZaPIN7). Eleven ZaPINs were predicted to be stable proteins (instability index < 40), and five ZaPINs were predicted to be unstable (instability index > 40). The calculated grand average of hydropathy index (GRAVY) values of ZaPINs ranged from 0.074 to 0.818, indicating that they were hydrophobic (Table 2).
The secondary structure analyses predicted that all ZaPINs comprised α-helices, extended strands, β-sheets, and random coils. The α-helices and the random coils were the main secondary structural elements of ZaPINs. Eleven ZaPIN proteins were predicted to localize to the plasma membrane and five were predicted to localize to the vacuolar membrane (Table 3). The Phyre2 sever was used to model the three-dimensional structure of ZaPINs. The results showed that the ZaPINs were mainly composed of α-helices and random coils, and the structure ratios were consistent with the predicted secondary structures (Figure 1). ZaPINs were predicted to contain eight to fourteen transmembrane α-helical bundles (Figures S1 and S2). The predicted transmembrane helices of ZaPINs showed similar structures, i.e., a conserved amino- and carboxy-terminal region of transmembrane segments and a divergent central region representing the cytoplasmic domain (Figure S1). ZaPIN3, ZaPIN4, and ZaPIN5 had a short central loop at the site of the cytoplasmic domain. These results provide clues about the potential molecular functions of ZaPINs.

3.2. Prediction of Phosphorylation Modification Sites in ZaPINs

Phosphorylation plays an important role in protein function. It can change and regulate enzyme activity, protein–protein interactions, and protein–DNA/RNA interactions, and affect protein stability [46]. Tools on the NetPhos 3.1 Server [36] were used to analyze and predict the potential phosphorylation sites of ZaPINs. Each member of the ZaPIN family had potential phosphorylation sites at serine, threonine, and tyrosine residues. In total, 600 potential phosphorylation sites were identified, with serine residues being the most abundant (361), followed by threonine (176) and tyrosine (63). Among the ZaPIN proteins, ZaPIN2 was predicted to have the most phosphorylation sites (67), and the others were predicted to have 19 to 65 phosphorylation sites (Figure 2).

3.3. Phylogenetic Analysis of ZaPIN Family

To investigate the phylogenetic relationships among PIN proteins, a phylogenetic tree was constructed using sequences of 64 PIN proteins from five plant species: Z. armatum (16), A. thaliana (8), O. sativa (12), C. sinensis (13) (Table S1), and P. trichocarpa (15) (Figure 3). The ZaPINs were divided into four groups (A–D). Group C had the most members (8) and group B had the fewest (2) (Figure 3). The ZaPINs were more distantly related to OsPINs and more closely related to CsPINs. The close evolutionary relationship between ZaPIN and CsPIN is consistent with the fact that Zanthoxylum and C. sinensis both belong to the Rutaceae family.

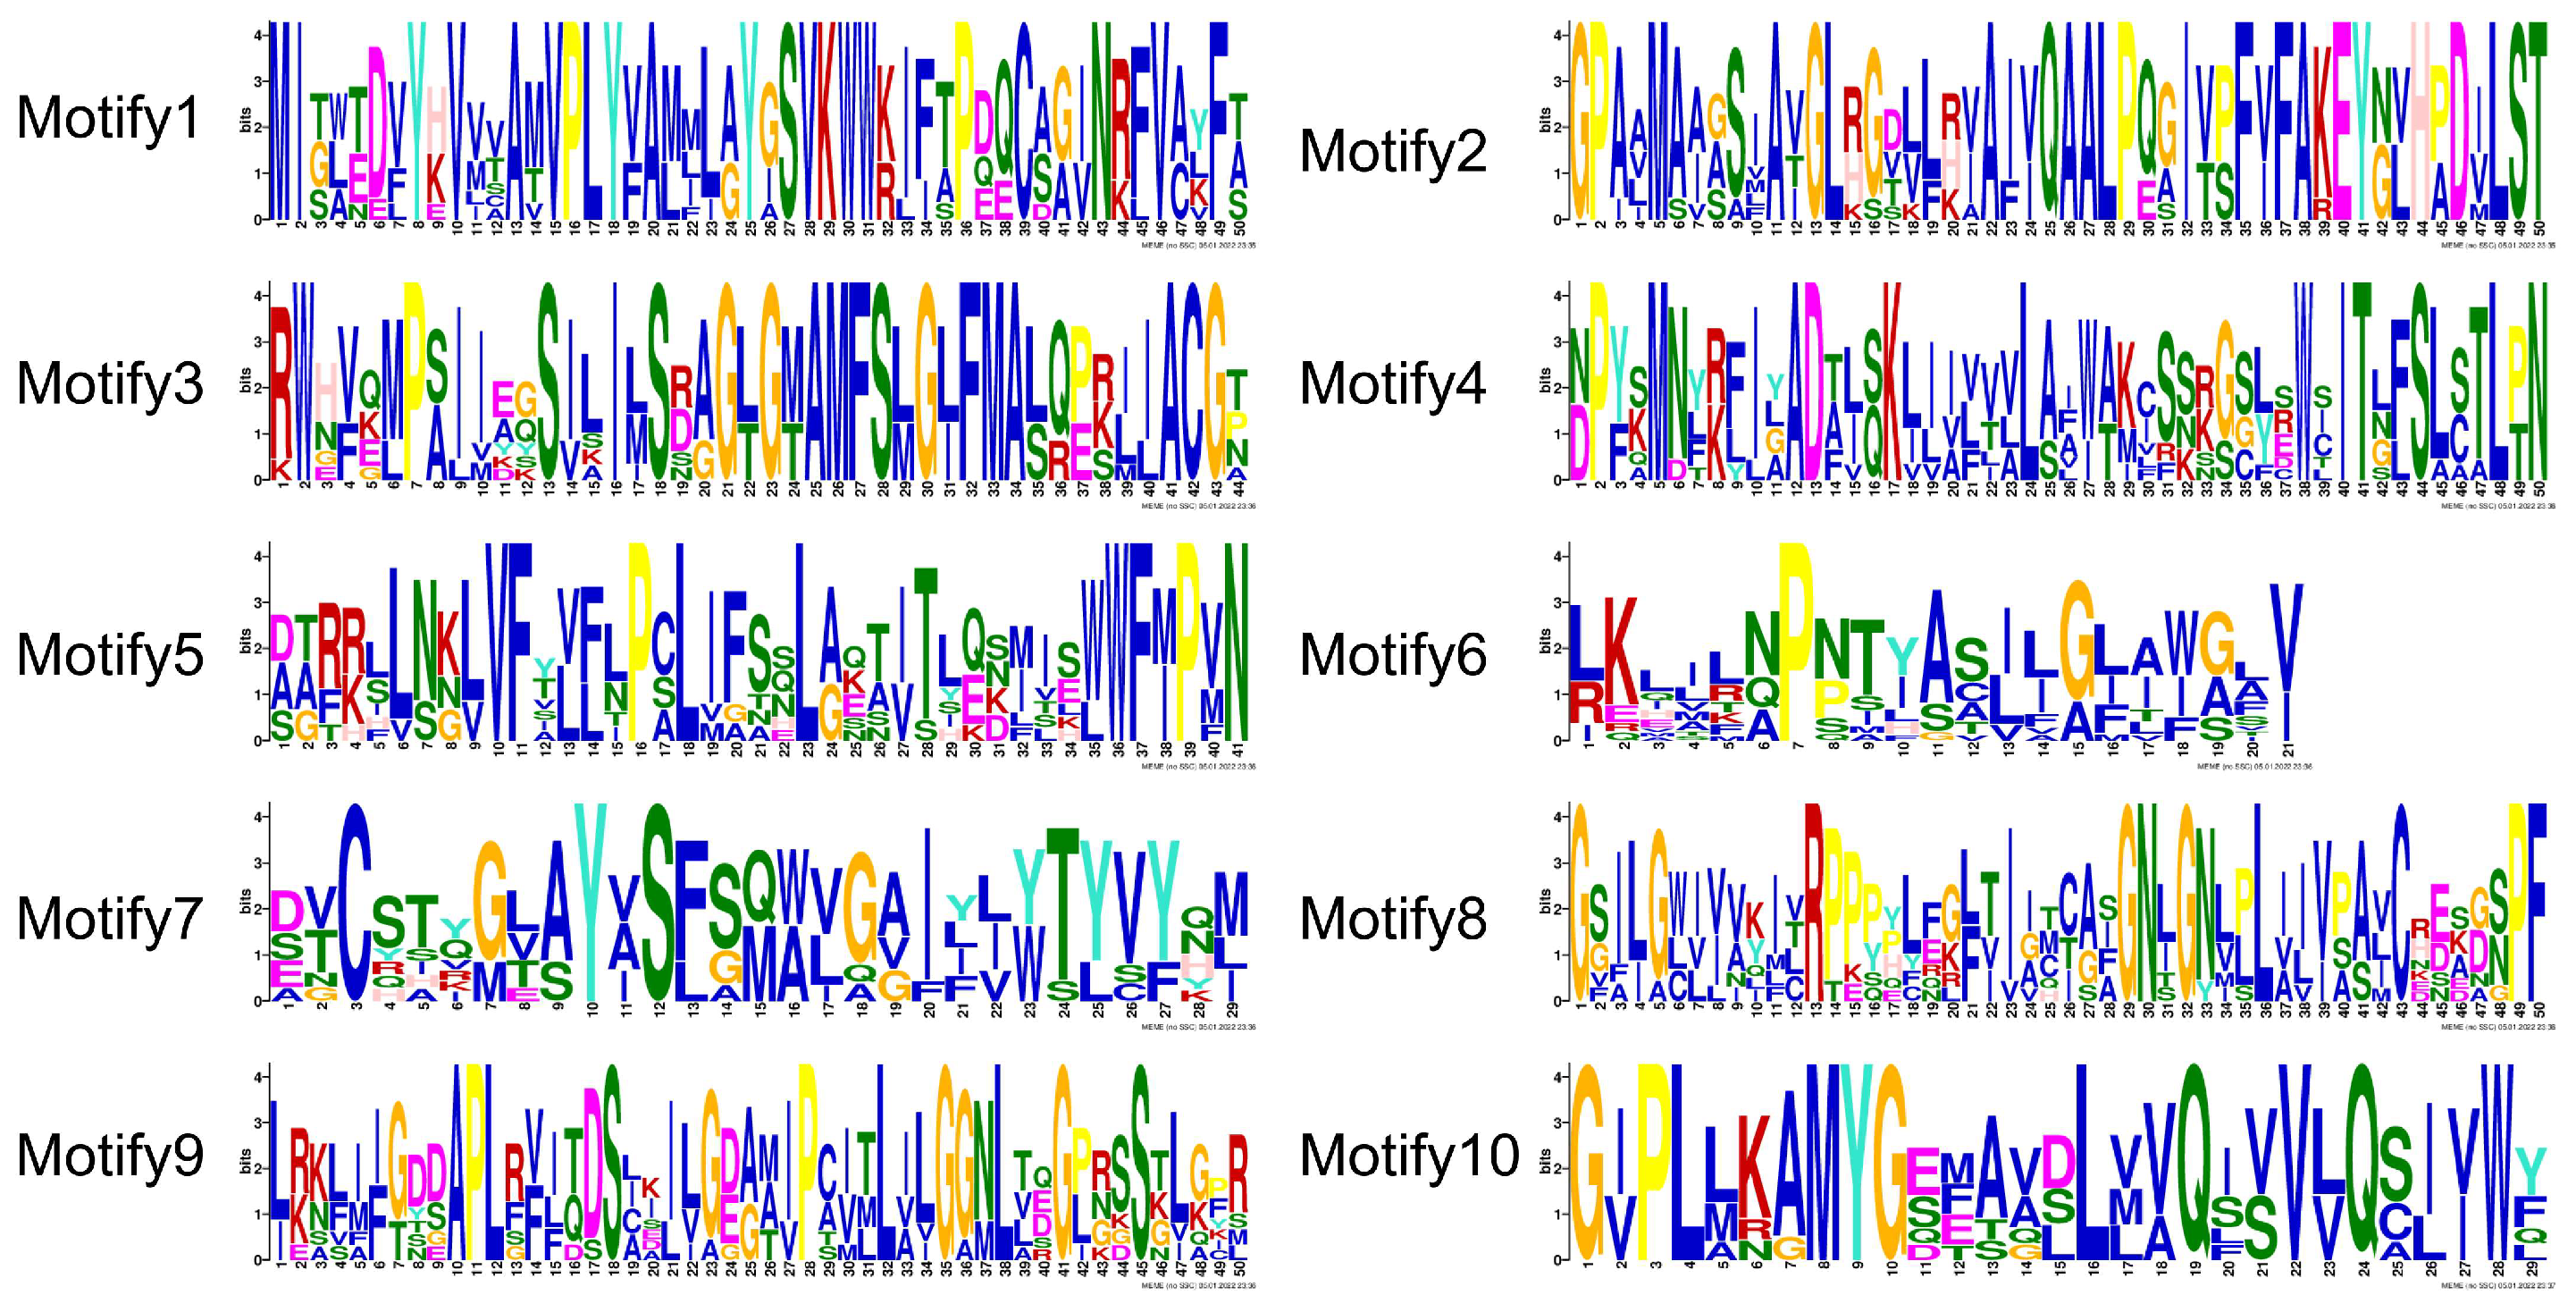
3.4. Gene Structure and Conserved Motif Analysis of ZaPIN Family

To understand the structural features of ZaPINs, we analyzed their conserved motifs (Mem_trans) and exon–intron structures. The number of exons of ZaPINs ranged from 2 (in ZaPIN10) to 11 (in ZaPIN15). Analyses of conserved motifs showed that ZaPINs were divided into two groups: the ZaPIN1–ZaPIN8 branch whose members contained motifs 1, 2, 3, 4, 6, and 10, and the ZaPIN9–ZaPIN16 branch whose members contained motifs 5–9. All ZaPINs contained conserved motif 6, which is likely the Mem_trans domain. Except for ZaPIN10, which had two Mem_trans domains, all other ZaPINs had only one conserved domain (Figure 4 and Figure 5).

3.5. Chromosome Locations and Gene Duplication Analysis of ZaPINs

To determine the genome organization and distribution of ZaPINs on different chromosomes in Zanthoxylum, a chromosome map was constructed. Thirteen ZaPINs were distributed on nine chromosomes (all except for ZaPIN6, ZaPIN7, and ZaPIN8). Three ZaPINs were located on chromosome 19, three on chromosome 20, and the others were evenly distributed among the other seven chromosomes (Figure 6a). A previous study found that a whole-genome duplication (WGD) event occurred in the Z. armatum genome around 26.6 million years ago [26]. In this study, seven duplicated gene pairs were identified among the ZaPINs (Figure 6a). To identify patterns of selection pressure among the ZaPIN duplicates, we calculated non-synonymous (Ka) and synonymous (Ks) substitution rates and the Ka/Ks ratios for the seven identified gene pairs. The Ka/Ks values of all seven gene pairs were < 1, indicating that these pairs evolved under strong purifying or negative selection pressure in Zanthoxylum (Table 4) [47]. We speculate that the expansion of ZaPINs may be the result of the duplication of the whole-genome or intra-genomic fragments of Zanthoxylum.
To further elucidate the evolutionary history of ZaPINs, we conducted a collinearity analysis of PIN genes between Z. armatum and the genomes of C. sinensis, A. thaliana, and O. sativa. We found that the replicated segments containing the PIN gene in the genomes of Z. armatum, A. thaliana, C. sinensis, and O. sativa were broadly collinear, where they formed multiple sets of orthologous segments. In total, 13 orthologous gene pairs were identified between Z. armatum and C. sinensis, eight between Z. armatum and A. thaliana, and only four between Z. armatum and rice (Figure 6b). These findings are consistent with there being a closer relationship between Zanthoxylum and C. sinensis than between Zanthoxylum and rice. Additionally, one ZaPIN gene matched two or more PIN genes from C. sinensis, Arabidopsis, and rice. For example, AtPILS1, AtPIN1, AtPILS5, OsPILS1, and CsPIN6 were orthologous to ZaPIN16, and AtPILS6, CsPIN3, OsPILS6a, and OsPILS6b were orthologous to ZaPIN11 (Figure 6b). These paralogous gene pairs may have played a crucial role in the expansion of the PIN gene family during evolution. These PINs may have originated from one ancestor gene.

3.6. Cis-Acting Elements in ZaPIN Promoters

To further understand the underlying regulatory mechanisms of ZaPINs and how these genes are regulated by phytohormones and stress, we searched for cis-elements in their promoter regions. We detected multiple cis-elements related to plant growth, development, and responses to plant hormones and stress, indicating that ZaPINs have a wide range of biological activities and participate in plant growth and development, and stress resistance, in Z. armatum (Figure 7).

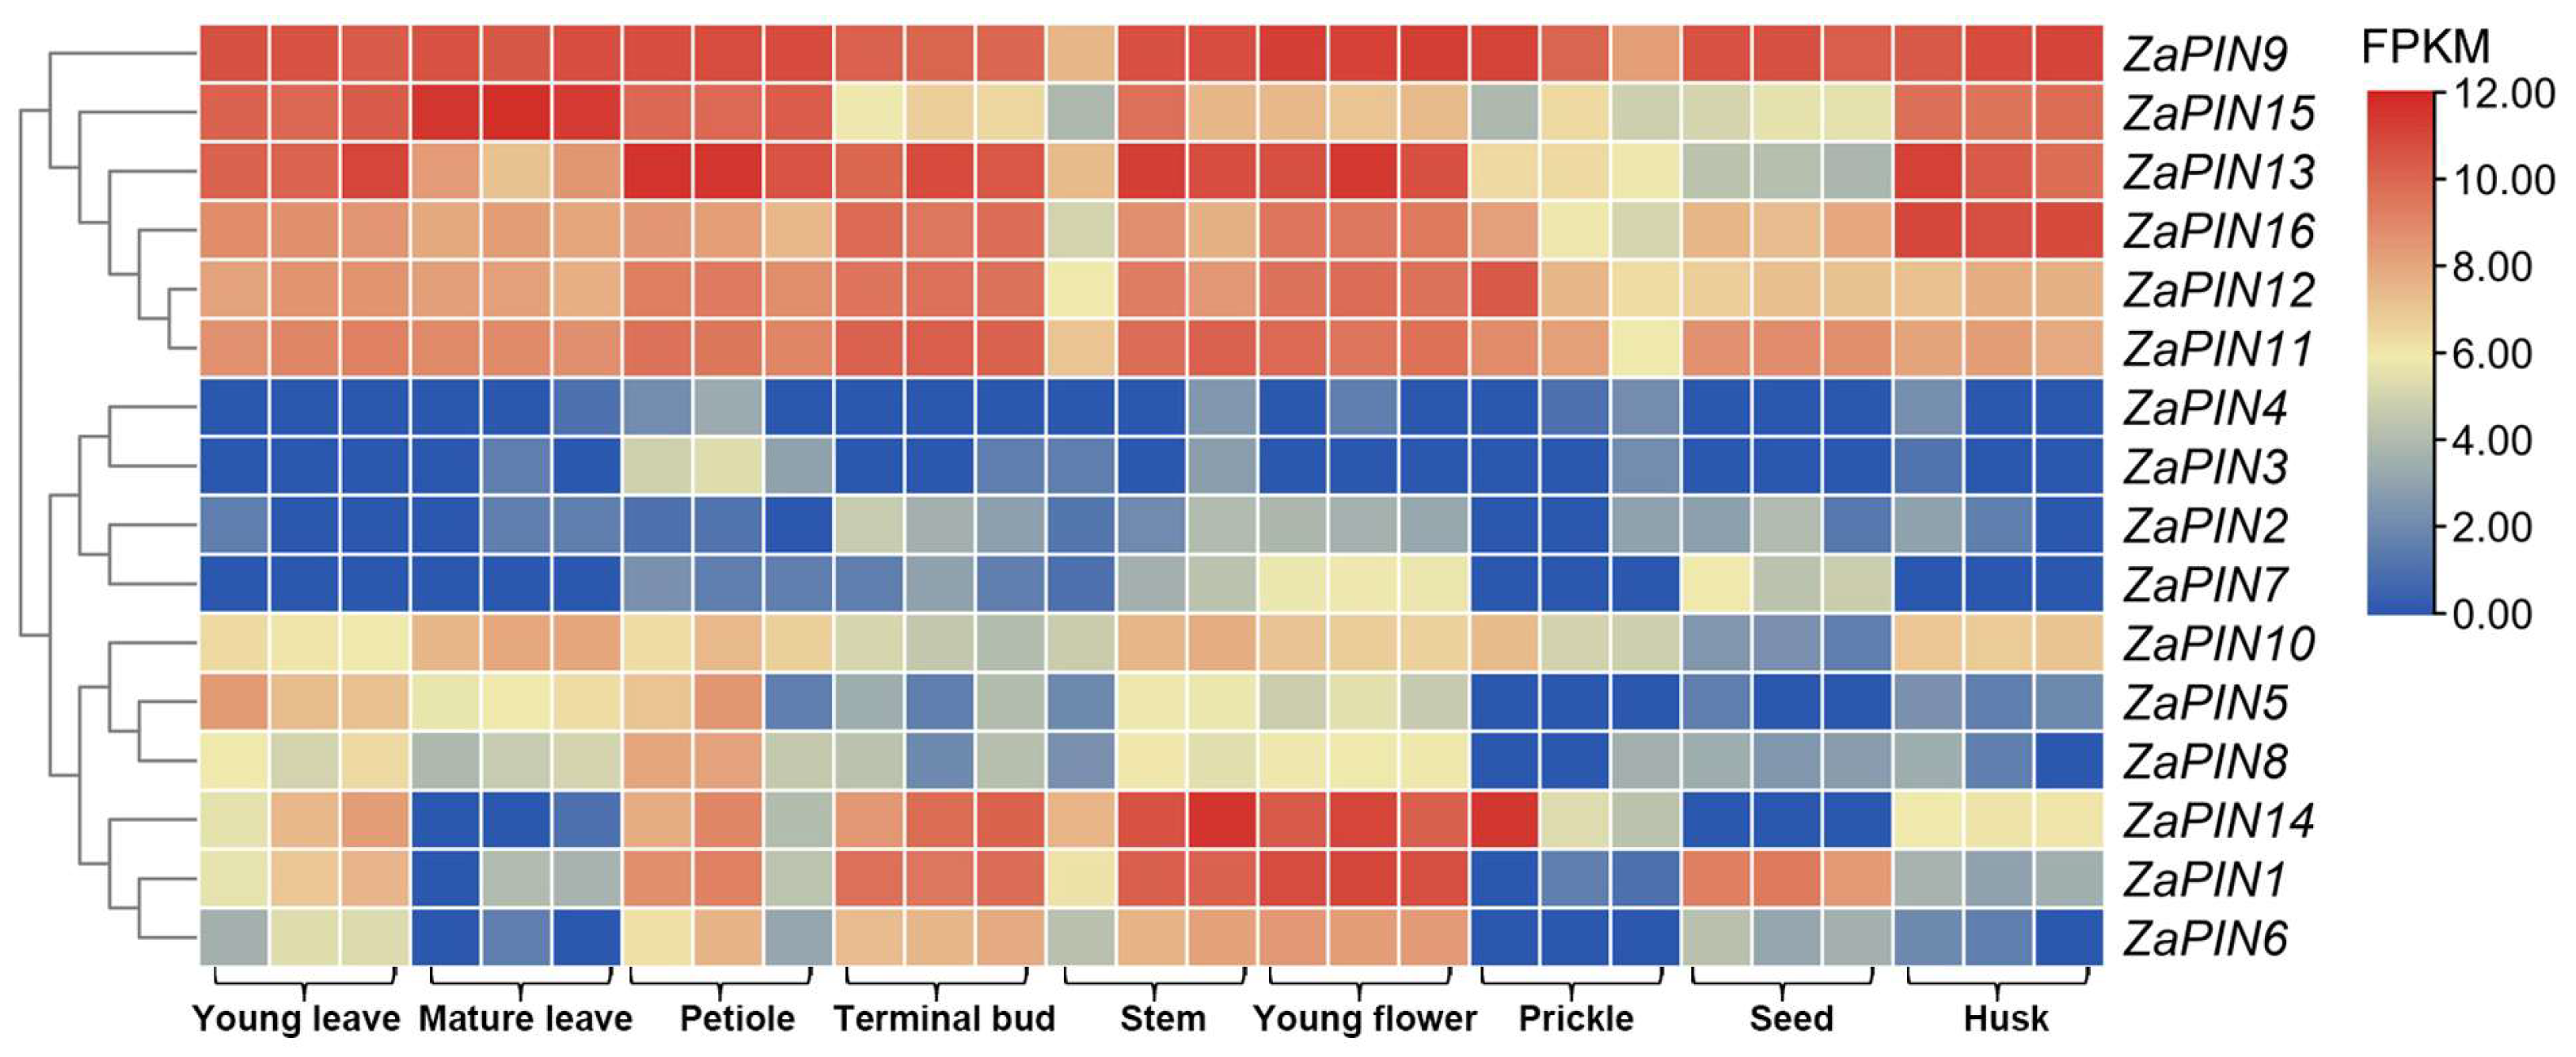
3.7. Tissue-Specific Transcript Profiles of ZaPINs

To further explore the role and regulatory mechanism of ZaPINs in the growth and development of Z. armatum, RNA-sequencing (RNA-Seq) data for expression profiles in nine tissues of Zanthoxylum (young leaf, mature leaf, petiole, terminal bud, stem, young flower, prickle, seed, and husk) were downloaded from the SRA database (PRJNA721257). Then, the FPKM values of ZaPINs were used to produce a heatmap (Figure 8). Different ZaPINs exhibited different expression patterns in different tissues. The ZaPINs were divided into three clades on the basis of their expression patterns. Those in the first clade were highly expressed in all tissues, for example, ZaPIN9 with FPKM values of >175 (log2 FPKM) in all nine tested tissues. Those in the second clade were only expressed in some tissues, such as ZaPIN3, which was only expressed in petioles. Those in the third clade were only not expressed in certain tissues, such as ZaPIN14, which was not expressed in seeds and mature leaves. Almost all ZaPINs were highly expressed in the actively growing tissues (young flower, seeds, bud, young leaf, petiole, and stem), suggesting that ZaPINs may be involved in the regulation of growth and development in these tissues. Except for ZaPIN15 and ZaPIN10, all ZaPINs had higher transcript levels in young leaves than in mature leaves, indicating that ZaPINs mainly function in the early stages of leaf growth and development.

3.8. Expression of ZaPINs in Response to Auxin and Gibberellin

Analyses of ZaPINs promoter regions revealed many regulatory cis-acting elements related to GA and auxin. In Arabidopsis, auxin distribution affects the expression of PIN genes via feedback regulation. To further determine the effects of auxin and GA on ZaPIN expression, qRT-PCR analyses were conducted to detect ZaPIN transcript levels in response to treatments with NAA and GA3. The NAA treatment downregulated ZaPIN3 and ZaPIN5, but upregulated almost all the other ZaPINs by 1.6- to 71.1-fold, compared with their respective pre-treatment levels. Among all the ZaPINs, ZaPIN12 was most strongly upregulated by NAA (71.1-fold) (Figure 9), while ZaPIN1, ZaPIN2, ZaPIN11, ZaPIN13, and ZaPIN16 were upregulated more than 10-fold. Treatment with GA3 upregulated 12 out of 16 ZaPINs, with ZaPIN12 being most strongly upregulated (by 44.2-fold) and the other 11 ZaPINs upregulated by 1.1- to 8.3-fold (Figure 10). These results showed that NAA and GA strongly induce ZaPIN12, that ZaPIN expression in leaves is induced by NAA and GA, and that ZaPIN expression is more strongly induced by NAA than by GA.

4. Discussion

Since the discovery of the first PIN protein in A. thaliana [12], members of the PIN gene family have been discovered in numerous plants using genome-wide approaches. Here, we identified 16 ZaPINs in the Z. armatum genome. Most of the ZaPINs were predicted to be basic proteins, as is the case in other plant species [48]. In our analyses, ZaPINs had the most recent evolutionary relationship with CsPINs and the most distant evolutionary relationship with OsPINs. Consistent with this, Z. armatum and C. sinensis are dicots in the same family, the Rutaceae, while they are more distantly related to the monocot O. sativa. The results of gene collinearity analysis also confirmed this point. We detected more orthologous genes between Zanthoxylum with C. sinensis than between Arabidopsis and rice. Phylogenetic and collinearity analyses revealed that ZaPIN1 shares high homology with AtPIN1. In Arabidopsis, PIN1 participates in basipetal auxin movement, organ initiation, floral bud formation, leaf formation, vein patterning, and gravitropic responses [9,48,49]. AtPIN1 is primarily expressed in inflorescences and the atpin1 mutant exhibits abnormal inflorescence morphology [9,12,50,51]. In our study, ZaPIN1 showed high transcript levels in young flowers, terminal buds, and the stem, indicating that ZaPIN1 may have a similar function as AtPIN1 and play the same role in the growth and development of Zanthoxylum.
One of the primary forces driving plant evolution is the frequent occurrence of gene duplication events among members of the same gene family. These events contribute to the specificity and diversity of gene activities [52]. In our study, gene duplication analysis revealed seven pairs of genes with high nucleotide sequence similarity. Their Ka/Ks ratios were all less than 1, demonstrating that they have been under purifying selection during evolution [53].
As auxin efflux facilitators in the auxin polar transport process, PINs are generally distributed in the plasma membrane and organelle membranes [54]. In this study, 11 ZaPINs were predicted to localize to the plasma membrane. These PINs may contribute to auxin transport from intracellular to extracellular regions [55]. Five ZaPINs were predicted to localize to the tonoplast membrane, and may maintain cellular homeostasis by mediating auxin flow between the cytoplasm and the tonoplast [11]. The phosphorylation status and polar localization of PINs determine the direction of auxin transport [55,56,57]. Protein kinases bind to the phosphorylation site of PIN proteins to activate their auxin polar transport activity [58,59]. We detected multiple phosphorylation sites in all the ZaPINs. These sites, especially those on hydrophilic loops, are likely responsible for the polar distribution of ZaPINs in the plasma and vacuolar membranes, where they control auxin trafficking in Z. armatum.
The transcription of PIN genes is highly sensitive to plant hormones and environmental conditions [60,61]. Many cis elements associated with plant hormones (auxin, gibberellin, and abscisic acid) and responses to stress (temperature, light, and drought) have been detected in the promoter regions of PINs in various plant species [14,15,16,17,18]. In our study, multiple cis-acting elements related to phytohormones and stress responses were found in ZaPIN promoter regions. The types and numbers of cis-acting elements differed among the various ZaPINs, suggesting that each gene will respond differently to phytohormone treatments or environmental stimuli. Our qRT-PCR results confirmed this speculation, and showed that the transcript levels of ZaPINs varied widely under NAA or GA treatments. The NAA treatment upregulated ZaPIN12, ZaPIN11, and ZaPIN16 by more than 20-fold, but downregulated ZaPIN3 and ZaPIN5. The GA treatment upregulated ZaPIN12 by 44.2-fold, but downregulated five ZaPINs (ZaPIN3, ZaPIN4, ZaPIN6, ZaPIN8, and ZaPIN10).
Analyses of publicly available expression data and results published in the literature indicate that PINs also show tissue-specific expression [62]. In Arabidopsis, PIN1 is primarily expressed in inflorescences, PIN5 in the root, and PIN6 in shoots and seedlings [63]. In rice, OsPIN9 shows the highest transcript levels in young seeds, while OsPIN8 is mainly expressed in immature inflorescences [63]. In this study, we detected tissue-specific expression profiles of PIN genes in Zanthoxylum that were consistent with those in other plant species. Members of the ZaPIN9 clade were expressed in all nine tissues, and at higher levels than the members of the other two clades. The ZaPIN1 clade was less uniform in terms of expression, with different genes showing high transcript levels in different tissues. The highest transcript levels of ZaPIN1 and ZaPIN5 were detected in the young flower and young leaf, respectively.

5. Conclusions

We identified 16 ZaPINs from the whole genome of Z. armatum. The phylogeny, gene duplication, chromosomal distribution, gene structure, and expression profiles of ZaPINs in various tissues and under NAA and GA3 treatments were analyzed. The varied expression patterns in different tissues and under phytohormone treatments were indicative of specific functions of ZaPIN proteins in certain tissues and environmental conditions. Our results provide valuable information about ZaPINs and their responses to NAA and GA3. Further functional analyses of ZaPINs will provide details of their roles in the growth, development, and stress responses of Z. armatum.

Supplementary Materials

The following can be downloaded at: https://www.mdpi.com/article/10.3390/agriculture12091318/s1, Figure S1: Prediction of transmembrane structure character of ZaPINs. The red peak represents the transmembrane domain of the protein; Figure S2: predicted TM helix of ZaPINs. The cytoplasmic and extracellular sides of the membrane are labeled, and the start and end of each transmembrane helix are indicated with a number; Table S1: PIN gene of Citrus sinensis renamed.

Author Contributions

X.Z. designed the experiments. T.Z. and X.Z. wrote the manuscript. Y.H., J.C., Z.J., J.L. and Y.L. contributed to the correction of the final manuscript. All authors have read and agreed to the published version of the manuscript.

Funding

This research was funded by the National Natural Science Foundation of China (32060478).

Institutional Review Board Statement

Not applicable.

Informed Consent Statement

Not applicable.

Data Availability Statement

Not applicable.

Conflicts of Interest

The authors declare no conflict of interest.

References

  1. Enders, T.A.; Strader, L.C. Auxin Activity: Past, Present, And Future. Am. J. Bot. 2015, 102, 180–196. [Google Scholar] [CrossRef]
  2. Li, D.; Pan, C.; Lu, J.; Zaman, W.; Zhao, H.; Zhang, J.; Lü, S. Lupeol Accumulation Correlates with Auxin in the Epidermis of Castor. Molecules 2021, 26, 2978. [Google Scholar] [CrossRef] [PubMed]
  3. Weijers, D.; Wagner, D. Transcriptional Responses to the Auxin Hormone. In Annual Review of Plant Biology; Merchant, S.S., Ed.; Annual Reviews: Palo Alto, CA, USA, 2016; Volume 67, pp. 539–574. [Google Scholar]
  4. Hayashi, K.I.; Nakamura, S.; Fukunaga, S.; Nishimura, T.; Jenness, M.K.; Murphy, A.S.; Motose, H.; Nozaki, H.; Furutani, M.; Aoyama, T. Auxin transport sites are visualized in planta using fluorescent auxin analogs. Proc. Natl. Acad. Sci. USA 2014, 111, 11557–11562. [Google Scholar] [CrossRef]
  5. Swarup, R.; Peret, B. AUX/LAX family of auxin influx carriers-an overview. Front. Plant Sci. 2012, 3, 225. [Google Scholar] [CrossRef] [PubMed]
  6. Krouk, G.; Lacombe, B.; Bielach, A.; Perrine-Walker, F.; Malinska, K.; Mounier, E.; Hoyerova, K.; Tillard, P.; Leon, S.; Ljung, K.; et al. Nitrate-Regulated Auxin Transport by NRT1.1 Defines a Mechanism for Nutrient Sensing in Plants. Dev. Cell 2010, 18, 927–937. [Google Scholar] [CrossRef] [PubMed]
  7. Swarup, K.; Benkova, E.; Swarup, R.; Casimiro, I.; Peret, B.; Yang, Y.; Parry, G.; Nielsen, E.; De Smet, I.; Vanneste, S.; et al. The auxin influx carrier LAX3 promotes lateral root emergence. Nat. Cell Biol. 2008, 10, 946–954. [Google Scholar] [CrossRef]
  8. Peret, B.; Swarup, K.; Ferguson, A.; Seth, M.; Yang, Y.D.; Dhondt, S.; James, N.; Casimiro, I.; Perry, P.; Syed, A.; et al. AUX/LAX Genes Encode a Family of Auxin Influx Transporters That Perform Distinct Functions during Arabidopsis Development. Plant Cell 2012, 24, 2874–2885. [Google Scholar] [CrossRef]
  9. Okada, K.; Ueda, J.; Komaki, M.K.; Bell, C.J.; Shimura, Y. Requirement of the Auxin Polar Transport System in Early Stages of Arabidopsis Floral Bud Formation. Plant Cell 1991, 3, 677–684. [Google Scholar] [CrossRef]
  10. Wisniewska, J.; Xu, J.; Seifertova, D.; Brewer, P.B.; Ruzicka, K.; Blilou, I.; Rouquie, D.; Benkova, E.; Scheres, B.; Friml, J. Polar PIN localization directs auxin flow in plants. Science 2006, 312, 883. [Google Scholar] [CrossRef]
  11. Mravec, J.; Skupa, P.; Bailly, A.; Hoyerova, K.; Krecek, P.; Bielach, A.; Petrasek, J.; Zhang, J.; Gaykova, V.; Stierhof, Y.-D.; et al. Subcellular homeostasis of phytohormone auxin is mediated by the ER-localized PIN5 transporter. Nature 2009, 459, U1136–U1140. [Google Scholar] [CrossRef]
  12. Galweiler, L.; Guan, C.; Muller, A.; Wisman, E.; Mendgen, K.; Yephremov, A.; Palme, K. Regulation of polar auxin transport by AtPIN1 in Arabidopsis vascular tissue. Science 1998, 282, 2226–2230. [Google Scholar] [CrossRef] [PubMed]
  13. Vanneste, S.; Friml, J. Auxin: A Trigger for Change in Plant Development. Cell 2009, 136, 1005–1016. [Google Scholar] [CrossRef] [PubMed]
  14. Forestan, C.; Farinati, S.; Varotto, S. The maize PIN gene family of auxin transporters. Front. Plant Sci. 2012, 3, 16. [Google Scholar] [CrossRef]
  15. Kumar, M.; Kherawat, B.S.; Dey, P.; Saha, D.; Singh, A.; Bhatia, S.K.; Ghodake, G.S.; Kadam, A.A.; Kim, H.U.; Chung, S.M.; et al. Genome-Wide Identification and Characterization of PIN-FORMED (PIN) Gene Family Reveals Role in Developmental and Various Stress Conditions in Triticum aestivum L. Int. J. Mol. Sci. 2021, 22, 7396. [Google Scholar] [CrossRef] [PubMed]
  16. Liu, B.; Zhang, J.; Wang, L.; Li, J.; Zheng, H.; Chen, J.; Lu, M. A survey of Populus PIN-FORMED family genes reveals their diversified expression patterns. J. Exp. Bot. 2014, 65, 2437–2448. [Google Scholar] [CrossRef]
  17. Wang, Y.; Chai, C.; Valliyodan, B.; Maupin, C.; Annen, B.; Nguyen, H.T. Genome-wide analysis and expression profiling of the PIN auxin transporter gene family in soybean (Glycine max). BMC Genom. 2015, 16, 951. [Google Scholar] [CrossRef]
  18. He, P.; Zhao, P.; Wang, L.; Zhang, Y.; Wang, X.; Xiao, H.; Yu, J.; Xiao, G. The PIN gene family in cotton (Gossypium hirsutum): Genome-wide identification and gene expression analyses during root development and abiotic stress responses. BMC Genom. 2017, 18, 507. [Google Scholar] [CrossRef]
  19. Xie, X.; Qin, G.; Si, P.; Luo, Z.; Gao, J.; Chen, X.; Zhang, J.; Wei, P.; Xia, Q.; Lin, F.; et al. Analysis of Nicotiana tabacum PIN genes identifies NtPIN4 as a key regulator of axillary bud growth. Physiol. Plant. 2017, 160, 222–239. [Google Scholar] [CrossRef]
  20. Yang, C.H.; Wang, D.D.; Zhang, C.; Kong, N.N.; Ma, H.L.; Chen, Q. Comparative Analysis of the PIN Auxin Transporter Gene Family in Different Plant Species: A Focus on Structural and Expression Profiling of PINs in Solanum tuberosum. Int. J. Mol. Sci. 2019, 20, 3270. [Google Scholar] [CrossRef]
  21. Barkoulas, M.; Hay, A.; Kougioumoutzi, E.; Tsiantis, M. A developmental framework for dissected leaf formation in the Arabidopsis relative Cardamine hirsuta. Nat. Genet. 2008, 40, 1136–1141. [Google Scholar] [CrossRef]
  22. Wang, L.; Guo, M.; Li, Y.; Ruan, W.; Mo, X.; Wu, Z.; Sturrock, C.J.; Yu, H.; Lu, C.; Peng, J.; et al. LARGE ROOT ANGLE1, encoding OsPIN2, is involved in root system architecture in rice. J. Exp. Bot. 2018, 69, 385–397. [Google Scholar] [CrossRef] [PubMed]
  23. Shi, Z.; Jiang, Y.; Han, X.; Liu, X.; Cao, R.; Qi, M.; Xu, T.; Li, T. SlPIN1 regulates auxin efflux to affect flower abscission process. Sci. Rep. 2017, 7, 14919. [Google Scholar] [CrossRef] [PubMed]
  24. Phuyal, N.; Jha, P.K.; Raturi, P.P.; Rajbhandary, S. Zanthoxylum armatum DC.: Current knowledge, gaps and opportunities in Nepal. J. Ethnopharmacol. 2019, 229, 326–341. [Google Scholar] [CrossRef] [PubMed]
  25. Alam, F.; Saqib, Q.N.U.; Ashraf, M. Zanthoxylum armatum DC extracts from fruit, bark and leaf induce hypolipidemic and hypoglycemic effects in mice- in vivo and in vitro study. BMC Complementary Altern. Med. 2018, 18, 68. [Google Scholar] [CrossRef]
  26. Wang, M.C.; Tong, S.F.; Ma, T.; Xi, Z.X.; Liu, J.Q. Chromosome-level genome assembly of Sichuan pepper provides insights into apomixis, drought tolerance, and alkaloid biosynthesis. Mol. Ecol. Resour. 2021, 21, 2533–2545. [Google Scholar] [CrossRef]
  27. Miller, D.R.; Leek, T.; Schwartz, R.M. A hidden Markov model information retrieval system. In Proceedings of the 22nd Annual International ACM SIGIR Conference on Research and Development in Information Retrieval, Berkeley, CA, USA, 15–19 August 1999; pp. 214–221. [Google Scholar]
  28. Finn, R.D.; Clements, J.; Eddy, S.R. HMMER web server: Interactive sequence similarity searching. Nucleic Acids Res. 2011, 39, W29–W37. [Google Scholar] [CrossRef]
  29. Marchler-Bauer, A.; Derbyshire, M.K.; Gonzales, N.R.; Lu, S.; Chitsaz, F.; Geer, L.Y.; Geer, R.C.; He, J.; Gwadz, M.; Hurwitz, D.I. CDD: NCBI’s conserved domain database. Nucleic Acids Res. 2015, 43, D222–D226. [Google Scholar] [CrossRef]
  30. Gasteiger, E.; Hoogland, C.; Gattiker, A.; Wilkins, M.R.; Appel, R.D.; Bairoch, A. Protein identification and analysis tools on the ExPASy server. In The Proteomics Protocols Handbook; Springer: New York, NY, USA, 2005; pp. 571–607. [Google Scholar]
  31. Nakai, K. PSORT: A program for detecting the sorting signals of proteins and predicting their subcellular localization. Trends Biochem. Sci 1999, 24, 34–35. [Google Scholar] [CrossRef]
  32. Krogh, A.; Larsson, B.; Von Heijne, G.; Sonnhammer, E.L. Predicting transmembrane protein topology with a hidden Markov model: Application to complete genomes. J. Mol. Biol. 2001, 305, 567–580. [Google Scholar] [CrossRef]
  33. Nugent, T.; Ward, S.; Jones, D.T. The MEMPACK alpha-helical transmembrane protein structure prediction server. Bioinformatics 2011, 27, 1438–1439. [Google Scholar] [CrossRef]
  34. Kelley, L.A.; Mezulis, S.; Yates, C.M.; Wass, M.N.; Sternberg, M.J. The Phyre2 web portal for protein modeling, prediction and analysis. Nat. Protoc. 2015, 10, 845–858. [Google Scholar] [CrossRef] [PubMed]
  35. Geourjon, C.; Deleage, G. SOPMA: Significant improvements in protein secondary structure prediction by consensus prediction from multiple alignments. Bioinformatics 1995, 11, 681–684. [Google Scholar] [CrossRef] [PubMed]
  36. Blom, N.; Sicheritz-Ponten, T.; Gupta, R.; Gammeltoft, S.; Brunak, S. Prediction of post-translational glycosylation and phosphorylation of proteins from the amino acid sequence. Proteomics 2004, 4, 1633–1649. [Google Scholar] [CrossRef] [PubMed]
  37. Kumar, S.; Stecher, G.; Tamura, K. MEGA7: Molecular Evolutionary Genetics Analysis Version 7.0 for Bigger Datasets. Mol. Biol. Evol. 2016, 33, 1870–1874. [Google Scholar] [CrossRef] [PubMed]
  38. Chen, C.; Chen, H.; Zhang, Y.; Thomas, H.R.; Frank, M.H.; He, Y.; Xia, R. TBtools: An Integrative Toolkit Developed for Interactive Analyses of Big Biological Data. Mol. Plant 2020, 13, 1194–1202. [Google Scholar] [CrossRef]
  39. Wang, Y.; Tang, H.; DeBarry, J.D.; Tan, X.; Li, J.; Wang, X.; Lee, T.-H.; Jin, H.; Marler, B.; Guo, H. MCScanX: A toolkit for detection and evolutionary analysis of gene synteny and collinearity. Nucleic Acids Res. 2012, 40, e49. [Google Scholar] [CrossRef]
  40. Chen, C.; Chen, H.; He, Y.; Xia, R. TBtools, a toolkit for biologists integrating various biological data handling tools with a user-friendly interface. BioRxiv 2018, 289660, 289660. [Google Scholar]
  41. Leinonen, R.; Sugawara, H.; Shumway, M.; Collaboration, I.N.S.D. The sequence read archive. Nucleic Acids Res. 2010, 39, D19–D21. [Google Scholar] [CrossRef]
  42. Schmieder, R.; Edwards, R. Quality control and preprocessing of metagenomic datasets. Bioinformatics 2011, 27, 863–864. [Google Scholar] [CrossRef]
  43. Bolger, A.M.; Lohse, M.; Usadel, B. Trimmomatic: A flexible trimmer for Illumina sequence data. Bioinformatics 2014, 30, 2114–2120. [Google Scholar] [CrossRef]
  44. Bray, N.L.; Pimentel, H.; Melsted, P.; Pachter, L. Near-optimal probabilistic RNA-seq quantification. Nat. Biotechnol. 2016, 34, 525–527. [Google Scholar] [CrossRef] [PubMed]
  45. Livak, K.J.; Schmittgen, T.D. Analysis of relative gene expression data using real-time quantitative PCR and the 2− ΔΔCT method. Methods 2001, 25, 402–408. [Google Scholar] [CrossRef] [PubMed]
  46. Janssens, V.; Goris, J. Protein phosphatase 2A: A highly regulated family of serine/threonine phosphatases implicated in cell growth and signalling. Biochem. J. 2001, 353, 417–439. [Google Scholar] [CrossRef] [PubMed]
  47. Yang, Z.; Nielsen, R. Mutation-selection models of codon substitution and their use to estimate selective strengths on codon usage. Mol. Biol. Evol. 2008, 25, 568–579. [Google Scholar] [CrossRef] [PubMed]
  48. Zhou, J.-J.; Luo, J. The PIN-FORMED Auxin Efflux Carriers in Plants. Int. J. Mol. Sci. 2018, 19, 2759. [Google Scholar] [CrossRef]
  49. Pahari, S.; Cormark, R.D.; Blackshaw, M.T.; Liu, C.; Erickson, J.L.; Schultz, E.A. Arabidopsis UNHINGED encodes a VPS51 homolog and reveals a role for the GARP complex in leaf shape and vein patterning. Development 2014, 141, 1894–1905. [Google Scholar] [CrossRef]
  50. Balzan, S.; Johal, G.S.; Carraro, N. The role of auxin transporters in monocots development. Front. Plant Sci. 2014, 5, 393. [Google Scholar] [CrossRef]
  51. Vasil, V.; Marcotte, W.R., Jr.; Rosenkrans, L.; Cocciolone, S.M.; Vasil, I.K.; Quatrano, R.S.; McCarty, D.R. Overlap of Viviparous1 (VP1) and abscisic acid response elements in the Em promoter: G-box elements are sufficient but not necessary for VP1 transactivation. Plant Cell 1995, 7, 1511–1518. [Google Scholar]
  52. Ren, R.; Wang, H.; Guo, C.; Zhang, N.; Zeng, L.; Chen, Y.; Ma, H.; Qi, J. Widespread Whole Genome Duplications Contribute to Genome Complexity and Species Diversity in Angiosperms. Mol. Plant 2018, 11, 414–428. [Google Scholar] [CrossRef]
  53. Nekrutenko, A.; Makova, K.D.; Li, W.-H. The K(A)/K(S) ratio test for assessing the protein-coding potential of genomic regions: An empirical and simulation study. Genome Res. 2002, 12, 198–202. [Google Scholar] [CrossRef]
  54. Luschnig, C.; Gaxiola, R.A.; Grisafi, P.; Fink, G.R. EIR1, a root-specific protein involved in auxin transport, is required for gravitropism in Arabidopsis thaliana. Genes Dev. 1998, 12, 2175–2187. [Google Scholar] [CrossRef] [PubMed]
  55. Barbosa, I.C.R.; Hammes, U.Z.; Schwechheimer, C. Activation and Polarity Control of PIN-FORMED Auxin Transporters by Phosphorylation. Trends Plant Sci. 2018, 23, 523–538. [Google Scholar] [CrossRef] [PubMed]
  56. Adamowski, M.; Friml, J. PIN-Dependent Auxin Transport: Action, Regulation, and Evolution. Plant Cell 2015, 27, 20–32. [Google Scholar] [CrossRef] [PubMed]
  57. Weller, B.; Zourelidou, M.; Frank, L.; Barbosa, I.C.R.; Fastner, A.; Richter, S.; Juergens, G.; Hammes, U.Z.; Schwechheimer, C. Dynamic PIN-FORMED auxin efflux carrier phosphorylation at the plasma membrane controls auxin efflux-dependent growth. Proc. Natl. Acad. Sci. USA 2017, 114, E887–E896. [Google Scholar] [CrossRef]
  58. Huang, F.; Zago, M.K.; Abas, L.; van Marion, A.; Galvan-Ampudia, C.S.; Offringa, R. Phosphorylation of Conserved PIN Motifs Directs Arabidopsis PIN1 Polarity and Auxin Transport. Plant Cell 2010, 22, 1129–1142. [Google Scholar] [CrossRef] [PubMed]
  59. Grones, P.; Abas, M.; Hajny, J.; Jones, A.; Waidmann, S.; Kleine-Vehn, J.; Friml, J. PID/WAG-mediated phosphorylation of the Arabidopsis nnnPIN3 auxin transporter mediates polarity switches during gravitropism. Sci. Rep. 2018, 8, 10279. [Google Scholar] [CrossRef]
  60. Zažímalová, E.; Křeček, P.; Skůpa, P.; Hoyerova, K.; Petrášek, J. Polar transport of the plant hormone auxin–the role of PIN-FORMED (PIN) proteins. Cell. Mol. Life Sci. 2007, 64, 1621–1637. [Google Scholar] [CrossRef]
  61. Habets, M.E.; Offringa, R. PIN-driven polar auxin transport in plant developmental plasticity: A key target for environmental and endogenous signals. New Phytol. 2014, 203, 362–377. [Google Scholar] [CrossRef]
  62. Wang, J.-R.; Hu, H.; Wang, G.-H.; Li, J.; Chen, J.-Y.; Wu, P. Expression of PIN genes in rice (Oryza sativa L.): Tissue specificity and regulation by hormones. Mol. Plant 2009, 2, 823–831. [Google Scholar] [CrossRef]
  63. Matthes, M.S.; Best, N.B.; Robil, J.M.; Malcomber, S.; Gallavotti, A.; McSteen, P. Auxin EvoDevo: Conservation and diversification of genes regulating auxin biosynthesis, transport, and signaling. Mol. Plant 2019, 12, 298–320. [Google Scholar] [CrossRef] [Green Version]
Figure 1. Predicted 3D structure of ZaPINs.
Agriculture 12 01318 g001
Figure 2. Predicted phosphorylation sites in ZaPINs.
Agriculture 12 01318 g002
Figure 3. Phylogenetic analysis of PIN proteins among five plant species (conducted using MEGAX with the neighbor joining method). Za: Z. armatum; At: A. thaliana; Os: O. sativa; Ptr: P. trichocarpa; Cs: C. sinensis. A–D represent four phylogenetic groups.
Agriculture 12 01318 g003
Figure 4. Gene structures and conserved motifs. (a) Gene structure of ZaPINs. (b) ZaPIN protein conserved motifs; motifs from 1 to 10 are marked by different colors. (c) PIN family conserved motifs in Z. armatum, blue box: Mem_trans conserved motif, yellow box: Mem_trans superfamily conserved motif.
Agriculture 12 01318 g004
Figure 5. Conserved motif logo analysis. x-axis shows the order of amino acid sequence arrangement, and height is the relative frequency of each amino acid at that position; y-axis shows the height of the amino acid sequence stack, indicative of sequence conservation at that position.
Agriculture 12 01318 g005
Figure 6. Chromosome distribution and synteny analysis of PINs. (a) Chromosome distribution and synteny analysis of ZaPINs. (b) Collinearity analysis of PIN members between Z. armatum and different species. Z. armatum, Arabidopsis, rice, and C. sinensis chromosomes are depicted as differently colored boxes. Collinearity relationships between PIN regions are represented by differently colored lines. Blue, ZaPINs to OsPINs; Red, ZaPINs to AtPINs; purple, ZaPINs to CsPINS.
Agriculture 12 01318 g006
Figure 7. Analysis of cis-acting elements in ZaPINs promoters in Z. armatum.
Agriculture 12 01318 g007
Figure 8. Expression profiles of ZaPINs in different tissues. Color scale represents logarithmic FPKM value (log2 FPKM): red represents high transcript levels and blue represents no transcripts or low transcript levels.
Agriculture 12 01318 g008
Figure 9. Relative transcript levels of ZaPINs under auxin (NAA) treatment. Values are mean ± standard deviation based on triplicate experiments. Each time point will be compared to the 0 h group group and significance will be calculated using a t-test: * indicated p < 0.05, ** indicated p < 0.01, *** indicated p < 0.001, **** indicated p < 0.0001.
Agriculture 12 01318 g009
Figure 10. Relative transcript levels of ZaPINs under gibberellin (GA3) treatment. Values are mean ± standard deviation based on triplicate experiments. Each time point will be compared to the 0 h group group and significance will be calculated using a t-test: * indicated p < 0.05, ** indicated p < 0.01, *** indicated p < 0.001, **** indicated p < 0.0001.
Agriculture 12 01318 g010
Table 1. Primers used for qRT-PCR analyses.
PrimerPrimer Sequence (5′-3′)
ZaACT-FGTGAGCCACACAGTACCCAT
ZaACT-RGGTGAAAGAGTACCCACGCT
ZaPIN1-FACTTTACCCAACACGCTGGT
ZaPIN1-RAGCTTGAGCCTCTTGGTGTT
ZaPIN2-FCTCAAGGTGAACCCAAGCCA
ZaPIN2-RACGTGCCACCTGTAGGAAAC
ZaPIN3-FGGACTGCATGCCGATGTTCT
ZaPIN3-RCAATCAGCACAGGAAGCGAA
ZaPIN4-FGTTGTTAGCATGTGGCCCTG
ZaPIN4-RTGGAAGAGCTGCCTGAATGA
ZaPIN5-FTGGGCCAAGTGTAGTAGCAAG
ZaPIN5-RGGTTCCTGCCCTCCGAATTT
ZaPIN6-FGCAATGCTCCGGAATCAACC
ZaPIN6-RGATAGCCCAAACGGAGAGCA
ZaPIN7-FGGCGCCACAAGAATCACAAG
ZaPIN7-RCGCGACGCCATAAAAAGACC
ZaPIN8-FGGCATCGCGACCTAGCATAA
ZaPIN8-RCCCCTTAGTCCGATGGCAAA
ZaPIN9-FTGGCCGGGTATTGAGGAAAA
ZaPIN9-RCCTTCCGCCGAGAGATCAAG
ZaPIN10-FGCCTTCCGCTATGCTTGTTC
ZaPIN10-RCTGCCAAAATAGCAGTGCCG
ZaPIN11-FAGGACTTGGCATCGTCACTT
ZaPIN11-RCCACAACCGCGTAAACTGGA
ZaPIN12-FTTACTGGCGTTAGGAGGCAA
ZaPIN12-RTACCGCAACCCCGTAAACTG
ZaPIN13-FATTGCTGTGGTTTGCGTTCG
ZaPIN13-RGCACTCCTCTTGAGCCACAT
ZaPIN14-FCAGCAGCCATCCGCAAAAAG
ZaPIN14-RTCTCAGCCACACAACAGCTC
ZaPIN15-FTACTGCTCTTGGCCTGCTTC
ZaPIN15-RTTGCTACCGATGAGTGCTGG
ZaPIN16-FCTGAGGTGAAAGGTTGGCGT
ZaPIN16-RGGATTCCTGAACCTCGCAGA
Table 2. Characteristics of PINs in Z. armatum.
GeneGene IDChromosome LocationNo. of AAMolecular Weight (kD)Theoretical pIInstability IndexGRAVYAliphatic
Index
ZaPIN1Zardc43630.t1Chr33:18461572~1846489254959.829.3133.730.07487.58
ZaPIN2Zardc11981.t1Chr7:52941759~5294442256360.628.5433.140.18093.69
ZaPIN3Zardc29606.t1Chr20:60577488~6057988033537.127.6135.320.818115.25
ZaPIN4Zardc29009.t1Chr20:20274558~2027654731234.548.1335.720.734110.03
ZaPIN5Zardc28594.t1Chr19:59627359~5963114934738.157.5730.260.805115.24
ZaPIN6Zardc52636.t1unanchor10525:28196~3299955159.578.7433.450.334100.43
ZaPIN7Zardc45630.t1unanchor489:82629~8411935738.949.6734.670.677124.96
ZaPIN8Zardc46880.t1unanchor1921:45537~4704838642.369.2536.350.714124.12
ZaPIN9Zardc01636.t1Chr1:86981515~8698375345550.076.3240.450.638126.42
ZaPIN10Zardc28240.t1Chr19:42027501~4203122461066.835.5633.690.716125.28
ZaPIN11Zardc29440.t1Chr20:44357827~4436208540744.078.5934.470.779125.55
ZaPIN12Zardc27357.t1Chr19:26142114~2614627840543.997.5133.930.713121.11
ZaPIN13Zardc30903.t1Chr22:2924357~292671042146.155.7042.440.635123.23
ZaPIN14Zardc26161.t1Chr18:67606835~6760914342346.726.1045.800.571118.51
ZaPIN15Zardc09344.t1Chr6:95154~9734838451.234.8545.640.730126.48
ZaPIN16Zardc24304.t1Chr17:24324787~2433139351044.298.6140.250.661123.93
Table 3. Predicted secondary structure and subcellular location of ZaPINs.
ProteinAlpha Helix (aa)
(Proportion (%))
Extended Strand (aa)
(Proportion (%))
Beta Turn (aa)
(Proportion (%)
Random Coil (aa)
(Proportion (%))
Predicted Subcellular
Location
ZaPIN1173 (31.51%)77 (14.03%)30 (5.46%)269 (49.00%)Plasma Membrane (13)
ZaPIN2161 (28.60%)81 (14.39%)24 (4.26%)297 (52.75%)Plasma Membrane (11)
ZaPIN3199 (59.40%)42 (12.54%)18 (5.37%)76 (22.69%)Vacuolar Membrane (11)
ZaPIN4172 (55.13%)47 (15.06%)15 (4.81%)78 (25.00%)Vacuolar Membrane (12)
ZaPIN5187 (53.89%)56 (16.14%)18 (5.19%)86 (24.78%)Vacuolar Membrane (7)
ZaPIN6186 (34.38%)88 (16.27%)29 (5.36%)238 (43.99%)Plasma Membrane (11)
ZaPIN7187 (52.38%)56 (15.69%)17 (4.76%)97 (27.17%)Plasma Membrane (7)
ZaPIN8216 (55.96%)55 (14.25%)20 (5.18%)95 (24.61%)Plasma Membrane (11)
ZaPIN9194 (42.64%)73 (16.04%)14 (3.08%)174 (38.24%)Plasma Membrane (11)
ZaPIN10228 (37.38%)127 (20.82%)24 (3.93%)231 (37.87%)Plasma Membrane (11)
ZaPIN11166 (40.79%)85 (20.88%)16 (3.93%)140 (34.40%)Plasma Membrane (10)
ZaPIN12168 (51.48%)76 (18.77%)15 (3.70%)146 (36.05%)Plasma Membrane (11)
ZaPIN13171 (40.62%)91 (21.62%)13 (3.09%)146 (34.68%)Plasma Membrane (7)
ZaPIN14163 (38.53%)88 (20.80%)14 (3.31%)158 (37.35%)Plasma Membrane (9)
ZaPIN15171 (44.53%)71 (18.49%)13 (3.39%)129 (33.59%)Vacuolar Membrane (8)
ZaPIN16170 (51.46%)85 (20.73%)17 (4.15%)138 (33.66%)Vacuolar Membrane (12)
Table 4. Ka/Ks analysis of collinear gene pairs of Z. armatum.
Gene Pair NameGene Pair IDKaKsKa/Ks
ZaPIN14/ZaPIN13Zardc26161.t1/Zardc30903.t10.078 0.177 0.438
ZaPIN12/ZaPIN11Zardc27357.t1/Zardc29440.t10.041 0.138 0.298
ZaPIN10/ZaPIN11Zardc28240.t1/Zardc29440.t10.573 2.157 0.266
ZaPIN8/ZaPIN7Zardc46880.t1/Zardc45630.t10.0430.260 0.166
Zardc27658.t1/ZaPIN2Zardc27658.t1/Zardc11981.t10.032 0.297 0.106
ZaPIN1/Zardc06555.t1Zardc43630.t1/Zardc06555.t10.038 0.236 0.162
ZaPIN2/Zardc12357.t1Zardc11981.t1/Zardc12357.t10.005 0.035 0.156
Publisher’s Note: MDPI stays neutral with regard to jurisdictional claims in published maps and institutional affiliations.

