Article

Nondestructive Detection of Microcracks in Poultry Eggs Based on the Electrical Characteristics Model

1
College of Intelligent Equipment, Shandong University of Science and Technology, Tai’an 271019, China
2
College of Mechanical and Electronic Engineering, Shandong Agricultural University, Tai’an 271018, China
*
Author to whom correspondence should be addressed.
Agriculture 2022, 12(8), 1137; https://doi.org/10.3390/agriculture12081137
Submission received: 28 June 2022 / Revised: 25 July 2022 / Accepted: 29 July 2022 / Published: 31 July 2022
(This article belongs to the Special Issue Robots and Autonomous Machines for Agriculture Production)

Abstract

:
The eggshell is the major source of protection for the inside of poultry eggs from microbial contamination. Timely detection of cracked eggs is the key to improving the edible rate of fresh eggs, hatching rate of breeding eggs and the quality of egg products. Different from traditional detection based on acoustics and vision, this paper proposes a nondestructive method of detection for eggshell cracks based on the egg electrical characteristics model, which combines static and dynamic electrical characteristics and designs a multi-layer flexible electrode that can closely fit the eggshell surface and a rotating mechanism that takes into account different sizes of eggs. The current signals of intact eggs and cracked eggs were collected under 1500 V of DC voltage, and their time domain features (TFs), frequency domain features (FFs) and wavelet features (WFs) were extracted. Machine learning algorithms such as support vector machine (SVM), linear discriminant analysis (LDA), decision tree (DT) and random forest (RF) were used for classification. The relationship between various features and classification algorithms was studied, and the effectiveness of the proposed method was verified. Finally, the method is proven to be universal and generalizable through an experiment on duck eggshell microcrack detection. The experimental results show that the proposed method can realize the detection of eggshell microcracks of less than 3 μm well, and the random forest model combining the three features mentioned above is proven to be the best, with a detection accuracy of cracked eggs and intact eggs over 99%. This nondestructive method can be employed online for egg microcrack inspection in industrial applications.

1. Introduction

As one of the main sources of protein nutrition in human daily life, the importance of poultry eggs and related products is self-evident. From 2010 to 2030, global egg production will be increased by 35%, with Asia contributing 64.8% to the total global growth [1]. In the preliminary processing of eggs, such as cleaning, testing, transportation, and other procedures, eggshell damage may occur, and bacteria and other microorganisms may enter the eggs from the cracks and cause spoilage before infecting the surrounding good eggs. This may not only lead to a shortened shelf life and lowered value but also make the food unsafe to eat, causing economic losses to enterprises in the end. Traditional eggshell crack detection mainly depends on artificial light or the sound produced upon impact to the eggs to identify cracked ones, which not only sets high requirements for the experience and physical condition of workers, but the efficiency and reliability cannot meet the growing market demand. Therefore, it is of great significance for consumers, enterprises, and agricultural modernization to study a highly reliable, non-destructive, and automatic cracked egg removal system [2].
In recent years, researchers both nationally and internationally have been trying to find an automatic online approach to detecting eggshell cracks so as to lower labor intensity and improve the efficiency and accuracy of detection. The related research mainly focuses on acoustic analysis and machine vision. Acoustic analysis has been proven to be an effective method for detecting cracked eggs [3]. Li Sun et al. built an equivalent mechanical model based on an automatic excitation device and analyzed the transient impact. They used cross-correlation analysis and Bayesian classification to detect eggshell cracks, which could reach a detection level of 97% [4]. P. Coucke et al. proposed exciting the eggs with a small impact hammer and extracting the spectral features of acoustic signals as the input vector of the classification algorithm, whose detection accuracy could reach 90% [5]. A non-destructive detection technique proposed by Cho et al. based on acoustic impulse response employed eight frequency domain indexes, such as the average area of the power spectrum, as input vectors, where multivariate discriminant analysis and multivariate regression analysis were used to establish a classification model. Its detection accuracy could reach 95% [6]. Deng et al. proposed a crack detection method based on a continuous wavelet transform and support vector machine (SVM). They integrated four wavelet features such as the first resonance scale and achieved a detection accuracy of 98.9% [7]. Sun et al., based on acoustic resonance, analyzed the difference in the frequency response signals between intact eggs and cracked eggs, extracted five excitation resonance frequency characteristics, such as the spectral peak, as input vectors, and achieved a detection accuracy of 96.11% [8]. Lai et al. measured the acoustic signals of intact duck eggs and cracked duck eggs, and they selected the five most significant frequency features as the input vectors in logistic regression analysis. The overall detection accuracy could reach 87.6% [9]. Wang et al. developed an excitation device driven by solenoids, producing sound signals by striking the eggs. The time domain and frequency domain features of 12 kinds of sound signals were extracted while using a neural network with feature dimension reduction as the classifier. The detection accuracy was as high as 99.2% in the training set, but it was slightly lower—about 95%—in the test set [10]. The detection approach for cracked eggs based on acoustic signals is very effective, and its accuracy can basically meet the requirements for application. However, this approach is susceptible to such factors as an uneven eggshell thickness, surrounding noise, the egg shape, crack position, striking angle, and so on. Moreover, a lack of stability or knocking with too much strength may cause secondary damage to the eggs [11,12]. In addition, the detection of egg cracks based on machine vision has also made great progress [13,14]. Elster et al. first applied machine vision technology to eggshell crack detection and could find the cracked eggs among the samples with an accuracy of 95.6%. However, it took 25.3 s to identify a cracked egg, which was relatively slow [15]. The cracked egg detection system designed by Gooddrum et al. was able to adjust the speed of the rotating device according to the size of the egg. Three images were taken for each egg at an interval of 120° near the equator, with a recognition accuracy of up to 90% [16]. Li et al. proposed a vacuum pressure chamber-based detection system which imposed a vacuum pressure of 18 kPa to enlarge the microcrack and reached a detection accuracy of 100% under a situation without stains [17]. However, at present, this method is only in the laboratory stage, so it cannot be used in actual industrial production lines. Wang et al. proposed a method for detecting cracks in eggs using multi-information fusion of a natural light image and polarization image with an accuracy of 94% [18]. Bao et al. aimed at the phenomenon of dark spots on the surface of eggshells under backlight conditions, adopted a negative LOG operator for image enhancement, set a threshold to eliminate black spots, and finally detected cracks through the LFI index, with the detection accuracy being up to 92.5% [19]. Muammer proposed a machine vision detection system based on deep learning, in which six images of egg surfaces were captured in the process of the continuous rotation of an egg, and the depth features were extracted by a pretrained residual network in parallel and then input into the BiLSTM network to carry out the detection of cracked eggs. The accuracy rate was up to 99.17% under experimental conditions [20]. Most of the above research methods were implemented in a laboratory environment, and in industrial production, the identification accuracy will be greatly affected due to the difference in the size, shape, depth, and other features of eggshell cracks, as well as such factors as the shooting angle and bright spots and stains on the shell. Therefore, it is still an urgent problem to study a new method that can meet the requirements of automatic detection of eggshell cracks in industrial production.
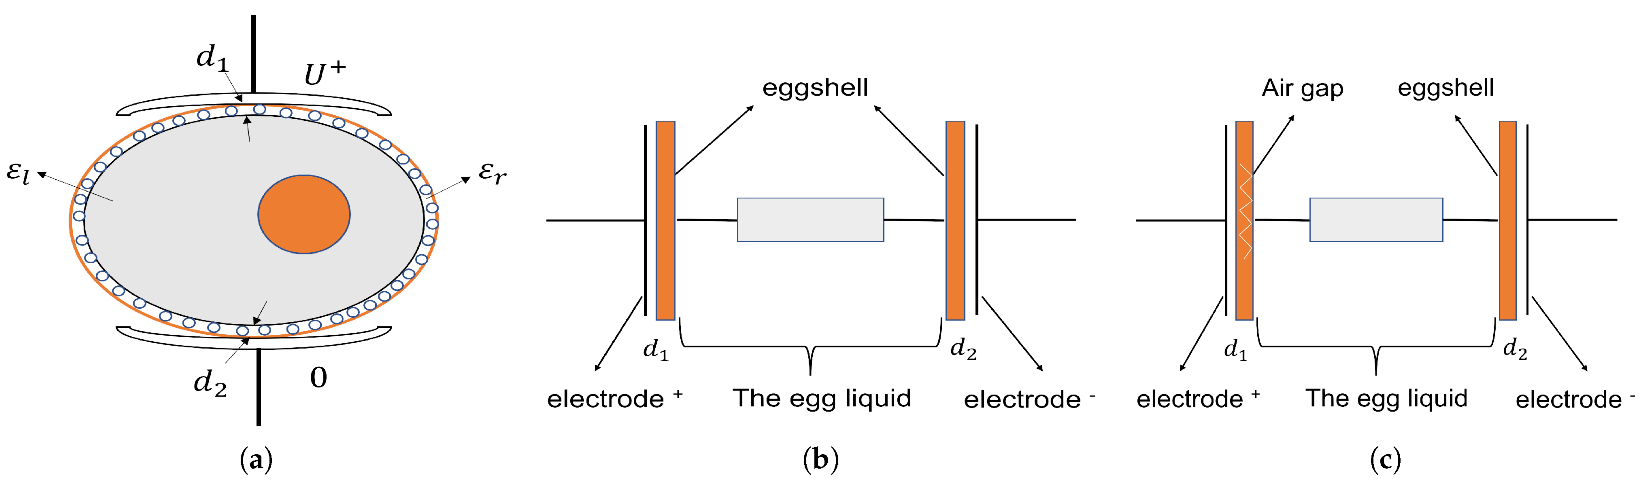
High-voltage leak detection(HVLD) is a type of common and mature non-destructive defect detection technology which is mainly used in the pharmaceutical industry and the food industry, with the advantages of high speed and high precision. In this method, electrodes are usually linked at both ends of a container with a non-flammable conducting liquid, and a high voltage is applied. Equivalent capacitance is generated between the liquid and the electrode due to the bottle wall. When the container is intact, there is a tiny current in the circuit, but if the container has cracks and leaks, the capacitance disappears and causes a discharge between the electrodes. Therefore, the discharge analysis technology can be used to detect the tiny cracks and damages of the container with high precision. Yoon S. Song et al. studied the important role the key variables play in the detection of tiny pinhole leakages in flexible bags and semi-rigid cups using high-voltage technology. They applied 0.25–10 kV to the packaging, and the results showed that the HVLD technology could detect defects of less than 10 μm [21]. Moll et al. studied and verified the use of high voltage to detect the defects of blow-fill-seal containers with an accuracy of 100% [22]. Sun Jun et al. studied a non-destructive method to identify egg varieties based on their dielectric properties. They used parallel plates to measure the dielectric properties of eggs at 10∼200 kHz and established a fast identification and classification model of egg varieties by using the SVM algorithm, which met the requirements of classification well [23]. However, as far as we know, no researchers have applied the relevant research methods and ideas to the detection of cracks in poultry eggs.
Therefore, this research is aimed at proposing a novel and convenient nondestructive method to detect cracks in poultry eggs in the industrial field. The main objectives of the study are as follows:
  • Focused on the analysis of the physical properties of the eggshell, study the electric field characteristics inside and outside the eggs under the action of electrodes and establish the dynamic capacitance model and electrical breakdown model of an egg innovatively;
  • Design a microcrack detection system based on discharge analysis, with which microcracks on an eggshell can be detected by analyzing the weak current changes in the circuit;
  • Analyze and compare the crack detection algorithms and feature selection of eggs;
  • Verify the universality and generalization of the proposed method.

2. Electrical Characteristics of Poultry Eggs

2.1. Physical Characteristics of Poultry Eggs

A complete poultry egg is composed of an eggshell, egg membrane, egg white, yolk, air chamber, etc. as shown in Figure 1a. The main component of the eggshell is calcium carbonate, which accounts for about 11% of the volume of the whole egg. They are hard and play an important role in protecting the egg white and yolk, exchanging gases with the outside world, and providing minerals for embryonic development. Its structure is shown in Figure 1b [24]. The common eggshell includes three layers with slightly different microstructures, and its radial cross section is shown in Figure 1c [25]. The outermost part of the shell is dense, meticulous, and has a certain strength, and thus it is called the cuticle. The middle layer is spongy and densely covered with many small holes, while the innermost layer, called the papillary layer, is pyramidal, and the spaces between the layers can hold air. On the surface of the eggshell lie pores of about 30 microns in diameter. These are called stomata, through which gas exchange and water evaporation occur.

2.2. Model of Electrical Characteristics of Poultry Eggs

A dielectric in the electric field produces an equivalent bound charge on the atomic scale under the electric field force, and this phenomenon is called dielectric polarization. For an eggshell, when the electric field intensity exceeds a certain value, the bound charge is forced to flow, causing dielectric breakdown and losing its insulation. Therefore, it is very important for the detection of the eggshell cracks to calculate the electrostatic fields of eggs and analyze the current change in the circuit. For this reason, we designed a dynamic detection method for cracks. The microcurrent will be generated at the crack of an eggshell when the egg rotates dynamically in the detection device, which is jointly generated by two models that will be discussed below: one is the electrical breakdown, and the other is capacitance jump. The total current is as follows:
I = I 1 + I 2
where I 1 is the microcurrent generated by electrical breakdown and I 2 is the microcurrent generated by the capacitance jump.

2.2.1. Model of Capacitance of a Poultry Egg

An electrostatic field with the medium is produced jointly by the bound charge and free charge. In order to represent the electric field, which is under the joint action of both charges, another field vector–electric flux density D , also known as electric displacement, is introduced, which is defined in Table 1, where E is the electric field intensity, P is the electric polarization intensity, and ε 0 is the vacuum dielectric constant.
As shown in Figure 2, when there are poultry eggs in the electric field, the properties of the spatial electrostatic field are related to the free charge ( q 0 ) and the distribution of the dielectric. The macroscopic electrical properties of the dielectric can be replaced by a polarized charge ( q ), and then the total spatial electrostatic field consists of E 0 and E , as shown in Table 1. Here, E 0 represents the applied electric field formed by a free charge, and E represents the electrolyte polarization electric field formed by a polarized charge. In a linear isotropic dielectric, the electric polarization intensity P is defined as ε 0 X e E , which can be seen in Table 1, where X e is the electric polarizability rate. Therefore, we have
D = ε 0 ( 1 + X e ) E = ε 0 ε r E
In the above formula, ε r = ( 1 + X e ) stands for relative permittivity, which is a physical parameter characterizing the dielectricity or polarization of dielectric materials, also known as relative permittivity. After the electric displacement vector D is obtained, the Gauss theorem in the medium can be formulated, which is defined in Table 1, where S denotes any closed surface in the medium and q denotes a free charge.
We can think of the two electrodes and the egg in the middle as one capacitor, as shown in Figure 3a, where the eggshell is an insulator and the egg liquid is approximately a conductor due to a low resistance value. In an equilibrium state, there is no current in the circuit. The egg liquid has a certain conductivity, so the dielectric constant ε L of the egg liquid is large. If the egg liquid is approximated as a good conductor, according to the position of the upper and lower electrodes and the poor conductivity of the eggshell, the electrical characteristic model under this connection mode can be approximated as the series of two plate capacitors, as is shown in Figure 3b, and then the electric field distribution under the intact eggshell is U = E 1 d 1 + E 2 d 2 . Therefore, according to the plate capacitance formula, the equivalent capacitance C 1 is ( d L , d W , where L is the length of the electrode and W is the the width of the electrode):
C 1 = 4 π ε l ε r L W d 1 + d 2
where d 1 and d 2 are the thickness of the upper and lower layers of eggshell, respectively.
text
Figure 3. Capacitance system diagram. (a) Schematic diagram of the capacitor system, composed of the electrode and egg body. (b) Schematic diagram of equivalent capacitance of system when the electrode is not at the crack. (c) Schematic diagram of equivalent capacitance of the system when electrode is at the crack.
Agriculture 12 01137 g003
When a crack exists in an eggshell, the electrical characteristics model of the egg change as shown in Figure 3c, and then
U = U 1 + U 2 = Q C 1 + Q C 2
U 1 = Q C 1 = U C 1 C 2 C 1 + C 2 = U C 2 C 1 + C 2 = U 4 π ε l ε r S d 2 4 π ε l S d 1 + 4 π ε l ε r S d 2 = d 1 ε r d 2 + ε r d 1 U
The electric field at a crack can be defined as
E 1 = U 1 d 1 = ε r d 2 + ε r d 1 U
When the air breakdown electric field is E 1 p = 30 KV / cm , and d 1 = d 2 d = 350 μ m , then the breakdown voltage U p is
U p = d 2 + ε r d 1 ε r E 1 p d E 1 p = 3.5 × 10 4 × 3 × 10 4 × 10 2 = 1050 V
At this time, the plate capacitance C 2 is
C 2 = 4 π ε l ε r L W ε r d 1 + d 2
The experimental results show that if there is no crack in the eggshell of the egg rotating in the middle of two electrodes, the equivalent capacitance value would stay basically stable at C 1 in the whole process. However, if there is a crack in the eggshell, the equivalent capacitance will jump between C 1 and C 2 when the electrode passes the cracks of the rotating egg, resulting in a transient current. Setting the egg rotation as an angular velocity of α , the time to rotate the width of W is W α R , where R is the radius of the egg. Therefore, when the egg rotates from a no crack zone to a crack zone, the current generated is
I = Δ Q Δ t = U Δ C W α R = U α R W · 4 π ε l ε r L W ( 1 d 1 + d 2 1 ε r d 1 + d 2 ) = U α R · 4 π ε l ε r L · ( ε r 1 ) d 1 ( d 1 + d 2 ) ( ε r d 1 + d 2 )
If d 1 d 2 = d , then
I U α R · 4 π ε l ε r 2 L 2 ( ε l + 1 ) d
The following data were obtained in the experiment: the angular velocity was 2 cycles/SEC, α = 4 π , the radius of the shell R = 3 × 10 2 m , ε l = 8.85 × 10 12 , the C a C O 3 dielectric constant of the eggshell ε r 8.8 , the length of the electrode L = 4 × 10 2 m , and the shell thickness was 350 μ m . Then, we have
I 4 π × 3 × 10 2 × 4 π × 8.85 × 10 12 × 8 . 8 2 × 4 × 10 2 × U 2 × ( 8.8 + 1 ) × 3.5 × 10 4 = 1.894 × 10 8 × U
where when U = 1500 V , I 28.4 μ A .
Figure 4 shows the current curves collected when detecting intact eggs and cracked eggs under the above electrode shapes and experimental parameters. The blue line represents intact eggs, and the red line represents cracked eggs. It is clear that there was a peak in the data for cracked eggs. In the online detection system, the detected current value may be the microcurrent generated by a capacitance jump or microcurrent superposed with that produced in the electric breakdown.

2.2.2. Electric Breakdown Model of Poultry Eggs

According to the basic principle of electric breakdown, if the voltage applied to an insulator is increased, the number of charge carriers in the material will increase sharply under a certain electric field, and its resistivity will decrease, resulting in producing a strong current. For poultry eggs, an intact one is not conductive under normal conditions, but when there is a crack in the eggshell, an air interlayer with low insulation may occur in the eggshell. Because the breakdown voltage of the air dielectric is much less than that of a solid dielectric, when high voltage is applied on both sides of the egg body, an egg with cracks is more likely to cause electrical breakdown, and there will be a significant difference in the current.
Since the width of the crack is much smaller than the size of the eggshell or the electrode, it can be approximated that the electric field in the crack area is uniform. The gap breakdown voltage is subject to Paschen’s law when the air pressure is below 1 standard atmosphere (about 0.1 mpa):
V = f ( p d )
where p is the air pressure and d is the distance between the electrodes.
The breakdown voltage U b can be calculated according to the empirical formula:
U b = B p d ln ( A p d ln 1 γ )
where γ is the ionization coefficient and A and B are constants related to the composition of the air. At standard atmosphere pressure, A = 43.66 and B = 12.8 .
For a static, intact egg, a sudden change in current occurs when solid dielectric breakdown occurs. The breakdown voltage of a solid dielectric is much higher than that of an air dielectric, so if we keep the voltage at both electrodes stable and only allow air dielectric breakdown, we can identify cracked eggs according to the change in current signals. Therefore, the key to the problem is to apply a stable electric field at the crack that can break down the air but not the eggshell. This problem is solved by analyzing the electrode shape and simulation experiments under different voltages. As is shown in Figure 5, there was a tiny crack in the Z direction on top of the egg. U-shaped linear electrodes were applied to the upper and lower sides of the egg to wrap the eggshell to the maximum extent and make the electric field uniform. By adjusting the electrode shape and voltage, the current detection system was optimized in the simulation environment and verified by experiments in the real scene.
At the same time, the conditions of the air in the crack gap, such as the temperature, humidity, and other factors, will affect the ionization tendency of the air and correspondingly affect the breakdown voltage or discharge voltage in the crack gap. When the temperature decreases, the density of the air increases, the mean free path of free electrons in the air is shortened, and it is not easy to cause collision ionization, thus causing the breakdown voltage of the air to increase. As an electronegative gas, water vapor easily captures free electrons and transforms them into negative ions when the humidity of the air increases, which weakens the ionization and decreases the breakdown voltage of the air. Given the potential influence of the high temperature and humidity in the egg production line, special attention should be paid to these factors in the process of the analysis and experiment.
In short, the final current value is usually the superposition value of the current generated by the above two cases. When the electrodes are passing the cracked area of the rotating egg, if the detection voltage is less than the breakdown voltage threshold, the total current in Equation (1) is mainly I 2 ; otherwise, the total current is mainly I 1 .

3. System Design and Analysis Methods

3.1. Design of the Detection System

The experimental platform for poultry egg crack detection mainly consisted of five parts: a detection platform, high-voltage power supply, controller, data acquisition circuit, and industrial personal computer, as is shown in Figure 6. The detection platform was composed of a rotating mechanism, discharge electrodes, electrode adjustment mechanism, and other parts, as is shown in Figure 7a. To ensure perfect contact between the electrode and the surface of the poultry eggshell, the upper electrode was made flexible and egg-like and 10 cm wide, and it had four layers of conductive silica gel with different lengths stacked on top of each other. The lower electrode was initially designed to imitate an egg as well, but that led to uneven contact due to the different sizes of the eggs. The lower electrode was later made into a long bar shape, but this shape still did not work because the exposed part of the electrode outside the fixed seat was too short (2 mm) and required the lower electrode to reach for it flexibly, which gave the egg an upward support force and made it difficult to rotate. After a large number of experiments, we found that when the lower electrode took an arc convex shape with little contact, it provided a stable and reliable contact bottom without affecting the rotation. The rotating mechanism included three parts: a servo drive, saddle-shaped support rollers, and an upper spring roller. The servo drive provides a stable driving force to drive rollers on the left and right of the eggs and ensure that eggs of different sizes can rotate evenly without shifting, while the upper spring roller presses the egg to ensure that the eggs can still rotate evenly in place when they come into contact with the electrode and generate friction. The electrode adjustment mechanism can adjust the electrode position according to the egg so as to adapt to different egg sizes, ensure that the electrode fits the egg surface better, and thus provide stable and reliable surface contact. The data acquisition circuit used an STM32F103 microcomputer and 16-bit A/D converter as the core, and the maximum sampling frequency was 12 MHz, which could meet the requirements of the sampling speed and accuracy. The industrial personal computer was used to record and process the current sampling data. Through the analysis and processing of the current signals, it could identify whether there was a crack in the eggshell and then drive the automatic device to remove the cracked egg. The experimental device is shown in Figure 7b.

3.2. Electrode Shape Design

The eggshell is composed of a large amount of calcium carbonate containing tiny pores, and it does not conduct electricity under normal conditions. The inner membrane of the eggshell is a network of organic fibers made of keratin, which together with the egg liquid is a conductor and can conduct electricity under normal conditions. The pores are small in diameter and evenly dispersed. They usually have long and curved air paths extending through the shell toward the inside of the egg, while cracks are characterized by short air paths that extend horizontally on the shell and are concentrated along the crack. Therefore, it is notable to distinguish the pores and cracks in the design of the discharge electrode and ensure that the electric field in the egg body area is uniform. The effective area of detection is another aspect to note. The detection area covered by the electrodes in this paper did not include the tip and blunt end, and only the equatorial part of the egg and the central area between the two ends were covered for crack detection. Moreover, missing out on detection due to gaps between the electrode pieces may have occurred. All these factors mentioned above added difficulty to the design, and they should be carefully dealt with in the design of the electrode.
According to the analysis in Section 2, the charge density is proportional to the curvature of the electrode tip, which means the tip electrode is most likely to produce high-voltage and discharge phenomena. We selected six eggs randomly, made holes at the blunt ends of the eggs, and poured out the inside liquid before we tested the discharge voltages under smooth electrodes, single-tip electrodes, and multi-tip electrodes, as shown in Figure 8. The experimental data shown in Table 2 show that the smooth electrode discharge voltage matched with the polar plate discharge, and the single-tip electrode discharge voltage was slightly higher than that of the smooth electrode. As for the single-tip electrode, it may be difficult to align one end with the other end, which causes the breakdown voltage to increase. On the other hand, this may be because the energy is excessively concentrated in the tip and cannot form a large air column breakdown. The discharge voltage of the multi-tip electrode was close to that of the smooth electrode, which indicates that the multiple tips could reduce the breakdown voltage. Problems were still found in the experiment, such as an increased electrode distance and fewer actual effective tips. The tip electrode had the smallest coverage area on the eggshell surface. When it was in a crack-free area, it could only cover a few pores. When it was in a cracked area, the area ratio of the covered air area changed significantly, so it could effectively distinguish cracks and pores and had a high detection ability. However, the point-shaped tip electrode could only detect eggshells in a very small area near the electrode at one time, and the detection efficiency was low. The spatial electric field generated by the tip electrode was also unevenly distributed, which led to an unstable detection accuracy. Therefore, it is not an ideal electrode shape.
Conversely to the point electrodes, planar electrodes offer significant advantages in terms of detection efficiency and spatial distribution of the electric field. However, the shape and size of the egg body vary greatly, and it is difficult to make a flexible electrode that perfectly fits the surface of the egg. The accumulated value of the current generated by too many pores in the non-cracked eggs under the electrode was also close to the current value generated by the cracked egg, resulting in a significant decrease in the detection accuracy, so the planar electrode is also not an ideal shape for electrodes.
The linear electrode combines the advantages of the above two electrodes. It is better in spatial electric field uniformity, more efficient in detection, and more accurate in identification. In addition, the line contact of the conductive material, which can contain the outline of the egg and fit the surface of the eggshell, is an ideal form of contact.

3.3. Electrode Material Analysis

We selected conductive silica gel, conductive rubber, and a conductive brush as the electrode materials for the experiments and found that the egg cracks could be identified with all three materials. The resistivity of the conductive rubber was large, and the current change was not obvious enough when it was used as an electrode. When a conductive brush was used as the electrode, the conductive brushes would fuse after discharge and cause a great loss of electrode material. In contrast, the resistivity of the conductive silica gel was small and could produce an obvious current change when passing the cracked area. Therefore, conductive silica gel was selected as the electrode material in this paper.
To sum up, the current is not only related to the resistivity of electrode materials but also closely related to the contact area of the conductive materials. However, it is not a case of “the larger the better” for the contact area, as too large a contact area will lead to a large current for non-cracked eggs. The more ideal form of contact is line contact, which is made according to the outline of the egg so as to fit the eggshell perfectly. The actual structure of the electrode is shown in Figure 9.

3.4. The Importance of Multi-Layer Flexible Electrodes

Since eggs vary somewhat in size and shape, the design of a flexible electrode can better fit the eggshell and achieve full coverage of an effective detection area by dynamically adjusting the angle according to the eggs. Although a single-layer flexible electrode can effectively detect cracks, their coverage area is limited. When detecting larger eggs, gaps between the electrode strips may cause omissions during the egg rotation if the cracks are just perpendicular to the gaps. The use of multi-layer flexible electrodes can reduce the chances of missed detection of egg cracks, which plays a significant role in improving the overall detection accuracy and can also further reduce the detection voltage.

3.5. Lab Environment

We selected 10 eggs randomly and put 5 eggs in a group to test the electrical characteristics under different humidity environments. The mean current curve is shown in Figure 10. The experiment found that the measured current value in the environment with a humidity of 72% and voltage of 1500 V was equivalent to that in the environment with a humidity of 54% and voltage of 1800 V, which further proved the conclusion of Section 2 that the detection of egg cracks based on current signals was greatly affected by environmental humidity. Therefore, during the data collection, the humidity and temperature of the experimental environment should be stabilized within a certain range to reduce the influence of the environment on the experimental data.
The voltage value used in HVLD is generally high, even reaching up to tens of thousands of volts at certain times. If it is directly used for the detection of egg cracks, the protein may be denatured. In order to avoid this, we had to choose an appropriate voltage range. All things considered, we finally determined that the experimental environment was perfect at an average temperature of 18.5 C, a relative humidity of 40 % , and a voltage of 1500 V. We strictly controlled the current size, and the system current protection mechanism would be triggered to cut off the power when the current was greater than 1 mA so it would not cause damage to the eggs.
In order to quickly obtain a sufficient number of egg samples with microcracks and avoid the instability of manual striking, we designed an egg crack striking machine to control the size of the artificial cracks and prevent the egg contents from leaking. The machine is shown in Figure 11a. Eggs are fixed at the bottom of the track, and the rollers are released from different heights and strike the egg at the equatorial part to generate controllable microcracks. The width of the artificial microcracks is generally less than 3 microns, which is usually not easy to observe with the human eye. Microcracks are mainly located in the central area between two ends of the egg and only present in the effective detection area. Egg samples with cracks at the tip or blunt end will be discarded. In actual production, there are not only large cracks caused by strong striking but also a large number of microcracks of several microns, which are difficult to detect by traditional methods. The structure of a microcracked egg under an industrial microscope is shown in Figure 11b,c.

3.6. Classification Modeling Methods

3.6.1. Linear Discriminant Analysis

Linear discriminant analysis (LDA) [26] is widely used in the field of high-dimensional data classification as a supervised dimensionality reduction technology. It takes the separability of pattern data as the goal and finds a set of optimal discriminant vectors, which maximizes the between-class scatter measures while minimizing the within-class scatter measures. In this study, the eggshells could be divided into intact eggs and cracked eggs. This was a classification problem. Letting C be the number of categories, where C = 2, x is the n-dimensional features of the training sample, and N is the number of samples, the sample’s within-class scatter matrix S W and between-class scatter matrix S B are shown below in Equations (14) and (15), respectively:
S W = 1 N i = 1 C x c i ( x μ i ) ( x μ i ) T
S B = i = 1 C p i ( μ i μ ) ( μ i μ ) T
where p i = N i N is the prior probability of each class, N i is the number of training samples of class C i ( i = 1 , 2 , , C ) , μ i is the mean value of sample C i , and μ is the mean of all samples.
The goal of LDA is to find the best projection matrix W so that the Fisher criterion is the largest, and its formula is
J ( W o p t ) = arg max W W T S b W W T S W W

3.6.2. K-Means Classification Algorithm

K-means [27] is a common unsupervised learning algorithm that is often used to discover the inherent regularities between datasets. The principle is that K samples are first randomly selected as cluster centers of K categories, and then, the Euclidean distance between the sample data and the k-th centroid is calculated to judge the correlation with this category. Then, it belongs to the category with the highest correlation. Such centroids will also be recalculated with the addition of new samples until the iteration is completed or the preset number of iterations is reached. The Euclidean distance between samples is
D ( x i , x j ) = n = 1 N ( x i , n x j , n ) 2
where D x i , x j is the Euclidean distance between samples x i and x j and N is the dimension of the sample data. x i represents the i-th sample data, and x j represents the j-th sample data. If the sample has C categories, C k is used to represent the k-th cluster center, where k = 1 , 2 , , K . First, K points in the sample are selected as centroids, followed by calculating the similarity between other points and the cluster center points and dividing them into K sets, denoted by C k . Finally, the new cluster center is recalculated. The formula for C k is
C k = 1 m k x C k x k
where m k is the number of k-th category elements. During this process, the K-means clustering algorithm continuously reclassifies and updates the cluster centers, and this ends when the iteration reaches the maximum limit or the objective function is smaller than the threshold. Its objective function is
J = i = 1 K x i C i D x i , x j ( x i , C k )

3.6.3. SVM

A support vector machine (SVM) is based on statistical learning and can solve linear and nonlinear problems at the same time. It shows good performance [28,29], especially in small-sample data when applied in a series of challenging practical problems. The basic idea of SVM is to find the optimal hyperplane that distinguishes the two classes by training the sample set and maximizing the distance between the segmentation plane or hyperplane and the data points in the given dataset.
The current signal obtained in this paper was not linearly separable, so it was necessary to first select an appropriate kernel function to map it to a high-dimensional space and then optimize it. Up to now, there has been no generally accepted selection criterion for the selection of the kernel function. The commonly used kernel functions mainly include Gaussian kernel function, polynomial kernel function, linear kernel function, and sigmoid kernel function. Owing to its advantages of few parameters and fast convergence speed, Gaussian kernel function was used for kernel transformation in this paper. Its mathematical definition is shown in Equation (20) [30]:
K ( x , y ) = e x y 2 2 σ 2
where x and y are the eigenvectors of the current signal.

3.6.4. CART Decision Tree

A decision tree [31] is a supervised machine learning algorithm that can be used to classify or predict unknown objects. The construction of the decision tree is a process of top-down and recursive branching. First, we selected the most effective division method for the samples according to the features, formed a new decision branch, and then pruned the branch to optimize the decision tree. Commonly used decision tree generation algorithms mainly include ID3, C4.5, and CART. We employed the CART model in this study and used the GINI index to select the optimal division points of the optimal features. The basic principle is to form a decision tree structure in the form of a binary tree by cyclic analysis of the training dataset and select the attribute that minimizes the GINI index value of the child nodes as the classification scheme.

3.6.5. Random Forest

A random forest [32] uses a decision tree as the base classifier. It improves the overfitting problem of a decision tree by combining the bagging ensemble learning theory and random subspace method. Based on the idea of multiple decision trees, the random forest generates the training data of each tree by random extraction from the original dataset and then randomly extracts n features from N feature variables before finally selecting the optimal feature variables from these n features as split features to construct multiple decision trees. Finally, each of the decision trees gives a class prediction, and the class with the most votes becomes the model’s prediction.

4. Experiments and Results

4.1. Data Acquisition

We purchased 770 eggs at a farmer’s market near the laboratory and collected current signals for model training and algorithm verification, including 367 intact eggs and 403 cracked eggs. To avoid the noise introduced by stains on the eggshells, which may have affected the experiment, the cleaning and drying process in the actual egg factory was simulated before data acquisition. As for the impact of cleaning on the test results, we came to the conclusion after small-scale experiments that cleaning could remove the stains on the surface of the eggshell and reduce the interference with the current signal acquisition. Meanwhile, the water molecules during cleaning could wet a part of the crack gaps that were generated and had been blocked for a long time, which contributed to the conductivity of the cracks.
At the initial stage of data acquisition, each egg was used only once for the current signal, which resulted in a lot of waste. In order to improve the utilization rate of the sample eggs and efficiency of data acquisition, the eggs that were detected to be intact would be used again as cracked eggs after being slightly cracked by our crack striking machine. The physical and experimental parameters of the tested eggs are shown in Table 3.

4.2. Extraction of Data Features

As shown in Figure 12, the current signals of eggs with different sizes, which included three small ones and three large ones, were found to fluctuate significantly. The current signals collected in the experiment were mixed with noise and were easily affected by the environment, reducing the classification accuracy. Therefore, we introduced six common time domain features, three frequency domain features, and wavelet packet coefficients to extract stable and comprehensive feature information from the current signals for the classification models. The six time domain features were the weighted mean, average, standard deviation, range, skewness, kurtosis, and their expressions are listed in Table 4. In the six expressions given in Table 4, x i ( i = 1 , 2 , , N ) is the current data, N is the length of the data, and w is the coefficient. The three frequency domain features were the frequency of the center of gravity, root mean square frequency, and standard deviation of the frequency, and their expressions are described in Table 5. In the three expressions given in Table 5, f is the frequency value and P ( f ) is the power spectrum.

4.3. Analysis of the Results

In the process of acquiring an egg’s current signal, there are various discharge phenomena, such as corona discharge, small air gap breakdown, and creeping discharge, which make the current signal mix with a lot of noise. The interference of noise plus the relatively weak current signal at the microcrack cause the current signal to be submerged in the noise. To solve this, the method of wavelet threshold denoising was adopted to remove the high-frequency noise in the signal while retaining the useful high signals. The wavelet threshold denoising was such that, due to the continuity of the real signal f ( t ) , after the discrete wavelet transform, the wavelet coefficients generated at different scales were large, while the wavelet coefficients produced by a corresponding noise signal e ( t ) were small. Therefore, noise can be effectively suppressed by first selecting appropriate thresholds on different scales to process high-frequency wavelet coefficients, and then performing an inverse wavelet transform on the signal can effectively suppress noise. It is noteworthy that the selection of a wavelet base is of great significance to the effect of wavelet threshold denoising. By analyzing the shape of the current signal at the crack position, the Sym2 wavelet base was finally selected, and it had better symmetry, which could, to a certain extent, reduce the phase distortion when analyzing and reconstructing the signal.
The current signals of two intact eggs and two cracked eggs were randomly selected from the dataset, as shown in Figure 13, where blue represents the signal before denoising and red represents the signal after denoising. The following can be observed from Figure 13: (1) The current signal of the cracked eggs had an evident peak within one cycle, while that of the intact eggs did not. As mentioned in Section 2, when the experimental voltage is smaller than the breakdown voltage, the change in the current curve is mainly dominated by the capacitance jump during the rotation. The experimental voltage in this paper was higher than the breakdown voltage, so the change in the current curve was mainly dominated by the electrical breakdown at the crack. When the crack was small, the experimental voltage may not have reached the breakdown voltage, and the change in the current curve may have also been dominated by a capacitance jump. In addition, we also designed the circuit protection function, where the system would automatically cut off the circuit to protect the safety of the equipment and eggs when the current exceeded the set threshold. (2) The jitter of the current curve was relatively smooth due to the small changes in capacitance of the intact eggs. However, the two wave shapes of the intact eggs were not exactly identical and even had big differences, which may have been related to the different roughnesses of the eggshells.
After the wavelet threshold denoising, the time domain, frequency domain, and wavelet packet coefficients of the current signal were extracted. It can be seen from Figure 14 and Figure 15 that most of the features of the intact eggs and cracked eggs had obvious differences, but some of the differences were not obvious.
We put the time domain, frequency domain, and wavelet packet coefficient features into the SVM model. The experimental results showed that the recognition rate of each feature was different and that the eggs incorrectly recognized by different features were also not the same. This indicates that features in different domains had different classification effects. Therefore, this paper used the multi-domain features to fully reflect the inherent characteristics of the original current signal so as to improve the detection accuracy.
Finally, we adopted a variety of machine learning methods such as K-means clustering, linear discrimination analysis, and a support vector machine, as mentioned in Section 3.6, for pattern classification, and performance measures such as accuracy, precision, and the recall rate were calculated from the testing data. The experimental results are shown in Table 6.
The following conclusions can be drawn from the experimental results:
  • By selecting a suitable wavelet base for wavelet denoising, the noise in the raw current signal could be effectively suppressed, and thereby, the classification accuracy was improved;
  • By combining the features in various transform domains, more informative and discriminative features could be obtained.

5. Discussion

This paper studied the electric field characteristics of eggs under the action of electrodes on the basis of analyzing the physical properties of the eggshell and established two discharge models. The high-precision detection of eggshell cracks was realized by designing an egg crack detection platform, comparing machine learning classification algorithms, and analysis of the current signal. The most important element of this study is proposing a novel method for crack detection in eggshells based on discharge analysis. The vision-based method has higher requirements for the light source and image processing technology, and the acoustic method has higher requirements for the percussion equipment and environmental noise. However, the method in this paper has high precision, stable results, and less dependence on the environment. It only needs to control the humidity, voltage, and a few other experimental conditions. This section will further discuss the electrical characteristics of poultry eggs and explore the universality and generalization of the method proposed in this paper.
It is worth noting that the classification accuracy did not change significantly under different machine learning methods, which proves that the features extracted based on the current signals were stable. Therefore, the current-based crack detection method is feasible and can be used in actual production, with accuracy rates as high as 99 % . In addition, for misclassified eggs, by analyzing the position, condition, and corresponding current signal of the cracks, we found the following problems. Although the cracks were distributed in the effective detection area between the tip and the blunt end, they were blocked by spilled egg liquid and dust due to a long storage time. Therefore, it should be possible to further improve the classification accuracy by improving the design of the brushes.
In addition, we conducted further studies on the electrical properties of the eggs. We randomly selected 10 eggs as samples and recorded the current signals at applied voltages of 800 V, 1000 V, 1200 V, and 1400 V. According to whether there was an obvious discharge that could be directly observed and heard, the eggs could be divided into discharged eggs and undischarged eggs. The current signals of the two kinds of eggs are shown in Figure 16 and Figure 17. Figure 18 compares the current signals of both the discharged and undischarged eggs in the same coordinate system. After analysis, it can be seen that the higher the discharge voltage, the larger the dynamic current of the egg would be. However, the voltage increases would also amplify the current fluctuation, which also indirectly proves that the high voltage will cause breakdown in the eggs. In addition, not all eggs in the discharged samples had cracks, which means it is not reliable for directly identifying whether the eggs had cracks when only using the current signal, and it is very necessary to conduct data analysis on the current signal.
Crack detection technology based on electrical characteristics is a new research direction for the quality inspection of agricultural products in the future which has great research value and market potential. The method proposed in this paper can not only detect cracks in eggs but also achieve high-precision detection of cracks in duck eggs, among others. It is a universal and generalizable method. We purchased 267 fresh duck eggs from the Dabao Breeding Duck Incubation Base in Xintai Tianbao Town for current signal acquisition, including 130 intact duck eggs and 137 cracked duck eggs. The physical and experimental parameters of the tested duck eggs are shown in Table 7. Based on the analysis in Section 4.3, after the wavelet denoising, the time domain, frequency domain, and wavelet packet coefficient features of the current signal of the duck eggs were extracted and combined, and we selected the RF classifier for training. The results are shown in Table 8. For the duck eggs, the accuracy of the model was slightly reduced but still within a higher accuracy range. We speculate that there are two main reasons for the slight fluctuation of the evaluation index: (1) The number of duck eggs used in verification was quite different from that of the number of eggs.Therefore, according to the equations for the precision rate and recall rate, it can be known that, when the overall base is low, misclassification usually leads to a greater reduction in relevant indicators. (2) Eggs are usually laid in industrialized chicken houses, where the environment is relatively dry and hygienic. While ducks are typical waterfowl, they usually live outdoors and in water, which also leads to a relatively humid and dark environment for duck eggs, and the cracks are easily blocked by impurities such as dust. Although we simulated the cleaning process of the egg factory before testing, the impurities that had been blocked for a long time had solidified, and it was difficult for water molecules to enter the small cracks to wet the blocked substance during flushing, so the conductivity at the cracks would decrease and cause them to be missed during the inspection.

6. Conclusions

In this study, we established the egg electrical characteristics model and designed a microcrack detection system that has higher accuracy and is more convenient than the traditional methods. Different types of features extracted from the time, frequency, and wavelet domains of the current signals were proven to contain a mass of crack characteristics after reducing the interference of noise in the signal with the sym2 wavelet. Based on the above features, five typical machine learning algorithms were used to divide the eggs into cracked eggs and intact eggs, which verified the proposed model. The experimental results show that the RF had better robustness, and the fusion of multi-domain features can effectively improve the accuracy of classification. It is worth noting that the classification accuracy by different machine learning methods had little variation, with all being around 99 % , proving that the model of detecting microcracks by using current signal features has certain stability and reliability. The relevant experiments of duck eggs also confirmed that the method proposed in this paper has a certain universality and generalization. Our research will help relevant enterprises to quickly and accurately detect cracked eggs in the production line, greatly reduce the number of cracked eggs in the end products, improve the quality of related products, and have good practical application prospects. In general, this paper explored a new method for nondestructive testing for egg cracks which lays a foundation for the development of nondestructive testing of egg cracks based on an electrical characteristics model.

Author Contributions

Conceptualization, C.S. and C.Z. (Changsheng Zhu); methodology, C.S., C.Z. (Changsheng Zhu) and Y.W.; software, Y.W., Y.C., B.J. and C.Z. (Changsheng Zhu); validation, C.S., C.Z. (Changsheng Zhu), C.Z. (Chun Zhang) and Y.W.; formal analysis, C.S., C.Z. (Chun Zhang) and J.Y.; investigation, C.S. and J.Y.; writing—original draft preparation, C.S., C.Z. (Changsheng Zhu), Y.W., Y.C. and B.J.; writing—review and editing, C.S., C.Z. (Chun Zhang), C.Z. (Changsheng Zhu), Y.W. and J.Y. All authors have read and agreed to the published version of the manuscript.

Funding

This research was funded by the Tai’an Science and Technology Innovation Development Plan (No.2021GX050 and No.2020GX055).

Institutional Review Board Statement

Not applicable.

Informed Consent Statement

Not applicable.

Data Availability Statement

The data presented in this study are available on demand from the corresponding author at ([email protected]).

Conflicts of Interest

The authors declare no conflict of interest.

References

  1. Priyadumkol, J.; Kittichaikarn, C.; Thainimit, S. Crack detection on unwashed eggs using image processing. J. Food Eng. 2017, 209, 76–82. [Google Scholar] [CrossRef]
  2. Xie, C. Vibration Characteristic Analysis of Good Eggs and Cracked Eggs. Ph.D. Thesis, Huazhong Agricultural University, Wuhan, China, 2015. [Google Scholar]
  3. Kertész, I.; Zsom-Muha, V.; András, R.; Horváth, F.; Németh, C.; Felföldi, J. Development of a Novel Acoustic Spectroscopy Method for Detection of Eggshell Cracks. Molecules 2021, 26, 4693. [Google Scholar] [CrossRef] [PubMed]
  4. Sun, L.; Zhang, P.; Feng, S.; Qiang, M.; Cai, J. Eggshell crack detection based on the transient impact analysis and cross-correlation method. Curr. Res. Food Sci. 2021, 4, 716–723. [Google Scholar] [CrossRef] [PubMed]
  5. Coucke, P.; Ketelaere, B.D.; Baerdemaeker, J.D. Detection of Eggshell Cracks by Means of Acoustic Frequency Analysis. IFAC Proc. Vol. 1997, 30, 163–168. [Google Scholar] [CrossRef]
  6. Cho, H.K.; Choi, W.K.; Paek, J.H. Detection of surface cracks in shell eggs by acoustic impulse method. Trans. Am. Soc. Agric. Eng. 2000, 43, 1921–1926. [Google Scholar] [CrossRef]
  7. Deng, X.; Wang, Q.; Chen, H.; Xie, H. Eggshell crack detection using a wavelet-based support vector machine. Comput. Electron. Agric. 2010, 70, 135–143. [Google Scholar] [CrossRef]
  8. Sun, L.; Bi, X.K.; Lin, H.; Zhao, J.W.; Cai, J.R. On-line detection of eggshell crack based on acoustic resonance analysis. J. Food Eng. 2013, 116, 240–245. [Google Scholar] [CrossRef]
  9. Lai, C.C.; Li, C.H.; Huang, K.J.; Cheng, C.W. Duck Eggshell Crack Detection by Nondestructive Sonic Measurement and Analysis. Sensors 2021, 21, 7299. [Google Scholar] [CrossRef]
  10. Wang, H.; Mao, J.; Zhang, J.; Jiang, H.; Wang, J. Acoustic feature extraction and optimization of crack detection for eggshell. J. Food Eng. 2016, 171, 240–247. [Google Scholar] [CrossRef]
  11. Wang, J.; Jiang, R.; Yu, Y. Relationship between dynamic resonance frequency and egg physical properties. Food Res. Int. 2004, 37, 45–50. [Google Scholar] [CrossRef]
  12. Pan, L.; Tu, K.; Zhao, L.; Zhao, Y.; Pan, X. Preliminary research of chicken egg crack detection based on acoustic resonance analysis. Trans. Chin. Soc. Agric. Eng. 2005, 21, 11–15. [Google Scholar]
  13. Botta, B.; Gattam, S.S.R.; Datta, A.K. Eggshell crack detection using deep convolutional neural networks. J. Food Eng. 2022, 315, 110798. [Google Scholar] [CrossRef]
  14. Yao, K.; Sun, J.; Chen, C.; Xu, M.; Zhou, X.; Cao, Y.; Tian, Y. Non-destructive detection of egg qualities based on hyperspectral imaging. J. Food Eng. 2022, 325, 111024. [Google Scholar] [CrossRef]
  15. Elster, R.T.; Goodrum, J.W. Detection of cracks in eggs using machine vision. Trans. ASAE 1991, 34, 0307–0312. [Google Scholar] [CrossRef]
  16. Goodrum, J.W.; Elster, R.T. Machine vision for crack detection in rotating eggs. Trans. ASABE 1992, 35, 1323–1328. [Google Scholar] [CrossRef]
  17. Li, Y.; Dhakal, S.; Peng, Y. A machine vision system for identification of micro-crack in egg shell. J. Food Eng. 2012, 109, 127–134. [Google Scholar] [CrossRef]
  18. Fang, W.; Shu, Z.; Zuojun, T. Non-destructive crack detection of preserved eggs using a machine vision and multivariate analysis. Wuhan Univ. J. Nat. Sci. 2017, 22, 257–262. [Google Scholar]
  19. Guanjun, B.; Mimi, J.; Yi, X.; Shibo, C.; Qinghua, Y. Cracked egg recognition based on machine vision. Comput. Electron. Agric. 2019, 158, 159–166. [Google Scholar] [CrossRef]
  20. Turkoglu, M. Defective egg detection based on deep features and Bidirectional Long-Short-Term-Memory. Comput. Electron. Agric. 2021, 185, 6152. [Google Scholar] [CrossRef]
  21. Song, Y.S.; Gera, M.; Jain, B.; Koontz, J.L. Evaluation of a Non-destructive High-voltage Technique for the Detection of Pinhole Leaks in Flexible and Semi-rigid Packages for Foods. Packag. Technol. Sci. 2014, 27, 423–436. [Google Scholar] [CrossRef]
  22. Möll, F.; Doyle, D.L.; Haerer, M.; Guazzo, D.M. Validation of a High Voltage Leak Detector for Use With Pharmaceutical Blow-Fill-Seal Containers—A Practical Approach. PDA J. Pharm. Sci. Technol. 1998, 52, 215–227. [Google Scholar]
  23. Jun, S.; Bin, L.; Hanping, M.; Xiaohong, W.; Hongyan, G.; Ning, Y. Non-Destructive Identification of Different Egg Varieties Based on Dielectric Properties. Food Sci. 2017, 38, 282–286. [Google Scholar]
  24. Maxwell, T.H. The eggshell: Structure, composition and mineralization. Front. Biosci. 2012, 17, 1266–1280. [Google Scholar]
  25. Parsons, A. Structure of the eggshell. Poult. Sci. 1982, 61, 2013–2021. [Google Scholar] [CrossRef]
  26. Zhao, Y.; Wang, J.; Lu, Q.; Jiang, R. Pattern recognition of eggshell crack using PCA and LDA. Innov. Food Sci. Emerg. Technol. 2010, 11, 520–525. [Google Scholar] [CrossRef]
  27. Wang, L.M.; Shao, Y.M. Crack Fault Classification for Planetary Gearbox Based on Feature Selection Technique and K-means Clustering Method. Chin. J. Mech. Eng. 2018, 31, 4. [Google Scholar] [CrossRef]
  28. Aljarah, I.; Al-Zoubi, A.; Faris, H.; Hassonah, M.A.; Mirjalili, S.M.; Saadeh, H. Simultaneous Feature Selection and Support Vector Machine Optimization Using the Grasshopper Optimization Algorithm. Cogn. Comput. 2017, 10, 478–495. [Google Scholar] [CrossRef]
  29. Mohammadi, E.; Khoshab, H.; Kazemnejad, A. Activities of daily living for patients with chronic heart failure: A partnership care model evaluation. Appl. Nurs. Res. 2016, 30, 261–267. [Google Scholar] [CrossRef] [PubMed]
  30. Gunn, S.R. Support vector machines for classification and regression. ISIS Tech. Rep. 1998, 14, 5–16. [Google Scholar]
  31. Zhang, L.; Wang, Z.; Wang, L.; Zhang, Z.; Chen, X.; Meng, L. Machine learning-based real-time visible fatigue crack growth detection. Digit. Commun. Netw. 2021, 7, 551–558. [Google Scholar] [CrossRef]
  32. Ramzan, F.; Klees, S.; Schmitt, A.O.; Cavero, D.; Gültas, M. Identification of Age-Specific and Common Key Regulatory Mechanisms Governing Eggshell Strength in Chicken Using Random Forests. Genes 2020, 11, 464. [Google Scholar] [CrossRef]
Figure 1. Schematic diagram of egg and eggshell structure. (a) Structure of the egg. (b) Microstructure of the eggshell. (c) Radial cross section of the eggshell.
Agriculture 12 01137 g001
Figure 2. Schematic diagram of surface polarization of eggs in electric field.
Agriculture 12 01137 g002
Figure 4. Comparison diagram of current measurement curves without cracks or cracked eggs under discharge electric field.
Agriculture 12 01137 g004
Figure 5. Simulation analysis of egg electric field distribution with cracks.
Agriculture 12 01137 g005
Figure 6. Data acquisition system block diagram.
Agriculture 12 01137 g006
Figure 7. Egg crack detection device. (a) Model diagram. (b) Physical map.
Agriculture 12 01137 g007
Figure 8. Tip electrode experimental set-up. (a) Smooth electrode. (b) Tip electrode. (c) Multi-strand tip electrode.
Agriculture 12 01137 g008
Figure 9. Real figure of electrode.
Agriculture 12 01137 g009
Figure 10. Standard deviation of the current signal of eggs at different voltages.
Agriculture 12 01137 g010
Figure 11. Egg crack and its generating device. (a) Egg crack striking machine. (b,c) Pictures of cracks of different sizes under the industrial microscope.
Agriculture 12 01137 g011
Figure 12. The effect of egg size on current signal.
Agriculture 12 01137 g012
Figure 13. Egg current waveform. (a,b) Waveforms of intact eggs. (c,d) Waveforms of cracked eggs.
Agriculture 12 01137 g013
Figure 14. Feature distribution diagram. (a) Time domain features. (b) Wavelet domain features.
Agriculture 12 01137 g014
Figure 15. Three-dimensional distribution diagram of frequency domain features.
Agriculture 12 01137 g015
Figure 16. Current signal when the egg had no discharge phenomenon under different voltages.
Agriculture 12 01137 g016
Figure 17. Current signal when the egg produced the discharge phenomenon at different voltages.
Agriculture 12 01137 g017
Figure 18. Current signal of the eggs in the voltage range of 800–1400 V. The current signals of 3 eggs with obvious cracks are set to blue, the current signals of 2 eggs with no cracks but obvious discharge are set to green, and the current of the eggs without discharge signal is set to orange.
Agriculture 12 01137 g018
Table 1. Formula table.
Formula NameFormula
The field vector–electric flux density D = ε 0 E + P
The total spatial electrostatic field E = E 0 + E
The electric polarization intensity P = ε 0 X e E
The Gauss theorem in the medium S D · S = q
Table 2. Experimental data of tip electrode.
Serial NumberSmooth Electrode Discharge Voltage (V)Tip Electrode Discharge Voltage (V)Multi-Strand Tip Electrode Discharge Voltage (V)
No.1180023001800
No.2170025001900
No.3180024001600
No.4140020001500
No.5140022002100
No.6170024001700
Table 3. Physical and experimental parameters of tested eggs.
Long Axis AverageShort Axis AverageWeight AverageVoltageFrequencyNumber of Sampling PointsAverage HumidityAverage Temperature
Eggs57.4 mm44.5 mm62.7 g1500 V100 Hz45040% RH18.5 ℃
Table 4. Time domain features.
Time Domain FeaturesFormula
Weighted mean x ¯ = i = 1 n x i w i i = 1 n w i
Average μ = 1 N i = 1 N x i
Standard deviation σ = i = 1 N ( x i μ ) 2 N
Range r = m a x ( x ) m i n ( x )
Skewness s = 1 n i = 1 n [ ( x i μ σ ) 3 ]
Kurtosis k = 1 n i = 1 n [ ( x i μ σ ) 4 ]
Table 5. Frequency domain features.
Frequency Domain FeaturesFormula
Frequency of center of gravity F C = 0 + f P ( f ) d f 0 + P ( f ) d f
Root mean square frequency R M S F = 0 + f 2 P ( f ) d f 0 + P ( f ) d f
Standard deviation of frequency R V F = 0 + ( f F C ) 2 P ( f ) d f 0 + P ( f ) d f
Table 6. Combination feature classification effect in time domain, frequency domain, and wavelet domain.
AccuracyPrecisionRecallF1AUC
SVM98.79%98.27%99.48%98.87%98.75%
LDA99.31%99.47%99.21%99.34%99.31%
DT99.35%99.29%99.47%99.38%99.36%
KM99.05%97.45%98.73%99.08%99.09%
RF99.44%99.68%99.51%99.59%99.43%
Table 7. Physical and experimental parameters of tested duck eggs.
Long Axis AverageShort Axis AverageWeight AverageVoltageFrequencyNumber of Sampling PointsAverage HumidityAverage Temperature
Duck eggs67.4 mm50.3 mm68.5 g1500 V100 Hz45055% RH15 ℃
Table 8. Detection results of cracked duck eggs.
AccuracyPrecisionRecallF1AUC
RF98.16%98.41%97.74%98.04%98.28%
Publisher’s Note: MDPI stays neutral with regard to jurisdictional claims in published maps and institutional affiliations.

