1. Introduction
Hybrid breeding is one of the most important methods for increasing rice yield. The yield of hybrid rice is of great significance in solving the problem of food shortage in the world [
1,
2]. Hybrid rice has outcrossing characteristics. During the flowering period, the pollen provided by the male parent falls to the female parent with male sterility to complete the pollination. The mature fruit of the female parent is an excellent variety of hybrid rice. Since the male parent has a longer growth time, it is usually sown earlier than the female parent of rice. The sowing time of the female parent is determined according to leaf age difference, time difference and the weather conditions after the male parent sows so that the male parent and the female parent of a rice plant reach the heading period at the same time to achieve better pollination. The flowering period of a plant’s male and female parents is only 1.5~2 h per day, and the active time of pollen is only 4~5 min. The amount of effective pollen provided by male parents will directly affect the seed production yield of hybrid rice. Rapid and accurate identification of male and female parents is key to determining the optimal pollination timing so as to ensure that the pollen of male and female parents meet at the flowering period [
3,
4]. In addition, when the pollination is finished, the male parent must be cut off in advance in order to provide sufficient nutrients for the female parent, maintain ventilation, reduce pests and diseases, and facilitate mechanical harvesting [
5,
6]. Therefore, identifying the male and female parents is also an important prerequisite for monitoring the agricultural characteristics of hybrid rice. However, currently, the male parent flowering information extraction of hybrid rice is basically obtained by manual experience, and the timeliness of information is insufficient, making it difficult to grasp the male parent flowering status in time, especially in the vast planting areas of hybrid rice seed production farms [
7].
The automatic acquisition and classification of agricultural information based on remote sensing images is receiving increasing attention. Although satellite remote sensing has been a mature technology for acquiring ground object information, it is susceptible to weather conditions and has low temporal and spatial resolution, which usually make it difficult to meet the high precision and time-effective requirements needed for monitoring hybrid rice flowering status [
8].
Due to their small sizes, ease of operation, high spatial resolution and high efficiency, UAVs have a wide application prospect in the real-time acquisition of information on farmland conditions [
9,
10]. Scholars at home and abroad have done a lot of research on extracting vegetation information from remote sensing images. Most scholars establish the relationship between vegetation index and remote sensing imaging to separate the target and background. It is widely used in images with color differences between categories, such as crop monitoring [
11] and field crop classification [
12,
13]. Zhang et al. [
14] used visible light remote sensing images collected by a UAV to calculate the vegetation index in research on the aboveground biomass estimation of Zoige grassland and established an exponential regression model of biomass and various vegetation indices to estimate biomass, with the highest simulation accuracy of R
2 = 0.856. Wan et al. [
15], based on remote sensing images obtained by a multispectral camera carried by a UAV, explored and predicted the relationship between the numbers of oilseed rape flowers using the random forest algorithm and eight common visible vegetation indices and two multispectral vegetation indices. The RMSE (Root-Mean-Square Error) of their model was 14.13, which has great potential for the monitoring of the numbers of oilseed rape flowers. Enyn et al. [
16] used three different deep neural network structures to quickly predict the counting and flowering time of sorghum panicles using RGB images obtained by a UAV. The timely acquisition of flowering time improves sorghum panicle yields. Hardanto et al. [
17] compared the land use classification (LUC) from Landsat 8 and UAV using the minimum distance supervised classification method. The results showed that the supervised classification of UAV images was more detailed and more accurate than satellite images. Jing et al. [
18] generated a visible vegetation index based on micro UAV image data and compared pixel-based supervised classification with object-oriented classification. The kappa coefficient of the object-oriented classification method reached 0.9, which proved the feasibility of this kind of method for aquatic vegetation information extraction and greatly improved the accuracy of aquatic vegetation information extraction.
The flexibility and timeliness of UAV is helpful in classifying the male and female parents of hybird rice automatically and accurately in large-scale hybrid rice seed production farms and can effectively improve the utilization rate of pollen and increase the yield of hybrid rice. In this study, the male and female parents of hybrid rice plants in visible and multispectral images obtained by UAV are taken as the research objects. Two algorithms, pixel-based supervised classification and sample based object-oriented classification, were used to extract the male and female parents of hybrid rice from the ten vegetation index calculation result graphs in order to obtain a simple, convenient and effective parent extraction method of hybrid rice. This provides a reference for quickly obtaining the distribution of male and female parents of hybrid rice, ensuring that the pollen of male and female parents meet at flowering, monitoring the field situation in real time, and improving the seed production rate of hybrid rice.
2. Materials and Methods
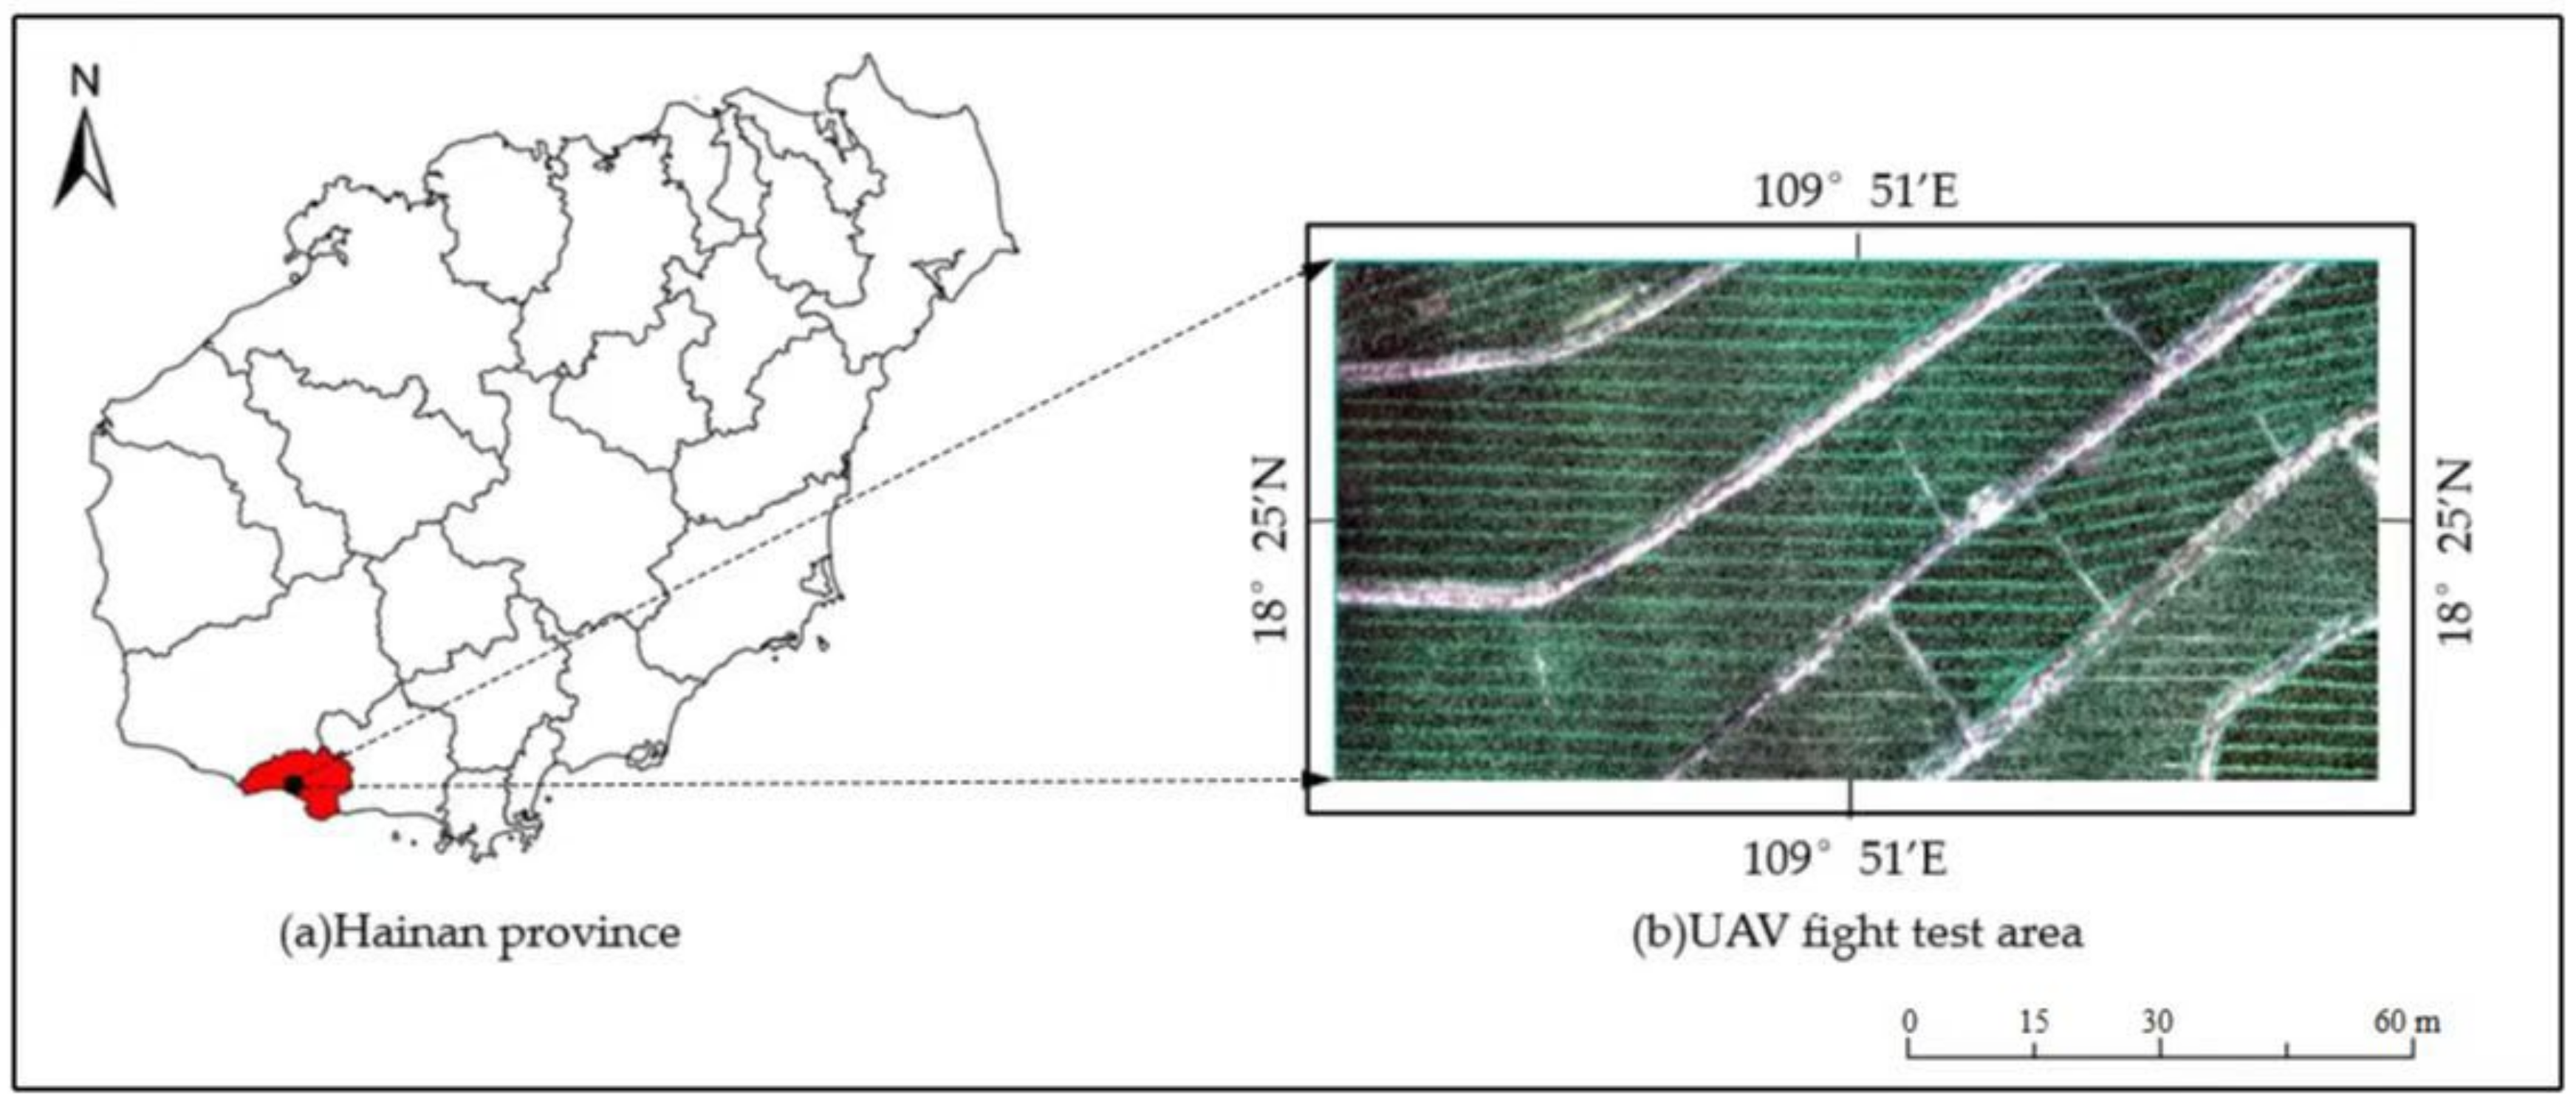
2.1. Overview of the Experimental Site
The experimental site is located in Hainan Province (18.25° N, 109.51° E). It belongs to a tropical maritime monsoon climate, with no frost and snow all year round, sufficient light and heat resources, and a multi-year average temperature of 24–25 °C. Between 8:00 and 18:00, the annual average sunshine hours are 2777.15 h, and the annual average rainfall is 1000–1900 mm, which is suitable for hybrid rice seed production. The male parent variety of hybrid rice is 534, and the female parent variety is Mengliangyou. An overview of the site is shown in
Figure 1.
2.2. Data Acquisition
This experiment used a DJI P4 Multispectral quad-rotor UAV with a diagonal wheelbase of 350 mm, an unloaded endurance flight time of about 27 min, a signal maximum effective distance of 7 km, a maximum take-off mass of 1487 g, and six 1/2.9-inch CMOS sensors, including a color sensor for visible light imaging and five monochromatic sensors for multispectral imaging in blue, green, red, red edge and near-infrared. The image resolution was 1600 pixels × 1300 pixels. The information parameters for each band are shown in
Table 1. The captured images were stored in the internal SD card of the camera. In total, 2875 images of the target area were acquired by aerial photography with a flight altitude of 50 m, a flight speed of 2.6 m/s, a course overlap of 85% and a side overlap of 85%. The image spatial resolution was 2.6 cm/pixel. A total area of 6300 m
2 was covered.
2.3. Data Processing
2.3.1. Selection of Vegetation Index
In the field of remote sensing, there are hundreds of vegetation indices in use at present [
19,
20,
21]. Based on the vegetation indices that have been researched more fully and with higher precision, six visible vegetation indices and four multispectral vegetation indices were selected in this study: ExR (Excess Red index) [
22], ExG (Excess Green index) [
23], ExB (Excess Blue index) [
24], ExGR (Excess Green minus excess Red index) [
25], G (Green coordinate) [
26], CIVE (Color Index of Vegetation Extraction) [
27], NDVI (Normalized Difference Vegetation Index) [
28], LCI (Leaf Chlorophyll Index) [
29], NDRE (Normalized Difference Red Edge Vegetation Index) [
30] and GNDVI (Green Normalized Difference Vegetation Index) [
31]. The calculation formulas and theoretical ranges of six visible light vegetation indices and four multispectral vegetation indices are shown in
Table 2.
2.3.2. Data Image Processing
The orthophoto images of the experimental site were obtained by stitching, geometric correction and radiometric correction of the images with Pix4DMapper software. ENVI 5.3 software was used to crop the images to the target area, as shown in
Figure 1. According to the formula in
Table 1, the Band Math tool was applied to calculate each visible light vegetation index, and the ROI (Region of Interest) tool was combined with visual interpretation to randomly select ten samples each for the female parent, male parent, weed and bare land from the target area of the visible light images. Each category contained thousands of pixel values. The separability of the samples was calculated using the Calculate ROI Separability tool in ROI. When the separability is below 1.0, this means that the sample is not highly separable and needs to be re-selected; when the separability is 1.8–2.0, it means that the sample is well-distinguished. As shown in
Figure 2, all kinds of ground objects have excellent separation and can be used as supervised classification objects.
2.4. The Classification and Extraction Method for Male and Female Parents
Two different classification methods were used to extract male and female parents. Pixel-based supervised classification was used to classify the results of six visible vegetation indices and four multispectral vegetation indices using five supervised classification methods based on image elements, namely, the parallelepiped method [
32], the minimum distance method [
33], the Mahalanobis distance method [
34], the maximum likelihood method [
35] and the neural network method [
36]. For the other method, sample-based object-oriented information was used to supervise and classify visible light images so as to extract hybrid rice male and female parent information. The classification accuracies of the two types of methods were compared as well. Five supervised pixel-based classification methods classified pixels with similar spectral characteristics into corresponding categories according to certain rules. The difference between the object-oriented classification method and the pixel-based classification method is that it is no longer for a single pixel, but the object formed after image segmentation [
37,
38].
In the pixel-based supervised classification, according to the calculation results for the visible vegetation index in
Figure 3, the calculation results for the multispectral vegetation index obtained in
Figure 4 and the selected male and female parent training samples, five supervised classification methods—the parallelepiped method, the minimum distance method, the Mahalanobis distance method, the maximum likelihood method and the neural network classification method—were selected for classification using the supervised classification classifier in ENVI software. Among them, the parameter settings of the parallelepiped method and the minimum distance method classified the 10 vegetation indices by setting the appropriate thresholds in
Table 3 based on the means and standard deviations. The maximum distance error of the Mahalanobis distance method and the likelihood threshold of the maximum likelihood method were both set to None for supervised classification in this study. The classification parameter setting of the neural network classification method selected the logistic activation function. The weight adjustment speed was set to 0.2, the number of iterations was set to 1000 and other values were set as default as the parameter settings.
In the object-oriented supervised classification based on samples, we used the object-oriented supervised classification function in ENVI5.3 software to classify the male parent and female parent of the vegetation index calculation results obtained in
Figure 3 and
Figure 4. After repeated tests, the edge detection method was selected for image segmentation, and the threshold was set to 15 to segment the ground objects in the image to form a single object. The Full Lambda Schedule algorithm was selected for merging, and the threshold was set to 80 to merge and fuse adjacent objects with similar spectral, texture and geometric features into more complete objects. After the objects were divided, 50 samples from the female parent, 50 samples from the male parent, 20 samples from the weeds and 20 samples from the bare ground were selected as the training set according to the visual interpretation. The images were automatically classified using the SVM (Support Vector Machine) method [
39]. The threshold parameter was set to 5, the degree of the kernel polynomial was set to 2, the kernel gamma value was set to 0.03, the bias in the kernel function was set to 1 and the penalty parameter was set to 100.
2.4.1. Parallelepiped Method
The parallelepiped method is a method of forming an n-dimensional parallelepiped data space according to the brightness value of the training sample. If the spectral values of other pixels fall in the area corresponding to any parallelepiped training sample, they are classified into their corresponding categories. The proportion of parallel hexahedrons is determined by the standard deviation threshold [
32].
2.4.2. Minimum Distance Method
The minimum distance method uses the training sample data to calculate the mean vector and standard deviation vector of each class and then uses the mean vector as the center position of the class in the feature space to calculate the distance from each pixel to the center of the input hybrid rice image. A pixel is classified according to the distance between the pixel and the center of which kind is the smallest [
33].
2.4.3. Mahalanobis Distance Method
The principle of the Mahalanobis distance method is to calculate the Mahalanobis distance from the input image to each sample and finally count the smallest Mahalanobis distance, which is this category [
34].
2.4.4. Maximum Likelihood Method
The principle of the maximum likelihood method is to assume that each category of statistics in each band of a hybrid rice image is normally distributed and calculate the likelihood that a given pixel belongs to a training sample. The pixel is finally merged into the category with the maximum likelihood [
35].
2.4.5. Neural Network Classification Method
This method involves the abstraction of a human brain neural network from the perspective of information processing. It forms different networks according to different connection modes and establishes related simple models. A neural network is essentially an operational model composed of a large number of nodes connected to each other. Each node can be regarded as a neuron. Each node contains an excitation function and its output is judged according to its input. The nodes of adjacent layers are connected in pairs, and their relationship is called weight, which is equivalent to the memory process of the human brain [
36]. In this work, the neural network uses the approximation of some algorithm or function to distinguish male parents from female parents of hybrid rice plants as one of the modes of pixel-based supervised classification to classify the results of six visible vegetation indices and four multispectral vegetation indices.
2.4.6. SVM Method
SVM is a machine learning method based on statistical learning theory. SVM can automatically find those support vectors that have great ability to distinguish classifications so as to construct a classifier that can maximize the interval between classes and which therefore has better generalization and higher classification accuracy [
39]. In this study, the SVM method was used for the automatic classification of images in the sample-based object-oriented classification.
2.5. Evaluation Index
After supervised classification of various samples in the target test area, the recognition accuracy of various samples was evaluated. At present, the most commonly used evaluation method is to use the true state of the image combined with field survey data for visual interpretation. Due to the large-scale planting areas and complex planting conditions, this type of evaluation method is limited by manpower and material resources [
40,
41]. In this study, the confusion matrix was used to test the accuracy of the classification results, and the total accuracy and kappa coefficient were used to evaluate six supervised classification methods. The closer the total accuracy is to 100%, the higher the accuracy. The kappa coefficient represents the consistency between classification results and real categories, and the value range is [−1, 1]. Generally, the kappa coefficient is between 0.81–1.0, indicating that the classification result is almost completely consistent with the real category. The kappa coefficient can be calculated according to the following formula [
42,
43,
44]:
where
is the overall classification accuracy,
is the chance consistency,
n is the order of the confusion matrix equation and
N is the total number of samples, which is the sum of all values in the column (row).
3. Results and Analysis
3.1. Calculation and Analysis of Vegetation Indexes
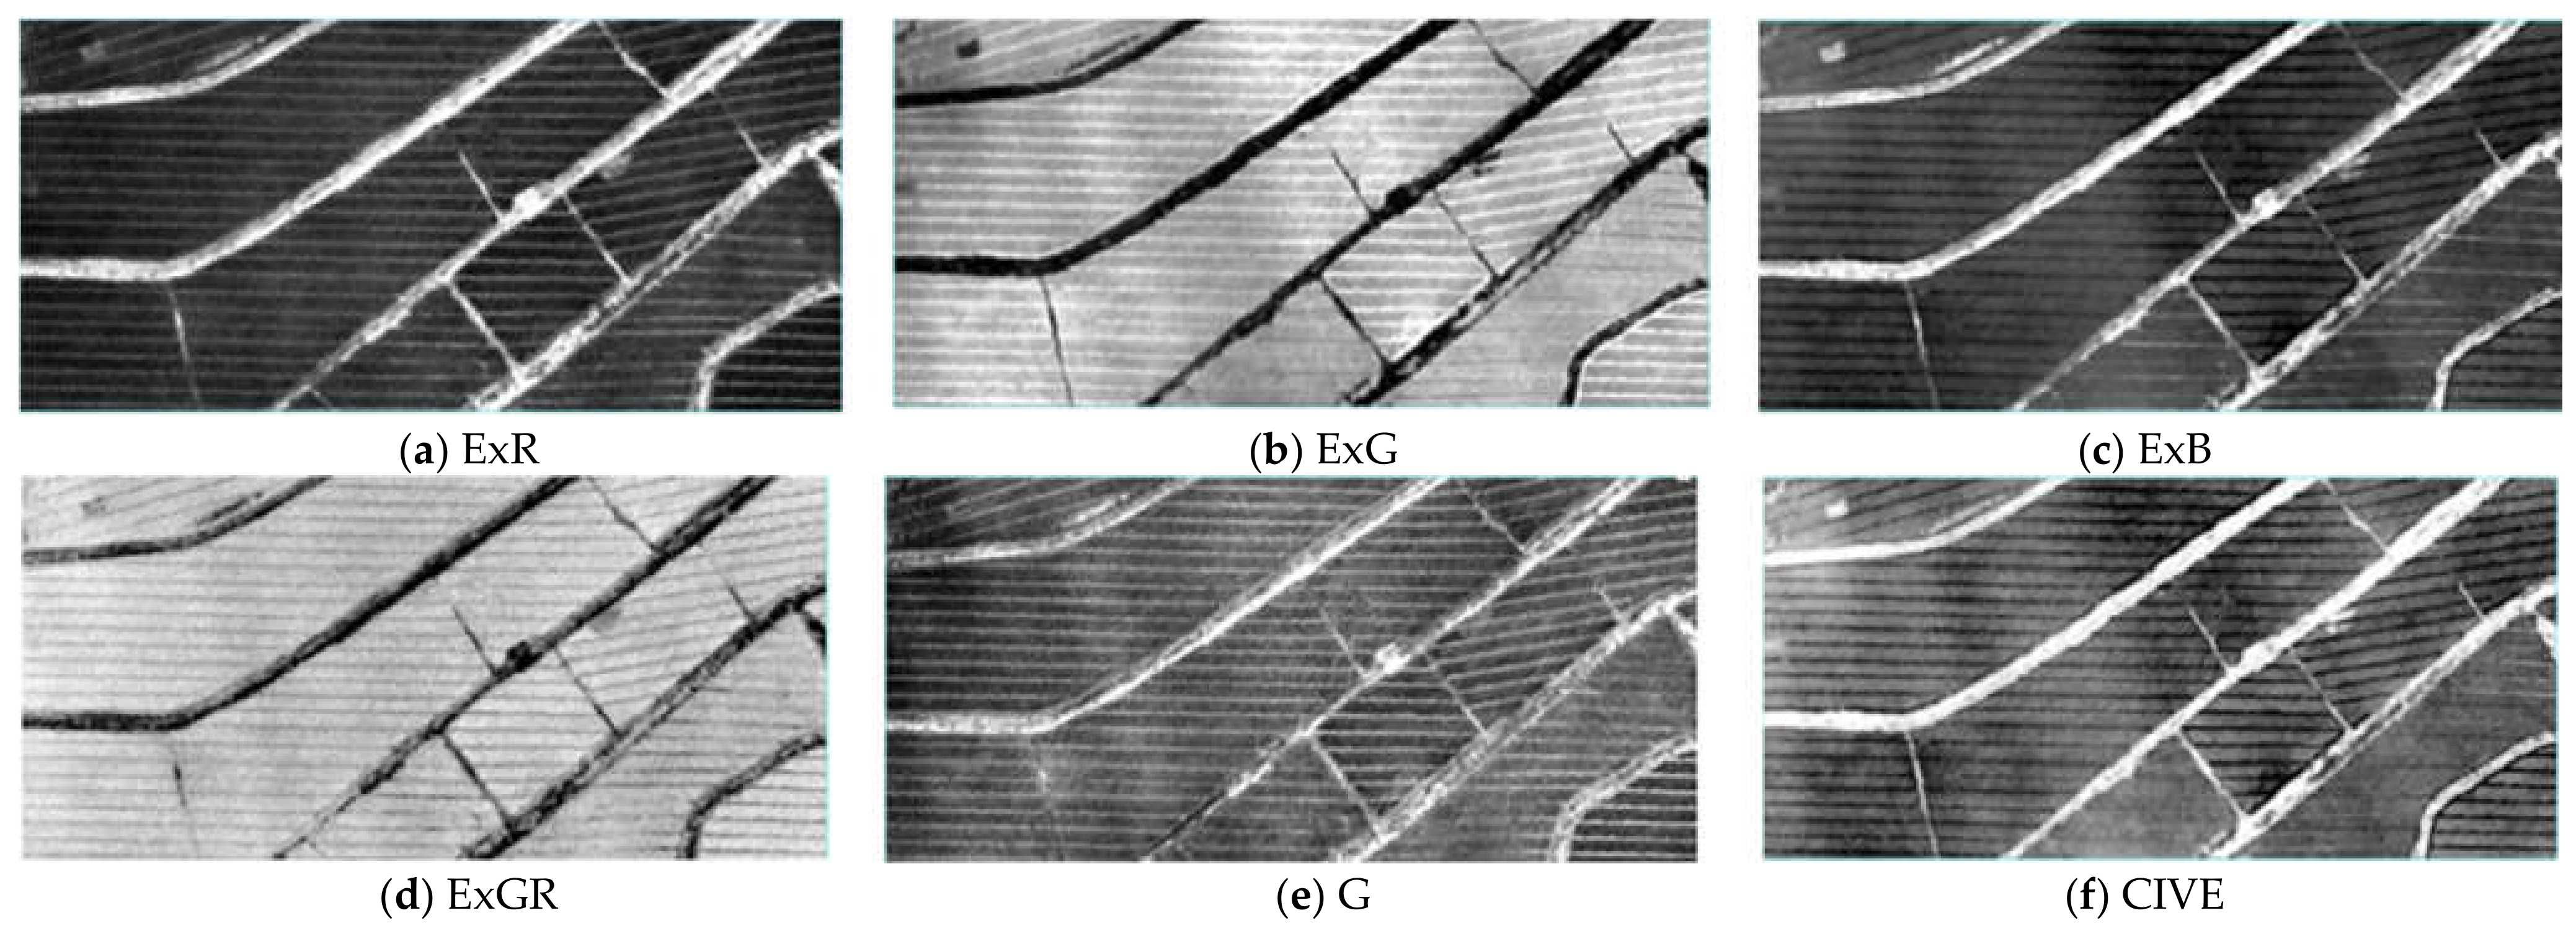
With the cropped orthographic map in
Figure 1, each visible vegetation index was calculated according to the formula in
Table 2 using the Band Math tool in ENVI software. The calculation results are shown in
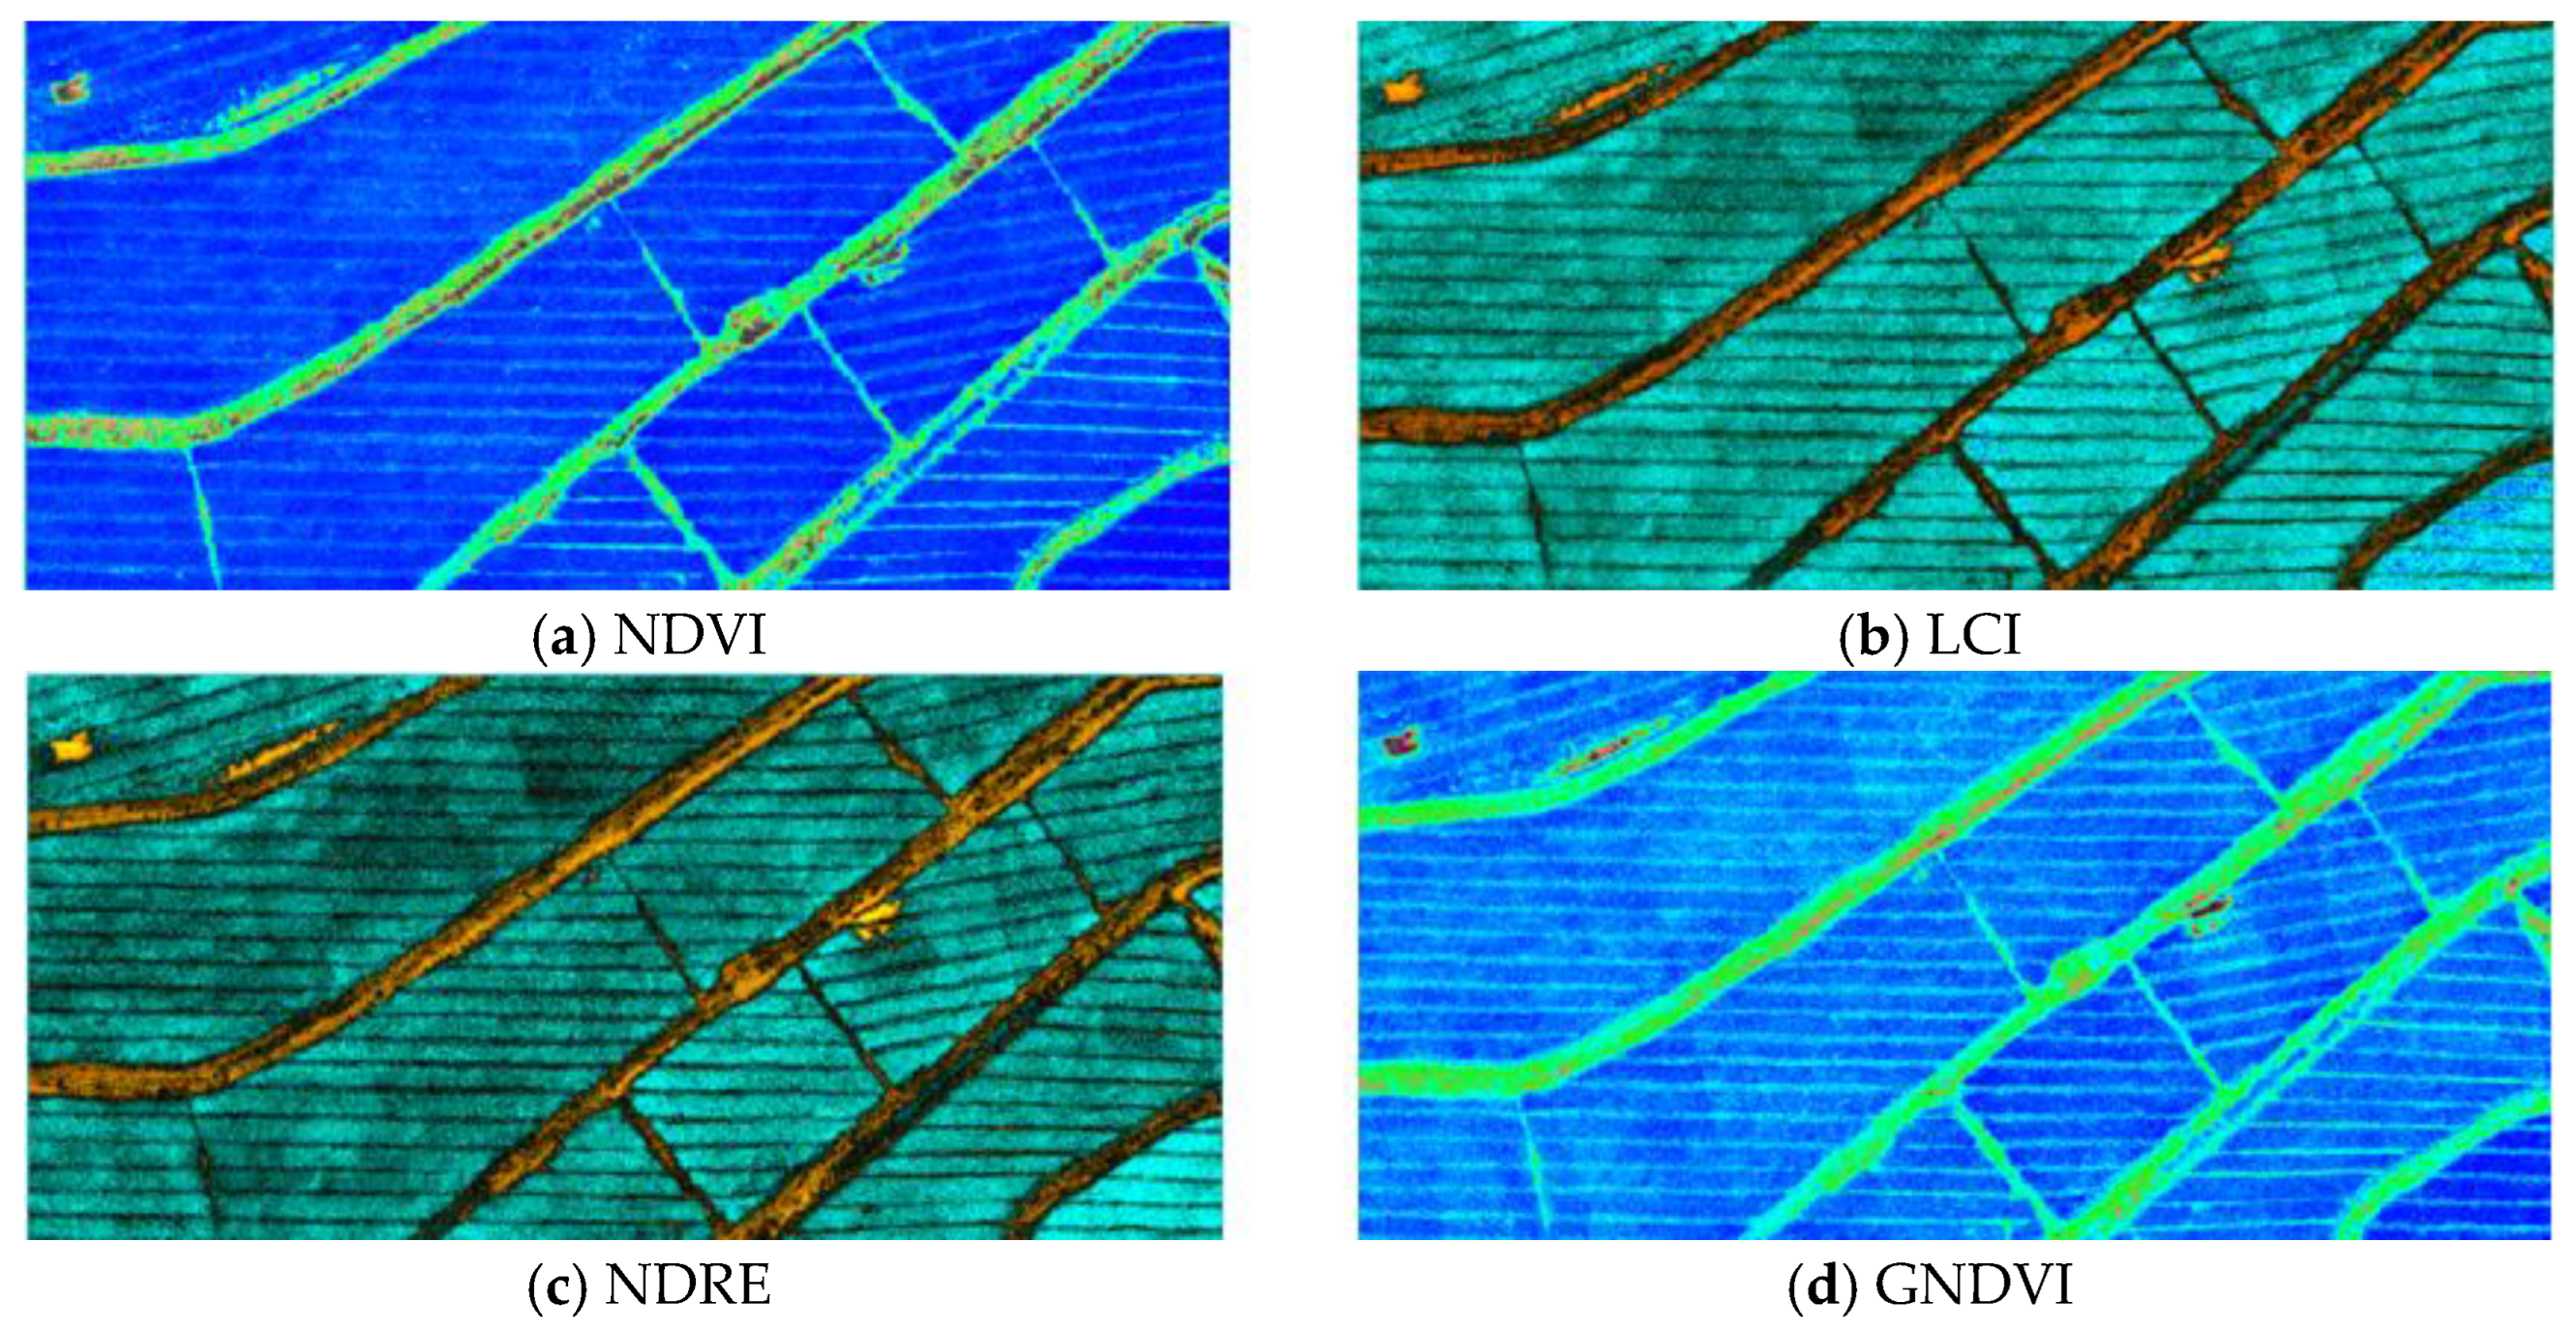
Figure 3. Then, using the 2D multispectral reconstruction function of the DJI mapping software, the RGB images and five single-band images acquired by the multispectral camera were calculated to obtain four multispectral vegetation index images. The calculation results are shown in
Figure 4.
From the calculated results for each vegetation index, it can be seen that there is a large difference in gray value between vegetation and non-vegetation, and the contrast is obvious. In order to better compare the 10 vegetation indices, this study divided the feature types into female parent, male parent, weed and bare land. On the calculated vegetation index map, 10 regions of interest for each feature were selected for statistics, and the eigenvalues of male parents and female parents were calculated. It can be seen from
Table 3 that there was little difference in the standard deviations between the male parents and the female parents, but the average values were quite different. For the visible light vegetation index, the average difference between the male parent and the female parent was about 15 in the three vegetation indices, ExR, ExB and CIVE, and the ExG and G vegetation indices were slightly higher than the first three, while the difference in the mean values for the ExGR vegetation index is particularly obvious, reaching 74.1052. For the four multispectral vegetation indices, the difference in average value was between 40 and 60, and the difference in average values for the LCI vegetation index among the four multispectral vegetation indices was the largest, reaching 60.3388. In general, using the
t-test function of SPSS software, there was a significant difference (
p < 0.05) between the information on hybrid rice parents, with excellent results for the identification of male and female parents of hybrid rice plants with visible light and multispectral imaging.
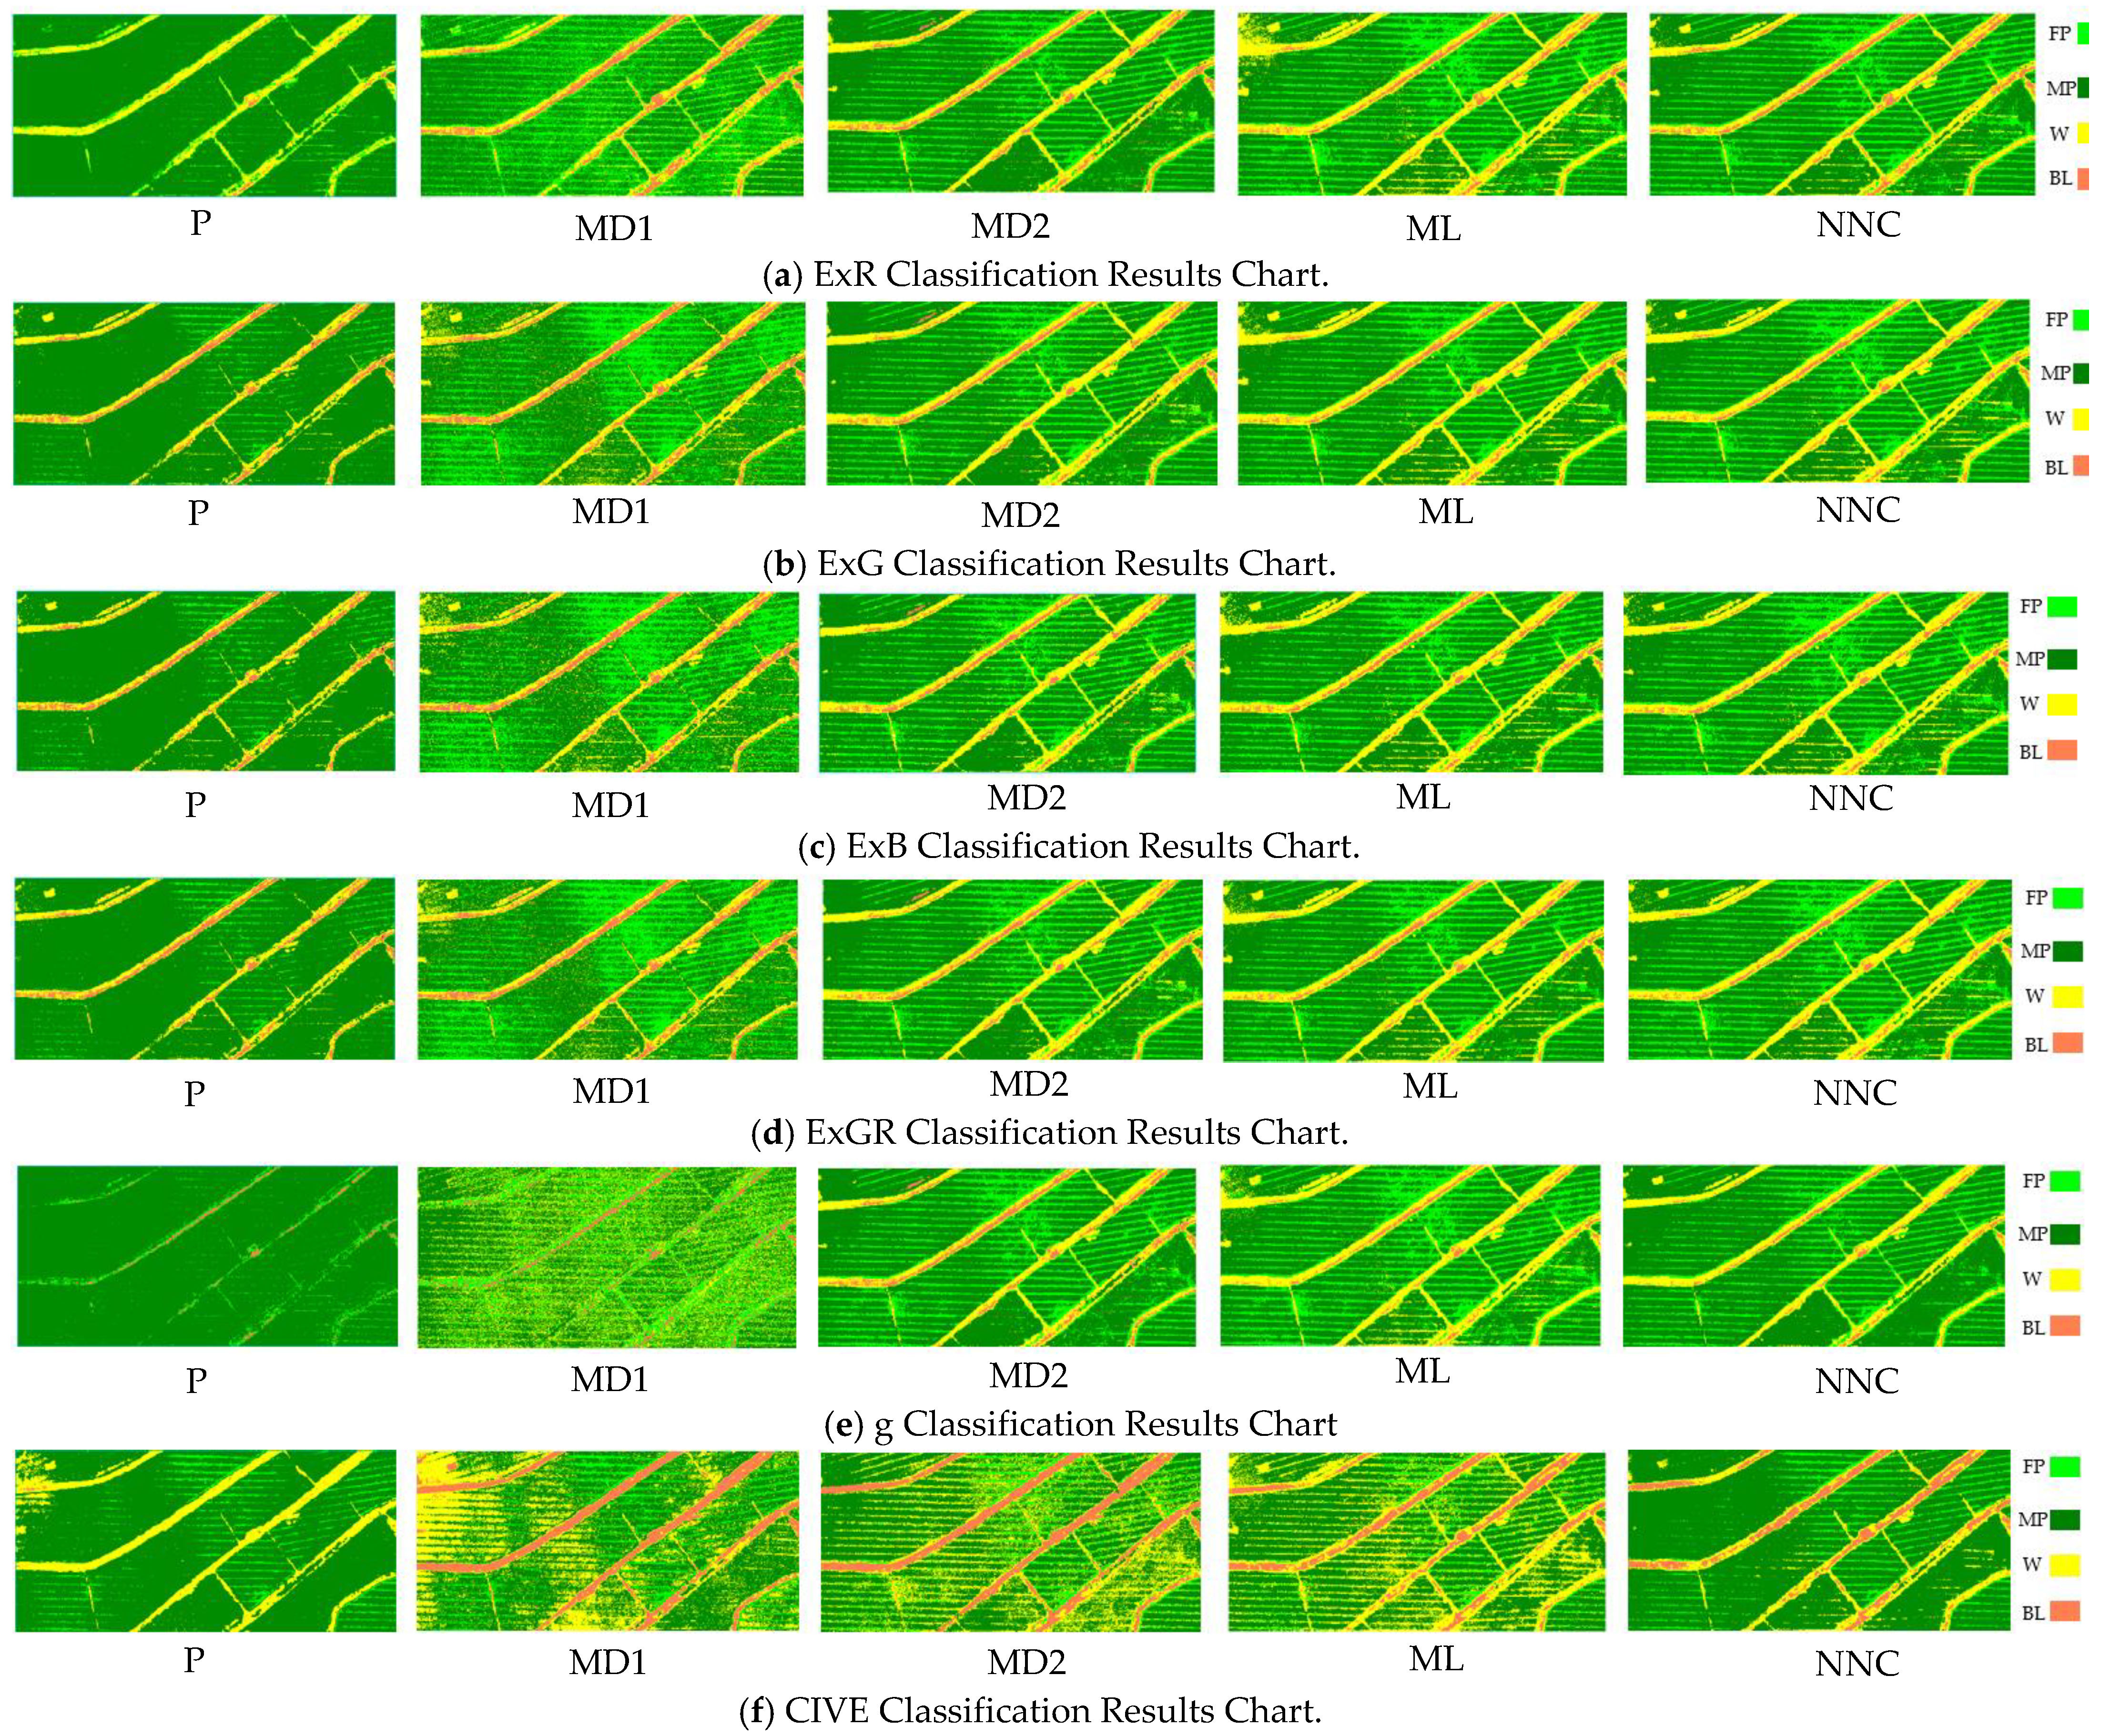
3.2. Results and Analysis of Supervised Classification of Male and Female Parents Based on Pixels
The pixel-based supervised classification was performed according to the above method, and the supervised classification results are shown in
Figure 5 and
Figure 6.
Based on the supervised classification results for the vegetation indices obtained in
Figure 5 and
Figure 6, ten samples of each of the four categories of female parent, male parent, weed and bare land were selected as validation samples based on the visual interpretation on the visible light images. The confusion matrix was calculated for the four types of features to obtain the accuracy statistics for each vegetation index. The kappa coefficient and total classification accuracy results for male and female parents are shown in
Table 4. It can be seen from
Table 4 that from the classification accuracy of the visible light vegetation index, the kappa coefficient and the total classification accuracy were generally lower than the other three methods in the parallelepiped method and the minimum distance method. The total classification accuracy of the parallelepiped method was the lowest, and even the kappa coefficient reached 0.2084 in the G vegetation index. Both the maximum likelihood method and the neural network method had better classification accuracy. The kappa coefficient and the total accuracy of classification basically reached more than 0.9, and the total accuracy of the ExGR index in neural network classification was the highest among all vegetation indices, reaching 0.9599. From the classification accuracy of the multispectral vegetation index, the classification accuracy of the four multi spectral vegetation indices was generally low, basically between 0.5–0.8. According to the combination of visible light vegetation index and multispectral vegetation index, the classification accuracy of the four multispectral vegetation indices was generally lower than that of the six visible light vegetation indices in the five classification methods, and, among the five classification methods, the ten vegetation indices achieved better classification accuracy in the maximum likelihood method and the neural network method. Neural network classification was used to generate the confusion matrix. The confusion matrix calculation results for four types of ground objects on the ExGR index with the highest classification accuracy are shown in
Table 5. It can be seen from
Table 5 that there was still a misclassification phenomenon in the vegetation index with the highest classification accuracy. Among the weeds, 3147 pixels were wrongly classified as the female parent, accounting for 0.1316 of the total weeds.
3.3. Object-Oriented Classification Results and Analysis of the Male the Female Parents Based on Samples
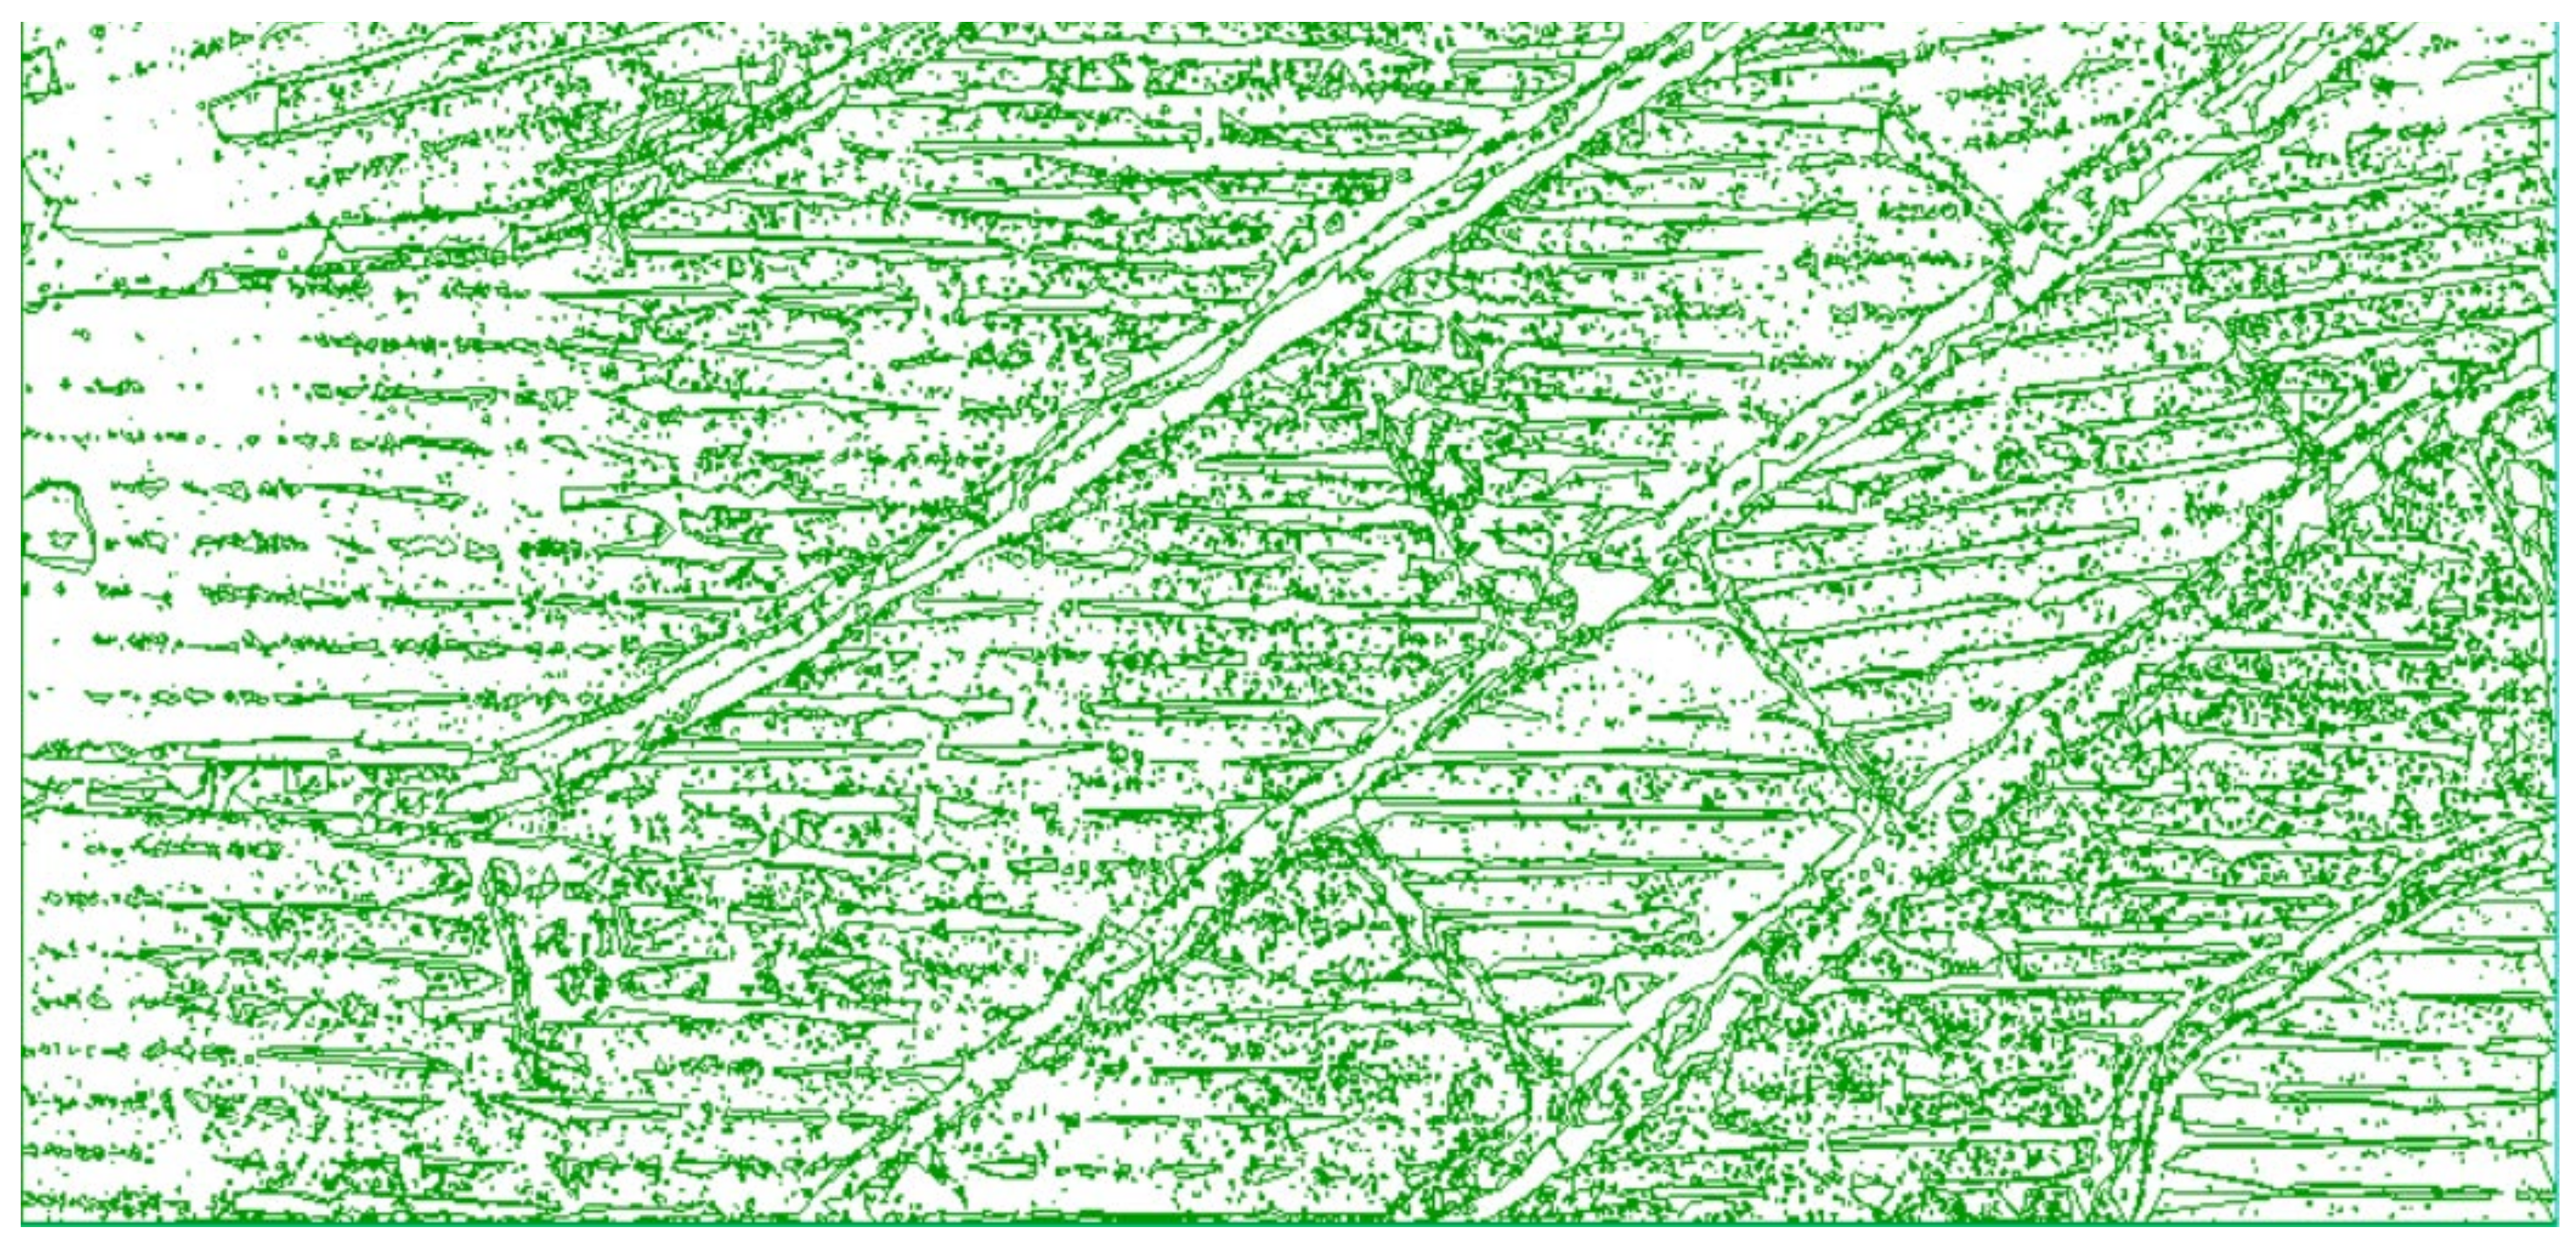
In the sample-based object-oriented approach, after merging and fusing neighbouring objects with similar spectral, textural and geometric features into a more complete object, the segmentation effect is shown in
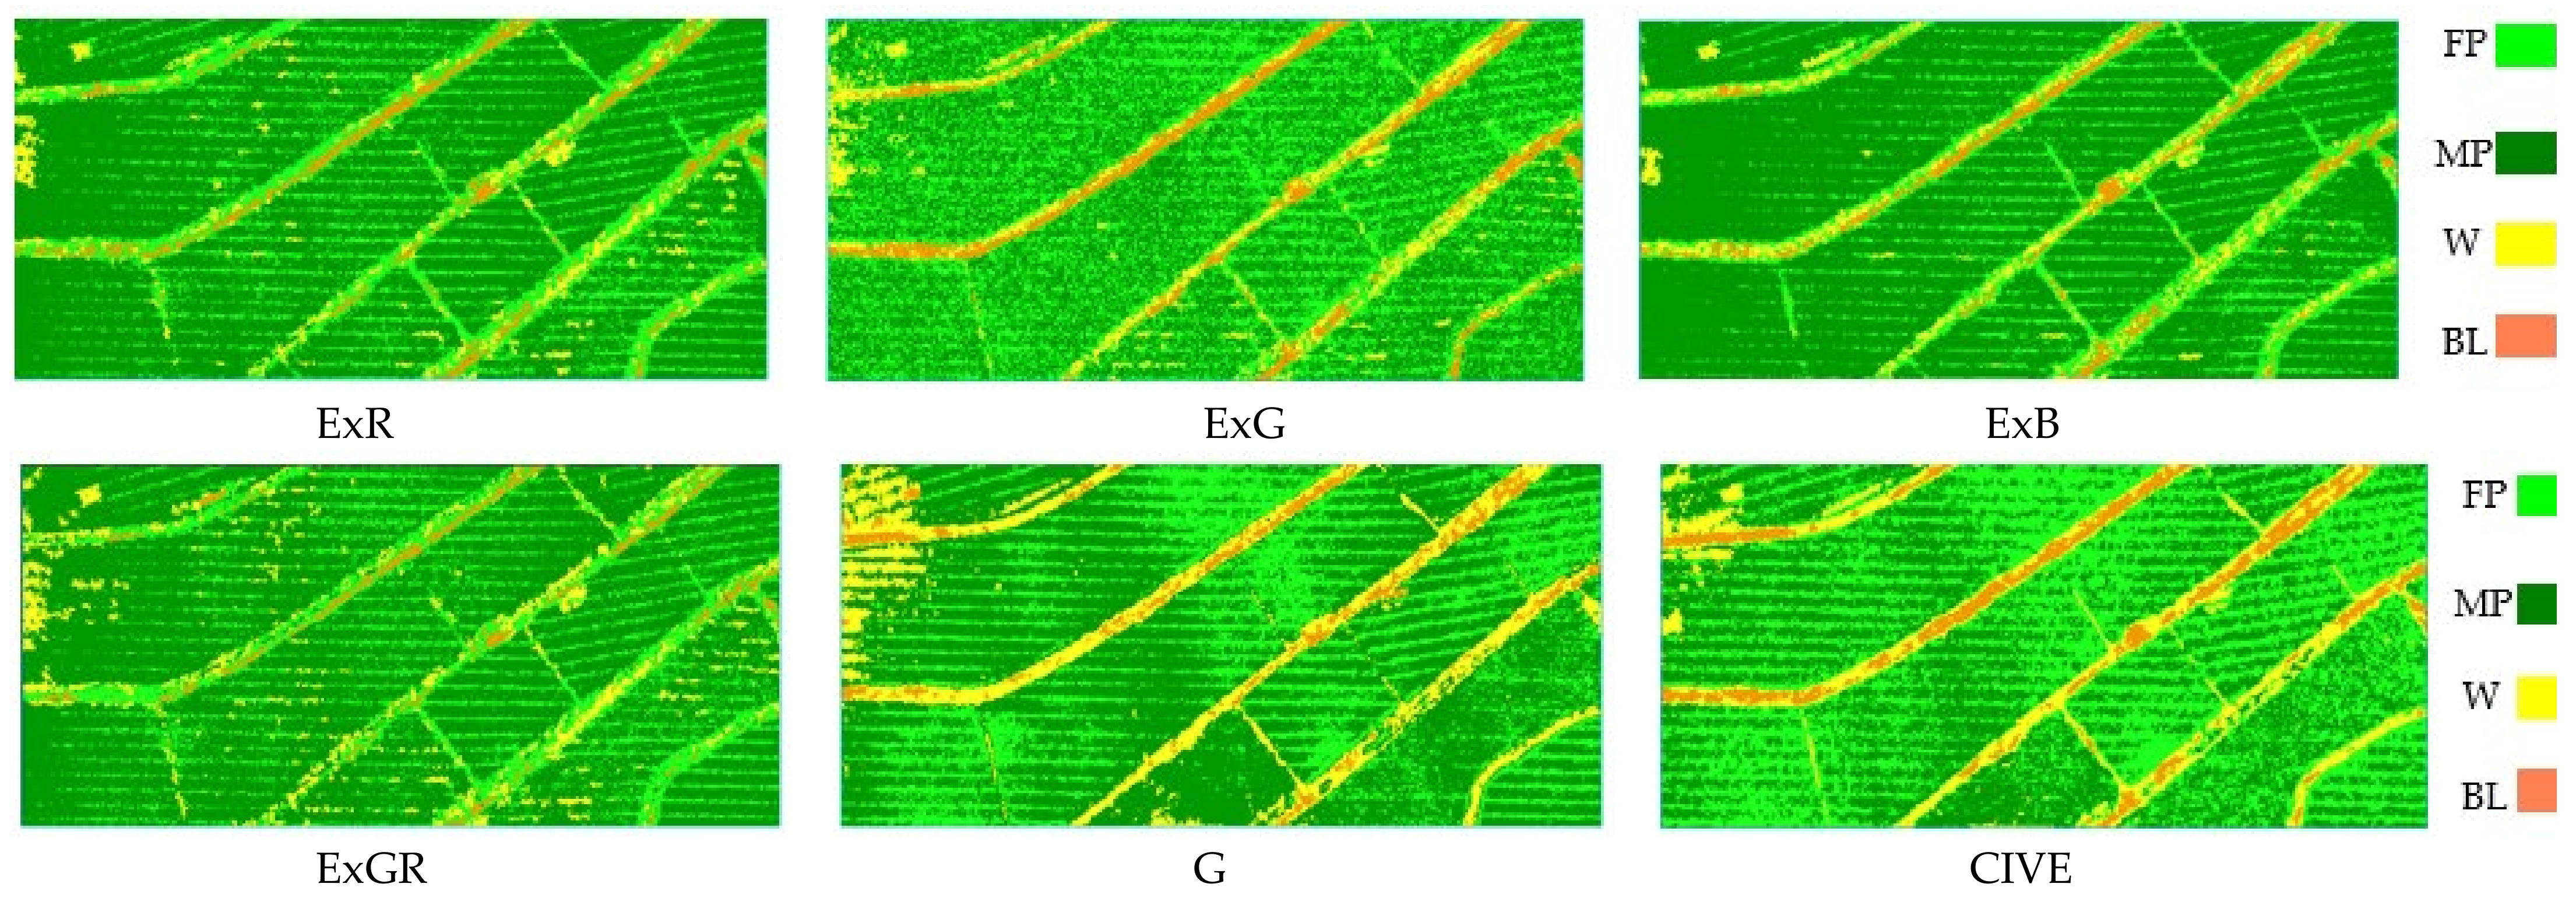
Figure 7. Automatic supervised classification is then performed according to the SVM classification method. The supervised classification results are shown in
Figure 8 and
Figure 9.
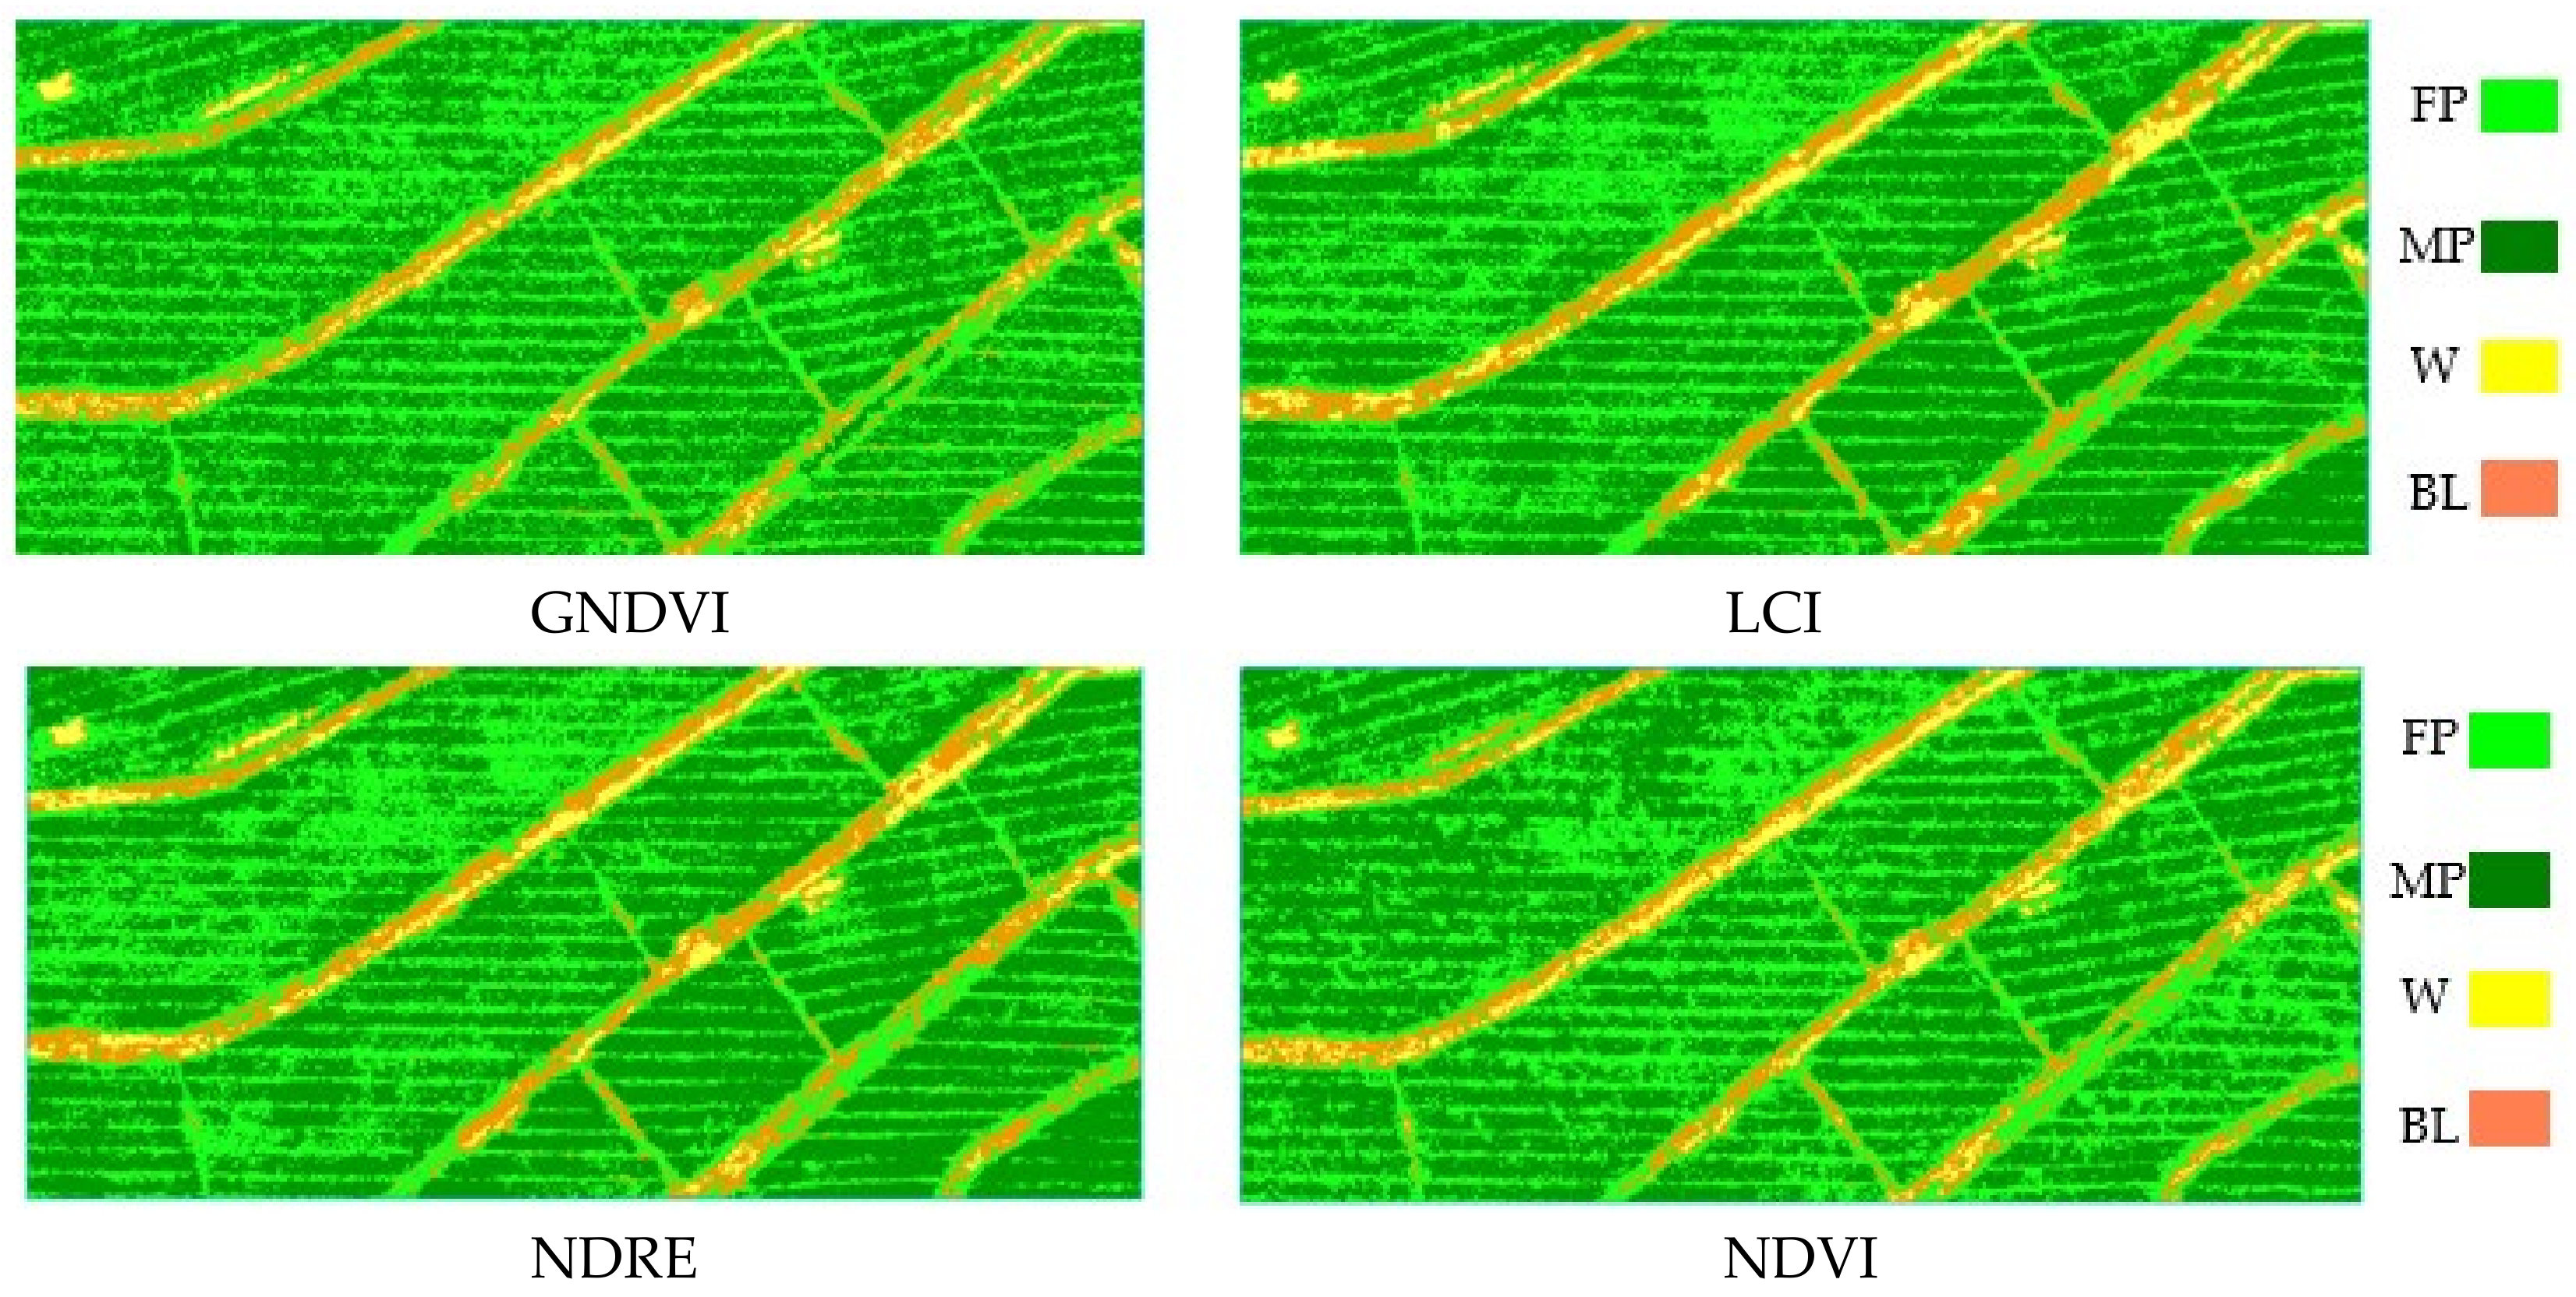
Based on the vegetation index classification results obtained in
Figure 8 and
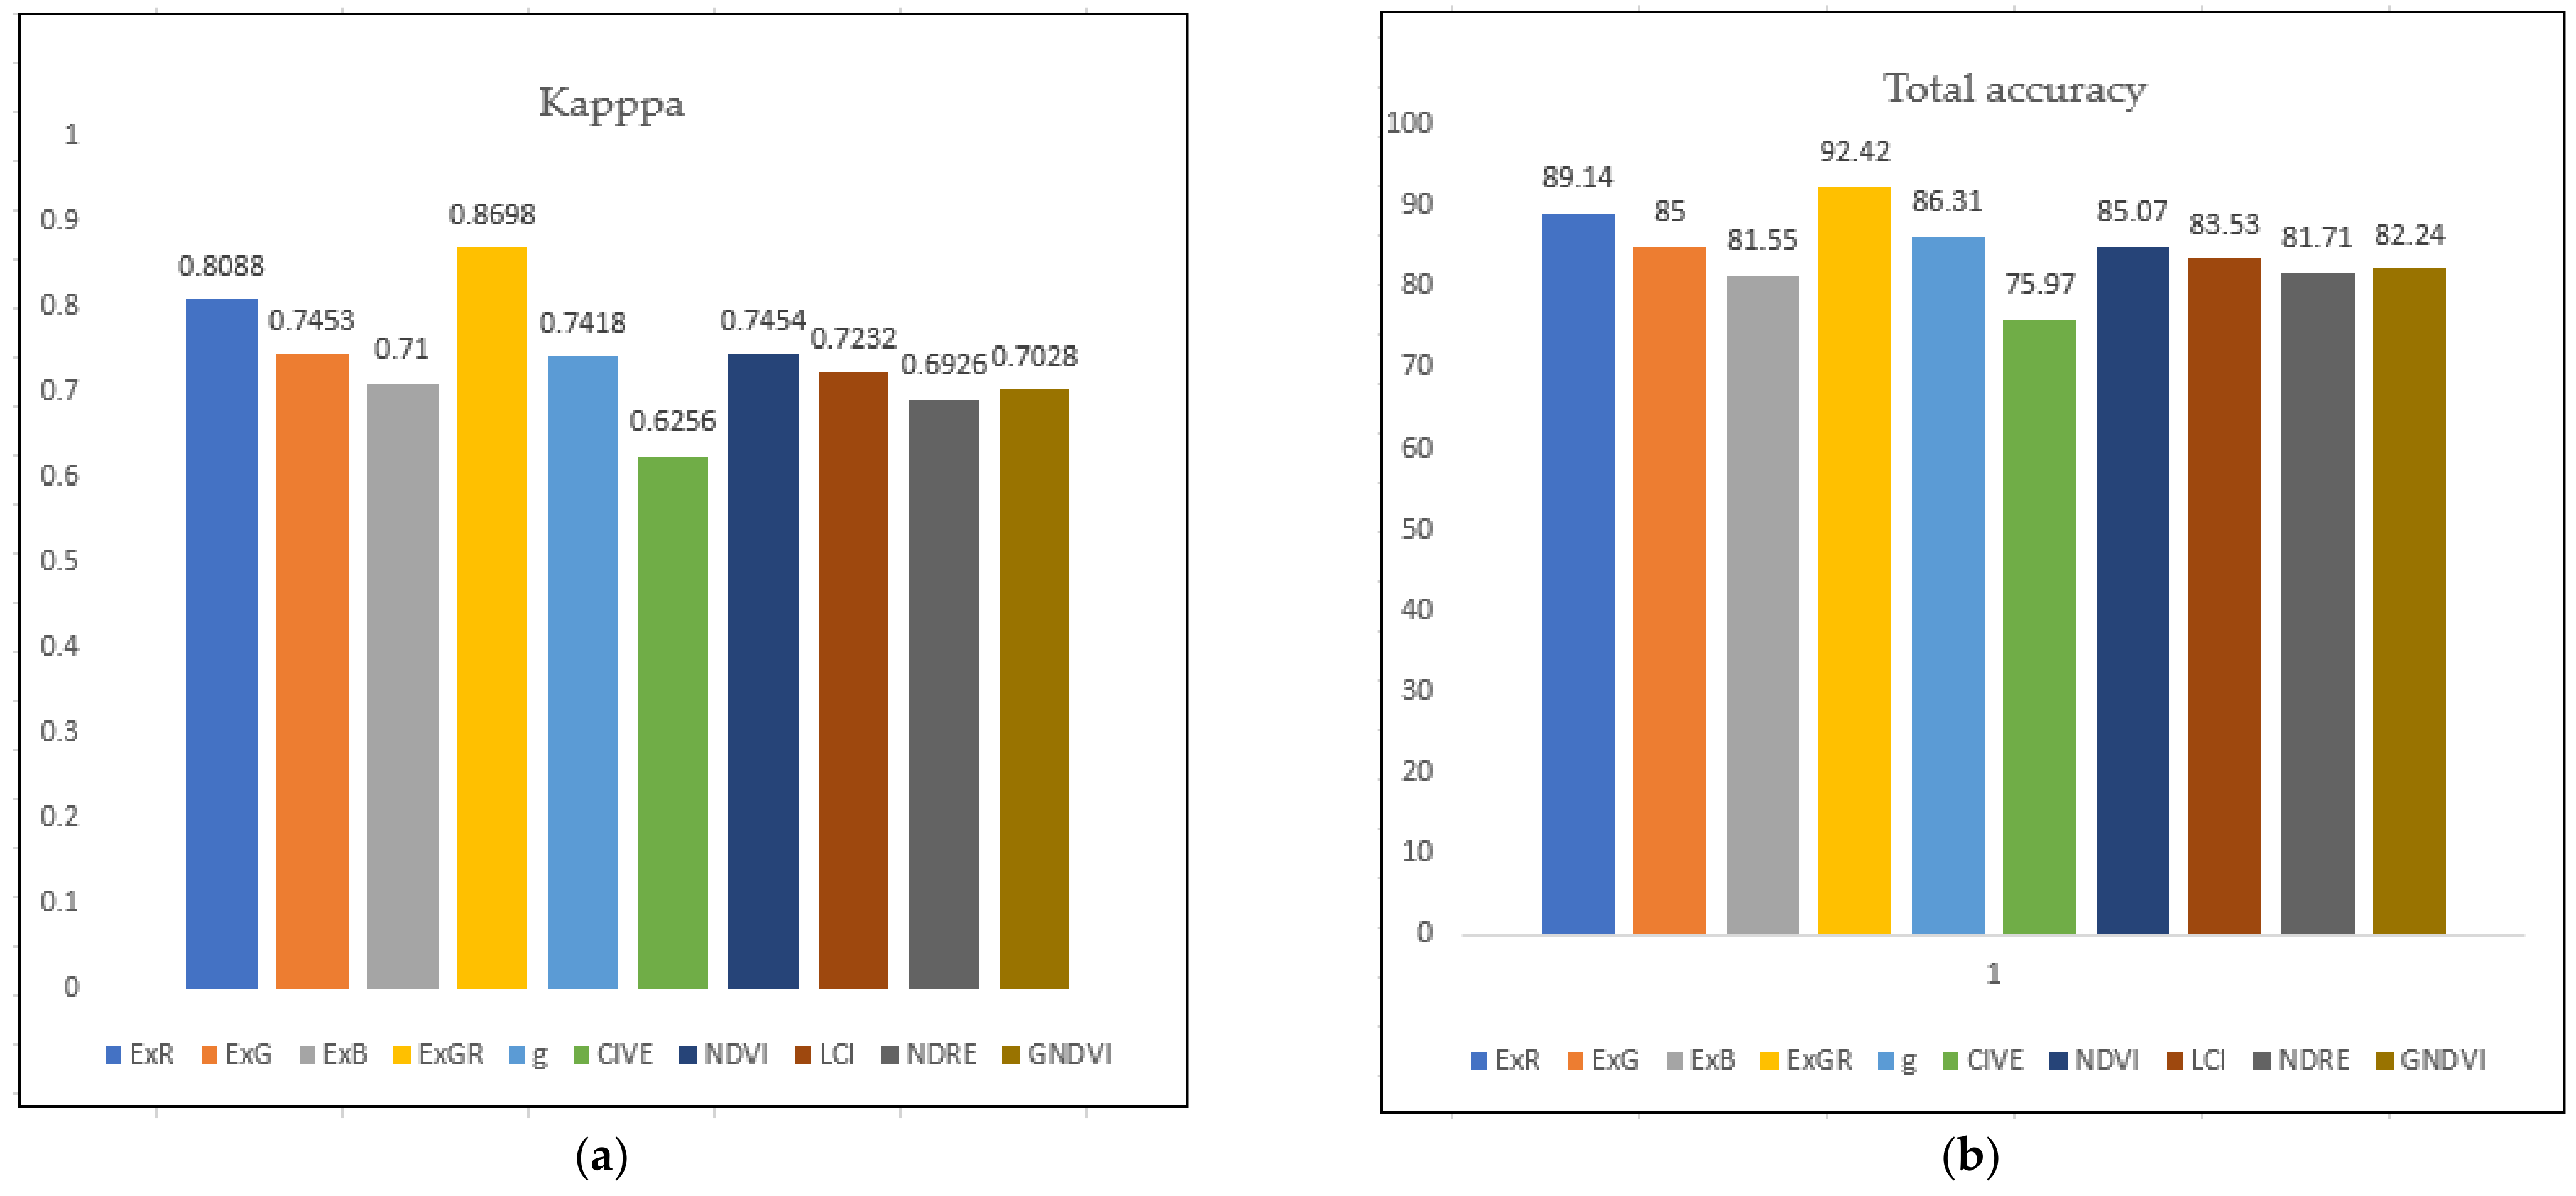
Figure 9, ten samples for each of the female and male parents were taken as the verification samples according to the visual interpretation. The classification result and the validation set were regarded as the true values. The confusion matrix of the real region of interest was calculated to obtain the accuracy statistics for each vegetation index. The results are shown in
Figure 10. As can be seen from
Figure 10, in the sample-based object-oriented classification method, the classification accuracy of the visible light vegetation index was still generally higher than that of the multispectral vegetation index, but the difference between the maximum and minimum values of the four multispectral vegetation indices was not as large as that of the six visible light vegetation indices. In the classification accuracy of the visible light vegetation indices, the CIVE received the lowest kappa coefficient with only 0.6256, while the kappa coefficient of the ExGR index, with the highest classification accuracy, reached 0.8698, and the total accuracy reached 0.9442, which is slightly lower than the pixel-based ExGR classification accuracy. In general, the object-oriented classification method also showed excellent performance regarding the extraction of male and female parents of hybrid rice.
4. Discussion
This study innovatively proposed to identify hybrid rice parents by UAV-based multispectral imagery analysis and realize the rapid and non-destructive identification and extraction of hybrid rice parents. The study solved the problem of time-consuming, labor-intensive and low-efficiency manual identification of rice parents in large-scale hybrid rice seed production farms, improved the timeliness of monitoring, and achieved monitoring with comparable accuracy to and in a shorter time than manual recognition. In the future, the results obtained through this research could be applied to unmanned smart farm management, which promises to realize the remote monitoring of hybrid rice parent identification, with great savings in terms of labor costs. Based on the results of this study, we will be able to further investigate the flowering rate estimation of hybrid rice, master the flowering habit of hybrid rice automatically and conduct a more in-depth exploration of unmanned monitoring.
When considering crop classification based on the images obtained by UAV as the data source, vegetation indices have been widely used to evaluate vegetation coverage qualitatively and quantitatively, and the use of vegetation indices can greatly improve vegetation monitoring. Wan et al. [
15] used the random forest algorithm, eight common visible light vegetation indices and two multispectral vegetation indices to predict the flower number of rapeseed. In this study, we selected six commonly used visible light vegetation indices and four multispectral vegetation indices from the existing range of vegetation indices. Multispectral vegetation indices were added in this work for better comparison between the performance of multispectral vegetation indices and visible vegetation indices in the identification of male and female parents of hybrid rice plants using differences in spectral information.
In the selection of samples, the difference between the object-oriented classification method and the pixel-based classification method was that it was no longer for a single pixel but for the objects formed after image segmentation, and the objects formed after segmentation were consistent in spatial resolution. However, the total number of pixels in the sample was roughly the same as that of the supervised classification based on pixels, so there were enough object-oriented samples, and the training sets used by the two methods were the same. The training results showed that the pixel-based supervised classification method was generally more accurate than the sample-based object-oriented method. Therefore, in general, the supervised classification method based on pixels was superior to the object-oriented method based on samples in this study, and the maximum likelihood method in the supervised classification method based on pixels was found to be more applicable in the extraction of hybrid rice parents than the neural network classification method. In the follow-up study, we suggest research with more training samples to improve the classification accuracy.
In terms of algorithms, this study also proved the feasibility of the supervised classification method in the identification of male and female parents of hybrid rice. We also used sample based object-oriented and five pixel-based supervised classification methods to extract male and female parents of hybrid rice. By comparing various algorithms, we can better select the optimal algorithm for identifying crops than by examining single algorithms. Among the ten vegetation indices studied, the ExGR index had the highest accuracy in the neural network supervised classification method. The kappa coefficient reached 0.9330 and the total accuracy was 0.9599, which was higher than the object-oriented classification method based on samples. Compared with the five supervised classification methods based on pixels, the classification accuracies of the maximum likelihood method and the neural network method were significantly higher than those of the parallel hexahedron method, the minimum distance method and the Mahalanobis distance method. In comparison, the classification accuracy of the maximum likelihood method was slightly lower than that of neural network classification, but in terms of processing time, the classification time of the neural network method was much longer than that of the maximum likelihood method. In practical applications, researchers can choose neural network classification with high accuracy requirements and the maximum likelihood method with fast prediction speed through demand selection algorithms. In this study, because field monitoring needs to reflect male and female parent information quickly and in real time, the maximum likelihood method is more suitable for the identification of male and female parents of hybrid rice plants.
In terms of accuracy comparison, Wang et al. [
44] comprehensively evaluated the application range and limitations of the kappa coefficient and proved the feasibility of the kappa coefficient in a classification accuracy evaluation. In this study, the total accuracy was added to the kappa coefficient to jointly evaluate the accuracy of classification of the male and female parents of hybrid rice, which made up for the limitation of the kappa coefficient in the classification accuracy and improved the reliability of the accuracy evaluation.
Jing et al. [
18] used pixel-based supervised classification and object-oriented classification to extract aquatic vegetation, in which the kappa coefficient of the object-oriented classification method reached 0.9, which greatly improved the extraction accuracy of aquatic vegetation. Although both pixel-based supervised classification and object-oriented classification methods can represent the differences between different objects based on the spectral information and spatial information of the objects in the supervised classification method, it should be pointed out that in this study the male and female parents of rice plants showed similar spectral information to weeds. The selection of male parent, female parent and weed samples was more difficult than the selection of aquatic plants, which may eventually have led to misclassification across the three categories. In particular, the proportion of weeds wrongly classified as female parents was quite large, resulting in a decrease in the overall classification accuracy of sample-based object-oriented classification.
5. Conclusions
In this study, we propose a method for the identification and extraction of hybrid rice parents based on UAV remote sensing images for the needs of hybrid rice seed production. In the calculation of the separation degree of the male parent and the female parent, a good separation degree close to 1.9 was obtained. Six kinds of visible light vegetation indices and four multispectral vegetation indices, which were excellent regarding the parental information on hybrid rice in previous studies, were selected. In terms of algorithms, pixel-based supervised classification was found to be more suitable for hybrid rice parent identification than the sample-based object-oriented classification pair, and the ExGR index had the highest accuracy in neural network supervised classification, with a kappa coefficient of 0.9330 and a total accuracy of 0.9599. At present, misclassification still exists in the classification process, and weeds are misclassified as female parents. In general, this study used the spectral information of male and female parents on the vegetation index to provide a useful reference for the utilization of UAV remote sensing images to identify male and female parents of hybrid rice plants. The aim of our overall study is to explore the cultivar-free relations of flowering under spectral responses. In our future work, we will further extend the research to multiple rice cultivars to develop and validate the model’s generalization capabilities with respect to unknown rice cultivars.
Author Contributions
Conceptualization, Y.Z.; methodology, H.L.; software, H.L.; validation, Y.Q. and W.X.; formal analysis, H.L.; investigation, H.L., H.T., D.Z., J.X., X.L. and K.Z.; resources, Y.Z.; data curation, H.L.; writing—original draft preparation, H.L.; writing—review and editing, Y.Q. and W.X.; visualization, H.L.; supervision, Y.L.; project administration, Y.Z.; funding acquisition, Y.Z. and Y.L. All authors have read and agreed to the published version of the manuscript.
Funding
This research was funded by the Key Field Research and Development Plan of Guangdong Province, China, grant number 2019B020221001, and the 111Project, grant number D18019.
Institutional Review Board Statement
Not applicable.
Informed Consent Statement
Not applicable.
Data Availability Statement
The data presented in this study are available on request from the corresponding author.
Conflicts of Interest
The authors declare no conflict of interest.
References
- Yuan, L.P. Developing of hybrid rice to ensure food security. Rice Sci. 2014, 21, 1–2. [Google Scholar] [CrossRef]
- Khush, G.S. What it will take to feed 5.0 billion rice consumers in 2030. Plant Mol. Biol. 2005, 59, 1–6. [Google Scholar] [CrossRef]
- Tang, C.; Wang, H.; Li, M.; Li, Z.; Huang, Z.; Luo, H.; Jian, M.; Zhang, H. Study status and developmental strategies of mechanical pollination for hybrid rice breeding. Trans. Chin. Soc. Agric. Eng. 2012, 28, 1–7. [Google Scholar]
- Wang, H.; Tang, C.; Li, M.; Li, Z.; Huang, Z.; Wu, M.; He, J.; Zhang, H. Effect of airflow speed on pollens distribution for hybrid rice breeding pollination. Trans. Chin. Soc. Agric. Eng. 2012, 28, 63–69. [Google Scholar]
- Li, Z.C. Research and Application of Cutting off the Male Parent after Pollination in Hybrid Rice Seed Production. Hybrid. Rice. 2020, 35, 41–43. [Google Scholar]
- Ma, G.H.; Yuan, L.P. Hybrid rice achievements, development and prospect in China. J. Integr. Agric. 2015, 14, 197–205. [Google Scholar] [CrossRef]
- Zhang, Y.L.; Xiao, W.W.; Lu, X.Y.; Liu, A.M.; Qi, Y.; Liu, H.C.; Shi, Z.K.; Lan, Y.B. Method for detecting rice flowering spikelets using visible light images. Trans. Chin. Soc. Agric. Eng. 2021, 37, 253–262. [Google Scholar]
- Zhang, J.; Yao, F.; Li, B.; Yan, H.; Hou, Y.; Cheng, G.; Boken, V. Progress in monitoring high-temperature damage to rice through satellite and ground-based optical remote sensing. Sci. China Earth Sci. 2011, 54, 1801–1811. [Google Scholar] [CrossRef]
- Chen, P.C.; Chiang, Y.C.; Weng, P.Y. Imaging using unmanned aerial vehicles for agriculture land use cmlassification. Agriculture 2020, 10, 416. [Google Scholar] [CrossRef]
- Ju, C.; Son, H.L. Multiple UAV systems for agricultural applications: Control, Implementation, and Evaluation. Electronics 2018, 7, 162. [Google Scholar] [CrossRef] [Green Version]
- Li, C.; Li, H.; Li, J.; Lei, Y.; Li, C.; Manevski, K.; Shen, Y. Using NDVI percentiles to monitor real-time crop growth. Comput. Electron. Agric. 2019, 162, 357–363. [Google Scholar] [CrossRef]
- da Silva, C.A.; Nanni, M.R.; Teodoro, P.E.; Silva, G.F.C. Vegetation indices for discrimination of soybean areas: A New Approach. Agron. J. 2017, 109, 1331–1343. [Google Scholar] [CrossRef]
- Niazmardi, S.; Homayouni, S.; Safari, A.; McNairn, H.; Shang, J.; Beckett, K. Histogram-based spatio-temporal feature classification of vegetation indices time-series for crop mapping. Int. J. Appl. Earth Obs. Geoinf. 2018, 72, 34–41. [Google Scholar] [CrossRef]
- Zhang, Z.J.; Li, A.N.; Bian, J.H.; Zhao, W.; Nan, X.; Jin, H.A.; Tan, J.B.; Lei, G.B.; Xia, H.M.; Yang, Y.S.; et al. Estimating aboveground biomass of grassland in Zoige by visable vegetation index derived from unmanned aerial vechicle image. Remote Sens. Technol. Appl. 2016, 31, 51–62. [Google Scholar]
- Wan, L.; Li, Y.; Cen, H.; Zhu, J.; Yin, W.; Wu, W.; Zhu, H.; Sun, D.; Zhou, W.; He, Y. Combining UAV-Based vegetation indices and image classification to estimate flower number in oilseed rape. Remote Sens. 2018, 10, 1484. [Google Scholar] [CrossRef] [Green Version]
- Cai, E.; Baireddy, S.; Yang, C.; Delp, E.J.; Crawford, M. Panicle Counting in UAV Images For Estimating Flowering Time in Sorghum. In Proceedings of the 2021 IEEE International Geoscience and Remote Sensing Symposium IGARSS, Brussels, Belgium, 11–16 July 2021; pp. 6280–6283. [Google Scholar]
- Hardanto, A.; Mustofa, A. Crop stage classification using supervised algorithm based on UAV and Landsat 8 image. IOP Conf. Ser. Earth Environ. Sci. 2021, 653, 12102. [Google Scholar] [CrossRef]
- Jing, R.; Deng, L.; Zhao, W.J.; Gong, Z.N. Object-oriented aquatic vegetation extracting approach based on visible vegetation indices. Ying Yong Sheng Tai Xue Bao J. Appl. Ecol. 2016, 27, 1427–1436. [Google Scholar]
- Imanishi, J.; Morimoto, Y.; Imanishi, A.; Sugimoto, K.; Isoda, K. The independent detection of drought stress and leaf density using hyperspectral resolution data. Landsc. Ecol. Eng. 2007, 3, 55–65. [Google Scholar] [CrossRef]
- Ji, D.B.; Shi, J.C.; Letu, H.; Wang, T.X.; Zhao, T.J. Atmospheric effect analysis and correction of the microwave vegetation index. Remote Sens. 2017, 9, 606. [Google Scholar] [CrossRef] [Green Version]
- Yoshioka, H.; Miura, T.; Obata, K. Derivation of relationships between spectral vegetation indices from multiple ensors Based on Vegetation Isolines. Remote Sens. 2012, 4, 583–597. [Google Scholar] [CrossRef] [Green Version]
- Meyer, G.E.; Neto, J.C. Verification of color vegetation indices for automated crop imaging applications. Comput. Electron. Agric. 2008, 63, 282–293. [Google Scholar] [CrossRef]
- Upendar, K.; Agrawal, K.N.; Chandel, N.S.; Singh, K. Greenness identification using visible spectral colour indices for site specific weed management. Plant Physiol. Rep. 2021, 26, 179–187. [Google Scholar] [CrossRef]
- Guijarro, M.; Pajares, G.; Riomoros, I.; Herrera, P.J.; Burgos-Artizzu, X.P.; Ribeiro, A. Automatic segmentation of relevant textures in agricultural images. Comput. Electron. Agric. 2011, 75, 75–83. [Google Scholar] [CrossRef] [Green Version]
- Zou, K.; Chen, X.; Zhang, F.; Zhou, H.; Zhang, C. A Field Weed Density Evaluation Method Based on UAV Imaging and Modified U-Net. Remote Sens. 2021, 13, 310. [Google Scholar] [CrossRef]
- Peichl, M.; Sonnentag, O.; Nilsson, M.B. Bringing color into the picture: Using digital repeat photography to investigate phenology controls of the carbon dioxide exchange in a boreal mire. Ecosystems 2015, 18, 115–131. [Google Scholar] [CrossRef]
- Hague, T.; Tillett, N.D.; Wheeler, H. Automated Crop and Weed Monitoring in Widely Spaced Cereals. Precis. Agric. 2006, 7, 21–32. [Google Scholar] [CrossRef]
- Lee, G.; Hwang, J.; Cho, S. A novel index to detect vegetation in urban areas using UAV-Based multispectral images. Appl. Sci. 2021, 11, 3472. [Google Scholar] [CrossRef]
- Lima, J.S.; Altoe, M.S.; Silva, S.A.; Fonseca, A.S.; Medauar, C.C. Spatial variability of the nutritional status and the leaf chlorophyll index of from rubber tree. An. Acad. Bras. Ciências 2021, 93, e20191336. [Google Scholar] [CrossRef]
- Fernández-Manso, A.; Fernández-Manso, O.; Quintano, C. SENTINEL-2A red-edge spectral indices suitability for discriminating burn severity. Int. J. Appl. Earth Obs. Geoinf. 2016, 50, 170–175. [Google Scholar] [CrossRef]
- Song, B.; Park, K. Detection of aquatic plants using multispectral UAV imagery and vegetation index. Remote Sens. 2020, 12, 387. [Google Scholar] [CrossRef] [Green Version]
- Li, L.; Sun, C.; Lin, L.; Li, J.; Jiang, S.; Yin, J. A dual-kernel spectral-spatial classification approach for hyperspectral images based on Mahalanobis distance metric learning. Inf. Sci. 2018, 429, 260–283. [Google Scholar] [CrossRef]
- Gong, X.; Shen, L.; Lu, T. Refining training samples using median absolute deviation for supervised classification of remote sensing images. J. Indian Soc. Remote Sens. 2019, 47, 647–659. [Google Scholar] [CrossRef]
- Ma, L.; Ma, A.; Ju, C.; Li, X. Graph-based semi-supervised learning for spectral-spatial hyperspectral image classification. Pattern Recognit. Lett. 2016, 83, 133–142. [Google Scholar] [CrossRef]
- Egorov, V.A.; Bartalev, S.A.; Kolbudaev, P.A.; Plotnikov, D.E.; Khvostikov, S.A. Land cover map of Russia derived from Proba-V satellite data. Sovrem. Probl. Distantsionnogo Zondirovaniya Zemli Iz Kosmosa. 2018, 15, 282–286. [Google Scholar] [CrossRef]
- Konar, D.; Panigrahi, B.K.; Bhattacharyya, S.; Dey, N.; Jiang, R. Auto-Diagnosis of COVID-19 using lung CT images with Semi-supervised shallow learning network. IEEE Access 2021, 9, 28716–28728. [Google Scholar] [CrossRef]
- Forget, Y.; Linard, C.; Gilbert, M. Supervised classification of built-Up areas in sub-Saharan african cities using landsat imagery and openStreetMap. Remote Sens. 2018, 10, 1145. [Google Scholar] [CrossRef] [Green Version]
- Wu, J.; Bauer, M.E. Evaluating the effects of shadow detection on quickBird image classification and spectroradiometric restoration. Remote Sens. 2013, 5, 4450–4469. [Google Scholar] [CrossRef] [Green Version]
- Negri, R.G.; Dutra, L.V.; Sant’Anna, S.J.S. An innovative support vector machine based method for contextual image classification. ISPRS J. Photogramm. Remote Sens. 2014, 87, 241–248. [Google Scholar] [CrossRef]
- Sari, I.L.; Weston, C.J.; Newnham, G.J.; Volkova, L. Assessing accuracy of land cover change maps derived from automated digital processing and visual interpretation in tropical forests in indonesia. Remote Sens. 2021, 13, 1446. [Google Scholar] [CrossRef]
- Tarko, A.; de Bruin, S.; Fasbender, D.; Devos, W.; Bregt, A.K. Users’ assessment of orthoimage photometric quality for visual interpretation of agricultural fields. Remote Sens. 2015, 7, 4919–4936. [Google Scholar] [CrossRef] [Green Version]
- Foody, G.M. Explaining the unsuitability of the kappa coefficient in the assessment and comparison of the accuracy of thematic maps obtained by image classification. Remote Sens. Environ. 2020, 239, 111630. [Google Scholar] [CrossRef]
- Tang, W.; Hu, J.; Zhang, H.; Wu, P.; He, H. Kappa coefficient: A popular measure of rater agreement. Shanghai Arch. Psychiatry 2015, 27, 62–67. [Google Scholar] [PubMed]
- Wang, J. Research on the Application of Kappa Coefficient in Consistency Evaluation. Master’s Thesis, Sichuan University, Chengdu, China, 2016. [Google Scholar]
| Publisher’s Note: MDPI stays neutral with regard to jurisdictional claims in published maps and institutional affiliations. |
© 2022 by the authors. Licensee MDPI, Basel, Switzerland. This article is an open access article distributed under the terms and conditions of the Creative Commons Attribution (CC BY) license (https://creativecommons.org/licenses/by/4.0/).


