Article

Image Segmentation of UAV Fruit Tree Canopy in a Natural Illumination Environment

College of Engineering, China Agricultural University, No.17 Qing Hua Dong Lu, Haidian District, Beijing 100083, China
*
Author to whom correspondence should be addressed.
Agriculture 2022, 12(7), 1039; https://doi.org/10.3390/agriculture12071039
Submission received: 23 June 2022 / Revised: 14 July 2022 / Accepted: 15 July 2022 / Published: 16 July 2022
(This article belongs to the Special Issue Remote-Sensing-Based Technologies for Crop Monitoring)

Abstract

:
Obtaining canopy area, crown width, position, and other information from UAV aerial images and adjusting spray parameters in real-time according to this information is an important way to achieve precise pesticide application in orchards. However, the natural illumination environment in the orchard makes extracting the fruit tree canopy difficult. Hereto, an effective unsupervised image segmentation method is developed in this paper for fast fruit tree canopy acquisition from UAV images under natural illumination conditions. Firstly, the image is preprocessed using the shadow region luminance compensation method (SRLCM) that is proposed in this paper to reduce the interference of shadow areas. Then, use Naive Bayes to obtain multiple high-quality color features from 10 color models was combined with ensemble clustering to complete image segmentation. The segmentation experiments were performed on the collected apple tree images. The results show that the proposed method’s average precision rate, recall rate, and F1-score are 95.30%, 84.45%, and 89.53%, respectively, and the segmentation quality is significantly better than ordinary K-means and GMM algorithms.

1. Introduction

Precise spraying is a spraying strategy. It uses modern technology to obtain crop information to guide the spraying machinery to achieve target spraying and variable spraying, so as to maximize the benefits of plant protection and reduce damage to the ecological environment. Refs. [1,2,3]. Image information is highly significant among the quantitative data on precise pesticide applications. Specifically, it is that the crop shape, structure, position, and other information of crops are obtained through images, and the spray parameters are adjusted according to specific crop information [4,5].
For precise spraying in orchards, the canopy is the main object of spraying, and parameters such as canopy volume, area, and crown width are important indicators to determine the spraying in orchards. Low-altitude remote sensing images that are based on UAV photography are one of the important ways to obtain fruit tree canopy parameters [6,7]. Compared with airborne radar imaging [8] and high-altitude satellite remote sensing [9], the use of UAVs to obtain images is more convenient and requires less data processing. The first process in extracting canopy parameters from drone images is to extract the canopy from the background [10,11,12]. In this process, one of the challenges is how to overcome various natural illumination and weather conditions in the orchard, which sometimes cause a shadow over the vegetation, for example (Figure 1a,b), hindering the computation of correct segmentations.
For efficient segmentation, effective features need to be employed to discriminate between plants and background. In previous studies, color has been identified as a critical feature for separating plants from non-plant backgrounds [13,14,15,16]. Frequently used color features can be grouped into two categories [17,18]. The first category is the color indices that are calculated in the RGB color space, such as excess green index (ExG) [19], color index of vegetation (CIVE) [20], and Modified Excess Green Index (MExG) [21], etc. The second category is the color channel of various color spaces, such as HSI, HSV, Lab, etc. [22,23,24,25]. Yaxiao et al. [26] effectively segmented cotton images at seedling and bud stages based on the differences between vegetation and non-vegetation pixels in the Lab color space, combined with a fixed classification threshold. Zhai et al. [27] extracted the HSI color space’s H and I channel to effectively segment the field rapeseed plant image that was captured under different lighting conditions. The research results of Pouria et al. [28] show that using multiple color spaces is more robust for background noise and outdoor lighting changes than using a single color space. High-quality color channels from different color spaces were combined to form the optimal color set (OCS) for vegetation segmentation to extract plants from the images in some studies [29,30,31]. Alwaseela et al. [32] selected the optimal channel of each color space according to the minimum classification error, then combined them into the supreme color feature, and segmented the Infield oilseed rape images using the feature. Yingli et al. [33] applied the optimal subset selection algorithm to extract seven characteristic parameters that were suitable for segmenting rice ear images of Northeast japonica rice from the RGB and HSV color spaces and good segmentation results were obtained.
Existing vegetation segmentation methods can be grouped into color index-based segmentation, threshold-based segmentation, and learning-based segmentation [34]. The threshold-based and color index-based segmentation can deal with uniform background and do not perform well under variable illumination conditions [35]. Machine learning (ML) is an image segmentation method that can overcome the insufficiency of color index-based and threshold-based. ML methods can be grouped into two categories: supervised learning and unsupervised learning, both of which can be applied to image segmentation in field conditions [36,37,38]. Wei et al. [39] proposed a wheat image segmentation method that was based on a machine learning process, decision tree, and image noise reduction filters for the problem of natural light interference and achieved good segmentation results. Chen et al. [40] proposed a tree segmentation method that was based on a support vector machine (SVM) algorithm and monocular machine vision technology to segment citrus trees precisely under different brightness and weed coverage conditions, and the results show that the citrus tree segmentation accuracy reached 85.27% ± 9.43%. Ferreira et al. [41], to obtain information on the spatial distribution of palm trees in forests, used ResNet-18 as the backbone network of the DeepLabv3+ model and combined morphological post-processing to obtain palm tree canopy layers. The authors compared the proposed method with the results of FCN segmentation and the results showed that that the model can improve the detection rate of canopy by 34.7%. In a word, supervised learning can achieve high-precision segmentation, but it relies on complex feature engineering or large-size labeled data [42]. Yuzhen et al. [43] summarized 34 data sets of machine vision in agriculture, among which there are no open datasets for fruit tree segmentation as yet. Therefore, supervised learning which based on data markers can consume a lot of labor costs.
In contrast, unsupervised learning algorithms can divide the data according to the similarity between the data without knowing the data classification in advance. Many unsupervised models have been used for image segmentation under controlled (single background, sufficient and uniform lighting, etc.) or uncontrolled conditions. Yingli et al. [44] proposed an unsupervised Bayesian method that was based on Lab color space for rice UAV image segmentation. The method is somewhat robust to variable illumination. Zhenzhen et al. [45] proposed a canopy segmentation algorithm that was based on M-SP feature weighted clustering for the problem of background and weed interference. However, this method only applies to fruit tree images that were taken on the ground. GUO et al. [46] proposed an effective segmentation of tree images that was based on Lab color distance and GMM. This method combines color and spatial correlation in the Lab space to achieve good segmentation results. In conclusion, unsupervised image segmentation methods have been widely used in controlled conditions and less in uncontrolled conditions. In addition, most unsupervised learning algorithms are susceptible to noise and initial conditions, tend to converge to local optimal, and are only suitable for specific data structures. It leads to unsupervised learning-based image segmentation methods with low robustness under uncontrolled conditions, poor segmentation quality, and insufficient generalization ability.
This paper aims to develop an unsupervised image segmentation method with excellent segmentation quality, high robustness and strong generalization ability for fast extraction of fruit canopy from aerial fruit tree images that are taken by UAV in a natural illumination environment. For this purpose, the following research work has been done: (1) a shadow region luminance compensation method (SRLCM) is developed to preprocess fruit tree images, which can reduce the difference between shadow and non-shadow canopy areas; (2) inspired by ensemble clustering and OCS methods, a fruit tree image segmentation method that is based on ensemble OCC-K (Optimal color channel-K-means) is proposed in this study. The algorithm can accurately segment canopy images without supervision.

2. Materials and Study Area

The test objects in this paper are apple trees in the orchard research and demonstration garden (117°7′8.9′′ E and 36°12′17.8′′ N) in Taian, Shandong Province, China. The terrain of the experimental area is flat, without slope and stepped ground, with an average elevation of 153 m. Apple trees in the test area were planted at a fixed 3 × 4 m spacing.
Images were collected on 2–3 October, 2018 (sunny, no wind) and 8–9 October 2018 (cloudy, no wind). The image acquisition platform was a DJI Phantom 3 four-axis aerial photography aircraft which was equipped with a Sony EXMOR 1/2.3-inch CMOS digital camera that can output RGB orthophotos. The UAV filmed horizontally at a constant speed (5 m/s) and a height range of 15–30 m. The flight path that was adopted by the drone was in the shape of an “n” (Figure 2b). Since the difference between each frame of video image is not big, one picture is extracted every 40 frames and the blurred images were remove. A total of 200 images were extracted, with a pixel of 1830 × 2279. Among them included 100 cloudy images (Figure 1b), 100 sunny images (Figure 1c).
All the algorithms that are mentioned in this paper were developed in Python using OpenCV [47] and scikit-learn [48] packages. The computer processor is Intel (R) Core (TM) i7-9750H CPU @2.6 GHz 2.59 GHz whose operating system is Windows 10 64 bits.

3. The Fruit Tree Segmentation Method

The proposed approach consists of two main processes, as shown in Figure 2 and Figure 3 image preprocessing:
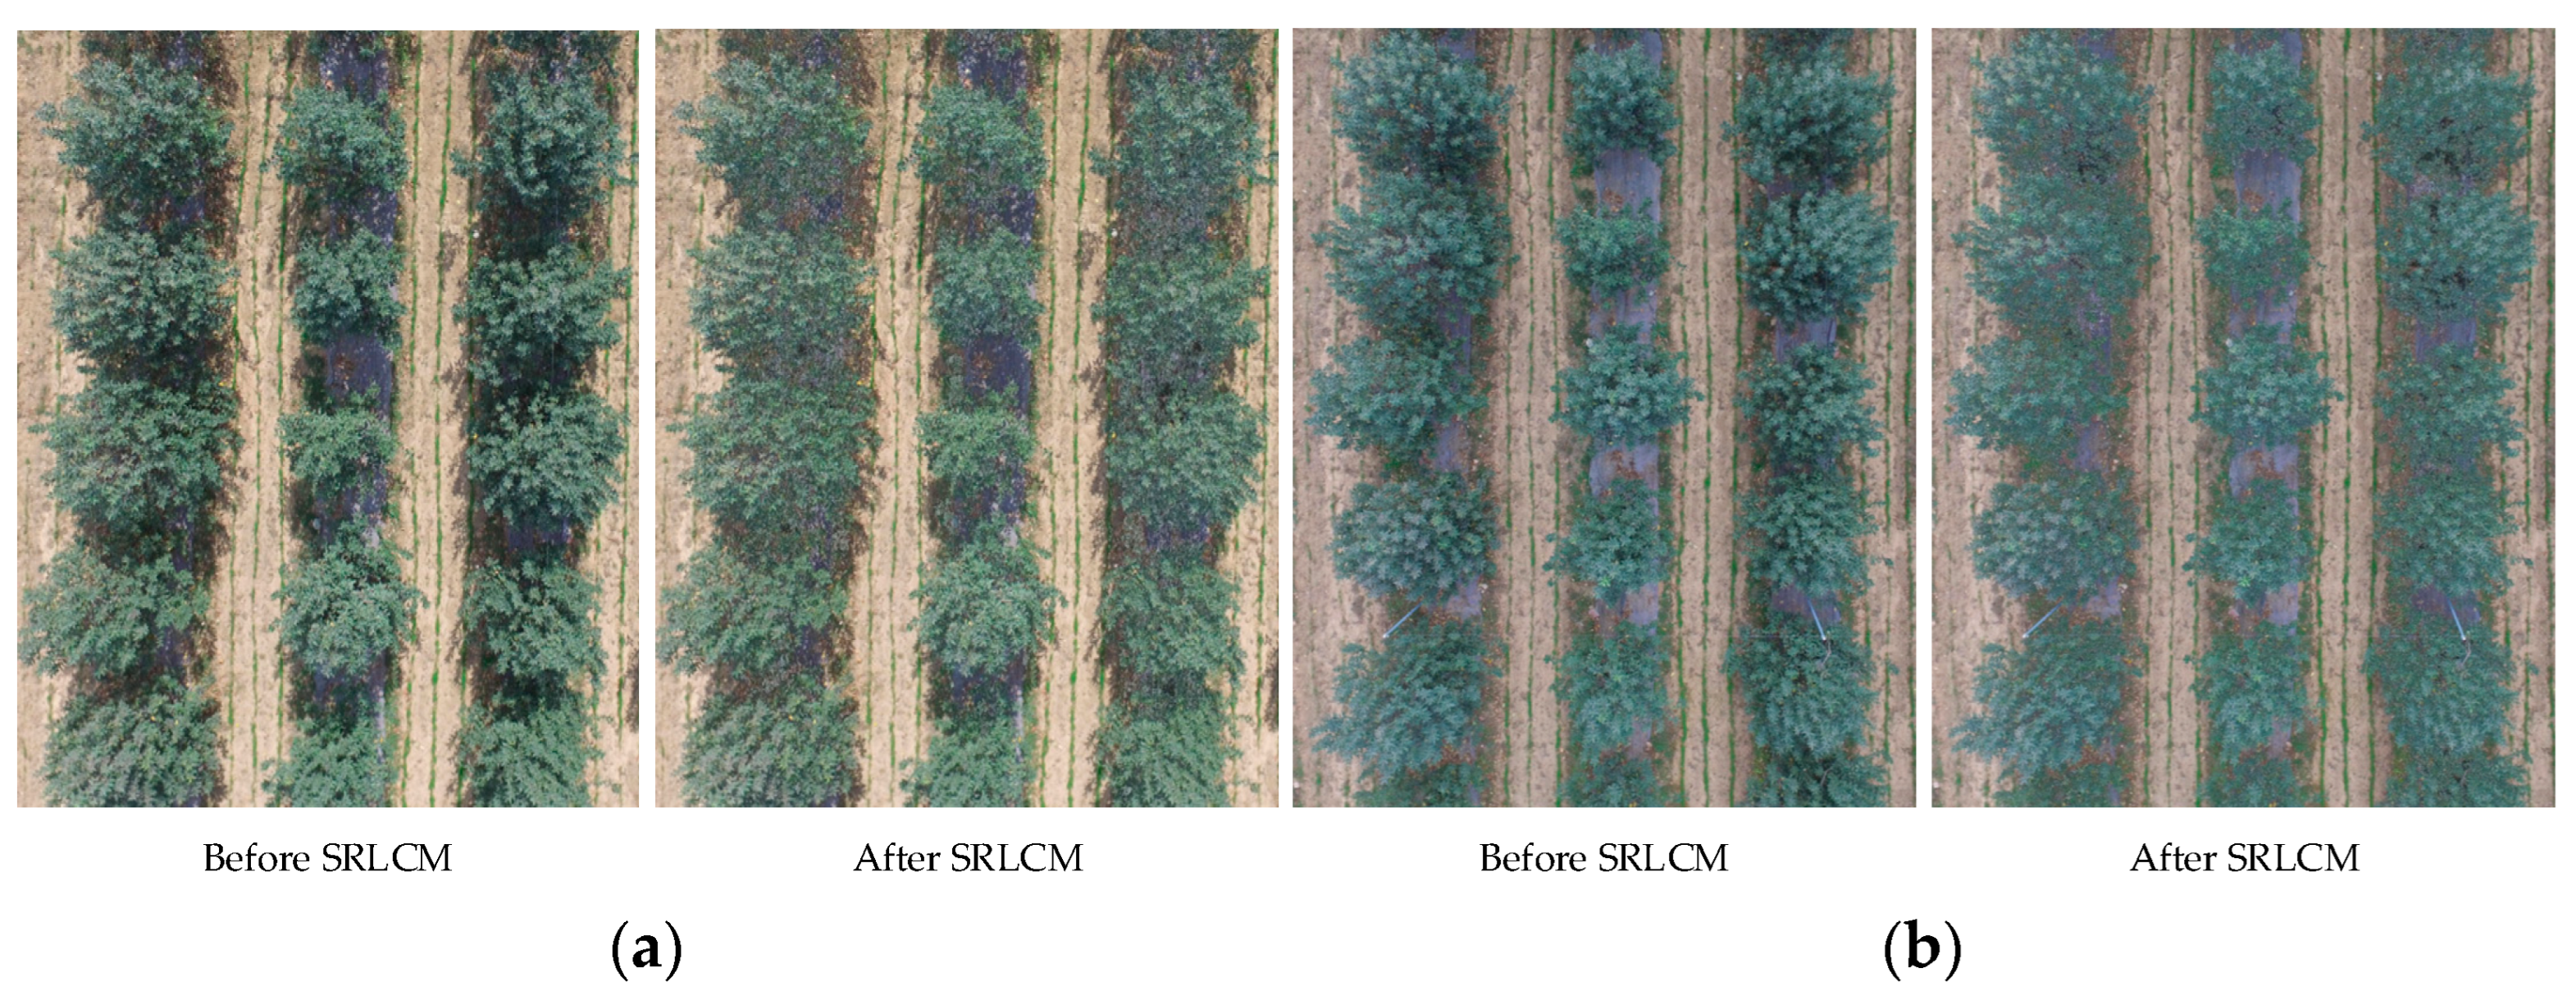
(1) luminance compensation of fruit trees in shaded areas using the SRLCM method.
(2) fruit tree image segmentation based on OCC-K:
  • Firstly, ten standard color spaces along with all possible combinations of their channels are evaluated by using accuracy (A), precision (P), F1-score (F1), and recall (R) as evaluation indexes; then according to the evaluation results, the color channel with the highest A value (AOCC), the color channel with the highest p value (POCC), the color channel with the highest R value (ROCC), the color channel with the highest F1 value(FOCC), and the color channel with the highest mean value of four indicators(MOCC) are extracted as color features.
  • Secondly, one standard K-means and four Mini Batch K-means are used to cluster AOCC, POCC, ROCC, FOCC, and MOCC, respectively.
  • Finally, the clustering results are combined to obtain the final segmentation result.

3.1. Image Preprocessing

In the fruit tree images that were collected by the UAV under natural illumination conditions, there is a big difference in the luminance of the canopy in the shaded and non-shaded areas, leading to misclassification and omission of the canopy. Therefore, SRLCM is proposed to compensate for the luminance of shadow areas to reduce the contrast between the canopy in shadow and the non-shadow regions. The SRLCM uses the luminance histogram (L color channel representing luminance information in the Lab color space) of the foreground area as the target histogram. Then, histogram matching on the brightness histograms of the shadow area and the foreground area was performed to achieve the purpose of compensating the luminance of the shadow area. Where the foreground area is the canopy area that was obtained by the CIVE + Otsu method, the shaded area is the area of pixels in the entire image whose luminance value is less than the first decile. After SRLCM processing, the shadow area and the foreground area have the same luminance distribution, which reduces the contrast between the shadow and foreground area. The SRLCM algorithm only changes the luminance information of the shadow area. It does not change the a and b channels representing color information in the Lab color space, so the canopy and the background can still be distinguished by color.

3.2. Fruit Tree Image Segmentation Method Based on Ensemble OCC-K

The K-means clustering algorithm is an unsupervised real-time clustering algorithm that was proposed by Mac Queen in 1967 [49]. This algorithm has a faster convergence speed than other unsupervised learning algorithms. The Mini Batch is an improved algorithm for K-means [50,51]. The algorithm uses randomly selected sample subsets instead of all sample points to find the optimal solution. Therefore, this method significantly reduces the convergence time of the K-means algorithm, but the clustering effect is also slightly lower than the standard K-means algorithm. Ensemble clustering is an idea of combining the clustering results of multiple clustering algorithms through a consensus function [52]. Combining multiple clusters can obtain significantly superior generalization performance, higher robustness, and better clustering quality than a single clustering algorithm [53]. It has been shown that the ensemble is most effective when there is a specific difference between the results output by different cluster members [54].
Inspired by ensemble clustering and considering the algorithm response time and the segmentation quality, a fruit tree image segmentation method that is based on ensemble OCC-K (optimal color channel-K-means) is proposed in this study: (1) AOCC, POCC, ROCC, FOCC, and MOCC features are extracted from the image. (2) One standard K-means and four Mini Batch K-means are used to cluster the five features, respectively. (3) The result of the standard K-means output is used as the reference partition to re-label the partition of Mini Batch K-means, and then use voting to combine the results after re-labelling to get the final result. In the process of clustering an ensemble, the reference partition’s clustering quality significantly influences the final ensemble result [55]. As such, we use one standard K-means as the ensemble member and its output result as the reference partition. Using Mini Batch K-means as the ensemble member can reduce not only the computational cost of the algorithm but also increase the difference in the output results of different clustering algorithms.

3.2.1. Color Feature Extraction

To select the optimal color features for the fruit tree image segmentation task, we use the optimal color space selection method that was proposed by Hernández-Hernández et al. [31]. This method consists of the following steps: (1) Convert an image to a specific color space and get all the channels and channel combinations for that color space; (2) in each channel combination, foreground and background masks are created; (3) each pixel is classified into foreground or background based on a posteriori probability value using Bayes naïve classifier. (4) The optimal channel combinations from each color space were selected based on the minimum classification error (err). To improve the diversity of the features, we introduce three more evaluation indices (precision, recall, and F1-score) based on the original method and use 1-err (accuracy, A) instead of err as an evaluation indicator. Accuracy (A) is the percentage of correctly classified pixels to all pixels, which can measure the classification performance of the algorithm on pixels. Recall (R) is the percentage of canopy pixels that are extracted by the algorithm to all canopy pixels, which can measure the segmentation completeness. Precision (P) is the correctly extracted percentage of the canopy pixels with the segmentation method, indicating the segmentation accuracy. The F1-score (F1) value considers both the precision rate and the recall rate of the segmentation model. It is the harmonic mean of precision rate and recall rate. These four indicators can all evaluate the segmentation performance of the color channel, and their evaluation focuses are different., which ensures both the diversity of ensemble members’ outputs and the quality of their clusters. These indices are defined as follows:
P = T P T P + F P × 100 %
R = T P T P + F N × 100 %
F 1 = 2 P × R P + R × 100 %
A = T p + T N T P + F N + T N + F P × 100 %
where Tp is the number of pixels of the real canopy that are contained in the canopy that were extracted by the algorithm. Fp represents the number of pixels where the background is mistaken for the canopy. FN represents the number of pixels where the canopy is mistaken for the background in the segmentation result. TN represents the number of pixels of the real background that are contained in the background segmented by the algorithm.
In this study, ten standard color spaces were analyzed with all possible combinations of their channels. They are RGB, HSV, HSI, Lab, Luv, XYZ, YCrCb, YUV, I1I2I3, and TSL. All these color spaces are converted from RGB color spaces. Simultaneously, to ensure the ensemble members’ output diversity, AOCC, ROCC, POCC, FOCC, and MOCC should come from different channel combinations. MOCC features are preferentially selected and used as input to standard K-means to ensure the quality of reference partitions.

3.2.2. Clusters Initialization

In the K-means clustering algorithm, the effect of clustering largely depends on the number of clusters (K). An improper K-value may lead to over-segmentation or insufficient segmentation of the image. The Elbow method is a K-value selection algorithm that is based on the sum of squared errors (SSE) [56,57]. This method holds that when the K-value is less than the optimal cluster number, the increase of the K-value will lead to a sharp decline in SSE. When the K-value exceeds the optimal cluster number, SSE will no longer decrease significantly with the continuous increase of the K-value [58,59]. Therefore, the relationship between K and SSE is a broken line graph of elbow shape, and the K-value corresponding to the bending point in the graph is the optimal number of clusters. The SEE corresponding to the input of different K-values for the standard K-means in the ensemble members is calculated to choose the optimal K-value. The relationship between the K-value and SSE is shown in Figure 4. According to the picture, K = 5 is the bending point of the broken line graph. Therefore, we chose 5 as the number of clusters of ensemble members. In addition, Mini Batch K-means also needs to set the batch size, that is the number of samples that are drawn each time. Considering the algorithm response time and segmentation quality comprehensively, we take one-fifth of the number of image pixels as the batch size.

3.2.3. Combining Clustering Results

Plurality voting is a simple and efficient combination strategy that has proven effective for classifiers [60,61]. However, K-means clustering is an unsupervised method without any prior information that can be referenced. Therefore, K-means cannot output labels with semantic information, which leads to a problem of inconsistent cluster labels among partitions for ensemble member output. Therefore, the labels of each partition need to be unified before combining the clustering results. The general idea of cluster-label unification is as follows: taking cluster labels of the reference partition as the standard category labels, then matching the cluster-labels output by ensemble members with the standard category labels and re-labels the cluster labels based on matching results. Matching the cluster labels to the standard category labels is equivalent to a maximum weight bipartite matching problem [53]. This starts with creating a K × K (Where K is the number of clusters) contingency matrix between to be re-labeled partition πg and the reference partition πr. A contingency matrix contains entry Ω (l, l′) which denotes the co-occurrence statistics between label l ∈ πr and label l∈ πg. Each entry Ω (l, l) is defined by:
Ω ( l , l ) = x i X ω ( x i )
where ω ( x i ) = 1 if ( C r ( x i ) = l ) ( C g ( x i ) = l ) , otherwise ω ( x i ) = 0 , C r ( x i ) and C g ( x i ) represent the cluster-label of sample xi in a πr and πg partitions, respectively, and X represents the sample set. Having obtained the contingency matrix, the problem of label matching can be solved by maximization of the weight of complete bipartite matching:
max θ ( l , l ) l = 1 K l = 1 K Ω ( l , l ) θ ( l , l )
Subject   to   l = 1 K θ ( l , l ) = l = 1 K θ ( l , l ) = 1 , θ ( l , l ) { 0 , 1 }
where θ ( l , l ) represents correspondences amongst labels of partitions πr and πg, θ ( l , l ) = 1 if label l ∈ πr corresponds to l′ ∈ πg, otherwise θ ( l , l ) = 0 . This optimization problem can be solved using the Hungarian algorithm [62]. Figure 5 shows an example of cluster label unification, which covers the various steps of label unification.
After all the partitions are re-labeled, plurality voting can be used to combine the clustering results. Specifically, it counts the number of times that each data object is divided into different categories and marks each data object as the cluster label with the highest number of statistics.

3.2.4. Evaluation of Image Segmentation Methods

To validate the proposed method’s crown segmentation performance on fruit trees, this study compared it with the K-means clustering algorithm and GMM (Gaussian mixture model) algorithm, which were unsupervised image segmentation methods that are widely used for fruit crown segmentation [42,44,63]. AOCC, POCC, FOCC, MOCC, and ROCC are combined into a feature matrix M as the segmentation feature of K-means and GMM algorithms. P, R, and F1 are introduced to evaluate the segmentation results of fruit tree canopy images and take the manually segmented canopy image as the real canopy. The manual segmentation tool is Adobe Photoshop 2022. The specific steps are: select the lasso tool in Photoshop to draw the outline of the canopy and use the selected area as the foreground of the image, then select the fill function and set the color of the area outside the foreground to black.

4. Results and Discussion

4.1. Image Preprocessing Test Results

Figure 6 shows the results of preprocessing fruit tree images that were captured under different weather conditions using SRLCM., As shown in the figure, the contrast of the shaded and non-shaded areas in the image is significantly reduced after SRLCM processing compared to before SRLCM processing, and the color of the canopy and background is not changed. Therefore, we believe that the SRLCM algorithm can effectively compensate for the luminance of the shadow area.
To evaluate the effect of applying the SRLCM, we obtained R, G, and B channels of shaded and non-shaded canopy regions before and after SRLCM processing, as shown in the box plot in Figure 7. Figure 7a shows the R, G, and B components of a fruit tree image that was taken under sunny conditions. Before being processed by SRLCM, the gray average values of the R, G, and B channels in the shaded canopy area are 61, 65, and 56, respectively. The gray average values of the non-shaded canopy area are 101, 115, and 100, respectively. The grayscale differences between the shaded and non-shaded areas are 40, 50, and 44, respectively. After being processed by SRLCM, the gray average values of the R, G, and B channels in the shaded canopy area are 87, 91, and 82, respectively, and the gray average values of the non-shaded canopy area are 106, 120, and 105, respectively. The grayscale differences between shaded and non-shaded areas are 19, 28, and 23, respectively. Obviously, the grayscale difference of R, G, and B channels in shady and non-shaded canopy regions is significantly reduced after SRLCM processing. Similar results were seen in images of fruit trees that were taken on cloudy days (as shown in Figure 7b), in which the grayscale differences of R, G, and B channels in shaded and non-shaded canopy regions before and after SRLCM processing are 29, 32, 43 and 20, 23, 35, respectively. Therefore, we believe that the SRLCM algorithm can reduce the difference between shaded and non-shaded canopy regions, thereby reducing the difficulty of fruit tree canopy segmentation.

4.2. Results of Color Space Evaluation

Table 1 shows the accuracy rate (A), recall rate (R), precision rate (P), and F1-score (F1) of background/fruit tree canopy classification that was selected by different color spaces and channels. In the table, the number 1 represents the first color channel of the color model (such as the R channel of the RGB color model), and the number 12 represents the combination of the first l of the color model (such as the RG channel combination of RGB, and other numbers have the same meaning.

4.3. The Results of Image Segmentation Using the Proposed Method

After clustering is complete, the category label of each pixel is taken as the pixel value to form a grayscale image, as shown in Figure 8. The figure shows the whole process of combining of the clustering results. The first two lines in the figure show the results of each ensemble member clustering and the unified cluster labels. As seen from the figure, the segmentation results of the standard K-means have an obvious under-segmentation phenomenon, manifested in the mulch pixels that were mistakenly classified as a canopy, and the segmentation results of other ensemble members have an obvious over-segmentation phenomenon.
Figure 8g shows the result of combining the outputs of each ensemble member. As seen from the figure, the result of the combination effectively avoids the problems of the ensemble members. Specifically, there is no obvious over-segmentation and under-segmentation; the result of the combination is significantly better than the output of the ensemble members. Therefore, we believe that combining multiple clustering algorithms can dramatically improve the image segmentation quality. This result is similar to that of Navid et al. [64].

4.4. Image Segmentation Method Evaluation Results

The lighting environment on sunny and cloudy days are two representative natural lighting environments, which represent the lighting environment with direct sunlight and the lighting environment without direct sunlight, respectively. The ideal image segmentation algorithm should adapt to the changes of lighting environment. In this regard, we randomly select 30 images of fruit trees that were taken in sunny days and 30 images that were taken in cloudy days from the collected images as experimental samples to test the performance of the segmentation method. The segmentation results were binarized to evaluate the obtained canopy, and the artificially segmented canopy was used as a reference.
Figure 8 shows an example of image segmentation using the method that is proposed in this paper (the proposed method), K-means algorithm, and GMM algorithm, respectively. It can be seen from the figure that the common K-means and GMM image segmentation methods have obvious over-segmentation. It is because the difference in the pixel values between shaded and non-shaded canopy areas is significant, resulting in the canopy in shaded areas being misclassified as background. In addition, the fruit tree canopy is a porous medium, and the inter-leaf pores can also lead to over-segmentation. In contrast, the method that is proposed in this paper is significantly better than the comparison method. Specifically, the canopy pixels in the shadow area are entirely preserved, and the canopy contour is close to the manually segmented canopy. Obviously, the proposed method also cannot completely avoid the influence of canopy holes, but these tiny holes can be removed entirely by image post-processing methods (such as hole filling, morphological processing, etc.). Figure 9a,b show the segmentation results of the algorithm on fruit tree that were images taken under sunny and cloudy conditions, respectively. It can be seen from the figure that the change in illumination conditions has a more significant impact on the K-means method, while the GMM and the proposed method are less sensitive to illumination changes.
The same conclusion can also be reached when we compare these algorithms using indicators in image segmentation. Table 2 shows the results of the quantitative evaluation of different segmentation algorithms using P, R, and F1. Where the P of all the algorithms is relatively high, so it cannot be used as an effective indicator to compare the performance of each algorithm. According to Table 2, the K-means algorithm has all lower recall rates under two illumination conditions, 64.98%, and 75.84%, respectively, which indicates that the canopy integrity that was obtained by the K-means algorithm is low. In addition, changes in illumination conditions can significantly affect the recall rate and F1-score of K-means, which shows that the algorithm is not robust enough to illumination changes. The recall rates of the GMM algorithm in the two illumination conditions were 73.09% and 74.00%, respectively. Compared with the K-means algorithm, it is less affected by illumination changes, but its recall rate is still very low. In contrast, the method that is proposed in this paper has a higher recall rate under the two illumination conditions, 81.15%, and 87.75%, respectively. It shows that the canopy that was obtained in this paper has high integrity and is robust to changes in illumination conditions. In addition, the proposed method’s average F1 and recall rates are 8.75% and 12.54% higher than the K-means algorithm, respectively; and 6.9% and 10.9% higher than the GMM algorithm, respectively. In a word, it can be considered that the segmentation quality of the proposed method is significantly better than the common K-means and GMM algorithms.
Table 2 also shows the response time of each algorithm. It is worth noting that the response time that is shown in the table is only used for comparison, and the algorithm can be very fast if the computer’s performance is higher or the picture is smaller. According to Table 2, the response time of the proposed algorithm is slightly higher than that of the K-means algorithm and significantly lower than that of the GMM algorithm.

5. Conclusions

This paper proposes an unsupervised method for canopy segmentation of fruit trees, and segmentation experiments are carried out. The following conclusions are drawn based on the test results: (1) SRLCM can effectively reduce the difference between shaded and unshaded canopy regions, thus reducing the difficulty of segmentation. (2) Combining multiple clustering algorithms can significantly improve the quality of image segmentation. (3) Compared with commonly used unsupervised methods, the method that is proposed in this paper has the highest average P, R, and F1-score, which are 95.30%, 84.45%, and 89.53%, respectively. The average F1-score and recall rates are 8.75% and 12.54% higher than the K-means algorithm, respectively, and 6.9% and 10.9% higher than the GMM algorithm, respectively. The response time of the proposed algorithm is slightly higher than that of the K-means algorithm and significantly lower than that of the GMM algorithm. (4) The research in this paper also proves that computer vision technology has great application potential in agriculture. The algorithm that is proposed in this paper can provide a reference for the application of computer vision technology in agriculture.

Author Contributions

Conceptualization, Z.L.; methodology, Z.L. and H.Z.; software, Z.L.; validation, Z.L., H.Z. and J.Z; formal analysis, L.Q.; investigation, Z.L. and J.Z.; resources, L.Q.; data curation, J.Z.; writing—original draft preparation, Z.L.; writing—review and editing, L.Q. and J.W.; visualization, Z.L.; supervision, L.Q.; project administration, L.Q.; funding acquisition, L.Q. All authors have read and agreed to the published version of the manuscript.

Funding

This research was funded by the National Key Research and Development Plan of China (grant numbers 2017YFD0701400 and 2016YFD0200700).

Institutional Review Board Statement

Not applicable.

Data Availability Statement

Not applicable.

Acknowledgments

The authors would like to thank the financial support provided by the National Key Research and Development Plan of China, and Jialin Liu for providing information about the experimental site for this work.

Conflicts of Interest

The authors declare no conflict of interest.

References

  1. Lan, Y.; Thomson, S.J.; Huang, Y.; Hoffmann, W.C.; Zhang, H. Current status and future directions of precision aerial application for site-specific crop management in the USA. Comput. Electron. Agric. 2010, 74, 34–38. [Google Scholar] [CrossRef] [Green Version]
  2. Zhang, B.; Changyuan, Z.; Hanzhe, L.; Shuo, Y. Development status Analysis of Precision Pesticide Application Techniques and Equipments. J. Agric. Mech. Res. 2016, 38, 1–5. [Google Scholar] [CrossRef]
  3. Yongjun, Z.; Bingtai, C.; Lyu, H. Research progress of orchard plant protection mechanization technology and equipment in China. Transactions of the Chinese Society of Agricultural Engineering. Trans. Chin. Soc. Agric. Eng. 2020, 36, 110–124. [Google Scholar] [CrossRef]
  4. Rosell, J.R.; Sanz, R. A review of methods and applications of the geometric characterization of tree crops in agricultural activities. Comput. Electron. Agric. 2011, 81, 124–141. [Google Scholar] [CrossRef] [Green Version]
  5. Yandun, N.F.; Reina, G.; Torres, T.M.; Kantor, G.; Cheein, F.A. A Survey of Ranging and Imaging Techniques for Precision Agriculture Phenotyping. IEEE/ASME Trans. Mechatron. 2017, 22, 2428–2439. [Google Scholar] [CrossRef]
  6. Csillik, O.; Cherbini, J.; Johnson, R.; Lyons, A.; Kelly, M. Identification of Citrus Trees from Unmanned Aerial Vehicle Imagery Using Convolutional Neural Networks. Drones 2018, 2, 39. [Google Scholar] [CrossRef] [Green Version]
  7. Malambo, L.; Popescu, S.C.; Murray, S.C.; Putman, E.; Pugh, N.A.; Horne, D.W.; Richardson, G.; Sheridan, R.; Rooney, W.L.; Avant, R.; et al. Multitemporal field-based plant height estimation using 3D point clouds generated from small unmanned aerial systems high-resolution imagery. Int. J. Appl. Earth Obs. Geoinf. 2018, 64, 31–42. [Google Scholar] [CrossRef]
  8. Marília, F.G.; Philippe, M.; Huawu, D. Individual tree crown detection in sub-meter satellite imagery using Marked Point Processes and a geometrical-optical model. Remote Sens. Environ. 2018, 211, 184–195. [Google Scholar] [CrossRef]
  9. Dameng, Y.; Wang, L. Individual mangrove tree measurement using UAV-based LiDAR data: Possibilities and challenges. Remote Sens. Environ. 2019, 223, 34–39. [Google Scholar] [CrossRef]
  10. Jintao, W.; Guijun, Y.; Hao, Y.; Yaohui, Z.; Zhenhai, L.; Lei, L.; Chunjiang, Z. Extracting apple tree crown information from remote imagery using deep learning. Comput. Electron. Agric. 2020, 174, 105504. [Google Scholar] [CrossRef]
  11. McCarthy, C.L.; Hancock, N.H.; Raine, S.R. Applied machine vision of plants: A review with implications for field deployment in automated farming operations. Intell. Serv. Robot. 2010, 3, 209–217. [Google Scholar] [CrossRef] [Green Version]
  12. Recio, J.; Hermosilla, T.; Ruiz, L.; Palomar, J. Automated extraction of tree and plot-based parameters in citrus orchards from aerial images. Comput. Electron. Agric. 2013, 9, 24–34. [Google Scholar] [CrossRef]
  13. Lin, K.; Chen, J.; Si, H.; Wu, J. A Review on Computer Vision Technologies Applied in Greenhouse Plant Stress Detection. Commun. Comput. Inf. Sci. 2013, 363, 192–200. [Google Scholar] [CrossRef]
  14. Story, D.; Kacira, M.; Kubota, C.; Akoglu, A.; An, L. Lettuce calcium deficiency detection with machine vision computed plant features in controlled environments. Comput. Electron. Agric. 2010, 74, 238–243. [Google Scholar] [CrossRef]
  15. Zhang, Z.; Luo, X.; Zang, Y.; Hou, F.; Xu, X. Segmentation algorithm based on color feature for green crop plants. Trans. CSAE 2011, 27, 183–189. [Google Scholar] [CrossRef]
  16. Lu, Y.; Young, S.; Wang, H.; Wijewardane, N. Robust plant segmentation of color images based on image contrast optimization. Comput. Electron. Agric. 2022, 193, 106711. [Google Scholar] [CrossRef]
  17. Hongbo, Y.; Nudong, Z.; Man, C. Review of Weeds Recognition Based on Image Processing. Trans. Chin. Soc. Agric. Mach. 2020, 51, 323–334. [Google Scholar] [CrossRef]
  18. Hamuda, E.; Glavin, M.; Jones, E. A survey of image processing techniques for plant extraction and segmentation in the field. Comput. Electron. Agric. 2016, 125, 184–199. [Google Scholar] [CrossRef]
  19. Woebbecke, D.M.; Meyer, G.E.; Von Bargen, K.; Mortensen, D.A. Color Indices for Weed Identification Under Various Soil, Residue, and Lighting Conditions. Trans. ASAE 1995, 38, 259–269. [Google Scholar] [CrossRef]
  20. Guerrero, J.M.; Pajares, G.; Montalvo, M.; Romeo, J.; Guijarro, M. Support Vector Machines for crop/weeds identification in maize fields. Expert Syst. Appl. 2012, 39, 11149–11155. [Google Scholar] [CrossRef]
  21. Burgos-Artizzu, X.P.; Ribeiro, A.; Guijarro, M.; Pajares, G. Real-time image processing for crop/weed discrimination in maize fields. Comput. Electron. Agric. 2010, 75, 337–346. [Google Scholar] [CrossRef] [Green Version]
  22. Cheng, H.D.; Jiang, X.H.; Sun, Y.; Wang, J. Color image segmentation: Advances and prospects. Pattern Recognit. 2001, 34, 2259–2281. [Google Scholar] [CrossRef]
  23. Yu, Z.; Li, C.; Shi, G. Environmentally adaptive crop extraction for agricultural automation using super-pixel and LAB Gaussian model. Recognit. Comput. Vis. 2018, 10609, 255–260. [Google Scholar] [CrossRef]
  24. Sabzi, S.; Abbaspour-Gilandeh, Y.; García-Mateos, G. A fast and accurate expert system for weed identification in potato crops using metaheuristic algorithms. Comput. Ind. 2018, 98, 80–89. [Google Scholar] [CrossRef]
  25. Huajian, L.; Lee, S.H.; Saunders, C. Development of a machine vision system for weed detection during both off-season and in-season in broadacre no-tillage cropping lands. Am. J. Agric. Biol. Sci. 2014, 9, 174–193. [Google Scholar] [CrossRef] [Green Version]
  26. Yaxiao, N.; Liyuan, Z.; Wenting, H. Extraction Methods of Cotton Coverage Based on Lab Color Space. Trans. Chin. Soc. Agric. 2018, 49, 240–249. [Google Scholar] [CrossRef]
  27. Zhai, R.; Fang, Y.; Lin, C.; Peng, H.; Liu, S.; Jun, L. Segmentation of field rapeseed plant image based on Gaussian HI color algorithm. Trans. Chin. Soc. Agric. Eng. 2016, 32, 142–147. [Google Scholar] [CrossRef]
  28. Sadeghi-Tehran, P.; Virlet, N.; Sabermanesh, K.; Hawkesford, M.J. Multi-feature machine learning model for automatic segmentation of green fractional vegetation cover for high-throughput field phenotyping. Plant Methods 2017, 13, 1–16. [Google Scholar] [CrossRef] [Green Version]
  29. García-Mateos, G.; Hernández-Hernández, J.; Escarabajal-Henarejos, D.; Jaén-Terrones, S.; Molina-Martínez, J. Study and comparison of color models for automatic image analysis in irrigation management applications. Agric. Water Manag. 2015, 151, 158–166. [Google Scholar] [CrossRef]
  30. Jothiaruna, N.; Sundar, K.J.A.; Karthikeyan, B. A segmentation method for disease spot images incorporating chrominance in Comprehensive Color Feature and Region Growing. Comput. Electron. Agric. 2019, 165, 104934. [Google Scholar] [CrossRef]
  31. Hernández-Hernández, J.L.; García-Mateos, G.; González-Esquiva, J.M.; Escarabajal-Henarejos, D.; Ruiz-Canales, A.; Molina-Martínez, J.M. Optimal color space selection method for plant/soil segmentation in agriculture. Comput. Electron. Agric. 2016, 122, 124–132. [Google Scholar] [CrossRef]
  32. Abdalla, A.; Haiyan, C.H.; El-Manawy, A.; Yong, H. Infield oilseed rape images segmentation via improved unsupervised learning models combined with supreme color features. Comput. Electron. Agric. 2019, 162, 1057–1068. [Google Scholar] [CrossRef]
  33. Yingli, C.; Yadi, L.; Dianrong, M.; Ang, L.; Tongyu, X. Best Subset Selection Based Rice Panicle Segmentation from UAV Image. Trans. Chin. Soc. Agric. Mach. 2020, 51, 171–177. [Google Scholar] [CrossRef]
  34. Wang, A.; Zhang, W.; Wei, X. A review on weed detection using ground-based machine vision and image processing techniques. Comput. Electron. Agric. 2019, 158, 226–240. [Google Scholar] [CrossRef]
  35. Huanli, W.; Kewang, C.; Xin, Z.; Xuzhang, X.; Wengang, Z.; Yan, W. Improving Accuracy of Fine Leaf Crop Coverage by Improved K-means Algorithm. Trans. Chin. Soc. Agric. Mach. 2019, 50, 42–50. [Google Scholar] [CrossRef]
  36. Jun, Z.; Jinrong, Z.; Mingjun, W. Pear Orchard Scene Segmentation Based on Conditional Random Fields. Trans. Chin. Soc. Agric. Mach. 2015, 46, 8–13. [Google Scholar] [CrossRef]
  37. Reza, M.N.; Na, I.S.; Baek, S.W.; Lee, K.-H. Rice yield estimation based on K-means clustering with graph-cut segmentation using low-altitude UAV images. Biosyst. Eng. 2018, 177, 109–121. [Google Scholar] [CrossRef]
  38. Tong, P.; Han, P.; Li, S.; Li, N.; Bu, S.; Li, Q.; Li, K. Counting trees with point-wise supervised segmentation network. Eng. Appl. Artif. Intell. 2021, 100, 104172. [Google Scholar] [CrossRef]
  39. Guo, W.; Rage, U.K.; Ninomiya, S. Illumination invariant segmentation of vegetation for time series wheat images based on decision tree model. Comput. Electron. Agric. 2013, 96, 58–66. [Google Scholar] [CrossRef]
  40. Chen, Y.; Hou, C.; Tang, Y.; Zhuang, J.; Lin, J.; He, Y.; Guo, Q.; Zhong, Z.; Lei, H.; Luo, S. Citrus Tree Segmentation from UAV Images Based on Monocular Machine Vision in a Natural Orchard Environment. Sensors 2019, 19, 5558. [Google Scholar] [CrossRef] [Green Version]
  41. Moe, K.T.; Owari, T.; Furuya, N.; Hiroshima, T.; Morimoto, J. Application of UAV Photogrammetry with LiDAR Data to Facilitate the Estimation of Tree Locations and DBH Values for High-Value Timber Species in Northern Japanese Mixed-Wood Forests. Remote Sens. 2020, 12, 2865. [Google Scholar] [CrossRef]
  42. Cheng, Z.; Qi, L.; Cheng, Y. Cherry Tree Crown Extraction from Natural Orchard Images with Complex Backgrounds. Agriculture 2021, 11, 431. [Google Scholar] [CrossRef]
  43. Lu, Y.; Young, S. A survey of public datasets for computer vision tasks in precision agriculture. Comput. Electron. Agric. 2020, 178, 105760. [Google Scholar] [CrossRef]
  44. Yingli, C.; Mingtong, L.; Zhonghui, G.; Wen, X.; Dianrong, M.; Tongyu, X. Unsupervised GMM for Rice Segmentation with UAV Images Based on Lab Color Space. Trans. Chin. Soc. Agric. Mach. 2021, 52, 162–169. [Google Scholar] [CrossRef]
  45. Zhenzhen, C.; Lijun, Q.; Yifan, C.; Yalei, W.; Hao, Z.; Yu, X. Fruit Tree Canopy Image Segmentation Method Based on M-LP Features Weighted Clustering. Trans. Chin. Soc. Agric. 2020, 51, 191–198. [Google Scholar] [CrossRef]
  46. Jing-jing, G.; Qing-wu, L.; Hai-su, C.; Chun-chun, Q. Segmentation algorithm of tree image based on L ab color-distance and GMM. Inf. Technol. 2016, 40, 1–4. [Google Scholar] [CrossRef]
  47. Bradski, G. The OpenCV Library. Dr. Dobbs J. Softw. Tools 2000, 25, 122–125. [Google Scholar]
  48. Pedregosa, F.; Varoquaux, G.; Gramfort, A.; Michel, V.; Thirion, B.; Grisel, O.; Blondel, M.; Prettenhofer, P.; Weiss, R.; Dubourg, V.; et al. Scikit-learn: Machine learning in python. J. Mach. Learn. Res. 2011, 12, 2825–2830. [Google Scholar] [CrossRef]
  49. Selim, S.Z.; Ismail, M.A. K-means-type algorithms: A generalized convergence theorem and characterization of local optimality. IEEE Trans. Pami 1984, 6, 81–87. [Google Scholar] [CrossRef]
  50. Huijun, X.; Zhong, W.; Liping, M.; Hua, R.; En, H.C. Improved Mini Batch K-Means Time-weighted Recommendation Algorithm. Comput. Eng. 2020, 46, 73–78. [Google Scholar] [CrossRef]
  51. Yingchang, X.; Wenjing, Y. Application of Mini Batch K-means Algorithm in Remote Sensing Data Classification. Ludong Univ. J. Sci. Ed. 2017, 33, 359–363. [Google Scholar] [CrossRef]
  52. Boongoen, T.; Iam-On, N. Cluster ensembles: A survey of approaches with recent extensions and applications. Comput. Sci. Rev. 2018, 28, 1–25. [Google Scholar] [CrossRef]
  53. Strehl, A.; Ghosh, J. Cluster Ensembles—A Knowledge Reuse Framework for Combining Multiple Partitions. Mach. Learn. Res. 2002, 3, 583–617. [Google Scholar] [CrossRef]
  54. Kittler, J.; Hatef, M. On combining classifiers. IEEE Trans. Pattern Anal. 1998, 20, 226–239. [Google Scholar] [CrossRef] [Green Version]
  55. Topchy, A.P.; Law, M.H.C.; Jain, A.K.; Fred, A.L. Analysis of consensus partition in cluster ensemble. In Proceedings of the Fourth IEEE International Conference on Data Mining (ICDM’04), Brighton, UK, 1–4 November 2004; pp. 225–232. [Google Scholar] [CrossRef]
  56. Wang, J.; Ma, X.; DUAN, G. Improved K-means clustering k-value selection algorithm. Comput. Eng. Appl. 2019, 55, 27–33. [Google Scholar] [CrossRef]
  57. Wenjia, L.; Xiaofeng, Z.; Lian, Z. Business Process Clustering Method Based on k-means and Elbow Method. J. Jianghan Univ. 2020, 48, 81–90. [Google Scholar] [CrossRef]
  58. Yingji, W.; Hongbin, D. Determination of the number of classes based on density peak and elbow method. Appl. Sci. Technol. 2021, 48, 74–79. [Google Scholar] [CrossRef]
  59. Wu, G.; Zhang, J.; Yuan, D. Automatically Obtaining K Value Based on K-means Elbow Method. Comput. Eng. 2019, 40, 167–170. [Google Scholar] [CrossRef]
  60. Bauer, E.; Kohavi, R. An empirical comparison of voting classification algorithms: Bagging, boosting, and variants. Mach. Learn. 1999, 36, 105–139. [Google Scholar] [CrossRef]
  61. Lam, L.; Suen, C.Y. Application of majority voting to pattern recognition: An analysis of its behavior and performance. IEEE Trans. Syst. 1997, 22, 553–568. [Google Scholar] [CrossRef] [Green Version]
  62. Munkres, J. Algorithms for the assignment and transportation problems. SIAM 1957, 5, 32–38. [Google Scholar] [CrossRef] [Green Version]
  63. Lijun, Q.; Yifan, C.; Zhenzhen, C.; Zhilun, Y.; Yalei, W.; Luzhen, G. Estimation of Upper and Lower Canopy Volume Ratio of Fruit Trees Based on M-K Clustering. Trans. Chin. Soc. Agric. 2018, 49, 57–64. [Google Scholar] [CrossRef]
  64. Nikbakhsh, N.; Baleghi, Y.; Agahi, H. Maximum mutual information and Tsallis entropy for unsupervised segmentation of tree leaves in natural scenes. Comput. Electron. Agric. 2019, 162, 440–449. [Google Scholar] [CrossRef]
Figure 1. Test site and illustrations of the images under different lighting conditions: (a) test area in Taian, Shandong, China, (b) cloudy day without direct solar illumination, and (c) sunny day, with direct solar illumination.
Agriculture 12 01039 g001
Figure 2. Image acquisition: (a) the image acquisition platform (DJI Phantom 3 four-axis aerial photography aircraft); (b) the unmanned aerial vehicle (UAV) flight route.
Agriculture 12 01039 g002
Figure 3. Flowchart of the proposed method. Where AOCC is the color channel with the highest accuracy value, POCC is the color channel with the highest precision value, ROCC is the color channel with the highest recall value, FOCC is the color channel with the highest F1 value, and MOCC is the color channel with the highest mean value of above four indicators.
Agriculture 12 01039 g003
Figure 4. Relationship between K-value and SSE of standard K-means, showing that when the K < 5, the increase of the K-value will lead to a sharp decline in SSE, when the K > 5, SSE will no longer decrease significantly with the continuous increase of the K-value.
Agriculture 12 01039 g004
Figure 5. An example of cluster label unification. (a) To be re-labeled partition πg and the reference partition πr; (b) contingency matrix, and (c) the corresponding weighted bipartite graph (where maximum matchings are identified as bold edges); and (d) partition πg after re-labeling.
Agriculture 12 01039 g005
Figure 6. Results of image preprocessing using the shadow region luminance compensation method (SRLCM) algorithm. (a) Images of fruit trees that were taken under sunny conditions; (b) images of fruit trees that were taken under cloudy conditions.
Agriculture 12 01039 g006
Figure 7. Gray mean of R, G, and B channels in the canopy regions before and after the shadow region luminance compensation method (SRLCM). (a) Images of fruit trees that were taken under sunny conditions with direct solar illumination, and (b) images of fruit trees that were taken under cloudy conditions without direct solar illumination.
Agriculture 12 01039 g007
Figure 8. One test image and the result of image segmentation. (a) The output of standard k-means; (be) The output of four Mini Batch K-means whose input from left to right are AOCC, POCC, ROCC, and FOCC. Where AOCC is the color channel with the highest accuracy value, POCC is the color channel with the highest precision value, ROCC is the color channel with the highest recall value, FOCC is the color channel with the highest F1 value, and MOCC is the color channel with the highest mean value of above four indicators. (f) Original image; (g) the result of combining the partitions using the plurality voting strategy.
Agriculture 12 01039 g008aAgriculture 12 01039 g008b
Figure 9. Comparison of the different segmentation results: (a) sunny day with direct solar illumination; and (b) cloudy day without direct solar illumination.
Agriculture 12 01039 g009
Table 1. Recall rate ®, precision rate (P), accuracy rate (A), and F1-score (F1) of background/fruit tree canopy classification that was selected by different color spaces and channels, in%.
ChannelsIndicatorsRGBHSVLabHSIXYZLuvYCrCbYUVI1I2I3TSL
1R68.2685.2764.0464.2164.8064.1264.0364.0163.9074.76
P79.1587.8368.6652.3973.4971.9371.9468.7872.1080.40
A72.6784.0466.8763.5968.5267.5867.5666.8867.4777.84
F73.3086.5366.2757.7068.8767.8067.7566.3167.7577.48
2R62.1150.5979.5156.5163.5481.0267.8682.0478.0765.36
P67.9431.1084.5929.5170.6784.0970.8488.8276.5174.80
A65.1652.9482.3655.8466.8783.1270.2885.4778.6869.23
F64.8938.5281.9738.7866.9282.5369.3285.3077.2869.76
3R60.0664.4967.6063.9160.5968.3382.6464.6670.8263.95
P65.4673.6378.7972.1266.1772.3787.8972.4975.8072.20
A62.9868.2772.0467.4863.5571.0083.4168.1773.7167.53
F62.6568.7672.7767.7763.2670.2985.1868.3573.2267.83
12R66.3184.8480.2063.1664.2479.3572.4380.3477.1274.99
P75.3387.9786.8753.1172.2685.9076.8789.9882.0180.03
A70.1586.8683.6063.0567.7582.7275.1784.8079.9277.89
F70.5386.3883.4057.7068.0182.4974.5984.8879.4977.43
13R66.1282.3271.7965.2863.2672.5679.4069.8574.3474.85
P75.2084.1675.2774.6470.7577.0085.8772.4281.6878.74
A69.9883.9374.2769.1566.6775.2882.7472.1077.9577.37
F70.3783.2373.4969.6566.8074.7282.5171.1177.8476.74
23R61.0864.1883.0763.3062.2882.9880.9881.7580.6764.78
P66.9373.0986.0169.3968.8183.3583.5288.1780.8773.37
A64.1067.8985.0666.4265.4582.8282.8985.0681.7368.47
F63.8768.3484.5266.2165.3883.1682.2384.8480.7768.80
123R64.9982.0882.1964.5963.3879.5879.5780.0879.0771.91
P73.1583.7987.6671.8770.7584.9785.3288.9084.1277.16
A68.6183.6485.0567.9866.7482.5282.6584.2681.9374.89
F68.8382.9384.8368.0466.8782.1982.3584.2681.5274.44
According to the table that the top color channels in index F1 are H (in HSV), HS (in HSV), U (in YUV), CrCb (in YCrCb), YU (in YUV), and Lab in turn; the top color channels in index A are HS (in HSV), U (in YUV), ab (in Lab), Lab, UV (in YUV), and YU (in YUV) in turn; the top color channels in index P are YUV (YUV), U (YUV), UV (YUV), HS (in HSV), CrCb (in YCrCb) in turn and the top color channels in index R, are H (in HSV), HS (in HSV), ab (in Lab), UV (in Luv), Lab, and HSV in turn. According to the evaluation results, HS (in HSV) was selected as the MOCC, H (in HSV) was selected as the FOCC, U (in YUV) was selected as the AOCC, YU (in YUV) was selected as the POCC, and ab (in Lab) was selected as the ROCC, which were marked in bold in the table.
Table 2. Comparison of the evaluation indicators (P, R, F1) of different segmentation algorithms.
AlgorithmWeatherPMeans of PRMeans of RF1Means of F1Time
K-meanssunny93.05%95.17%64.98%71.91%76.52%80.78%7.1 s
cloudy96.84%75.83%85.05%
GMMsunny93.35%94.56%73.09%73.55%81.98%82.63%51.4 s
cloudy95.76%74.00%83.27%
The proposed methodsunny94.29%95.30%81.15%84.45%87.22%89.53%7.9 s
cloudy96.31%87.75%91.83%
Publisher’s Note: MDPI stays neutral with regard to jurisdictional claims in published maps and institutional affiliations.

