
AUTS: A Novel Approach to Mapping Winter Wheat by Automatically Updating Training Samples Based on NDVI Time Series

 , ,
, ,
Abstract
:1. Introduction
2. Materials
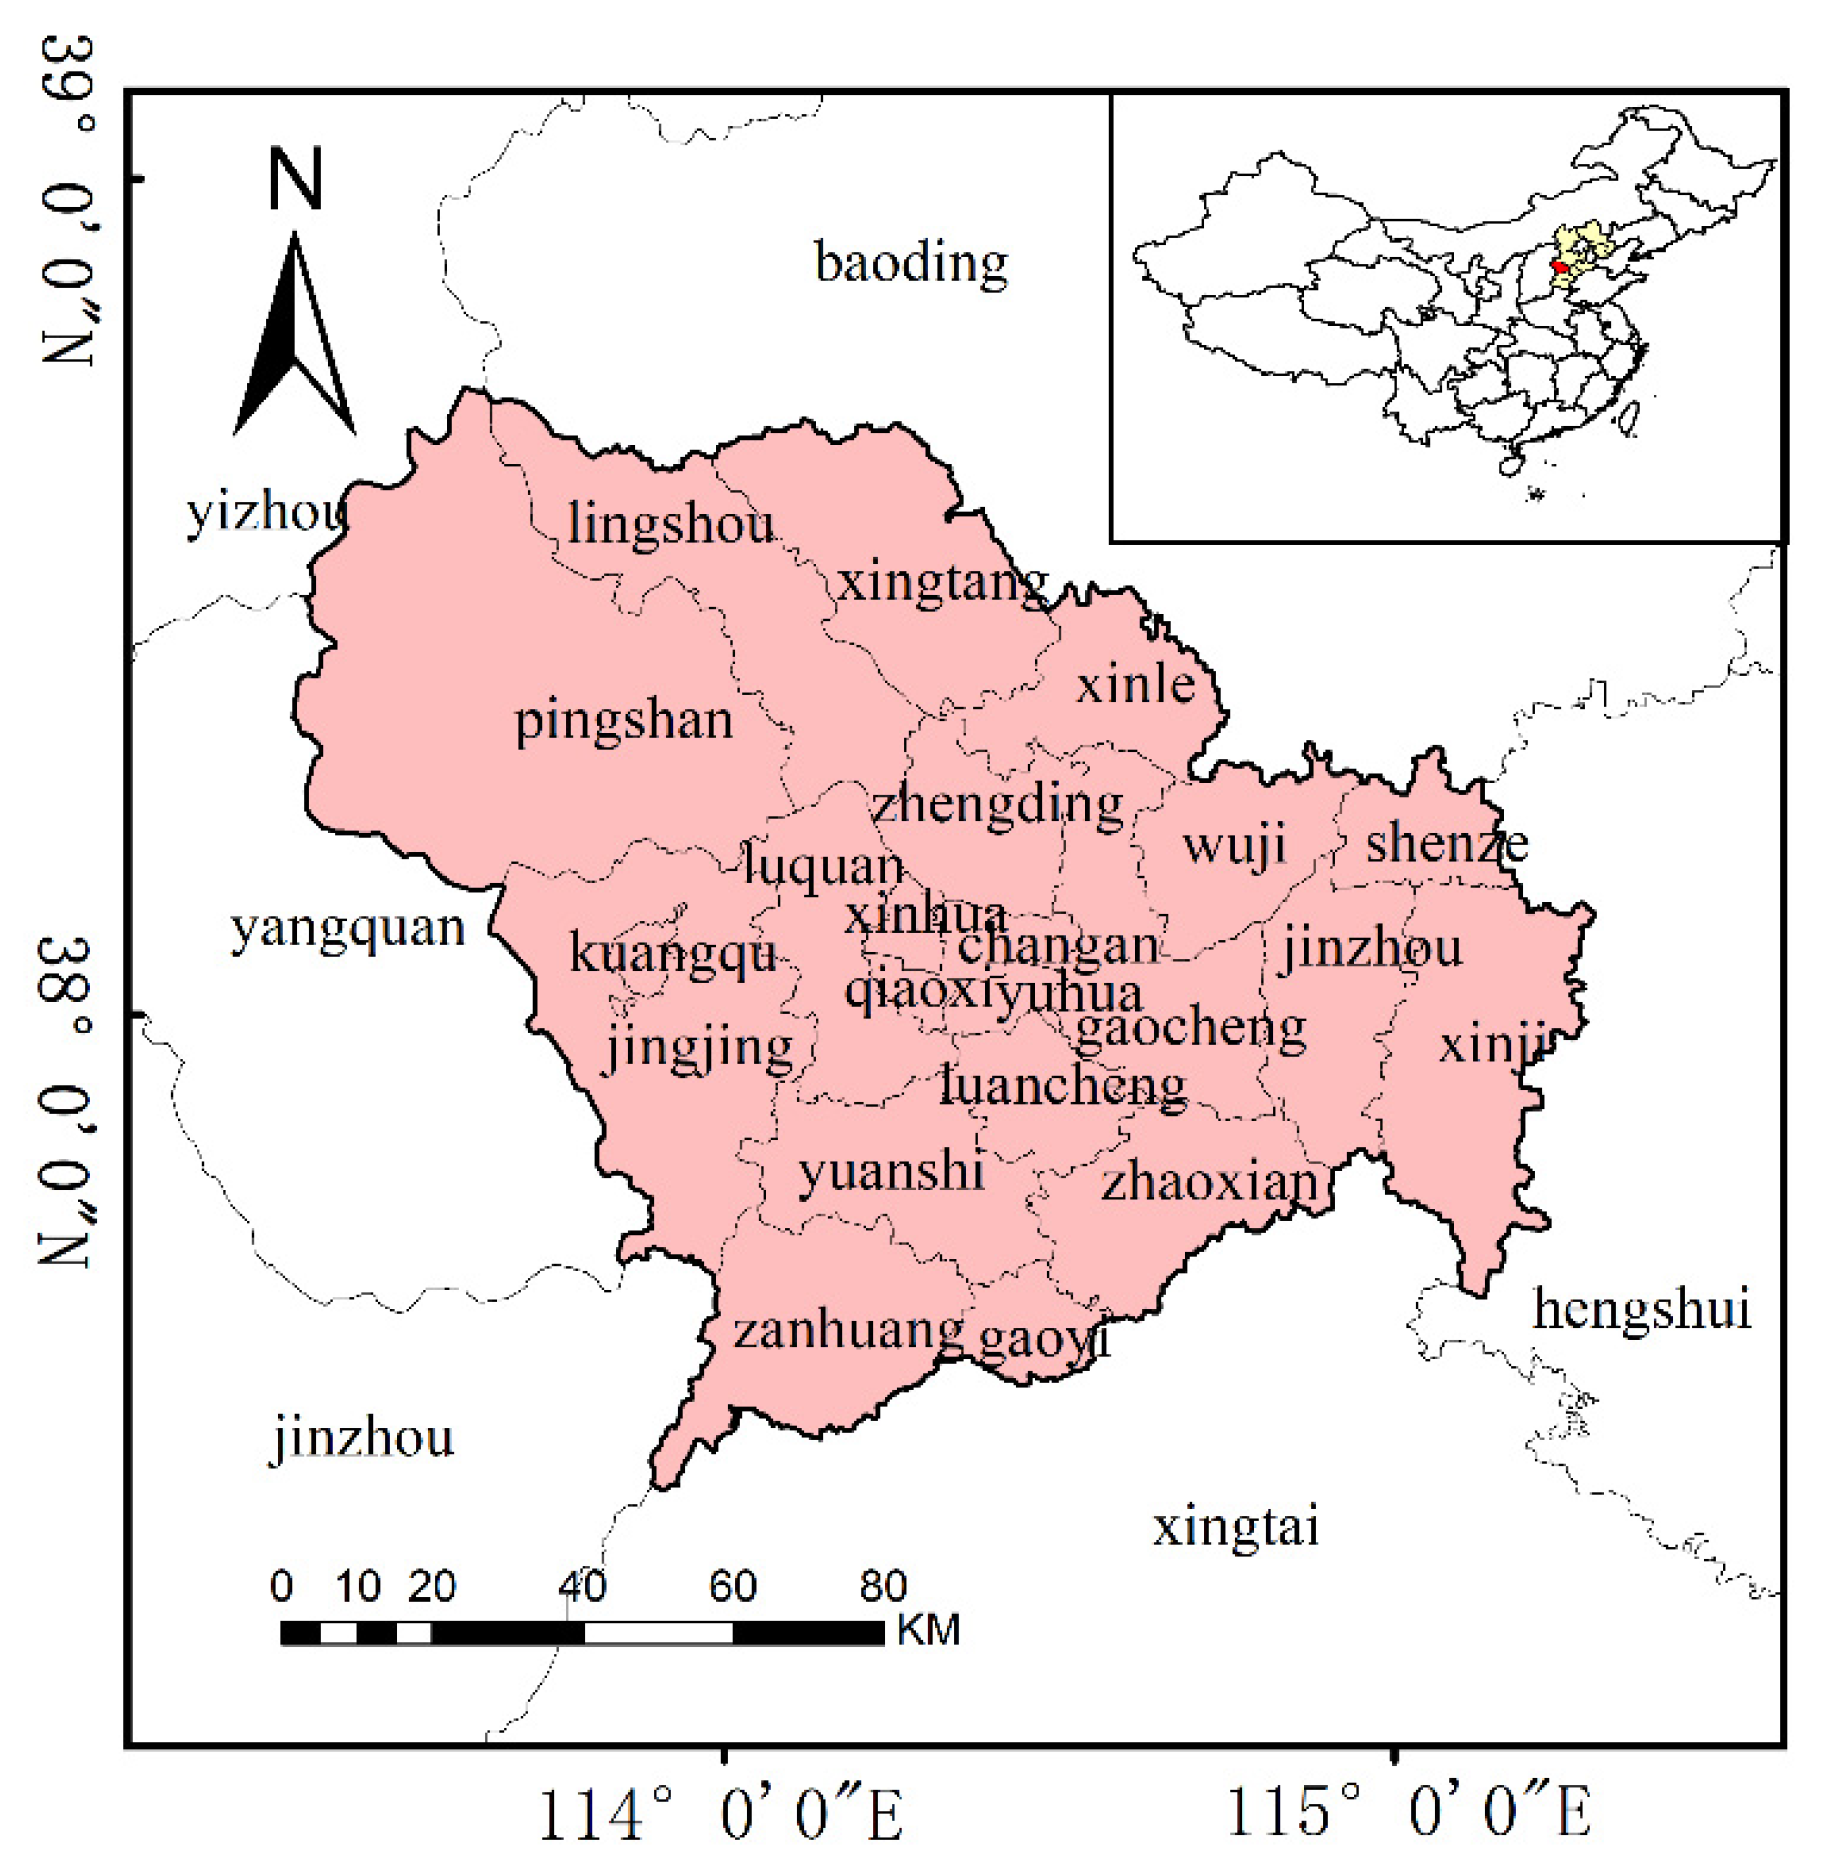
2.1. Study Area
2.2. Data Sources
3. Methodology
3.1. Remote Sensing Image Pre-Processing
3.2. Established Shijiazhuang 2017 Sample Set
3.3. NDVI Time Series Feature Construction
3.3.1. NDVI time series
3.3.2. Mean filtering
3.4. Random Forest Classification Algorithm
3.5. AUTS
4. Results
4.1. The Quality of The Updated Training Samples
4.1.1. The NDVI Time Series Curve for The Sample Points

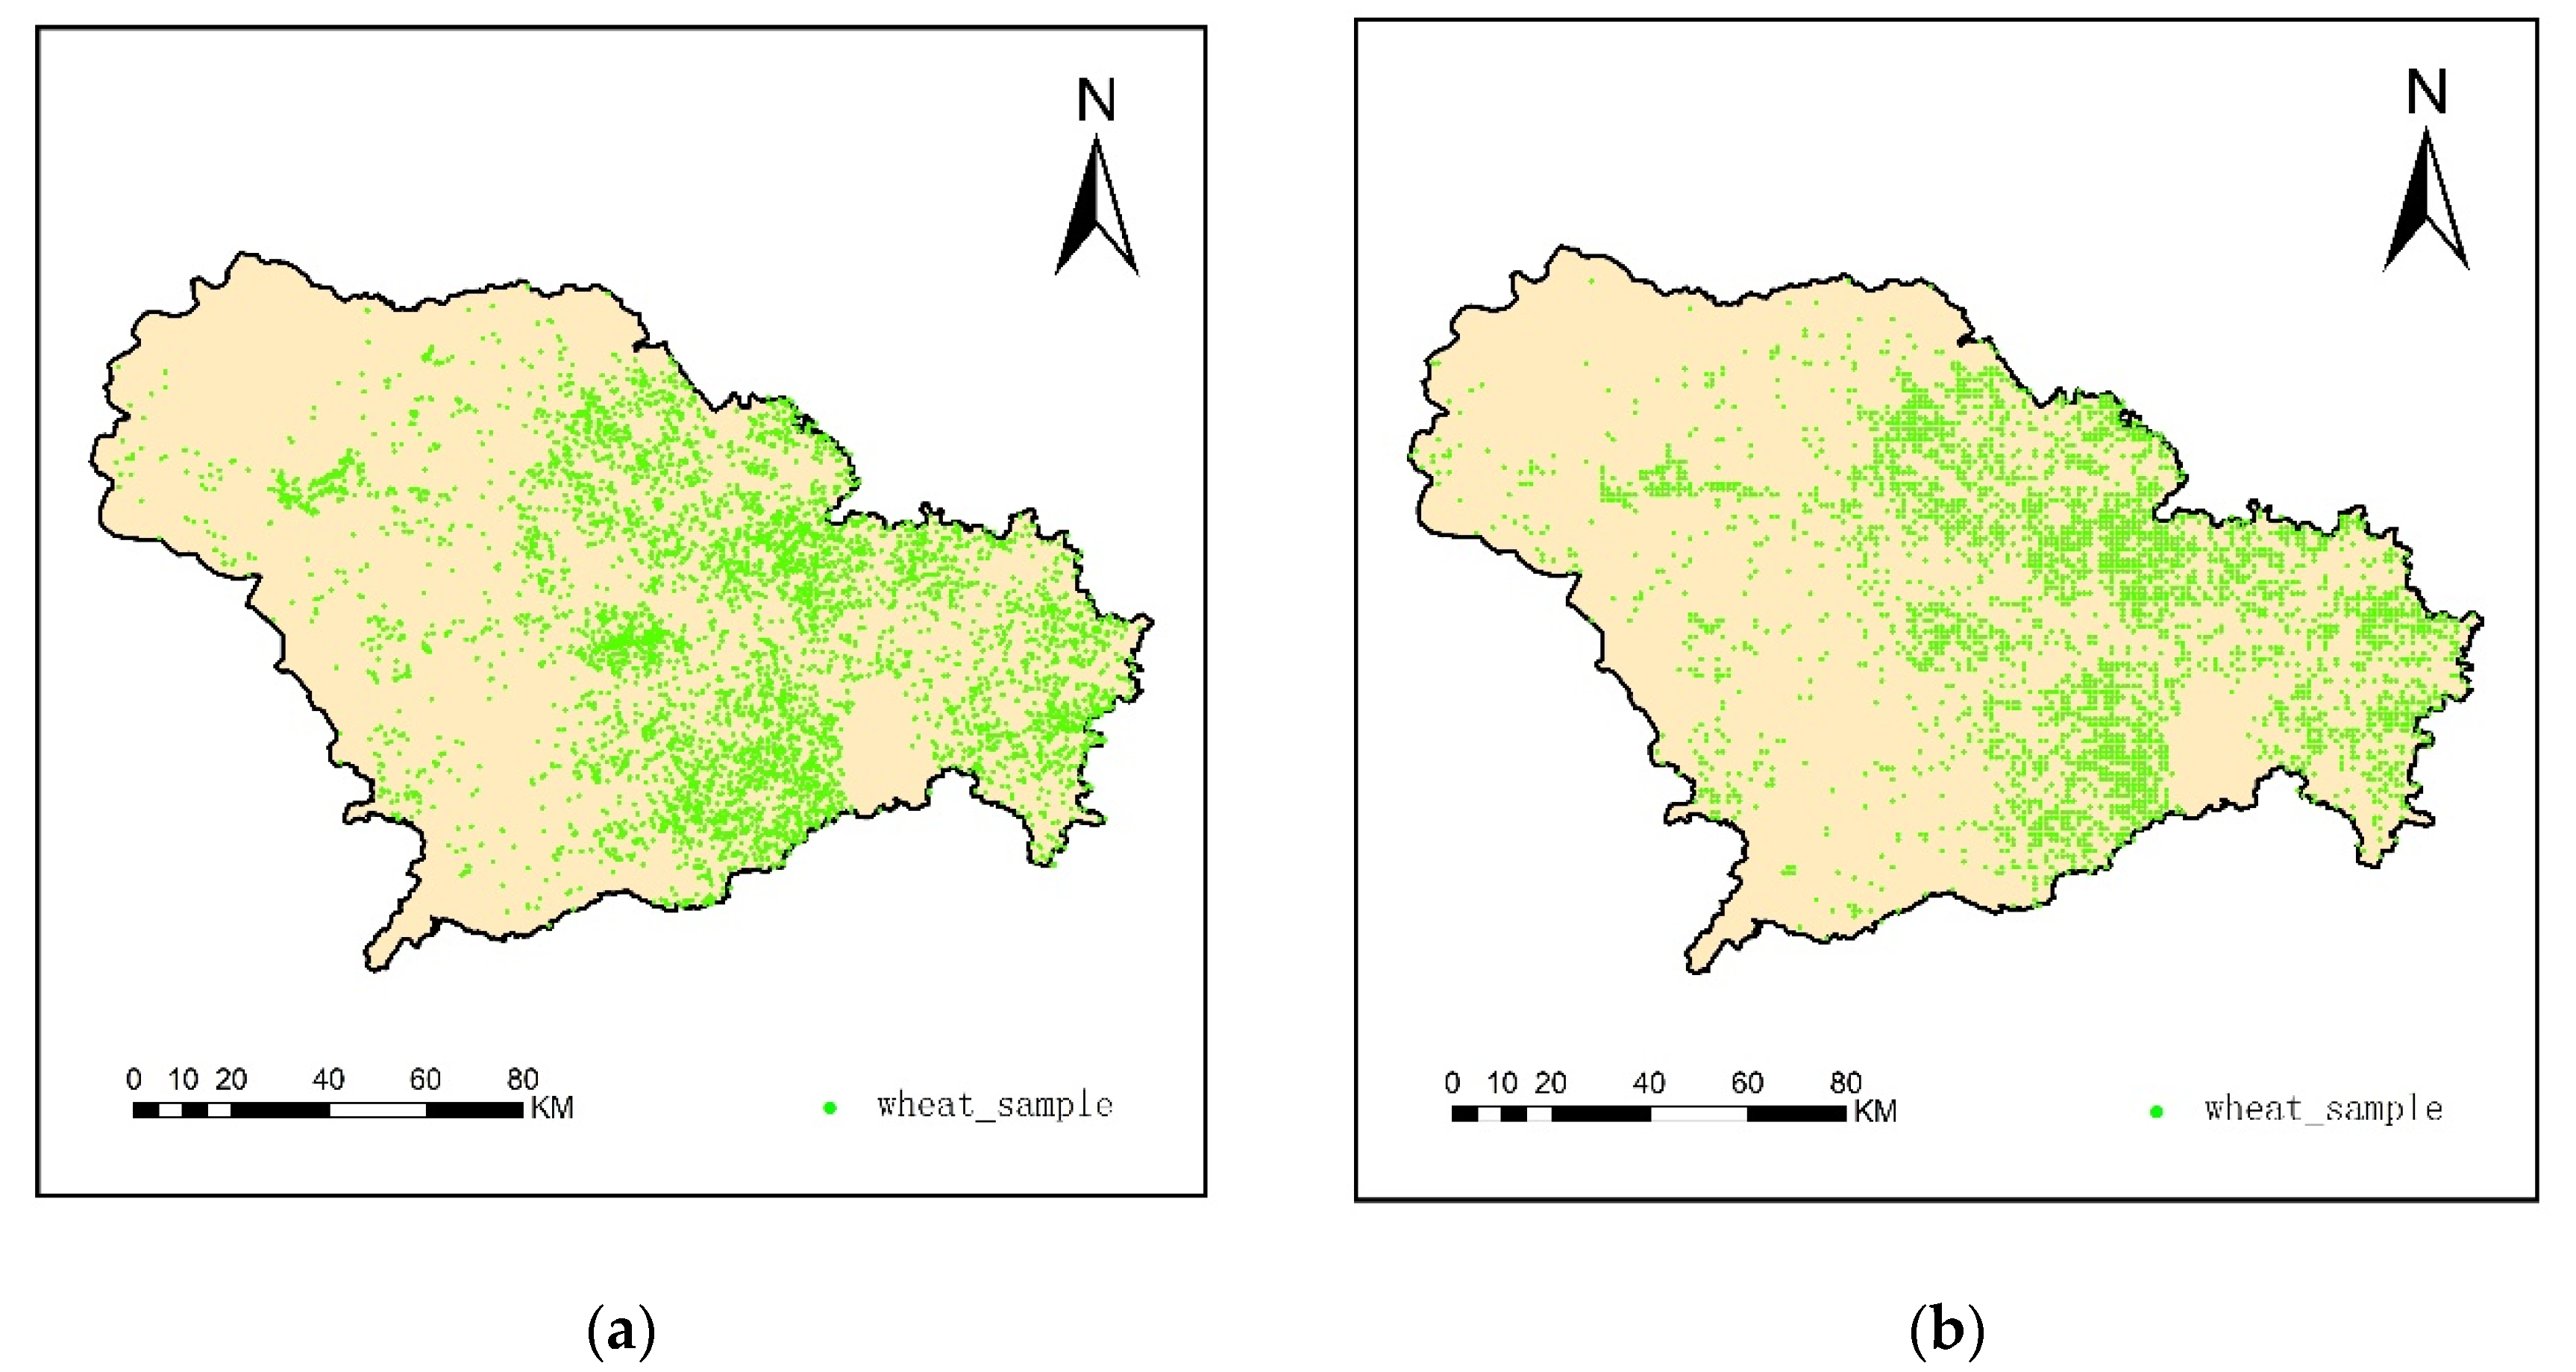
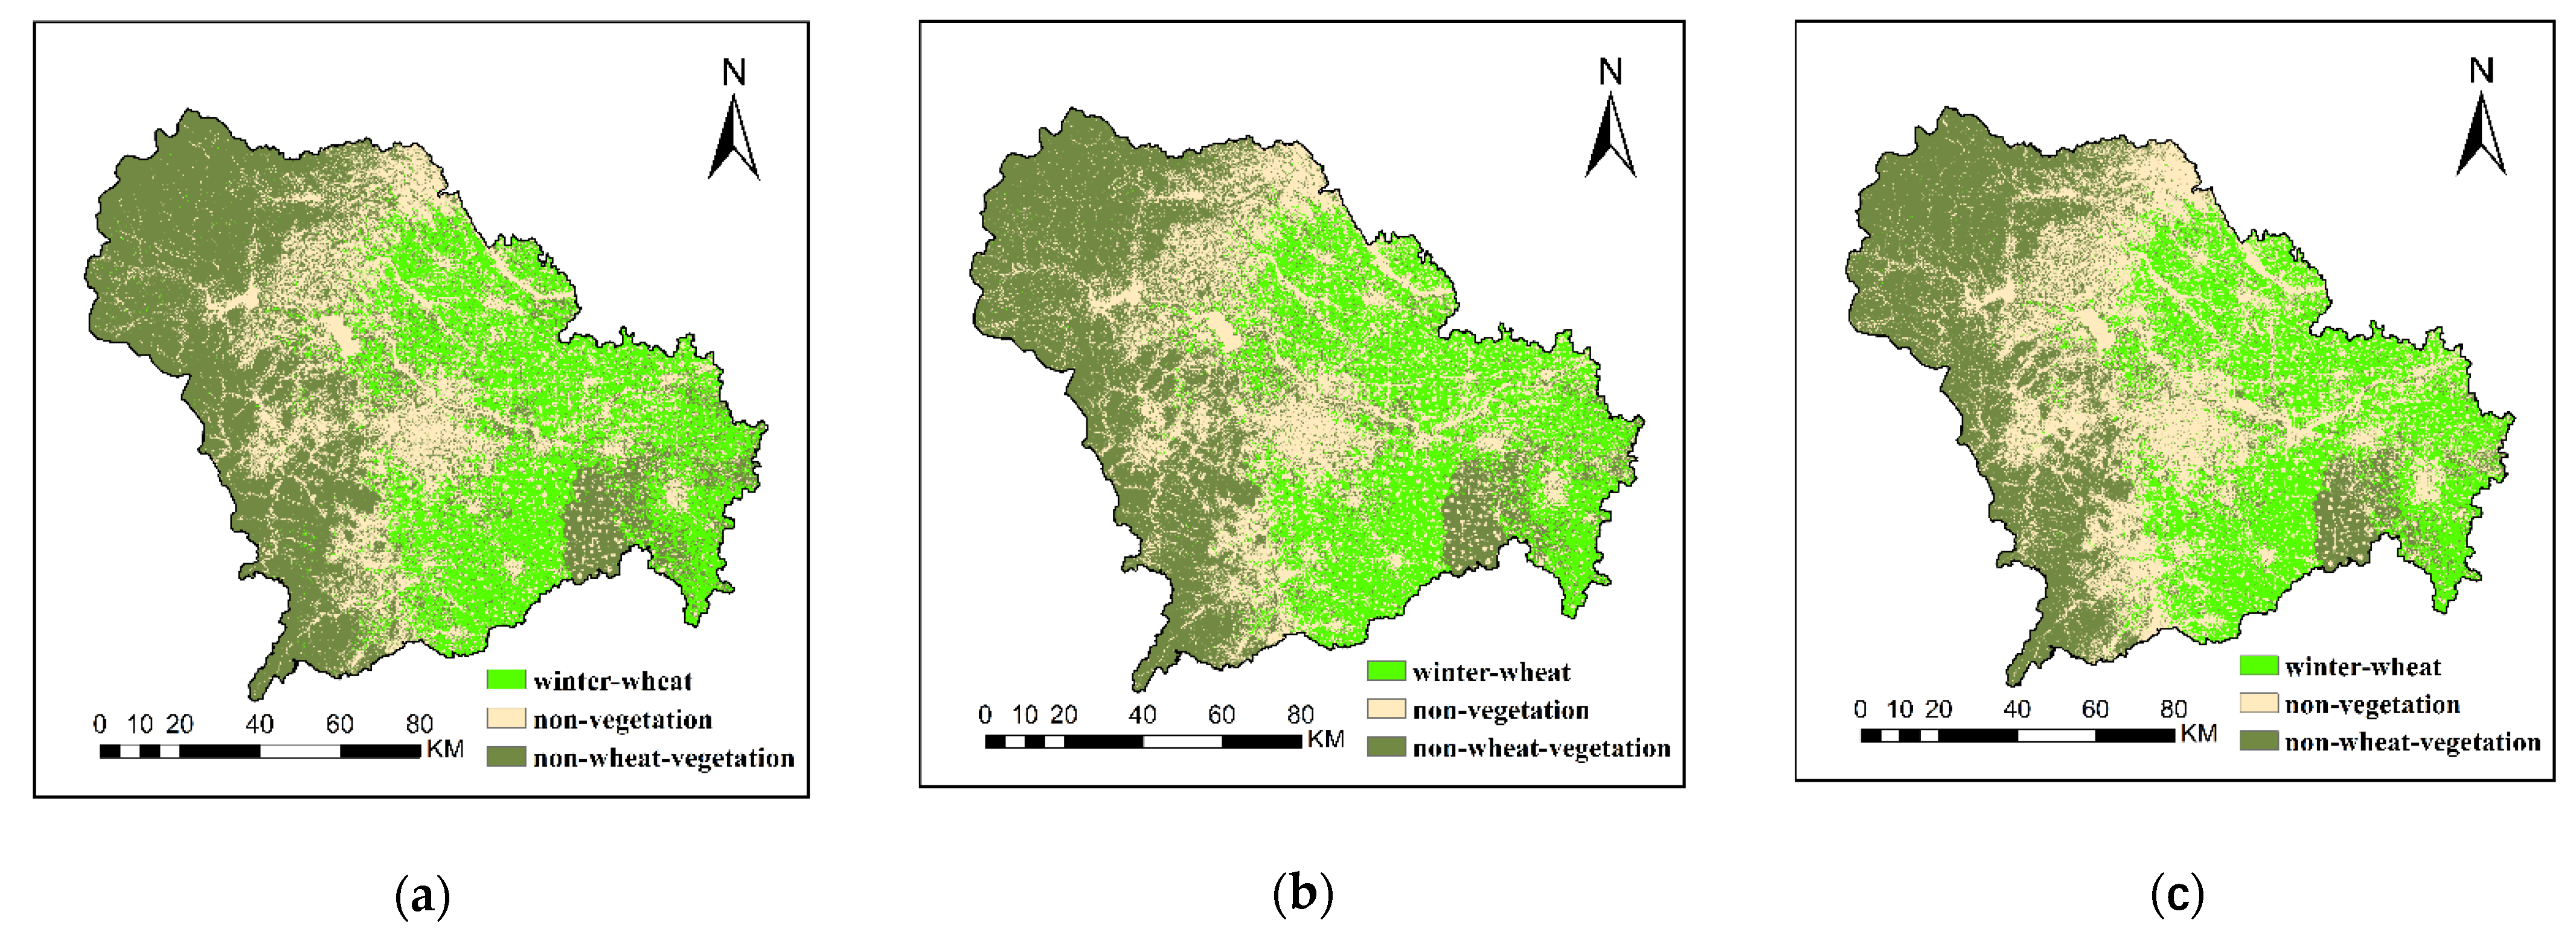
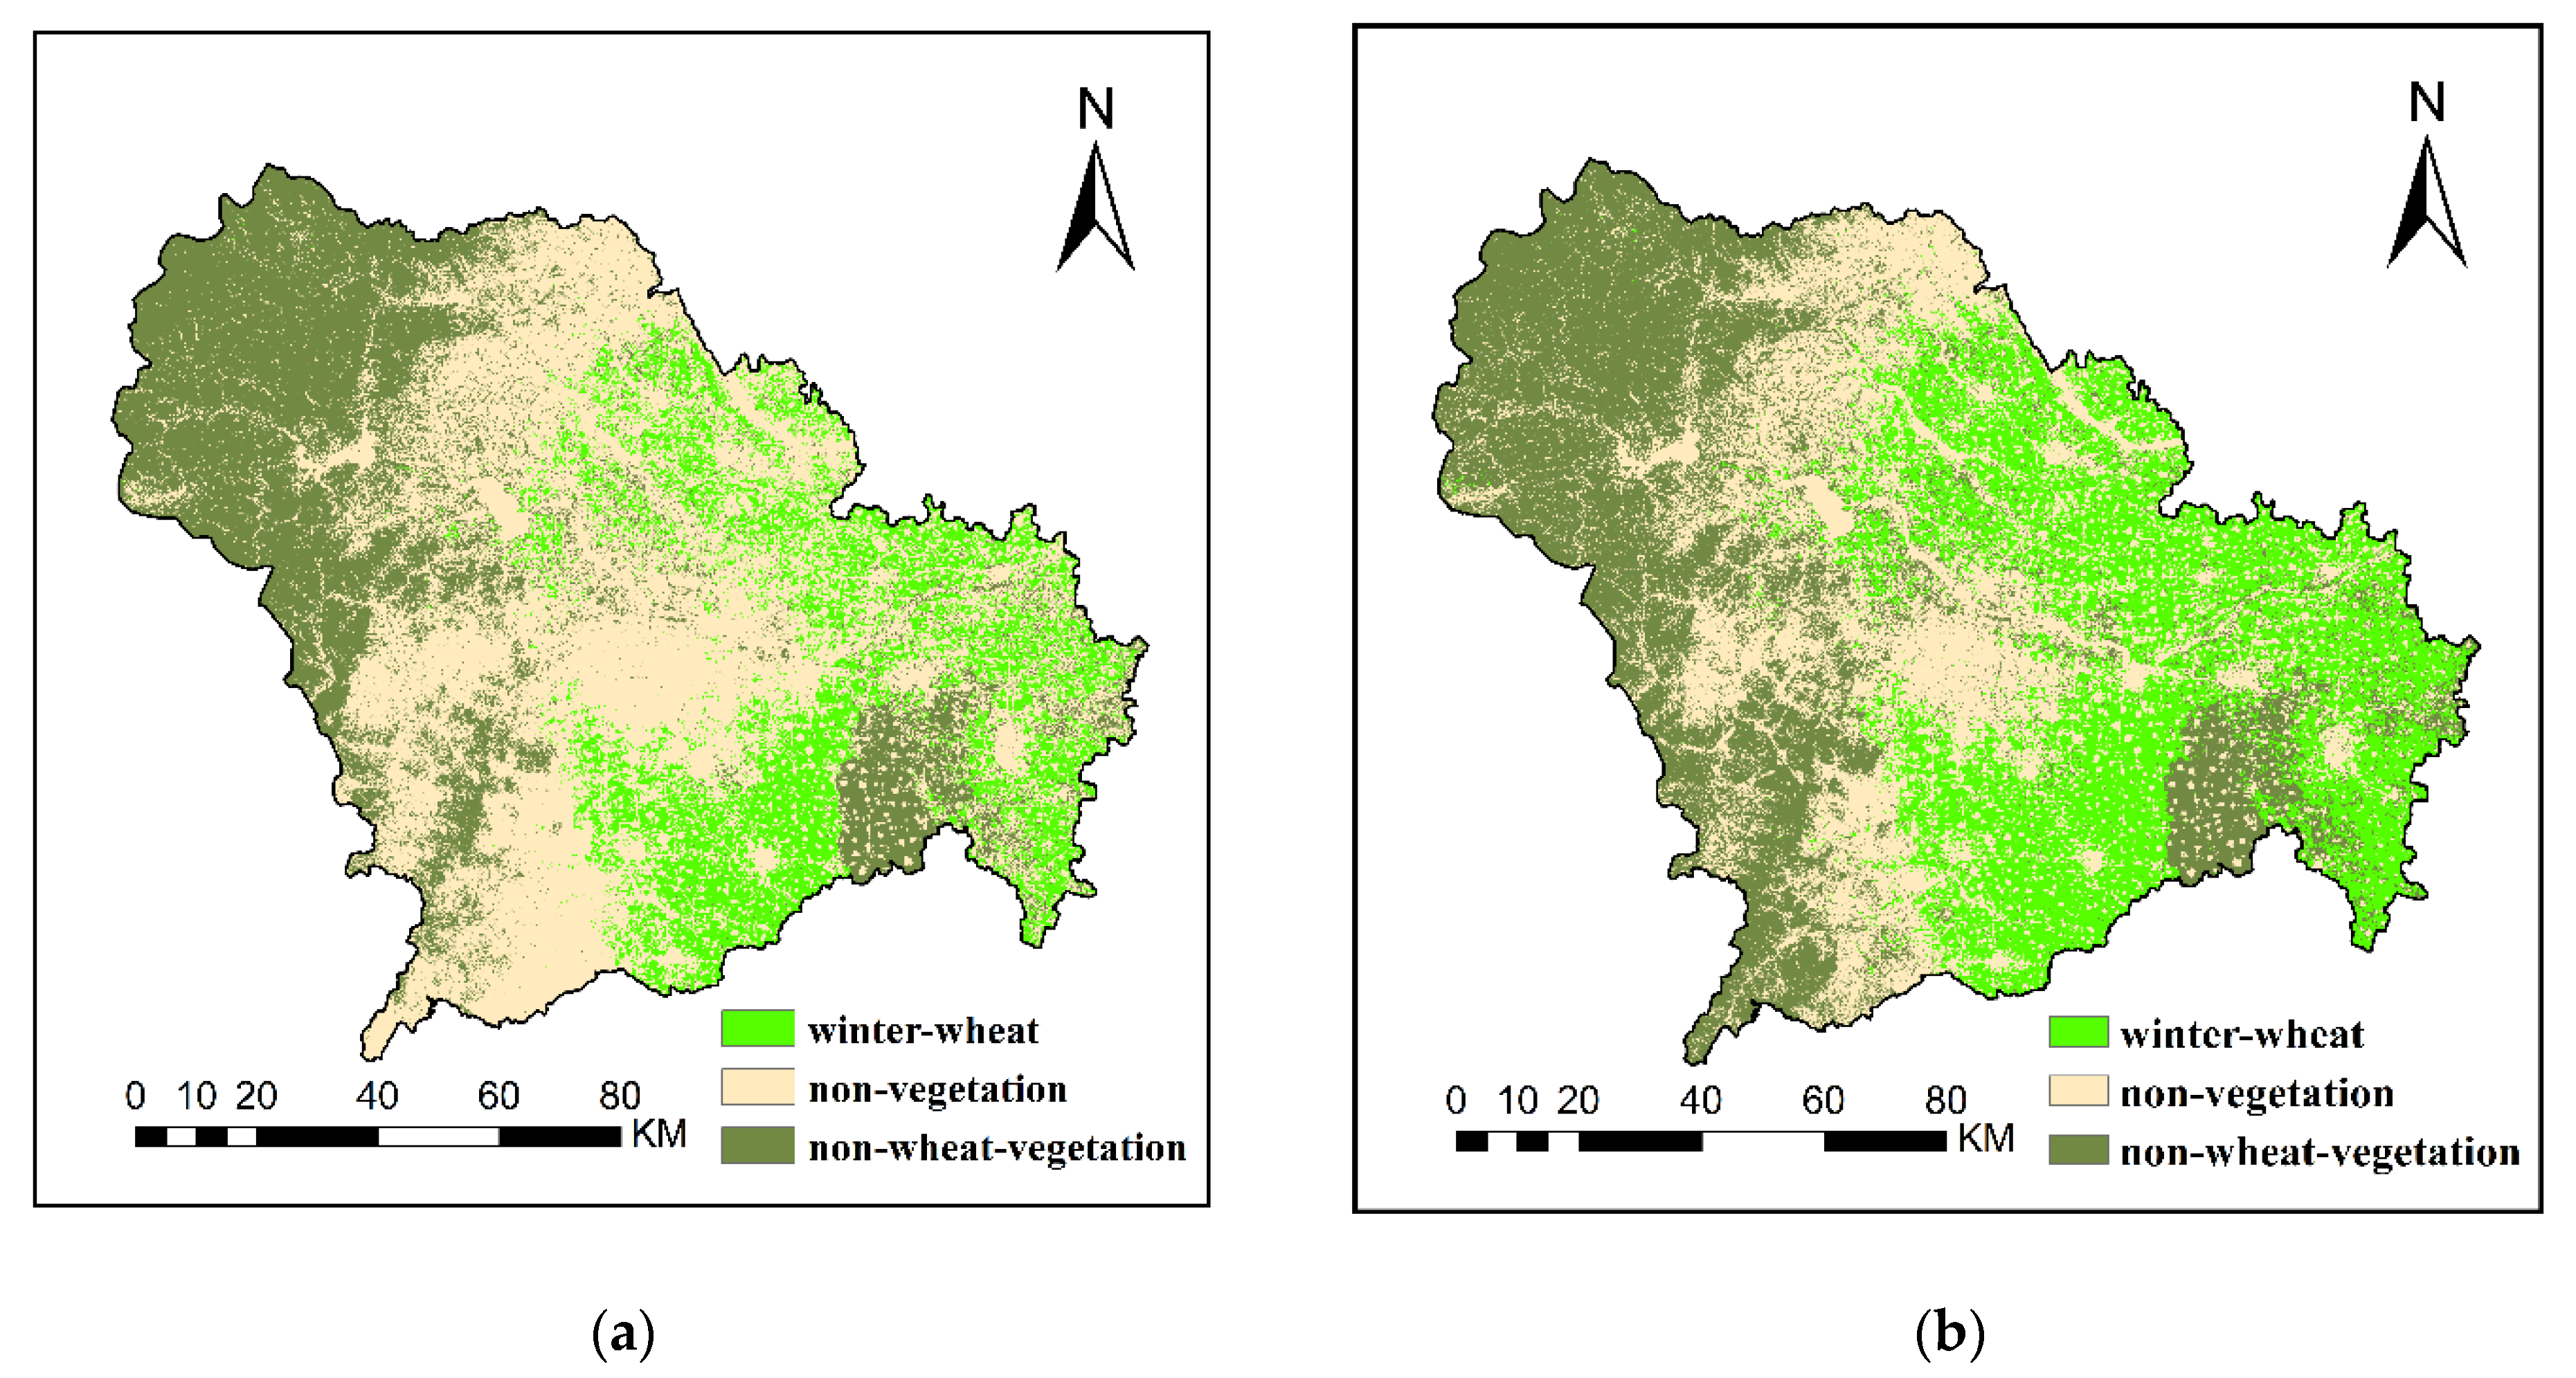
4.1.2. Winter Wheat Training Samples’ Distribution
4.2. Accuracy Assessment
4.2.1. Visual Interpretation
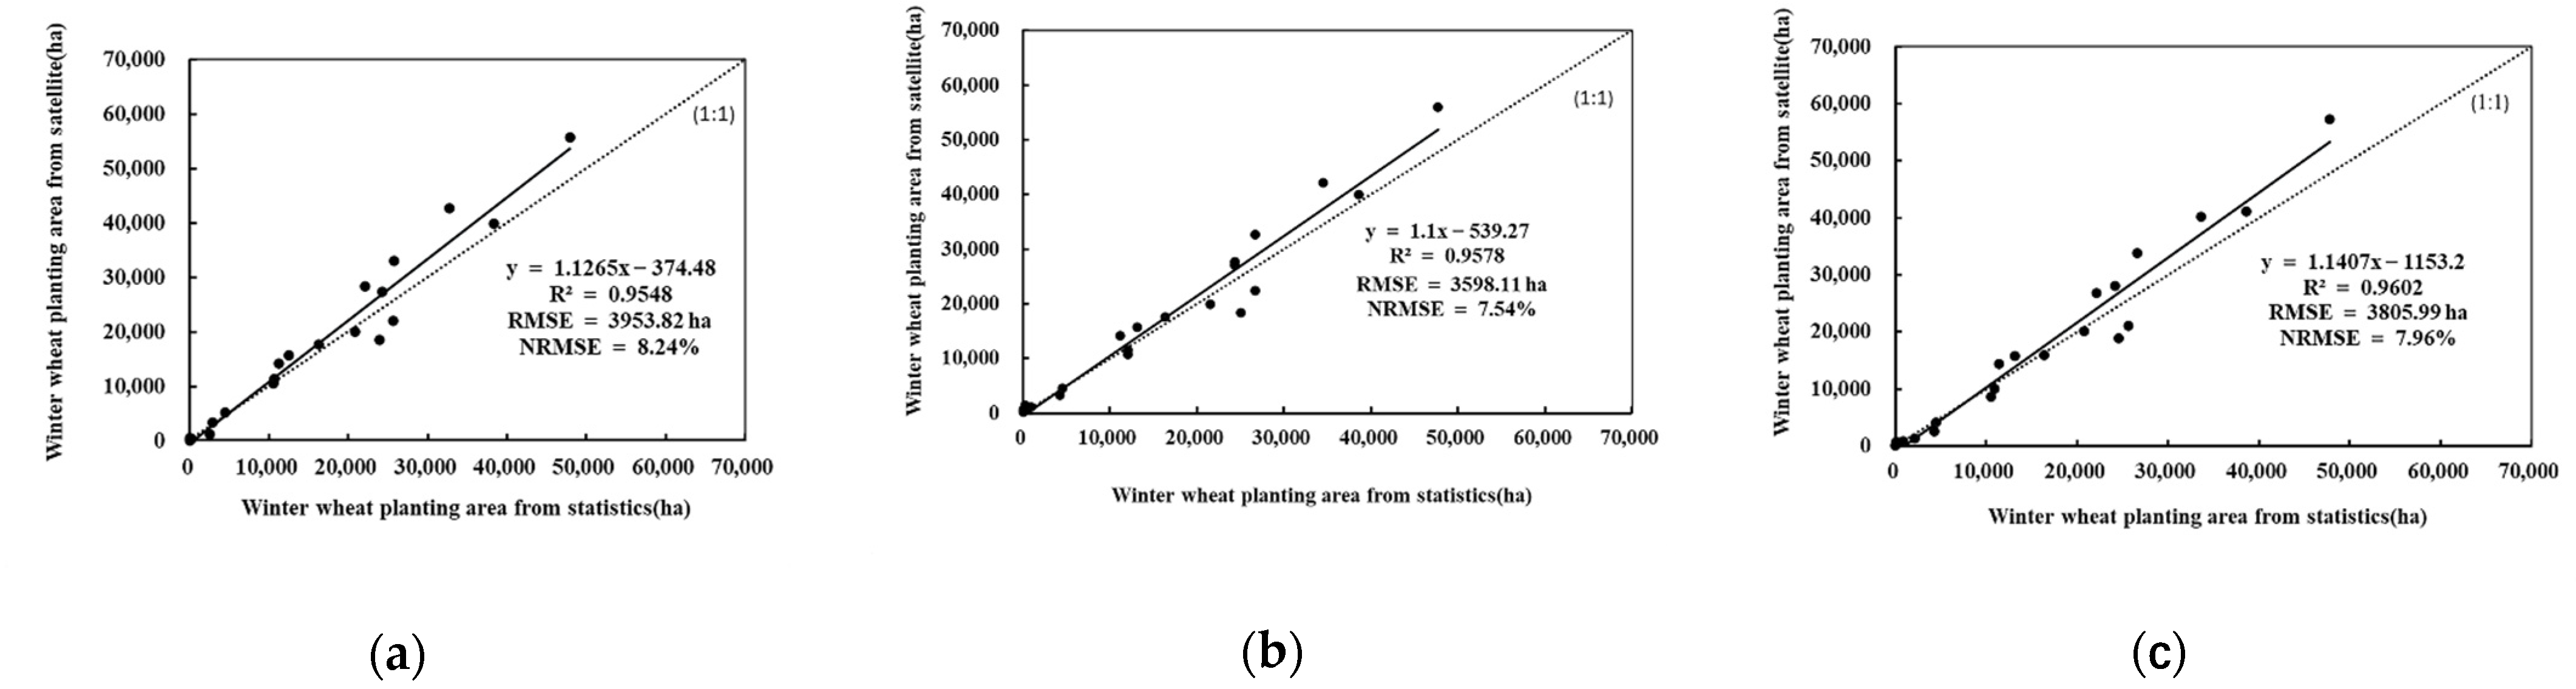
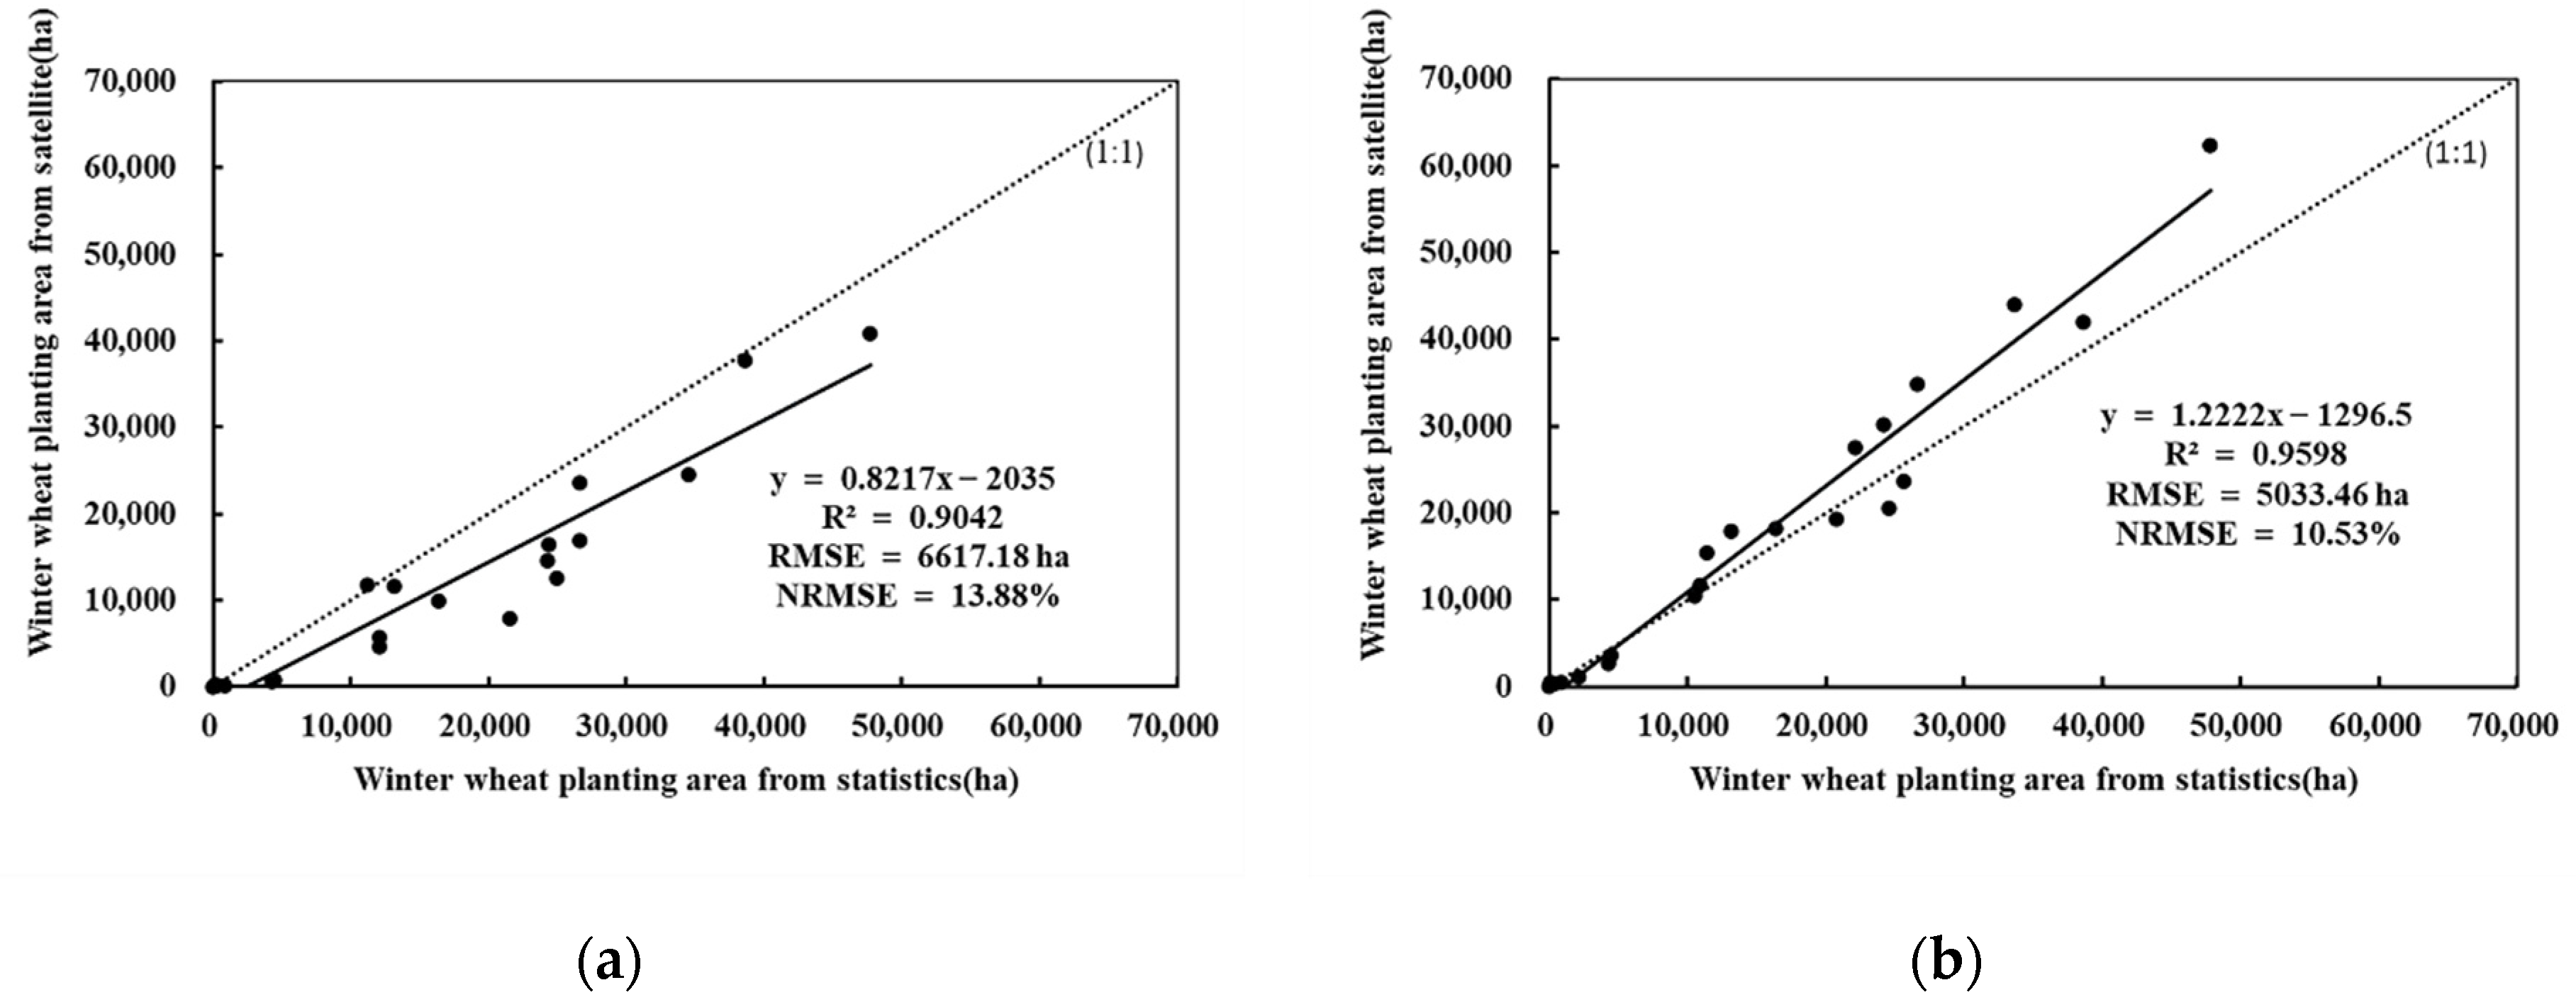
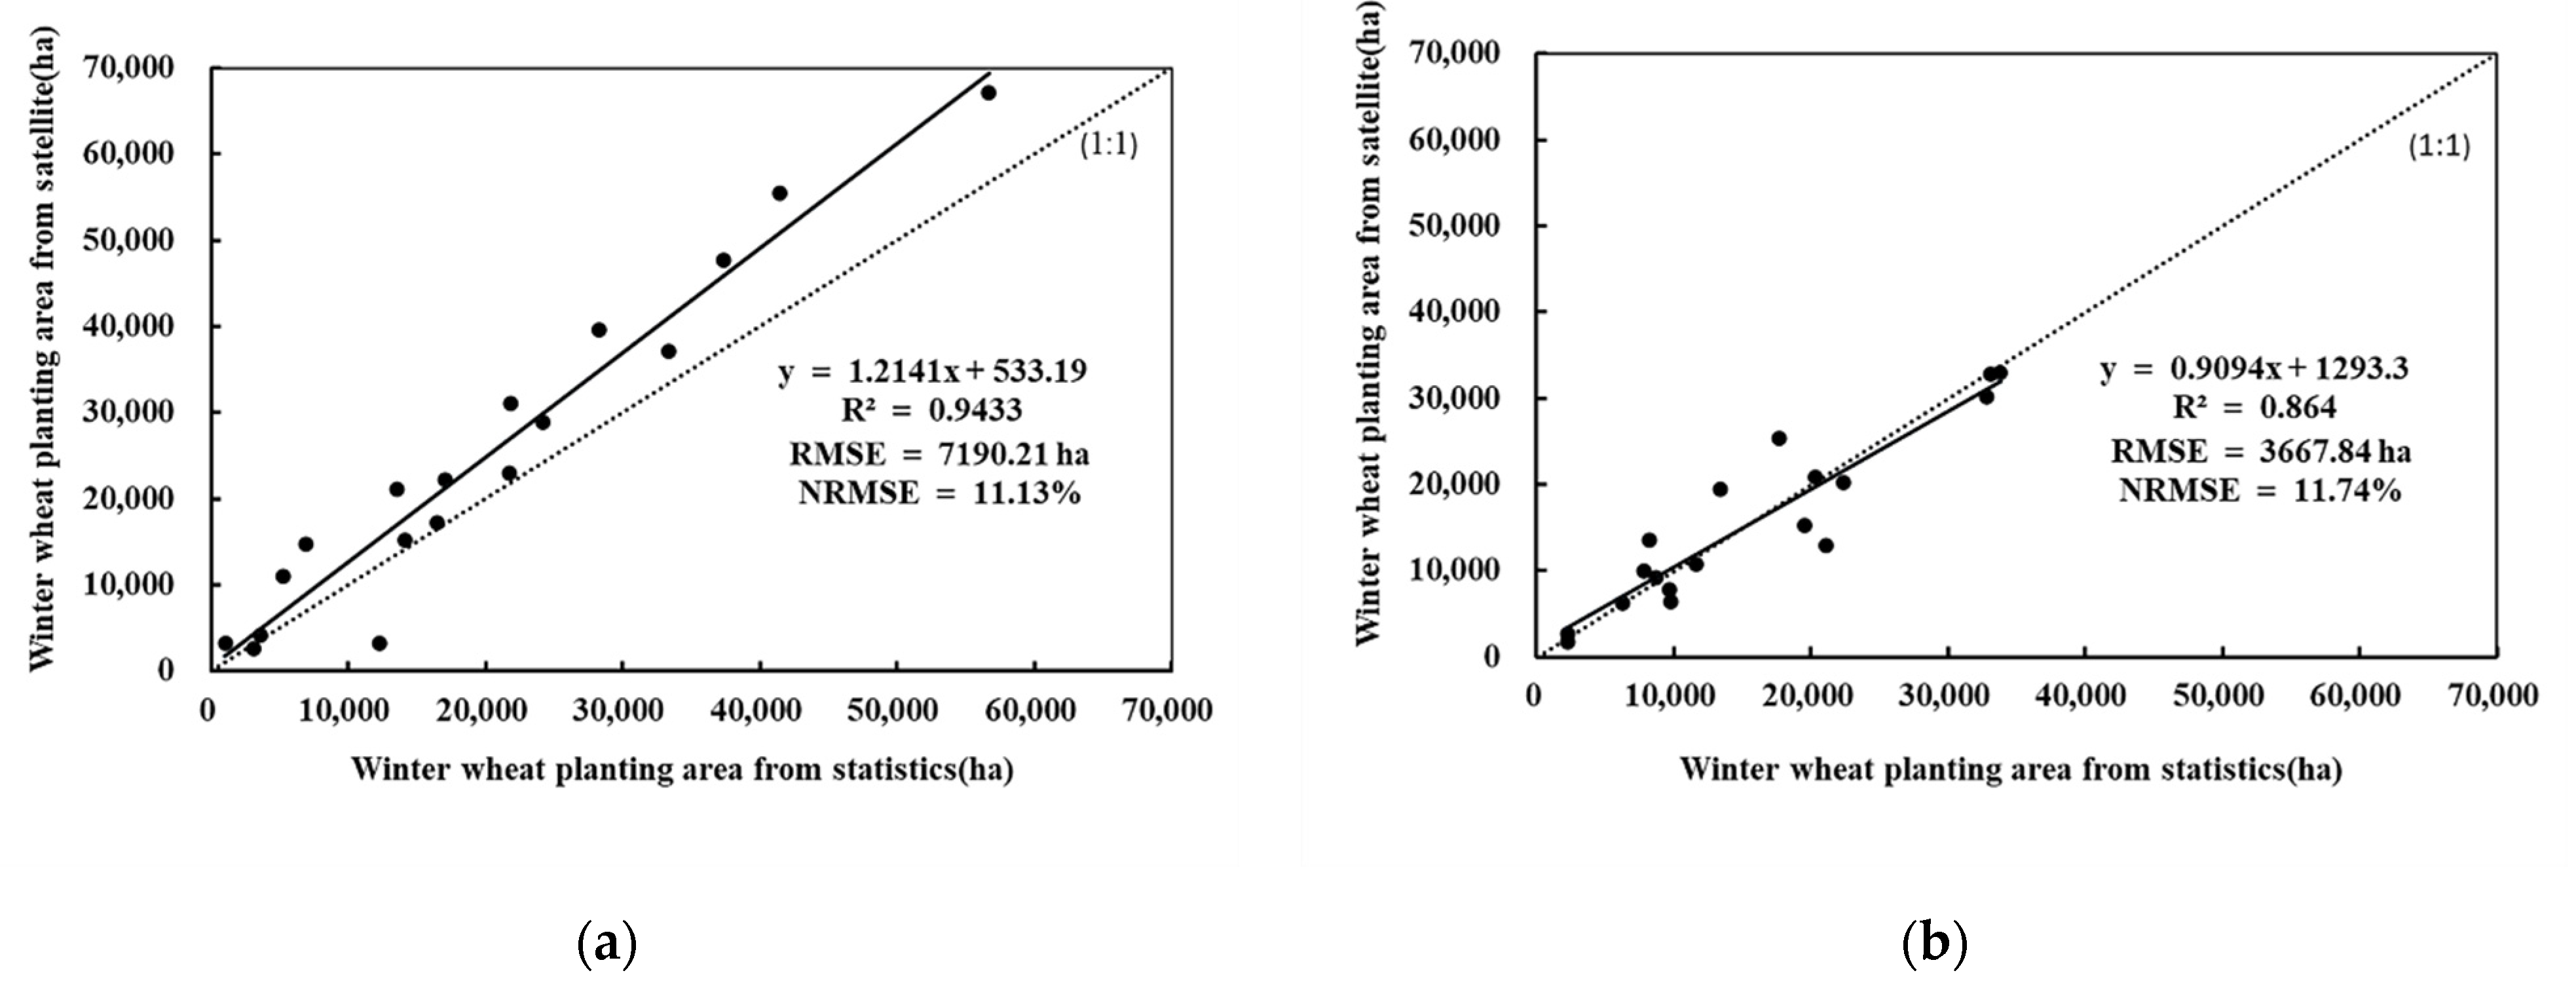
4.2.2. Comparison with Statistical Data
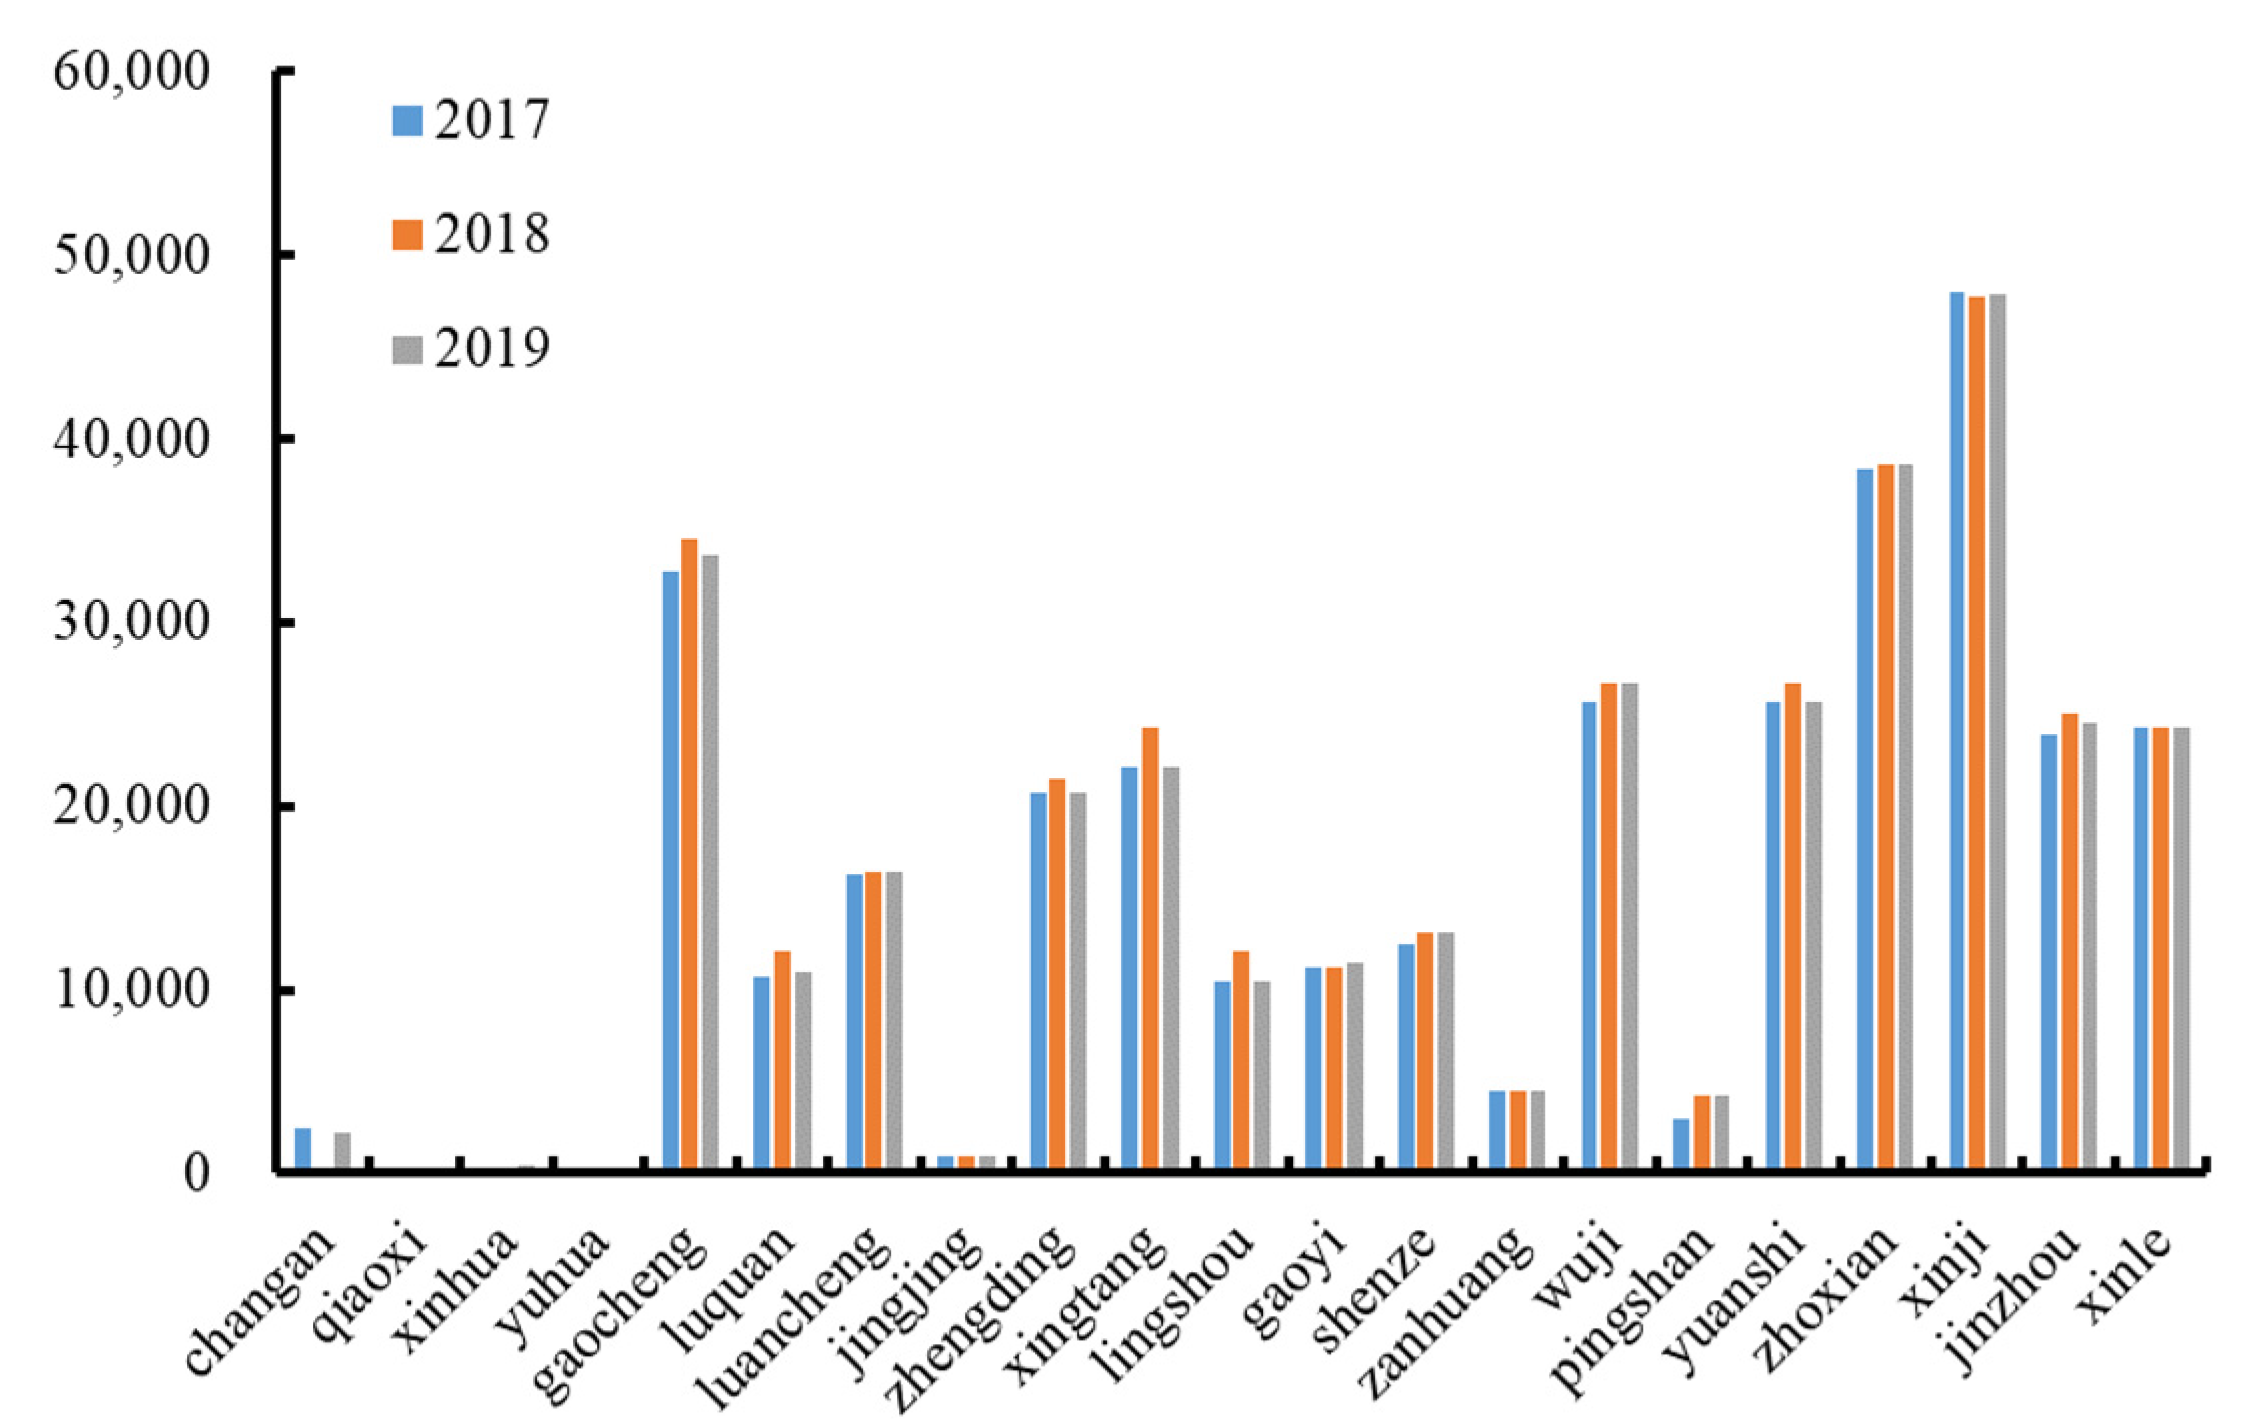
4.3. Time Variation Characteristics of Winter Wheat in Shijiazhuang
4.4. Spatial Variation Characteristics of Winter Wheat in Shijiazhuang
5. Discussion
5.1. Applicability of AUTS in Landsat 8 Images
5.2. Applicability of AUTS in Different Regions
5.3. Advantages and Limitations of AUTS for Winter Wheat Extraction
6. Conclusions
Author Contributions
Funding
Institutional Review Board Statement
Informed Consent Statement
Data Availability Statement
Acknowledgments
Conflicts of Interest
References
- Porkka, M.; Kummu, M.; Siebert, S.; Varis, O. From food insufficiency towards trade dependency: A historical analysis of global food availability. PLoS ONE 2013, 8, e82714. [Google Scholar] [CrossRef] [PubMed] [Green Version]
- Gong, P.; Liu, H.; Zhang, M.N.; Li, C.C.; Wang, J.; Huang, H.B.; Clinton, N.; Ji, L.; Li, W.; Bai, Y.; et al. Stable classification with limited sample: Transferring a 30-m resolution sample set collected in 2015 to mapping 10-m resolution global land cover in 2017. Sci. Bull. 2019, 64, 370–373. [Google Scholar] [CrossRef] [Green Version]
- Gorelick, N.; Hancher, M.; Dixon, M.; Ilyushchenko, S.; Thau, D.; Moore, R. Google Earth Engine: Planetary-scale geospatial analysis for everyone. Remote Sens. Environ. 2017, 202, 18–27. [Google Scholar] [CrossRef]
- Barboza Castillo, E.; Turpo Cayo, E.Y.; de Almeida, C.M.; Salas López, R.; Rojas Briceño, N.B.; Silva López, J.O.; Barrena Gurbillón, M.Á.; Oliva, M.; Espinoza-Villar, R. Monitoring Wildfires in the Northeastern Peruvian Amazon Using Landsat-8 and Sentinel-2 Imagery in the GEE Platform. ISPRS Int. J. Geoinf. 2020, 9, 564. [Google Scholar] [CrossRef]
- Aghababaei, M.; Ebrahimi, A.; Naghipour, A.A.; Asadi, E.; Verrelst, J. Vegetation Types Mapping Using Multi-Temporal Landsat Images in the Google Earth Engine Platform. Remote Sens. 2021, 13, 4683. [Google Scholar] [CrossRef]
- Goldblatt, R.; You, W.; Hanson, G.; Khandelwal, A.K. Detecting the Boundaries of Urban Areas in India: A Dataset for Pixel-Based Image Classification in Google Earth Engine. Remote Sens. 2016, 8, 634. [Google Scholar] [CrossRef] [Green Version]
- Li, X.C.; Gong, P.; Liang, L.A. 30-year (1984–2013) record of annual urban dynamics of Beijing City derived from Landsat data. Remote Sens. Environ. 2015, 166, 78–90. [Google Scholar] [CrossRef]
- Busker, T.; Roo, A.; Gelati, E.; Schwatke, C.; Adamovic, M.; Bisselink, B. A global lake and reservoir volume analysis using a surface water dataset and satellite altimetry. Hydrol. Earth Syst. Ences. 2019, 23, 669–690. [Google Scholar] [CrossRef] [Green Version]
- Sazib, N.; Mladenova, I.; Bolten, J. Leveraging the Google Earth Engine for Drought Assessment Using Global Soil Moisture Data. Remote Sens. 2018, 10, 1265. [Google Scholar] [CrossRef] [PubMed] [Green Version]
- Ge, G.B.T.; Shi, Z.J.; Zhu, Y.J.; Yang, X.H.; Hao, Y.G. Land use/cover classification in an arid desert-oasis mosaic landscape of China using remote sensed imagery: Performance assessment of four machine learning algorithms. Glob. Ecol. Conserv. 2020, 22, e00971. [Google Scholar] [CrossRef]
- Shelestov, A.; Lavreniuk, M.; Kussul, N.; Novikov, A.; Skakun, S. Exploring Google earth engine platform for big data processing: Classification of multi-temporal satellite imagery for crop mapping. Front. Earth Sci. 2017, 5, 17. [Google Scholar] [CrossRef] [Green Version]
- Naghibi, S.A.; Pourghasemi, H.R.; Dixon, B. GIS-based groundwater potential mapping using boosted regression tree, classification and regression tree, and random forest machine learning models in Iran. Environ. Monit. Assess. 2016, 188, 44. [Google Scholar] [CrossRef] [PubMed]
- Wang, L.; Diao, C.; Xian, G.; Yin, D.; Lu, Y.; Zou, S.; Erickson, T.A. A summary of the special issue on remote sensing of land change science with Google earth engine. Remote Sens. Environ. 2020, 248, 112002. [Google Scholar] [CrossRef]
- Zhang, W.M.; Brandt, M.; Prishchepov, A.V.; Li, Z.F.; Lyu, C.G.; Fensholt, R. Mapping the Dynamics of Winter Wheat in the North China Plain from Dense Landsat Time Series (1999 to 2019). Remote Sens. 2021, 13, 1170. [Google Scholar] [CrossRef]
- Jaafar, H.; Mourad, R. GYMEE: A Global Field-Scale Crop Yield and ET Mapper in Google Earth Engine Based on Landsat, Weather, and Soil Data. Remote Sens. 2021, 13, 773. [Google Scholar] [CrossRef]
- Fang, P.; Zhang, X.; Wei, P.; Wang, Y.; Zhang, H.; Liu, F.; Zhao, J. The Classification Performance and Mechanism of Machine Learning Algorithms in Winter Wheat Mapping Using Sentinel-2 10 m Resolution Imagery. Appl. Sci. 2020, 10, 5075. [Google Scholar] [CrossRef]
- Li, C.; Chen, W.; Wang, Y.; Wang, Y.; Ma, C.; Li, Y.; Li, J.; Zhai, W. Mapping Winter Wheat with Optical and SAR Images Based on Google Earth Engine in Henan Province, China. Remote Sens. 2022, 14, 284. [Google Scholar] [CrossRef]
- Han, J.; Zhang, Z.; Cao, J.; Luo, Y.; Zhang, L.; Li, Z.; Zhang, J. Prediction of Winter Wheat Yield Based on Multi-Source Data and Machine Learning in China. Remote Sens. 2020, 12, 236. [Google Scholar] [CrossRef] [Green Version]
- Xu, F.; Li, Z.; Zhang, S.; Huang, N.; Quan, Z.; Zhang, W.; Liu, X.; Jiang, X.; Pan, J.; Prishchepov, A.V. Mapping Winter Wheat with Combinations of Temporally Aggregated Sentinel-2 and Landsat-8 Data in Shandong Province, China. Remote Sens. 2020, 12, 2065. [Google Scholar] [CrossRef]
- Waldner, F.; Canto, G.S.; Defourny, P. Automated annual cropland mapping using knowledge-based temporal features. ISPRS J. Photogramm. Remote Sens. 2015, 110, 1–13. [Google Scholar] [CrossRef]
- Zhong, L.H.; Gong, P.; Biging, G.S. Efficient corn and soybean mapping with temporal extendability: A multi-year experiment using Landsat imagery. Remote Sens. Environ. 2014, 140, 1–13. [Google Scholar] [CrossRef]
- Huang, H.B.; Wang, J.; Liu, C.X.; Liang, L.; Li, C.C.; Gong, P. The migration of training samples towards dynamic global land cover mapping. ISPRS J. Photogramm. Remote Sens. 2020, 161, 27–36. [Google Scholar] [CrossRef]
- Zhang, L.; Liu, Z.; Liu, D.; Xiong, Q.; Yang, N.; Ren, T.; Zhang, C.; Zhang, X.; Li, S. Crop mapping based on historical samples and new training samples generation in Heilongjiang Province, China. Sustainability 2019, 11, 5052. [Google Scholar] [CrossRef] [Green Version]
- Sharma, R.; Ghosh, A.; Joshi, P.K. Decision tree approach for classification of remotely sensed satellite data using open source support. J. Earth Syst. Sci. 2013, 122, 1237–1247. [Google Scholar] [CrossRef] [Green Version]
- Lunetta, R.S.; Shao, Y.; Ediriwickrema, J.; Lyon, J.G. Monitoring agricultural cropping patterns across the Laurentian Great Lakes Basin using MODIS-NDVI data. Int. J. Appl. Earth Obs. Geoinf. 2010, 12, 81–88. [Google Scholar] [CrossRef]
- Sakamoto, T.; Yokozawa, M.; Toritani, H.; Shibayama, M.; Ishitsuka, N.; Ohno, H. A crop phenology detection method using time-series MODIS data. Remote Sens. Environ. 2005, 96, 366–374. [Google Scholar] [CrossRef]
- Wardlow, B.D.; Egbert, S.L. A comparison of MODIS 250-m EVI and NDVI data for crop mapping: A case study for southwest Kansas. Int. J. Remote Sens. 2010, 31, 805–830. [Google Scholar] [CrossRef]
- Pan, Y.Z.; Li, L.; Zhang, J.S.; Liang, S.L.; Zhu, X.F.; Sulla-Menashe, D. Winter wheat area estimation from MODIS-EVI time series data using the Crop Proportion Phenology Index. Remote Sens. Environ. 2012, 119, 232–242. [Google Scholar] [CrossRef]
- Wardlow, B.D.; Egbert, S.L. Large-area crop mapping using time-series MODIS 250 m NDVI data: An assessment for the US Central Great Plains. Remote Sens. Environ. 2008, 112, 1096–1116. [Google Scholar] [CrossRef]
- Fritz, S.; See, L.; McCallum, I.; You, L.; Bun, A.; Moltchanova, E.; Duerauer, M.; Albrecht, F.; Schill, C.; Perger, C.; et al. Mapping global cropland and field size. Glob. Chang. Biol. 2015, 21, 1980–1992. [Google Scholar] [CrossRef]
- Lobell, D.B.; Asner, G.P. Cropland distributions from temporal unmixing of MODIS data. Remote Sens. Environ. 2004, 93, 412–422. [Google Scholar] [CrossRef]
- Yang, G.; Yu, W.; Yao, X.; Zheng, H.; Cao, Q.; Zhu, Y.; Cao, W.; Cheng, T. AGTOC: A novel approach to winter wheat mapping by automatic generation of training samples and one-class classification on Google Earth Engine. Int. J. Appl. Earth Obs. Geoinf. 2021, 102, 102446. [Google Scholar] [CrossRef]
- Song, C.; Woodcock, C.E.; Seto, K.C.; Lenney, M.P.; Macomber, S.A. Classification and change detection using Landsat TM data: When and how to correct atmospheric effects? Remote Sens Environ. 2001, 75, 230–244. [Google Scholar] [CrossRef]
- Rouse, J.W.; Haas, R.H.; Schell, J.A.; Deeering, D.W. Monitoring vegetation systems in the Great Plains with ERTS. In Third Earth Resources Technology Satellite-1 Symposium; Freden, S.C., Mercanton, E.P., Becker, M.A., Eds.; NASA: Washington, DC, USA, 1973; Volume 1, pp. 309–317. [Google Scholar]
- Ren, J.Q.; Chen, Z.X.; Zhou, Q.B.; Tang, H.J. Regional yield estimation for winter wheat with MODIS-NDVI data in Shandong, China. Int. J. Appl. Earth Obs. Geoinf. 2008, 10, 403–413. [Google Scholar] [CrossRef]
- Mantas, C.J.; Castellano, J.G.; Moral-Garcia, S.; Abellan, J. A comparison of random forest based algorithms: Random credal random forest versus oblique random forest. Soft Comput. 2009, 23, 10739–10754. [Google Scholar] [CrossRef]
- He, Y.H.Z.; Wang, C.L.; Chen, F.; Jia, H.C.; Liang, D.; Yang, A.Q. Feature Comparison and Optimization for 30-M Winter Wheat Mapping Based on Landsat-8 and Sentinel-2 Data Using Random Forest Algorithm. Remote Sens. 2019, 11, 535. [Google Scholar] [CrossRef] [Green Version]
- Rousselet, G.A.; Pernet, C.R. Improving standards in brain-behavior correlation analyses. Front. Hum. Neurosci. 2012, 6, 119. [Google Scholar] [CrossRef] [PubMed] [Green Version]
- Chen, J.; Rao, Y.; Shen, M.; Wang, C.; Zhou, Y.; Ma, L.; Tang, Y.; Yang, X. A Simple Method for Detecting Phenological Change From Time Series of Vegetation Index. IEEE Trans. Geosci. Remote Sens. 2016, 54, 3436–3449. [Google Scholar] [CrossRef]
- Dong, J.; Fu, Y.; Wang, J.; Tian, H.; Fu, S.; Niu, Z.; Han, W.; Zheng, Y.; Huang, J.; Yuan, W. Early-season mapping of winter wheat in China based on Landsat and Sentinel images. Earth Syst. Sci. Data. 2020, 12, 3081–3095. [Google Scholar] [CrossRef]
- Xie, Y.; Huang, J.X. Integration of a Crop Growth Model and Deep Learning Methods to Improve Satellite-Based Yield Estimation of Winter Wheat in Henan Province, China. Remote Sens. 2021, 13, 4372. [Google Scholar] [CrossRef]
- Lambert, M.J.; Traore, P.C.S.; Blaes, X.; Baret, P.; Defourny, P. Estimating smallholder crops production at village level from Sentinel-2 time series in Mali’s cotton belt. Remote Sens. Environ. 2018, 216, 647–657. [Google Scholar] [CrossRef]
- Phalke, A.R.; Ozdogan, M.; Thenkabail, P.S.; Erickson, T.; Gorelick, N.; Yadav, K.; Congalton, R.G. Mapping croplands of Europe, Middle East, Russia, and Central Asia using Landsat, Random Forest, and Google Earth Engine. ISPRS J. Photogramm. Remote Sens. 2020, 167, 104–122. [Google Scholar] [CrossRef]
- Zhang, C.K.; Zhang, H.Y.; Zhang, L.P. Spatial domain bridge transfer: An automated paddy rice mapping method with no training data required and decreased image inputs for the large cloudy area. Comput. Electron. Agric. 2021, 181, 105978. [Google Scholar] [CrossRef]


| 2017 | 2018 | 2019 | |||||||||
|---|---|---|---|---|---|---|---|---|---|---|---|
| a | b | c | PA (%) | a | b | c | PA (%) | a | b | c | |
| a | 448 | 62 | 30 | 82.96 | 470 | 75 | 6 | 85.30 | 448 | 56 | 26 |
| b | 12 | 511 | 36 | 91.41 | 4 | 567 | 49 | 91.45 | 11 | 696 | 27 |
| c | 11 | 21 | 869 | 96.45 | 14 | 32 | 783 | 94.45 | 8 | 33 | 714 |
| UA (%) | 95.12 | 86.03 | 93.94 | 96.31 | 84.12 | 93.44 | 95.76 | 88.66 | 93.09 | ||
| OA (%) | 91.40 | 91.00 | 91.95 | ||||||||
| Kappa | 0.87 | 0.86 | 0.88 |
Publisher’s Note: MDPI stays neutral with regard to jurisdictional claims in published maps and institutional affiliations. |
© 2022 by the authors. Licensee MDPI, Basel, Switzerland. This article is an open access article distributed under the terms and conditions of the Creative Commons Attribution (CC BY) license (https://creativecommons.org/licenses/by/4.0/).
Share and Cite
Wang, C.; Zhang, H.; Wu, X.; Yang, W.; Shen, Y.; Lu, B.; Wang, J. AUTS: A Novel Approach to Mapping Winter Wheat by Automatically Updating Training Samples Based on NDVI Time Series. Agriculture 2022, 12, 817. https://doi.org/10.3390/agriculture12060817
Wang C, Zhang H, Wu X, Yang W, Shen Y, Lu B, Wang J. AUTS: A Novel Approach to Mapping Winter Wheat by Automatically Updating Training Samples Based on NDVI Time Series. Agriculture. 2022; 12(6):817. https://doi.org/10.3390/agriculture12060817
Chicago/Turabian StyleWang, Chunyang, Huan Zhang, Xifang Wu, Wei Yang, Yanjun Shen, Bibo Lu, and Jianlong Wang. 2022. "AUTS: A Novel Approach to Mapping Winter Wheat by Automatically Updating Training Samples Based on NDVI Time Series" Agriculture 12, no. 6: 817. https://doi.org/10.3390/agriculture12060817
APA StyleWang, C., Zhang, H., Wu, X., Yang, W., Shen, Y., Lu, B., & Wang, J. (2022). AUTS: A Novel Approach to Mapping Winter Wheat by Automatically Updating Training Samples Based on NDVI Time Series. Agriculture, 12(6), 817. https://doi.org/10.3390/agriculture12060817