Article

Film Mulching with Low Phosphorus Application Improves Soil Organic Carbon and Its Decomposability in a Semiarid Agroecosystem

1
Department of Grassland Science, College of Agriculture and Animal Husbandry, Qinghai University, Xining 810016, China
2
State Key Laboratory of Plateau Ecology and Agriculture, Qinghai University, Xining 810016, China
3
Key Laboratory of Organic Dry Farming of Shanxi Province, Shanxi Institute of Organic Dryland Farming, Shanxi Agricultural University, Taiyuan 030031, China
4
The UWA Institute of Agriculture, The University of Western Australia, Perth, WA 6009, Australia
5
State Key Laboratory of Grassland Agro-Ecosystems, Institute of Arid Agroecology, School of Life Sciences, Lanzhou University, Lanzhou 730000, China
6
College of Agriculture, Nanjing Agricultural University, Nanjing 210095, China
*
Author to whom correspondence should be addressed.
Agriculture 2022, 12(6), 816; https://doi.org/10.3390/agriculture12060816
Submission received: 24 March 2022 / Revised: 24 May 2022 / Accepted: 2 June 2022 / Published: 5 June 2022
(This article belongs to the Section Agricultural Soils)

Abstract

:
Soil organic carbon (SOC) storage and decomposability are crucial for soil quality. Film mulching and phosphorus (P) application are important agricultural practices on the semiarid Loess Plateau. This study analyzed the combined effects of film mulching and P application on SOC, its fractions, and mineralization kinetics under alfalfa (Medicago sativa L.). The six-year field experiment incorporated randomized blocks of split-plot design with two mulching treatments (no film mulching with flat planting and film mulching with ridges and furrows) as main plots and four P levels (P0: 0 kg ha−1, P1: 9.73 kg ha−1, P2: 19.3 kg ha−1, P3: 28.9 kg ha−1) as subplots. Mulching increased SOC content, SOC fractions (light and heavy fraction organic C, microbial biomass C, and dissolved organic C), and mineralization. After six years, mulching increased SOC content by 2.18, 2.60, 2.37, and 0.17 g kg−1 at P0, P1, P2, and P3, relative to no mulching. With increasing P levels, SOC fractions and mineralization increased under no mulching but increased initially and then decreased under mulching. P1 with mulching displayed the highest SOC utilization efficiency and stability. Kinetic models divided SOC into an active and a slow SOC pool, with the latter showing the lowest decomposability and highest stability in P1 with mulching. Overall, film mulching with a low P level, especially 11.9 kg ha−1 P fertilizer, promoted SOC storage under alfalfa on the semiarid Loess Plateau due to the high SOC content with high C utilization efficiency and stability and low decomposability.

1. Introduction

Soil is the largest carbon pool in the terrestrial biosphere, about 4.5 times the size of the biotic pool (560 gigatons, Gt) and 3.3 times the size of the atmospheric pool (760 Gt) [1]. Understanding soil carbon dynamics is important because the carbon balance is critical for terrestrial ecosystems and the global carbon cycle. Soil organic carbon (SOC) accounts for more than 60% of global soil carbon (~1550 Gt) and includes plants, roots, soil fauna, fungi, and microbial residues at all stages of decomposition [1]. The amount of SOC is the net balance between SOC inputs from tissue residues or root exudations and SOC outputs in various organic carbon pools through biochemical or soil microbial decomposition [2]. As a major sink and source for atmospheric CO2, small SOC storage and decomposition changes will significantly affect food security [3].
The semiarid region of the Loess Plateau is characterized by low and labile rainfall with considerable spatial-temporal variation, high evaporation rates, limited temperature, and serious soil and water losses, resulting in low soil quality and crop yields [4,5]. Farmers in this region use plastic film to harvest rainfall, reduce evaporation, increase soil temperature, and enhance crop yields [6]. Plastic mulch retained for five years on abandoned land had up to 40% higher SOC contents than areas with no plastic mulch due to better vegetation coverage and aggregate stability [7]. SOC comprises various C fractions with different stabilities and chemical compositions [8]. Light fraction organic carbon (LFOC) mainly comprises botanical relics, soil microorganisms, and microfaunal debris at an intermediate state of decomposition [9,10]. Heavy fraction organic carbon (HFOC), a recalcitrant SOC pool, comprises organic materials tightly bound to soil minerals [2]. Microbial biomass carbon (MBC) is a living and dynamic fraction of the SOC pool. Despite only accounting for 1–5% of the SOC pool [11,12], it is crucial for energy flow, nutrient transformation, and the element cycle due to its ‘eye of the needle’ role through which all organic materials entering the soil must pass [13]. Dissolved organic carbon (DOC) is the most important labile fraction of SOC since it is the main energy source for soil microorganisms [14]. DOC can be rapidly consumed, incorporated into microbial tissue, or released as CO2 [15]. Jia et al. [5] reported that plastic mulch with alternative ridges and furrows increased SOC, LFOC, HFOC, and MBC in an alfalfa (Medicago sativa L.) field on the semiarid Loess Plateau from 2001 to 2003. Large (80 cm) and small (40 cm) ridges alternated and fully mulched with plastic film increased LFOC and MBC [10]. Enhancing SOC and its fractions is important for improving soil quality, reducing soil erosion, and optimizing agricultural productivity [16,17]. However, some studies have shown that long-term film mulching depleted SOC due to the stimulated organic matter decomposition by the enhanced microbial biomass and metabolic processes [18]. Wang et al. [19] reported that while double ridges and furrows mulched with plastic film enhanced SOC mineralization due to increased soil temperature and moisture content, the overall SOC content remained balanced due to the inputs derived from the accumulated maize root biomass in the soil. In another study, double ridges and furrows mulched with plastic film once every two years coupled with no-tillage maintained SOC balance under maize on the semiarid Loess Plateau [6]. Management-induced changes in SOC are difficult to detect in the short term due to the presence of large background amounts of relatively stable SOC [12,20]. However, labile SOC fractions, such as LFOC, MBC, and DOC, can respond rapidly to C supply changes and have been used as sensitive indicators of agricultural management impacts on soil quality due to their high turnover rates [20,21]. HFOC is a more stable SOC fraction with lower C concentrations and can be a major sink for soil carbon storage [22]. Thus, quantitative analysis of SOC and its fractions can be useful for better understanding soil C dynamics and their responses to agricultural management practices [16].
Phosphorus (P) fertilizer application is another technique for improving crop growth and yield on the semiarid Loess Plateau, with its low concentration and poor mobility of soil available P [18]. A long-term study found that 26 kg ha−1 P fertilizer significantly increased alfalfa cumulative dry matter yield by 7.78 Mg ha−1 over 24 years on the Loess Plateau. SOC content also increased due to the increased return of organic materials such as decaying roots, litter, and plant residues to the soil [23]. P application increased stable water aggregation by forming an aluminum or calcium phosphate-binding agent, which protected SOC from soil microbial decomposition [24]. Zhang et al. [25] also found that long-term P addition impeded SOC decomposition in a tropical forest, which could be due to the reduced microbial biomass, fungi-to-bacteria ratio, and C-degrading enzyme activities. However, P application also accelerated the decomposition of recalcitrant organic C by stimulating soil microbial growth and increasing enzyme activities, negatively affecting SOC sequestration [3]. In a subalpine forest, continuous P addition decreased plant lignin contribution and increased microbial necromass contribution to SOC. However, it did not affect total SOC content or its physical and chemical stability [26]. Compared with other nutrients (e.g., nitrogen (N)), the effect of P application on soil C cycling and storage is less debated and somewhat contradictory [3]. Further studies on SOC decomposability and stability are needed in relation to soil C sequestration and soil quality.
SOC decomposability is crucial for understanding future changes in soil carbon storage. SOC decomposition is a CO2 emission process that depends on the physical, chemical, and biological factors, such as abiotic conditions (e.g., soil temperature and moisture), physical protection by soil minerals, the amount and quality of the organic carbon stored, and microbial community dynamics [27,28]. Pires et al. [29] reported that C mineralization increased with increasing temperature; however, a high clay content could protect SOC from microbial decomposition by reducing microbial activity. Although soil mineralization has been used widely to reflect the degree of SOC decomposition and soil microbial activity [14,30], laboratory incubation does not accurately reflect SOC turnover in natural soil [28]. SOC mineralization kinetics is an alternative technique for determining the SOC mineralization process by fitting CO2-C evolution data to kinetic models [31]. Parameters derived from kinetic models can be used as indexes for assessing the relationships between SOC decomposability and chemical composition.
Overall, SOC content, fractions, and decomposition are influenced by many factors, including the tillage method, crop species, length of mulching time, and fertilization. Alfalfa is a common perennial forage legume on the Loess Plateau due to its high forage quality and yield, N-fixation ability, drought resistance, and adaptability to various climatic and soil conditions [16,32]. No-tillage practices coupled with the large amounts of organic materials (litter fall, root exudate, root dieback, etc.) entering the soil resulted in relatively high SOC and C fractions under alfalfa cultivation [5,6]. However, low rainfall, temperature, and soil P availability inhibit alfalfa growth [5,33]. Plastic mulch and P application are two effective management practices for increasing alfalfa forage yield [23,30]. Film mulching and P application are closely related to SOC inputs [19,23] and soil physical, chemical, and biological factors [18,24] and thus influence SOC dynamics and decomposition. However, the combined effect of film mulching and P application on SOC dynamics and decomposability is unclear, especially under alfalfa (Medicago sativa L.). We conducted a six-year field experiment and laboratory incubation experiment to explore the long-term effects of plastic mulch and P application on SOC content, fractions, and decomposability. The hypotheses were: (1) Plastic mulch, P application, and their combined effect increases SOC content and its fractions, especially labile fractions (LFOC, MBC, and DOC); (2) Plastic mulch, P application, and their combined effect decreases SOC decomposability, reflected in SOC mineralization kinetic parameters.

2. Materials and Methods

2.1. Site Description and Experimental Design

The field experiment was conducted from 2011 to 2016 at Lanzhou University’s Semi-arid Ecosystem Research Station on the Loess Plateau, Zhonglianchuan village, Yuzhong County (36°02′ N, 104°25′ E, 2400 m a.s.l.), Gansu Province, China. The site has a medium-temperate semiarid climate, with an annual maximum air temperature of 24.8 °C, annual minimum air temperature of −16.7 °C, mean monthly maximum temperature of 19.0 °C (July), and mean monthly minimum temperature of −8.0 °C (January). The region has low and erratic rainfall. Annual precipitation (1999–2016) averaged 315 mm, of which about 88.6% (279 mm) fell between early April and mid-October (alfalfa growing season). The soil at the field site is a Loess orthic entisols (FAO taxonomy) or rusty dark loessial soil (Chinese soil taxonomy), with pH 8.79, 0.660 g kg−1 LFOC, 5.21 mg kg−1 available P, 79.9 mg kg−1 available potassium, 5.28 g kg−1 SOC, 0.335 g kg−1 total N, and 0.655 g kg−1 total P.
The field experiment had a split-plot design with two film mulching treatments (NM: no film mulching with flat planting, M: film mulching with ridges and furrows) as main plots and four P application levels (P0: 0 kg ha−1, P1: 9.73 kg ha−1, P2: 19.3 kg ha−1, and P3: 28.9 kg ha−1) as subplots. The highest P level reflected the P fertilizer level used to produce the maximum aboveground maize biomass in the local area [33]. CaP2H4O8 was used as the P fertilizer in this study. Before sowing in 2011, each plot received 34.5 kg N ha−1 (applied as urea), and half of each corresponding P level was plowed to 20 cm depth. No fertilizers were applied to the soil except for P in the following years. The ridges were formed and covered with 1.2 m wide plastic film (polyethylene film 0.008 mm thick) by machines on 29 June 2011. At the same time, a local alfalfa (Medicago sativa L.) cultivar, ‘Longzhong,’ was sown at 15 kg ha−1. Each treatment plot was 10 m long and 3 m wide in randomized blocks and replicated three times. Aboveground forage was harvested at the full-bloom stage twice (mid-July and mid-October, respectively) each year. At each harvest, plants from a randomly selected 2 m section of a row were sampled at ground level except for the edge rows. This was repeated three times for each plot. The remaining alfalfa was cut at ground level and removed from plots immediately after alfalfa sampling at each harvest. Thus, minimal plant residues remained to supplement the soil, except for litter fall, root turnover, and root dieback. For more details, please see Gu et al. [33]. The experimental field was a terrace, with ridges built between the adjacent plots to prevent runoff. No manure, irrigation, or herbicide was applied, and the plots were hand-weeded. Before 2011, the experimental field was farmland cultivated with maize (Zea mays L.), potato (Solanum tuberosum L.), flax (Linum usitatissimum L.), and other crops in rotation.

2.2. Soil Sampling and Measurements

Three sub-samples (8 cm diameter by 20 cm depth) of the ridge and furrow soils in each plot were taken randomly at harvest each year and bulked to form a composite soil sample. Root fragments, stones, and plant debris were discarded from the soil samples before passing through a 2 mm mesh sieve. The sieved soil samples were divided into two parts: one was stored at 4 °C for soil microbial biomass C (MBC) and dissolved organic C (DOC) measurements, and the other was air-dried for SOC, total N (TN), LFOC, and HFOC measurements. Soil MBC was determined using the fumigation–extraction method [12,16]. Briefly, two 20 g samples of fresh soil were weighed. One portion was fumigated by purified CHCl3 for 24 h. Both fumigated and non-fumigated soil samples were mixed with 80 mL of 0.5 mol L−1 K2SO4 and shaken at 200 rpm for 1 h. After extraction, the filtrate was used to determine C using a CHN Analyzer (LECO CHN–1000, St. Joseph, MI, USA). The MBC was based on differences between total organic C in chloroform-fumigated and non-fumigated soil samples, using a KEC factor of 0.45. The concentration of total organic C in the non-fumigated samples was defined as DOC [34]. SOC was determined using the Walkley and Black dichromate oxidation method, and a factor of 1.3 was multiplied to make organic carbon comparable with that determined by dry combustion [35]. TN was determined using semi-micro-Kjeldahl digestion in the presence of catalysts (K2SO4:CuSO4:Se = 100:10:1), followed by titration with a diluted sulfuric acid solution [30]. LFOC and HFOC were measured following the density fractionation method [10,16,19]. In brief, 20 g air-dried soil (<2 mm) was placed in a 250 mL centrifuge tube with 50 mL NaI solution (1.8 g cm−3). After shaking and centrifuging, the supernatant with floating particles was collected on a 0.45 μm hydrophilic polyvinylidene fluoride filter under a vacuum, and the NaI solution was collected for reuse. The light fractions were then washed three times with deionized water. Then, 100 mL of deionized water was placed in the above centrifuge tube. After shaking and centrifuging, the supernatant was discarded. This process was repeated three times to obtain heavy fractions. The light and heavy fractions were oven-dried at 60 °C for 24 h and 48 h, respectively, weighed and stored for analysis. The Walkley and Black dichromate oxidation method was used to determine organic C in the light and heavy fractions (ground to <0.15 mm). Soil samples were also collected in July 2015 during the first alfalfa harvest to measure SOC mineralization in a 175-day aerobic incubation experiment under controlled conditions [30], with the CO2-C evolution data fitted to kinetic models. Briefly, 10 mL of 1 mol L−1 NaOH prepared with CO2-free distilled water was placed to trap CO2. After 1, 2, 3, 5, 7, 9, 12, 15, 18, 23, 28, 33, 40, 48, 55, 62, 70, 77, 91, 105, 119, 133, 147, 161, and 175 days, the NaOH solution was replaced, and the CO2 trapped in NaOH was determined by back titration of the excess alkali with standard 0.25 mol L−1 HCl after precipitating the carbonate with 1 mol L−1 BaCl2 solution [30]. All calculations were expressed on an air-dry basis. Cumulative SOC mineralization over 175 days (Cm), average mineralization rate, metabolic quotient (qCO2), and SOC mineralization intensity (SOCmin) were calculated as follows [27,36,37]:
Cm = ∑Ri
Average mineralization rate = Average (R1 + R2 + R3 + R5/2 + R7/2 + R9/2 + R12/3 + R15/3 + R18/3 + R23/5 + R28/5 + R33/5 + R40/7 + R48/8 + R55/7 + R62/7 + R70/8 + R77/7 + R91/14 + R105/14 + R119/14 + R133/14 + R147/14 + R161/14 + R175/14)
qCO2 = ∑Ri/175/MBC
SOCmin = Cm/SOCinitial
where Ri is CO2 release at day i, i = 1, 2, 3, 5, 7, 9, 12, 15, 18, 23, 28, 33, 40, 48, 55, 62, 70, 77, 91, 105, 119, 133, 147, 161, and 175. SOCinitial is SOC content before the mineralization process.

2.3. Kinetic Models

Six different models were used to determine SOC mineralization kinetics (Table 1), with the best fitting model used to describe CO2-C evolution data. The size and decomposition rate constants of different SOC pools were estimated from a non-linear curve to analyze cumulative CO2-C evolution during the 175-day incubation. Most of the kinetics models hypothesized the existence of various SOC pools with different stability degrees, such as active, slow, and resistant. The resistant pool was not included in this study as it is unlikely to contribute significantly to SOC mineralization over a relatively short incubation [38]. For each model, Ct (mg CO2-C kg−1 soil, dependent variable) is the cumulative CO2-C mineralized during time t (days, independent variable). C0, C1, and C2 are the potential, active, and slow mineralization SOC pools (mg CO2-C kg−1 soil), respectively, and k, h, and m are the respective instantaneous mineralization rate constants (d−1).
The zero-order model does not define the number of SOC mineralization pools and assumes a linear relationship between CO2-C evolution and incubation time [39]. The first-order model is based on the hypothesis that SOC mineralization rate is proportional to the size of the mineralized pool (dC/dt = −kC), termed SOC mineralization potential (C0) [40]. The first-order E model uses an additional parameter C1 as a separate pool of easily decomposable substrate that produces a mineralization flush during the first incubation interval [41]. The first-order two-component simultaneous reactions model [38,40] assumes that SOC is divided into two components, an active fraction (C1) and a slow fraction (C2), both decomposing exponentially at their specific rate constants (k and h, respectively). Beauchamp et al. [42] proposed a special model that considers an active pool decomposing with an exponential kinetic and a slow pool decomposing linearly. The parabolic function Ct = ktm describes net mineralization with an exponential kinetic, which provides a good data fit [43]. In this model, k and m are constants, where k characterizes the units used for the variables and m is the shape of the curve.

2.4. Statistical Analyses

An analysis of variance (ANOVA) was conducted on the response variables in randomized blocks of the split-plot design. The effect of time (2012, 2013, 2014, 2015, and 2016), film mulching, and P application on SOC, soil TN, soil C/N ratio, and SOC fractions (LFOC, HFOC, MBC, and DOC) were analyzed by repeated-measures ANOVA. The differences for all tests were considered significant at p ≤ 0.05 (*), p ≤ 0.01 (**), and p ≤ 0.001 (***), with the least significant difference (LSD) used at the 95% probability limit. Data analyses were undertaken using GenStat 18th (VSN International Ltd., Rothamsted, UK), with the graphs created in Origin 9.2 (OriginLab OriginPro 2015, USA). A non-linear least-squares regression analysis was performed to calculate SOC mineralization kinetics parameters from CO2-C evolution data [44] using 1stOpt software, version 1.5 (First Optimization, 7D-Soft High Technology Inc., Xi’an, China) [45]. We used the Levenberg–Marquardt method with an iterative process and the maximum iteration to determine the best fit line. Principal component analysis (PCA) was performed using CANOCO 5.0 software to determine linkages among parameters. Linear regression analysis determined the relationship between SOC and P application levels under no film mulching. A quadratic model was fitted to determine the relationship between SOC and P application levels under film mulching and the optimum P application level for maximum SOC. All determinations are means of three replicates.

3. Results

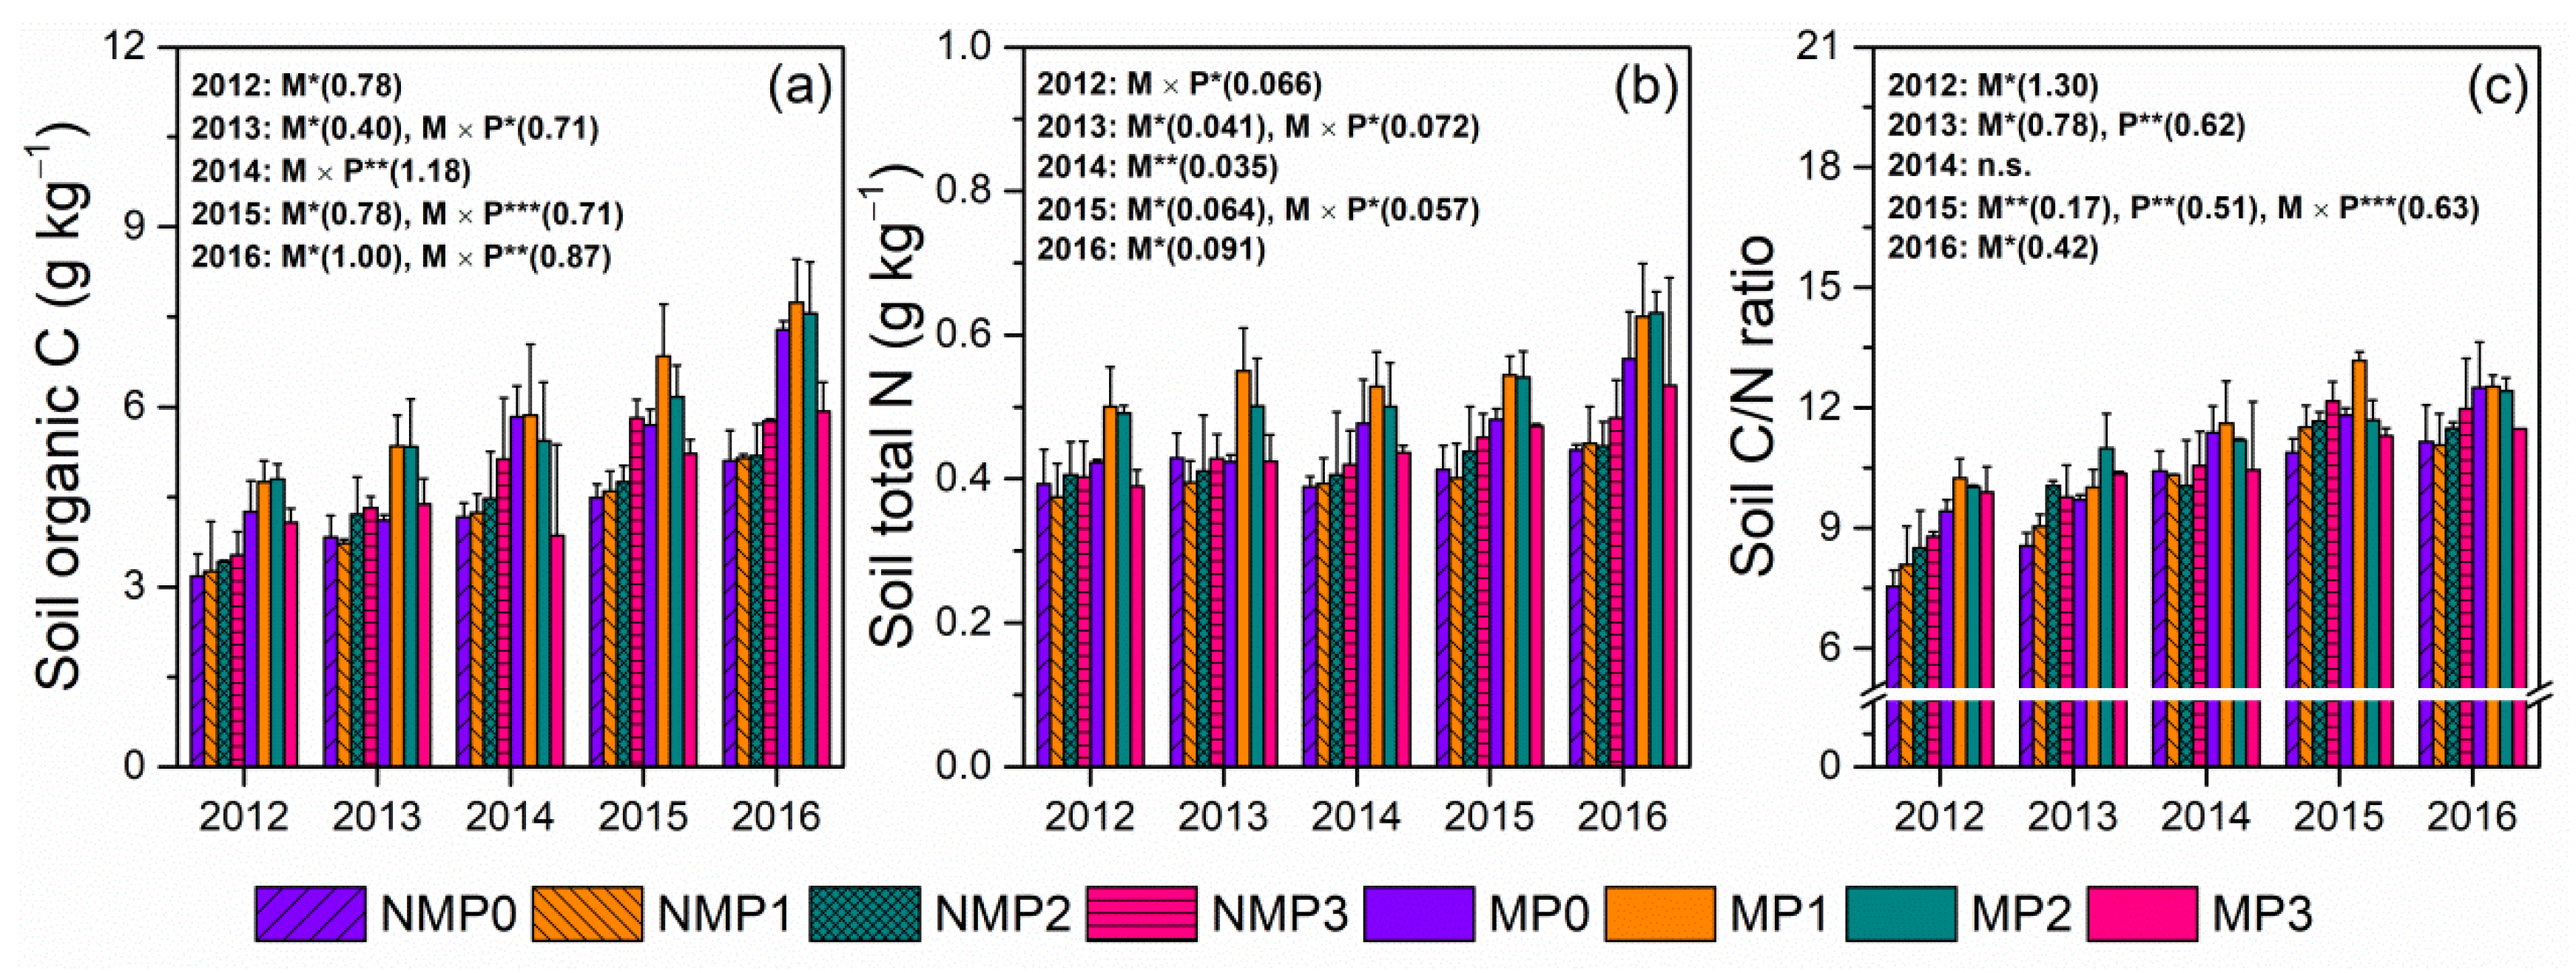
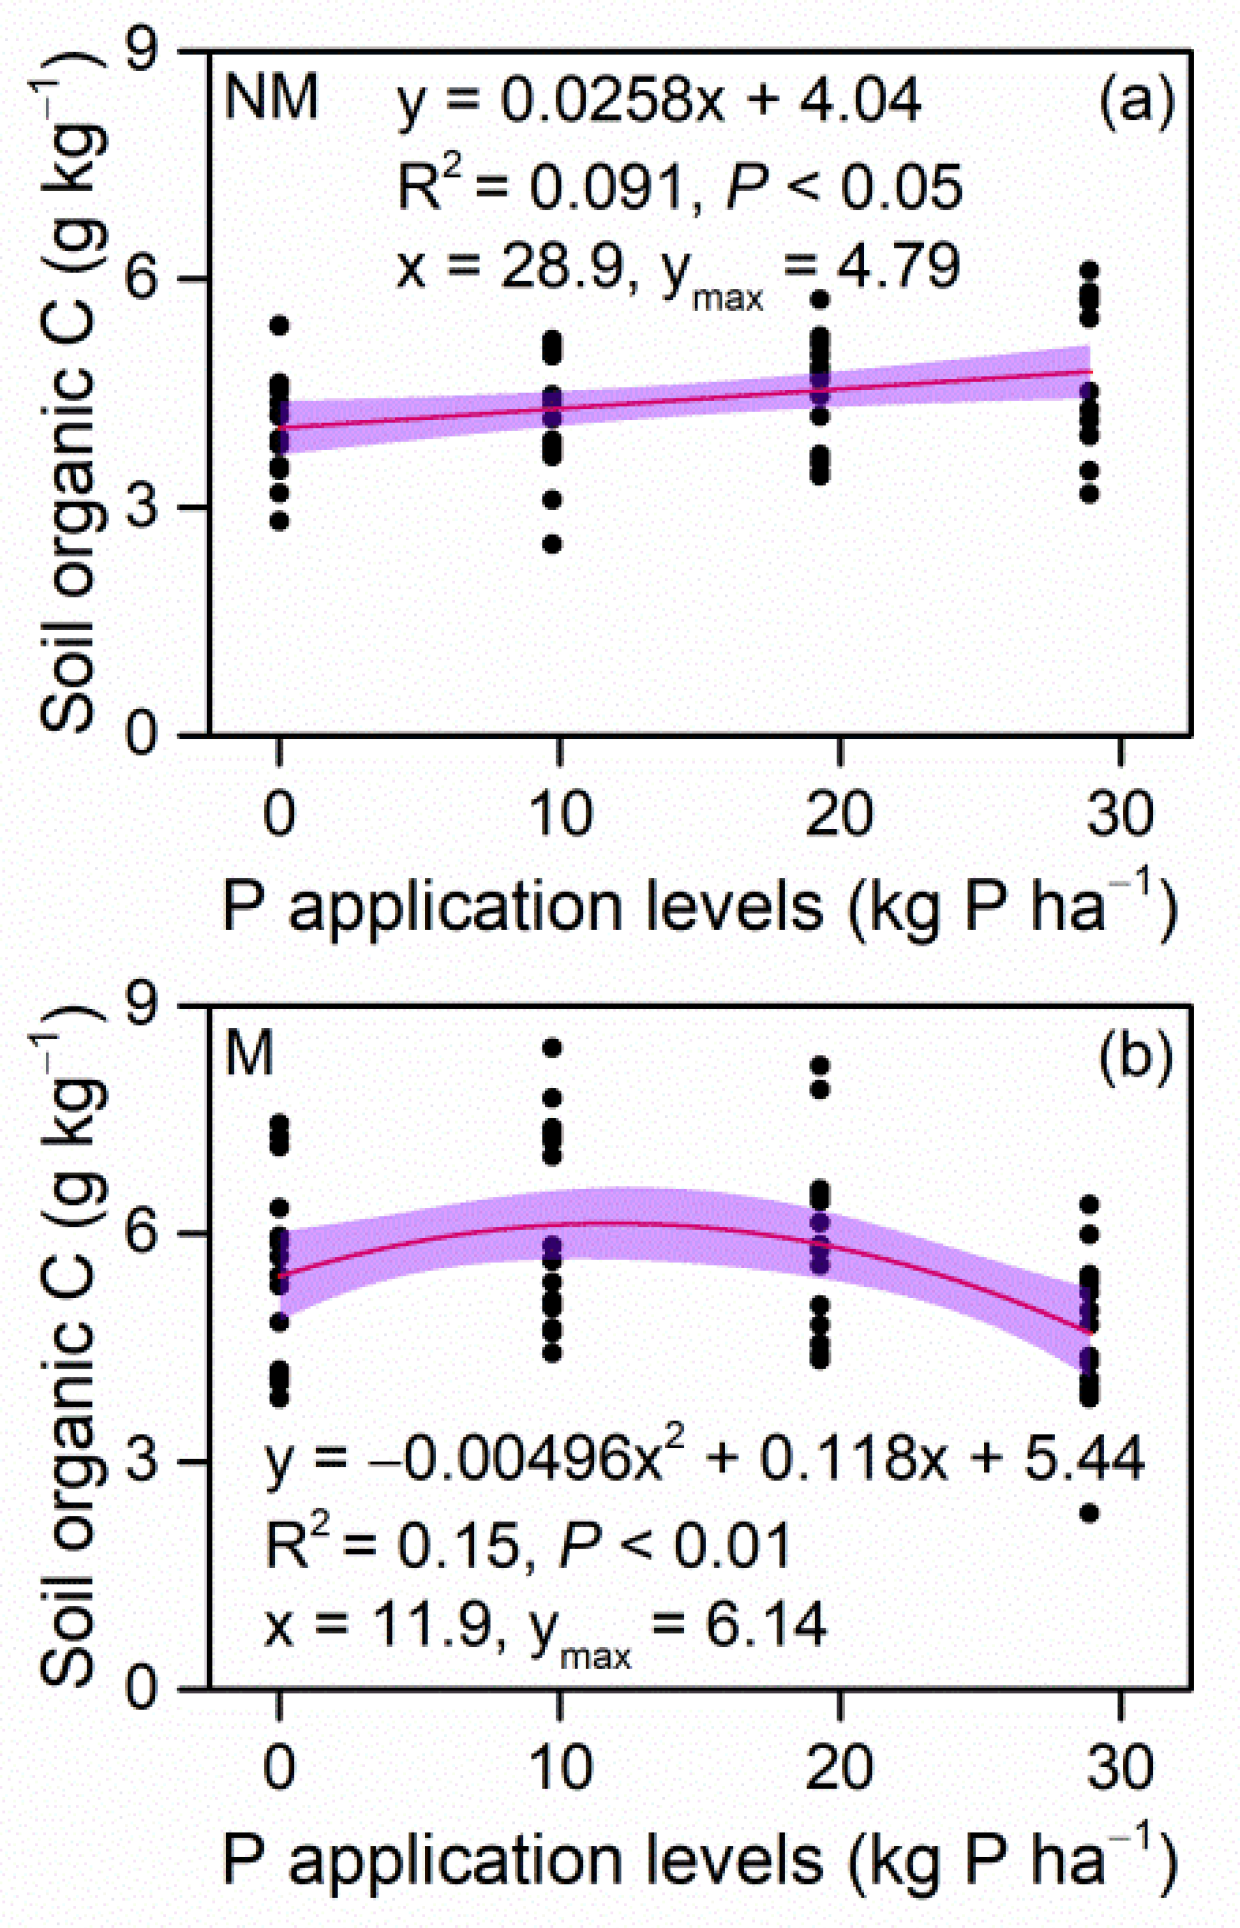
3.1. Soil Organic Carbon and Total Nitrogen

SOC, TN, and soil C/N ratio (SOC to TN ratio) increased significantly over time (Table 2, Figure 1). Film mulching significantly increased SOC in P0, P1, and P2 but not in P3, except in 2014 (Figure 1a). Film mulching significantly increased TN in P0, P1, and P2 but not in P3, except in 2012 (Figure 1b). P application did not significantly affect SOC or TN. Film mulching significantly increased soil C/N ratio in P0, P1, and P2 but had no effect in P3, except in 2014 (Figure 1c). With increasing P levels in 2013 and 2015, the soil C/N ratio increased under no film mulching but increased initially and then decreased under film mulching. The MP1 treatment had the highest SOC, TN, and soil C/N ratio.
Film mulching significantly increased SOC, and a linear and quadratic polynomial model well-fitted SOC with P application level as the independent variable under no film mulching and film mulching, respectively (Figure 2). The highest SOC (6.14 g kg−1) occurred under film mulching plus 11.9 kg ha−1 applied P, with higher P levels not increasing SOC.

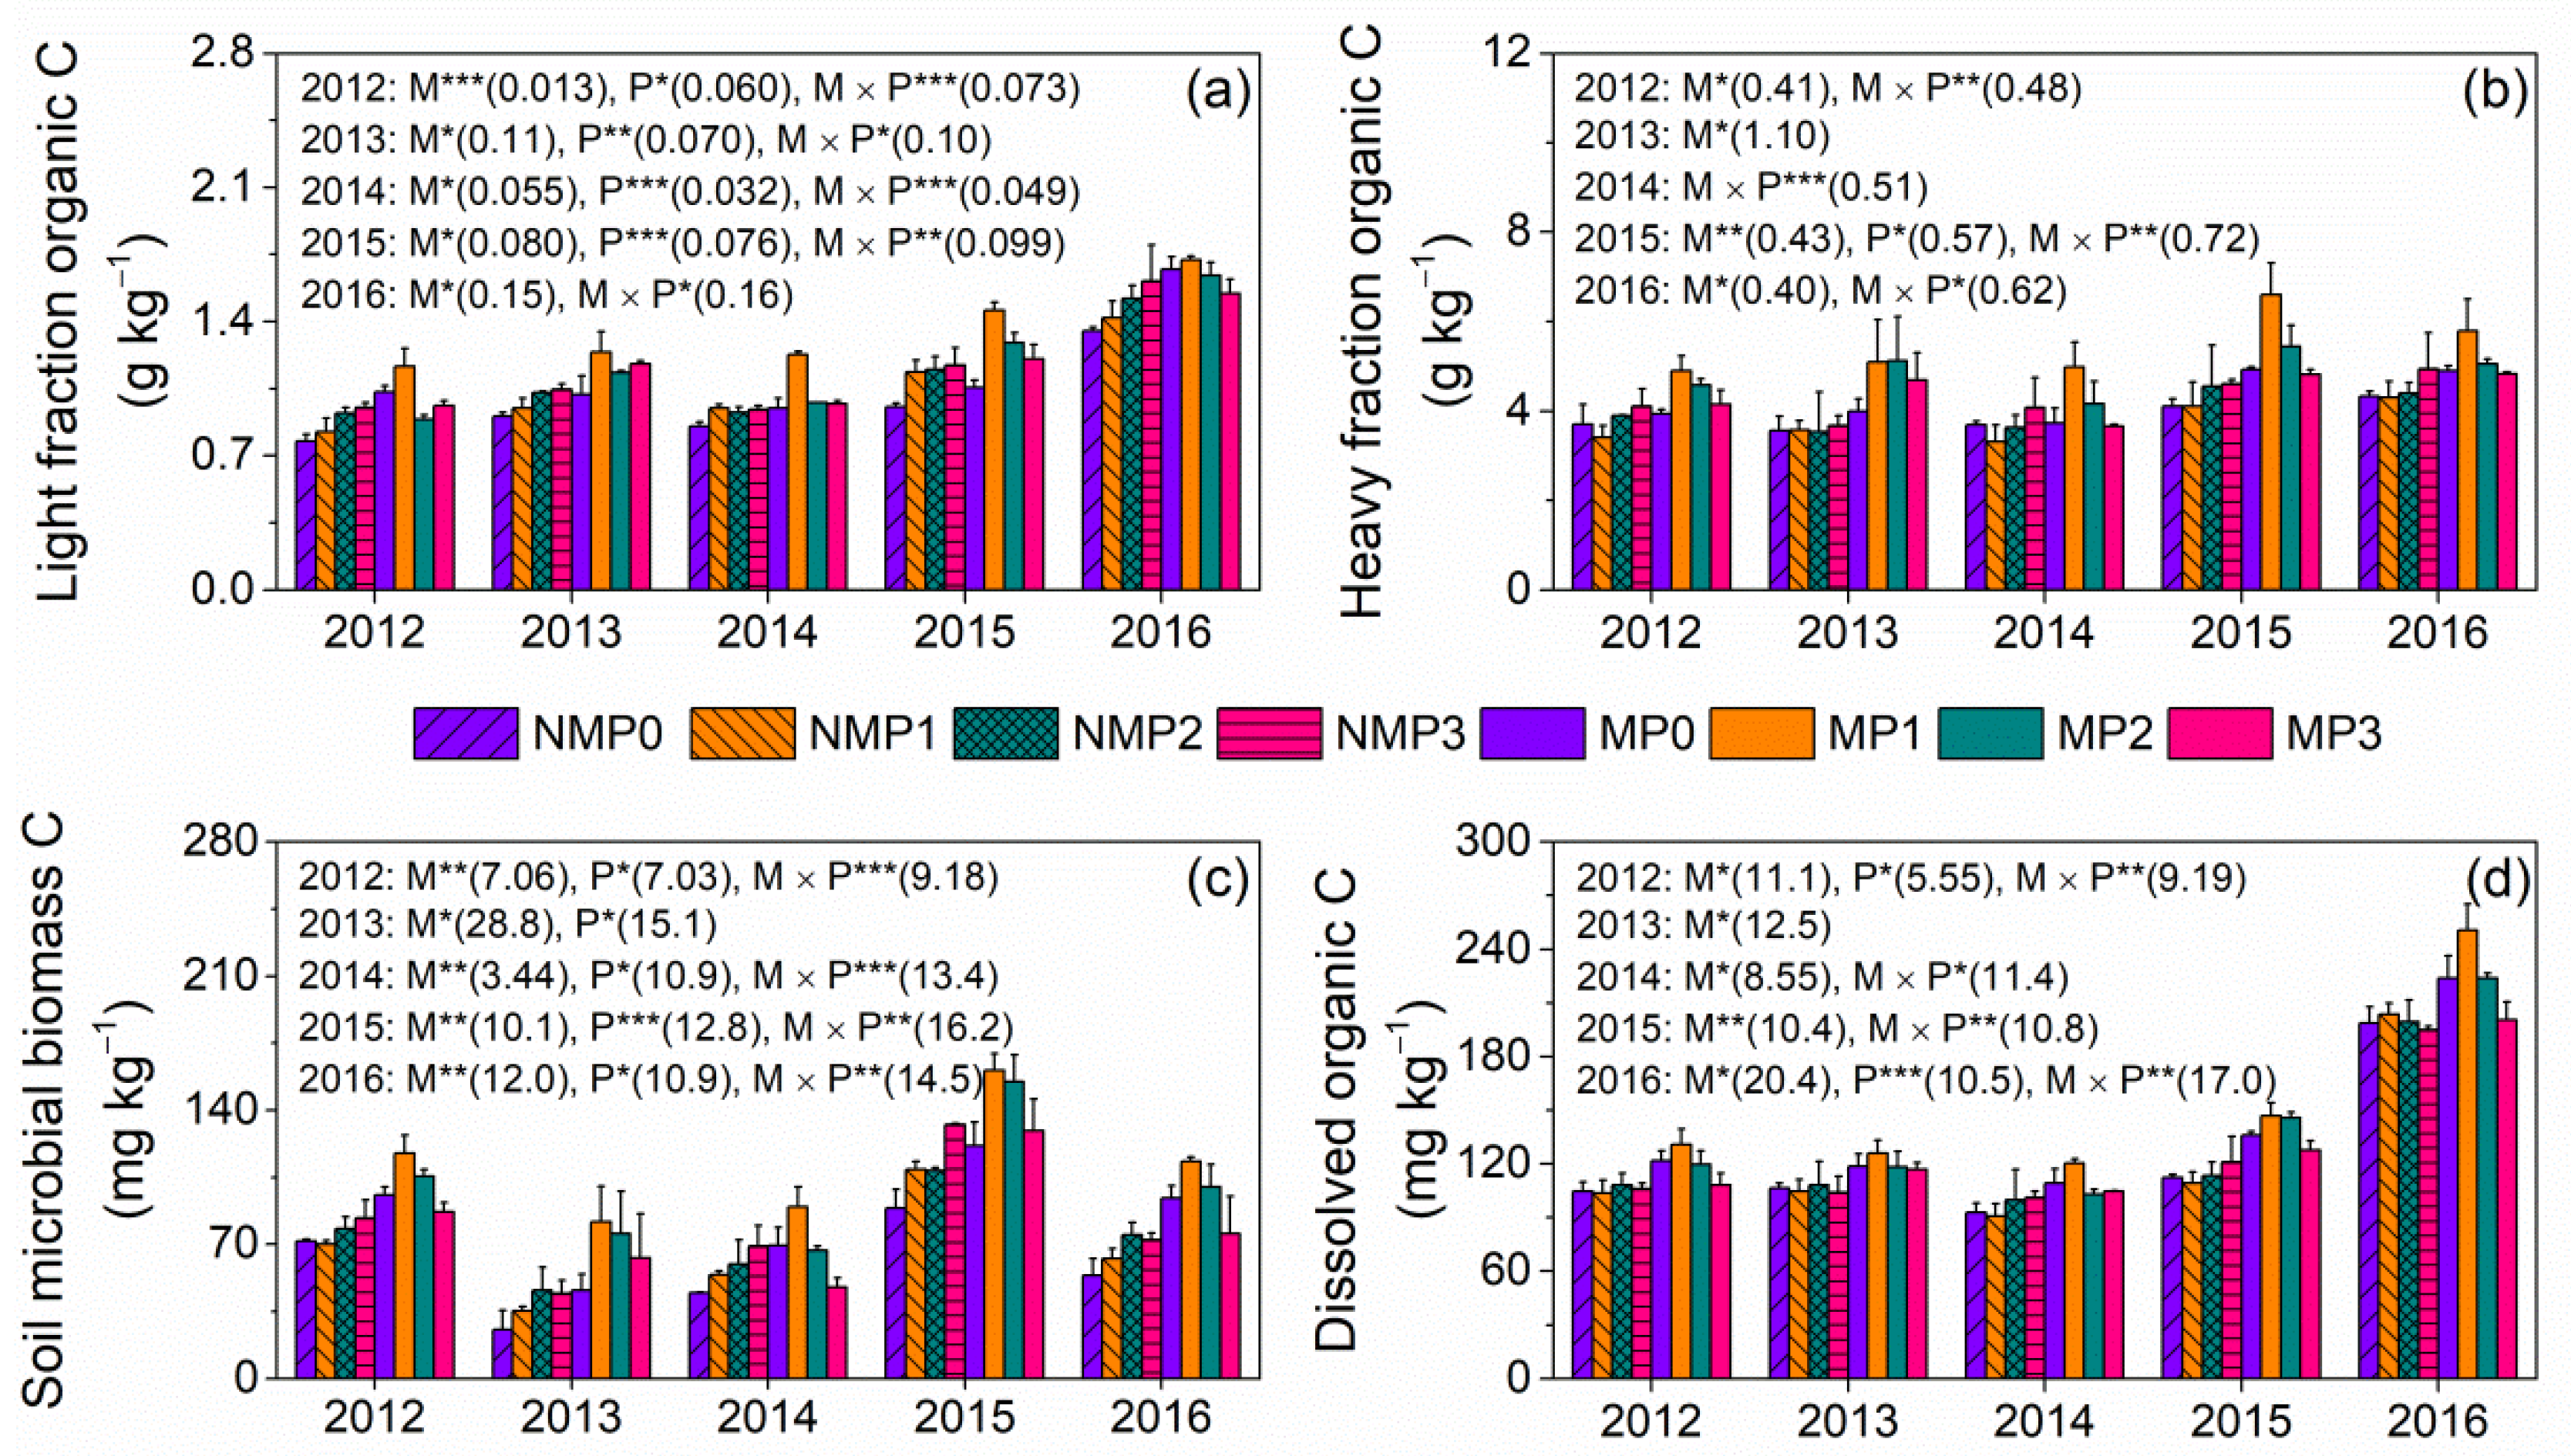
3.2. Soil Organic Carbon Fractions

LFOC increased significantly from 2012 to 2016 (Table 1, Figure 3). Film mulching significantly increased LFOC and HFOC in P0, P1, and P2 but not in P3, except for HFOC in 2014 (Figure 3a,b). LFOC increased with increasing P level under no film mulching and increased initially and then decreased with increasing P level under film mulching. The MP1 treatment had the highest LFOC and HFOC except for HFOC in 2013. Film mulching produced significantly higher MBC in P0, P1, and P2 than no film mulching but had no effect in P3 (Figure 3c). MBC increased significantly with increasing P level under no film mulching and increased initially and then decreased with increasing P level under film mulching. Film mulching produced significantly higher DOC in P0, P1, and P2 than no film mulching but had no effect in P3 (Figure 3d). The MP1 treatment had the highest MBC and DOC, except for 2013.

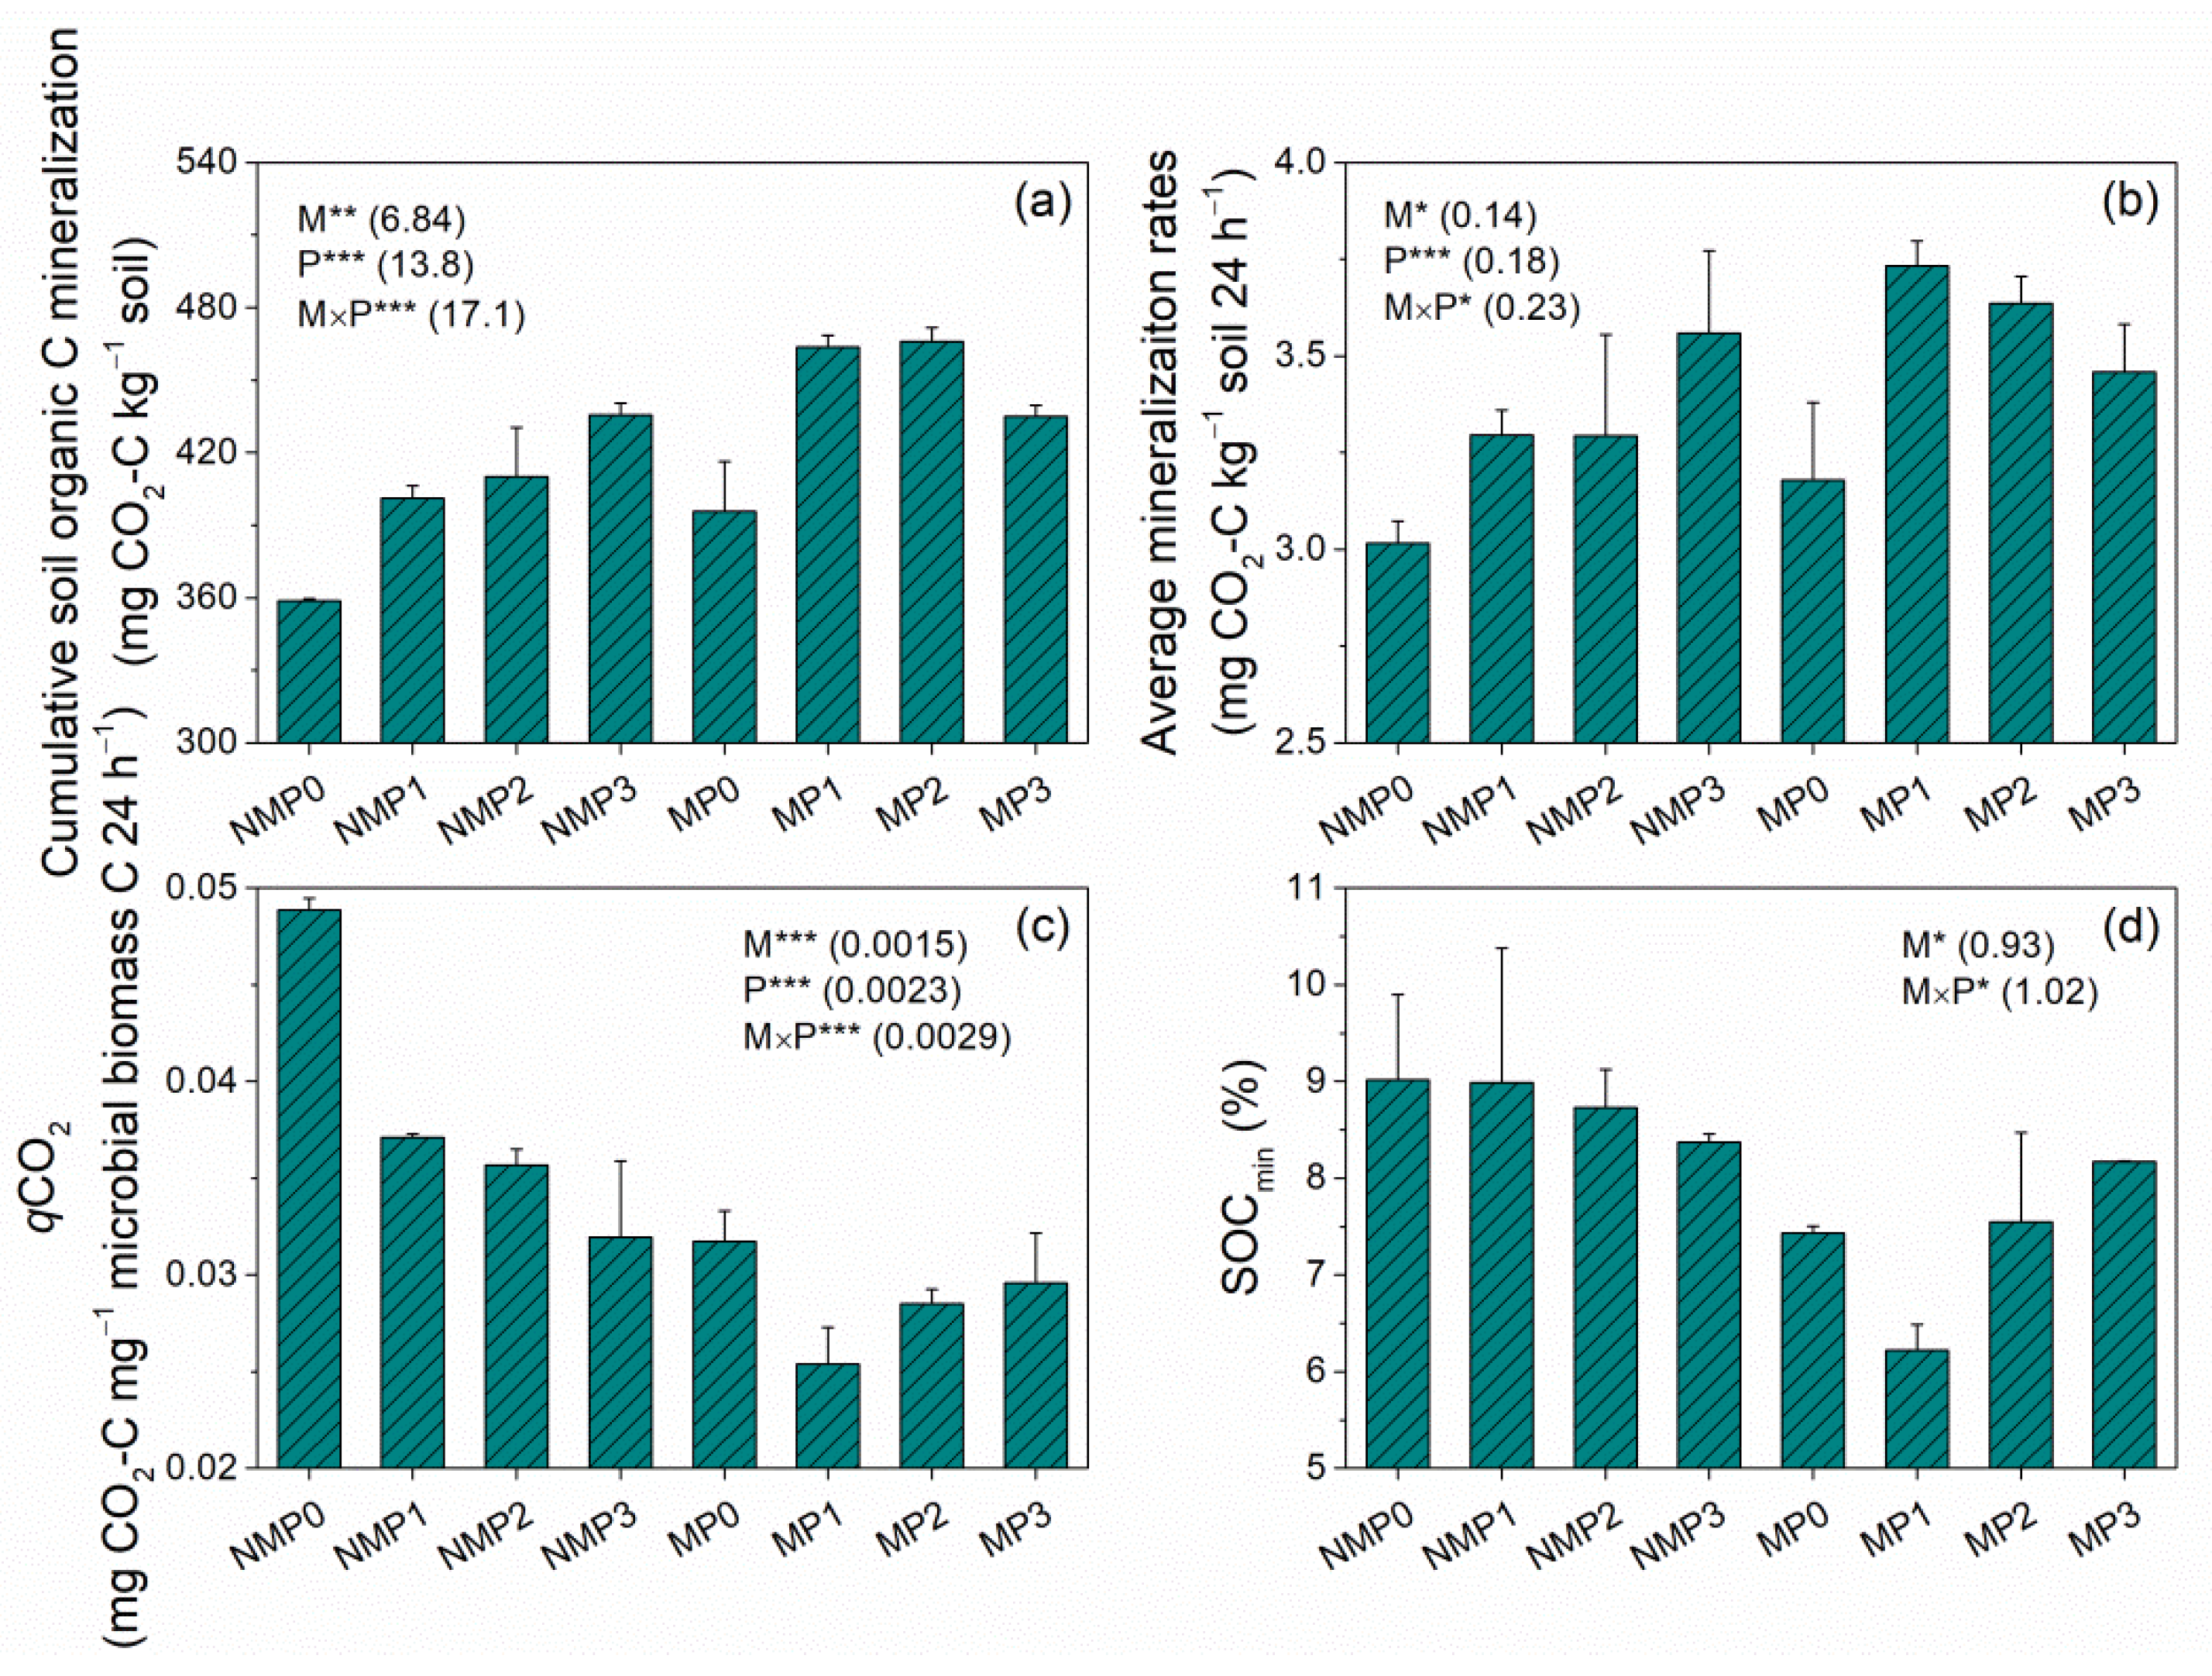
3.3. Soil Organic Carbon Mineralization

Film mulching significantly increased cumulative SOC mineralization (Cm) and average mineralization rates over time (175 days) in P0, P1, and P2 but not in P3 (Figure 4a,b). Cm and average mineralization rates increased with increasing P level under no film mulching but followed an inverted parabolic shape under film mulching; the MP1 treatment had the highest values, and NMP0 had the lowest values. Cm and average mineralization rates ranged from 358mg to 472 mg CO2-C kg−1 soil and 2.96mg to 3.77 mg CO2-C kg−1 soil 24 h−1, respectively. Film mulching produced significantly lower qCO2 than no film mulching across P levels (Figure 4c). qCO2 decreased with increasing P level under no film mulching and decreased initially and then increased with increasing P level under film mulching. Film mulching significantly decreased SOCmin across P levels (Figure 4d). The NMP0 treatment had the highest qCO2 and SOCmin, and the MP1 treatment had the lowest.

3.4. Soil Organic Carbon Mineralization Kinetics

SOC mineralization dynamics were monitored over 175 days under laboratory incubation. Six kinetic models commonly used to interpret mineralization data were evaluated for goodness-of-fit to describe the SOC decomposition process. The determination coefficients (R2) used to compare the kinetic models are in Table 2. The six models offered sufficient descriptions of SOC mineralization (R2 ≥ 0.98). The first-order two-component simultaneous reactions model [Ct = C1 (1 − e−kt) + C2 (1 − e−ht)] was the most appropriate (R2 = 0.9998), followed by the special model [Ct = C1 (1 − e−kt) + ht] (R2 = 0.9996). Therefore, we used the first-order two-component simultaneous reactions model to interpret the SOC mineralization process. This model assumes that SOC can be divided into two components with different degrees of decomposability: an active SOC pool (C1) and a slow SOC pool (C2), with mineralization rate constants k and h, respectively.
The parameters calculated from the first-order two-component simultaneous reactions model are in Table 3. The C1 fraction was smaller than the C2 fraction, averaging 355 and 9308 mg kg−1, respectively. The mineralization rate constant k of the active SOC pool was faster than the slow SOC pool mineralization rate constant h, averaging 106 × 10−3 and 2.09 × 10⁻³ d−1, respectively. For the active SOC pool, the mineralization rate constant k and mean residence time MRTk did not differ between treatments. Film mulching had a significantly lower pool size C1 than no film mulching across P treatments. C1 increased significantly with increasing P level under no film mulching and increased initially and then decreased under film mulching. For the slow SOC pool, the mineralization rate constant h, mean residence time MRTh, and pool size C2 significantly differed between P treatments. The mineralization rate constant h decreased significantly with increasing P level under no film mulching and decreased initially and then increased under film mulching. At the same time, the reverse was true for mean residence time MRTh. C2 increased significantly with increasing P application under no film mulching and increased initially and then decreased under film mulching; the MP1 treatment had the highest C2. The percentage of the more active pool relative to total mineralization carbon [C1/(C1 + C2)] was slightly lower under film mulching (3.33%) than no film mulching (4.12%); the NMP0 treatment had the highest value (4.50%), and the MP1 treatment had the lowest value (2.98%).

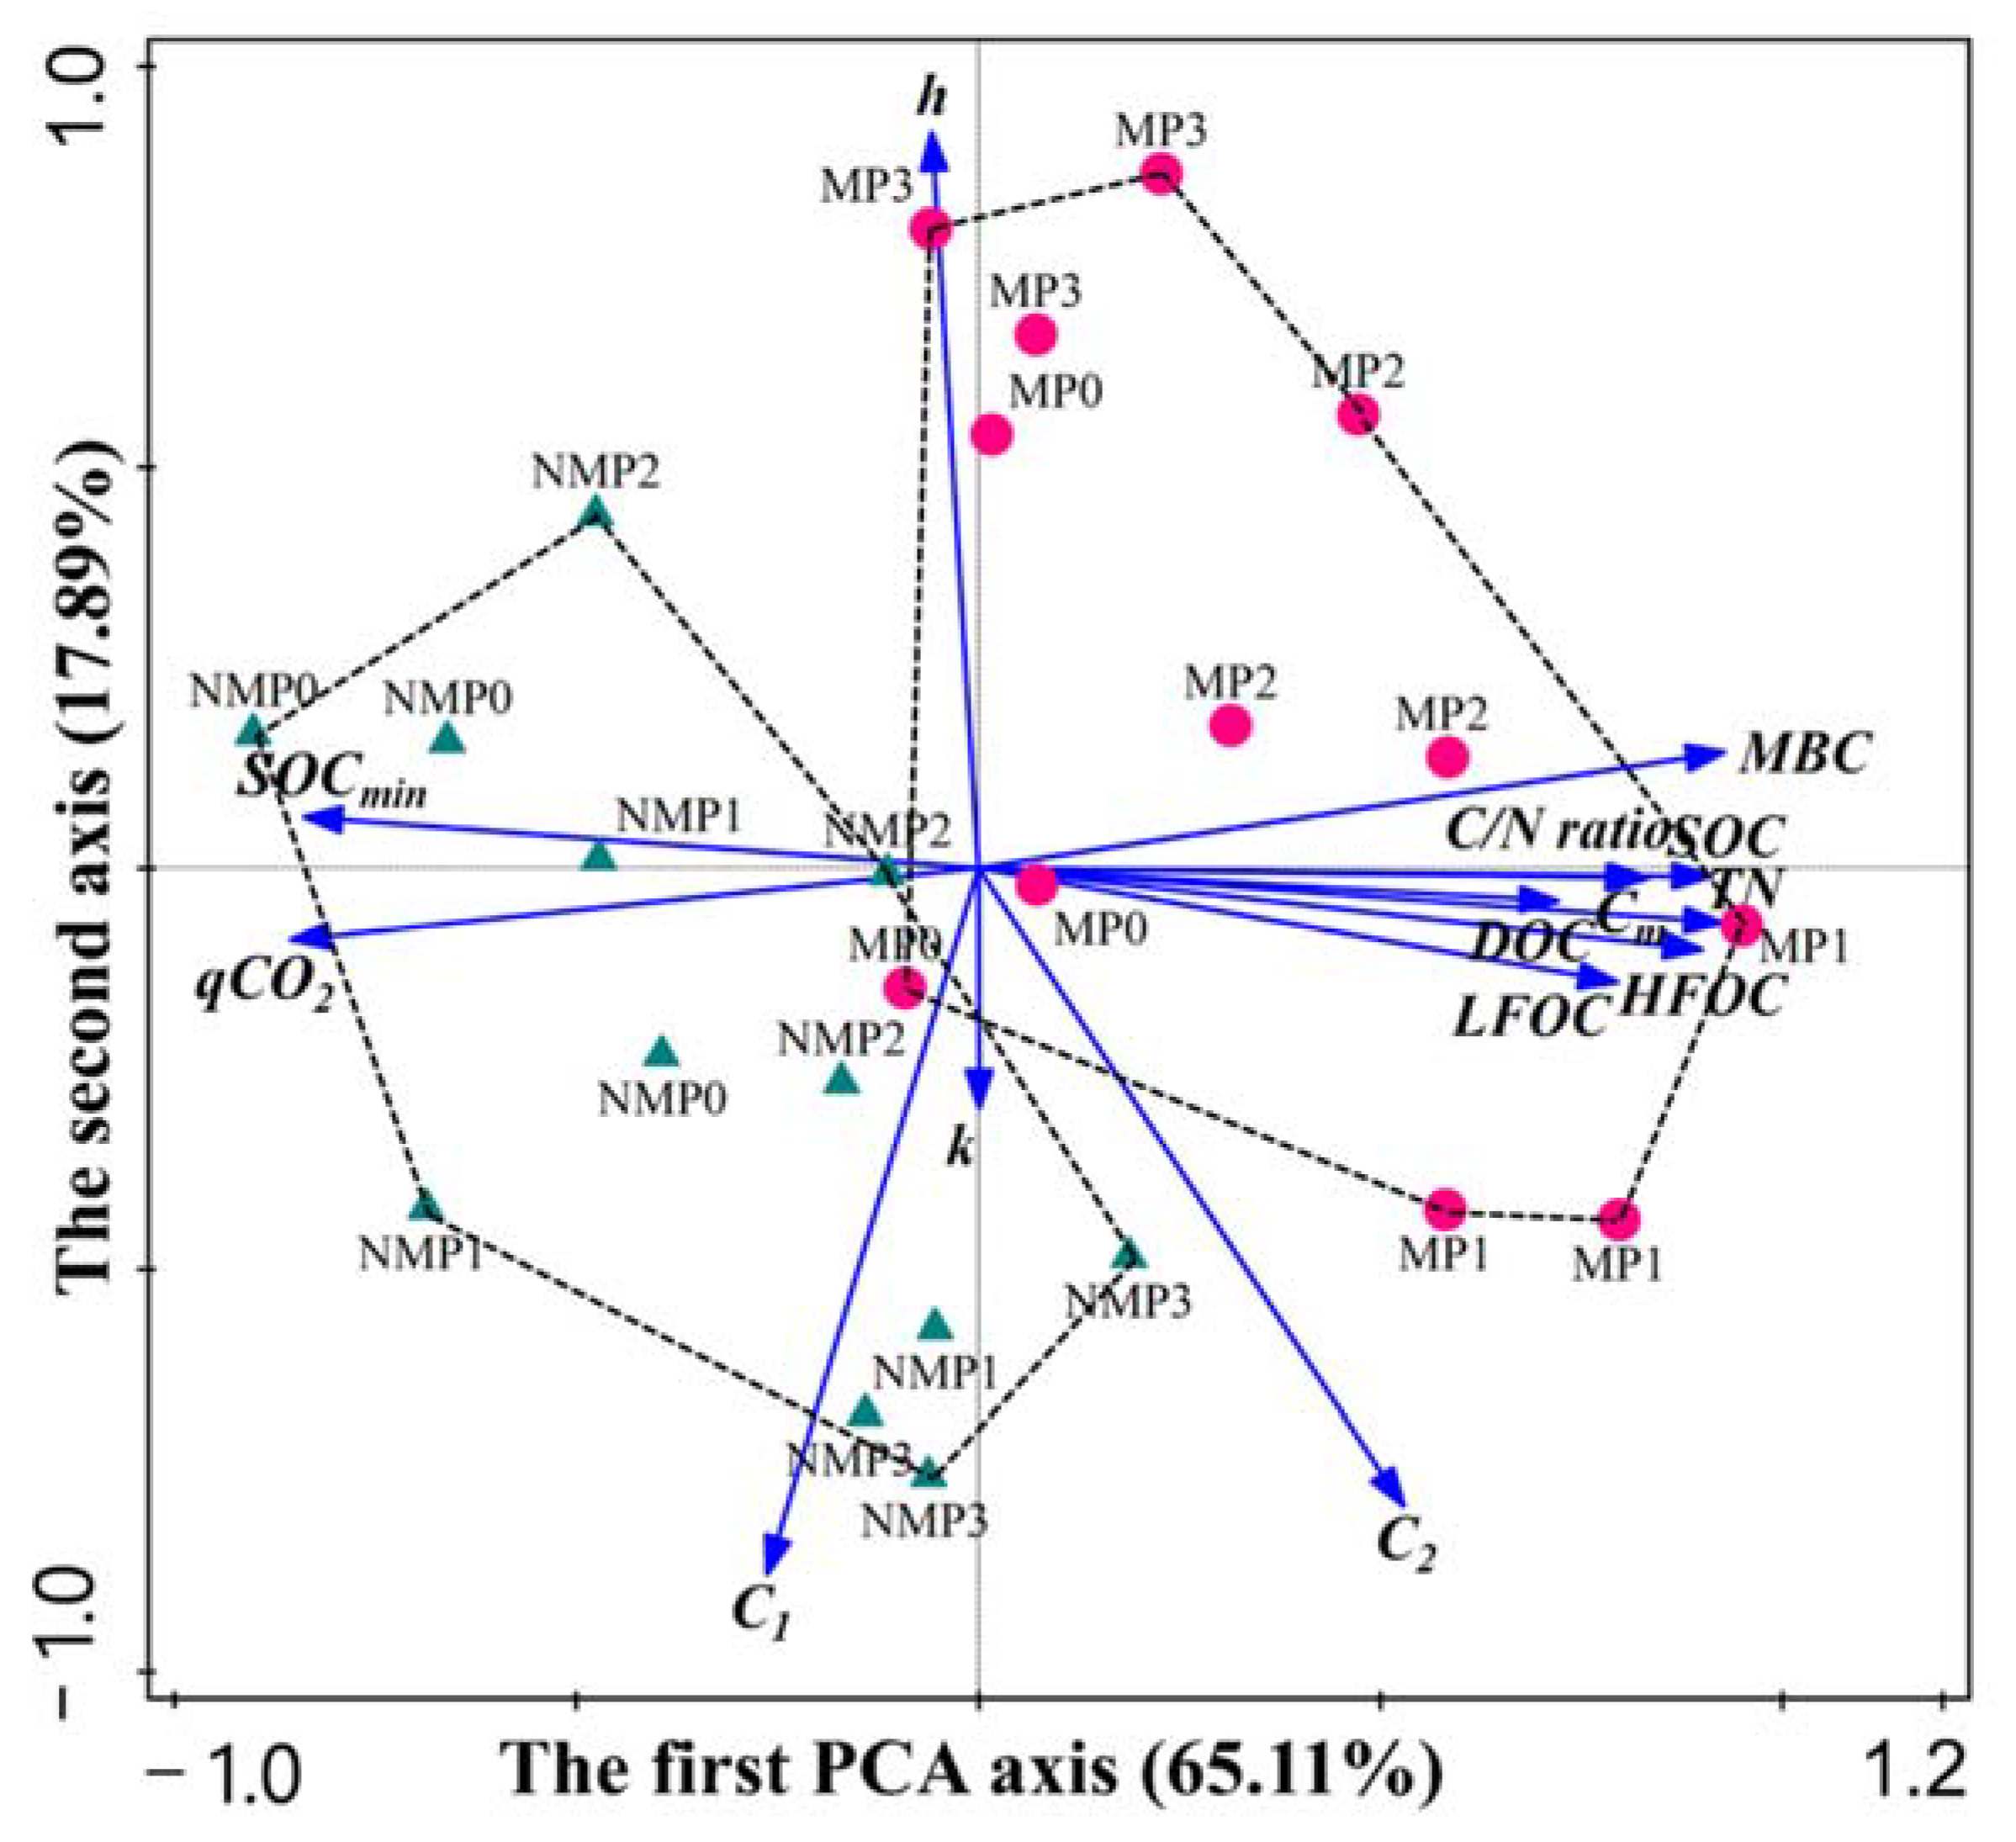
3.5. Principal Component Analysis (PCA) of SOC Fractions, SOC Mineralization, and SOC Mineralization Kinetic Parameters

The PCA was performed for the 14 major parameters in all treatments (Figure 5). The first two PCA axes explained 83% of the total variance, with the first PCA axis accounting for 65.11% and the second accounting for 17.89% of the variation. The first axis showed a high correlation between SOC content, SOC fractions, mineralization, and the slow SOC pool (C2). The second axis showed a high correlation between SOC mineralization kinetic parameters. Figure 5 shows that the first two principal components divide the samples into two groups (film mulching and no film mulching), suggesting that the two treatments strongly affected SOC fractions, SOC mineralization, and SOC mineralization kinetic parameters. In addition, film mulching, especially the MP1 treatment, positively correlated with SOC fractions, SOC mineralization, and the slow SOC pool (C2) and negatively correlated with qCO2 and SOCmin.

4. Discussion

4.1. Soil Organic Carbon and Its Fractions

The SOC pool represents a dynamic equilibrium of gains/inputs and losses/outputs that can be enhanced by mulching, water harvesting, conservation tillage, and integrated nutrient management, including applied manure, compost, biosolids, and chemicals [1]. We previously found that alfalfa forage yield increased with film mulching, linearly with increasing P level under no film mulching, and well-fitted by a quadratic model with P level as the independent variable under film mulching [30]. Despite removing aboveground forage from the field twice a year, leaving minimal plant residues to supplement the soil (except litter fall), root-derived C inputs contributed considerable SOC through root turnover and root dieback [19]. On the one hand, the improved N and P availability under no film mulching and improved soil water, temperature, and N and P availability under low P level with film mulching (MP1 treatment) [6,30,33], increased alfalfa forage yield. Additionally, the organic material (litterfall and root turnover) returned to the soil, increasing SOC content to a certain extent. On the other hand, the decreased soil microbial activities at high P levels with film mulching reduced SOC mineralization and, thus, soil inorganic N content [30]. The low soil N availability limited alfalfa growth and reduced the number of organic materials returned to the soil, decreasing SOC content at high P levels with film mulching. Therefore, SOC increased linearly with P application level under no film mulching. Film mulching and low P level, especially 11.9 kg P ha−1, will improve SOC and conserve non-renewable resources (P) and is thus an environmentally friendly and sustainable agricultural management practice. Li et al. [47] reported a positive feedback loop between SOC and soil C/N ratio in a mulching agroecosystem in typical Loess soil, as reflected by the increased SOC and soil C/N ratio over time in the present study. Film mulching produced a significantly higher soil C/N ratio than no film mulching, indicating that SOC increased faster under film mulching than no film mulching. Generally, the soil C-to-nutrient ratio determines whether nutrients are immobilized in microbial biomass or mineralized to become available for plant uptake [5,48]. In soil possessing a high C to N ratio, soil microbes immobilize N and compete with plants for N [30]. Therefore, film mulching reduced soil N losses relative to no film mulching due to the higher soil C/N ratio and N immobilization [47], significantly increasing TN. Thus, film mulching could be used to increase SOC and soil C/N ratio, maintaining soil quality and reducing soil N losses in alfalfa production on the semiarid Loess Plateau [30].
An appropriate density cut-off provides LFOC with maximum organic material and minimum contamination by mineral material [49]. This study had a higher LFOC proportion (~24%) in SOC than other alfalfa [5] and maize [10] fields on the semiarid Loess Plateau, which could be attributed to the greater light fraction recovery from using a higher density of the NaI solution (1.80 vs. 1.70 g cm−3). HFOC dominated in SOC (~76%), more than the ~60% reported for grass coverage and no-tillage systems [2], indicating that this study had effective agricultural management for long-term SOC storage [22]. Film mulching increased SOC due to the large organic material inputs (senescing root tissue and plant residues), increasing LFOC and HFOC [10,34,50]. Similar to other studies [21,34], LFOC increased with increasing P application in the short term because the C supply changed. The labile organic carbon fraction responded rapidly to changes in C supply [51]. Increasing SOC over time indicates an active carbon component conversion in the soil, reflected in the gradual increase in LFOC from 2012 to 2016. Yu et al. [8] and Malhi et al. [9] reported that the labile fraction is more sensitive to land-use changes than the recalcitrant fraction. SOC responded to agricultural management due to its transient nature. However, in this study, HFOC increased significantly over a relatively short period under film mulching, which might be because the long turnover time of the resistant fraction only applies to steady-state conditions [52]. The conversion of cropland to an alfalfa field activated this fraction, which did not stabilize over six years (2011–2016). MBC is a sensitive indicator for SOC dynamics, with an important role in decomposing and humifying SOC [53]. Film mulching and P application provide more substrates for soil microbial proliferation by improving alfalfa growth in rainfall, temperature, and P-limited environments [10,34], increasing MBC. This indicates that organic inputs drive soil microbial biomass due to their heterotrophic nature [11,37]. Soil microbial biomass not only drives nutrient cycling and turnover but also acts as a nutrient repository in soil. Living and dead microbial organisms contribute to SOC sequestration [54]. The increased microbial biomass improved SOC transformation and stabilization [12,16], reflected in the increased LFOC and HFOC with film mulching and P application. DOC comprises organic compounds present in soil solution through direct dissolution, leaching, desorption from soil surfaces, or microbial processes [15,21]. The DOC content depends on its rate of supply, rate of biological decomposition, and soil adsorption characteristics. Film mulching increased DOC content, possibly due to the improved soil water and temperature conditions benefiting microbial reproduction and soil organic matter decomposition and thus increasing soluble carbon [51]. Microbial metabolites contribute significantly to the soluble C pool [51]. The DOC in October 2016 was higher than in the other years, possibly due to the decreased MBC.

4.2. Soil Organic Carbon Mineralization

SOC mineralization is the most popular method for estimating soil microbial activity and substrate decomposability [55]. However, soil microbial activity can be evaluated using other parameters, such as soil microbial biomass. Film mulching and P application increased organic inputs and soil MBC, stimulating soil microbial activity and thus increasing SOC mineralization [10]. Adverse living environments, such as low organic inputs and soil MBC, decreased SOC mineralization at high P levels under film mulching. The metabolic quotient (qCO2, CO2-C respired 24 h−1 per unit MBC) is an important indicator of soil microbial efficiency for using carbon energy [37] and the degree of substrate limitation for soil microbes [11]. Film mulching had a higher SOC utilization efficiency of soil microbes than no film mulching due to the lower qCO2; the MP1 treatment had the highest SOC utilization efficiency. The higher qCO2 under no film mulching might be due to unfavorable conditions for soil microbes [56], such as a low supply of organic materials, decreased microbial biomass, and decreased use efficiency for C substrates [11]. In such perturbed conditions, soil microbes use more carbon energy for cell integrity and maintenance than growth [37]. The low qCO2 under film mulching and P application reflected a more efficient use of organic carbon by soil microbes. SOC mineralization intensity is the cumulative CO2-C released during the entire incubation (Cm) per unit of initial carbon present, regulated by the quality of substrates and microbial activity [57]. The mulched treatment had lower SOCmin than no mulching, indicating a smaller fraction of available SOC for mineralization [37] and more stable SOC with lower decomposability under film mulching. The MP1 treatment had the most stable SOC with the lowest decomposability. SOCmin closely correlated with qCO2, indicating that the lower SOCmin under film mulching had a lower decomposability degree of the SOC pool and high SOC utilization efficiency [37,56].
Moscatelli et al. [37] reported that agricultural soil had lower SOC and higher SOC mineralization than forest and grassland soils, altering the equilibrium between mineralization and humification processes. In contrast, SOC closely correlated with Cm in the present study, i.e., more SOC was conserved despite greater SOC mineralization under film mulching and P application. This suggests greater organic inputs through rhizodeposits and plant residues under film mulching and P application than SOC mineralization under improved soil water, temperature, and nutrient conditions [53]. The SOC decomposition process (SOC mineralization) was characterized by decreased SOC and increased available minerals previously immobilized in organic forms. When SOC decomposed, more nutrients were available for alfalfa growth, increasing the alfalfa residues (mainly root debris and secretion) returned to the soil [22]. SOC decomposition also depends on its physical accessibility to soil microbes, as determined by soil aggregation [2]. Clay particles can protect some of the more easily decomposable organic compounds from rapid microbial breakdown by forming organic-mineral complexes [29,55]. Therefore, high SOC might result from physical protection and organo-mineral associated interactions but requires further investigation.

4.3. Soil Organic Carbon Mineralization Kinetics

In the present study, the zero-order model worst fitted the CO2-C evolution data, probably because it does not account for variation in SOC decomposability with incubation time [41]. CO2-C emission data under film mulching fit better than under no film mulching in the zero-order model, first-order model, first-order E model, and parabolic function. This result might be due to the smaller active SOC pool under film mulching and the characteristic of a relatively mature and stable SOC [41]. In contrast, the first-order two-component simultaneous reactions model and special model fit well under film mulching and no film mulching (slightly better for no film mulching), possibly due to the more intense SOC activity. Fernández et al. [41] reported that the goodness-of-fit improves as the complexity of kinetic models increases. That is why the first-order two-component simultaneous reactions model best described CO2-C evolution.
SOC comprises various heterogeneous pools that differ in decomposability and stability and contribute differently to CO2-C as the major product of microbial decomposition [3]. The active SOC pool (C1) is the most easily biodegradable fraction. It is easily attacked by soil microorganisms, while the slow SOC pool (C2) mainly contains relatively stable organic products and soil aggregates and clay particles protected SOC [46]. Film mulching had a lower active SOC pool and slightly higher slow SOC pool than no film mulching (except for P3), indicating that rapid SOC fraction mineralization was more sensitive to temperature increases under film mulching than the stable SOC fraction [58,59]. It could also be that the SOC under no film mulching had not stabilized, and the maturation process was ongoing. The active SOC fraction C1 accounted for ~3.7% of the total mineralization carbon (C1 + C2), suggesting good SOC stability in the alfalfa field and indicating a very low active SOC pool concentration. Thus, the slow SOC pool might play an important role as the unstable SOC fraction in SOC mineralization. Film mulching had a slightly lower [C1/(C1 + C2)] proportion than no film mulching, with the lowest in MP1 (most stable SOC) and highest in NMP0 (least stable SOC).
The active SOC pool mineralization rate constant k did not differ between treatments, ranging from 0.0905–0.127 d−1, indicating that organic compounds metabolized from microbial respiration (active SOC pool) had similar decomposability or the same degree of availability to soil microbes [60]. The average k value was 0.105 d−1, similar to the carbon mineralization of organic wastes at different composting stages [61] and less than Pisa urban soils [44], indicating that the active SOC pool decomposed slowly and was relatively stable compared with others. The active SOC pool had similar mean residence times (MRTk, 1/k) between treatments, ranging from 8–11 d, as Bernal et al. [61] reported. The slow SOC pool mineralization rate constant h ranged from 0.00174–0.00288 d−1 (mean 0.00209 d−1), somewhat lower than other studies [38,41,44]. The slow SOC pool had a relatively slow mineralization process in the present study, reflected by the longer mean residence time MRTh (495 d). In addition, the MRTh of the slow SOC pool was longest under P3 with no film mulching and P1 with film mulching (MP1 > NMP3); i.e., MP1 had the most stable SOC with the lowest decomposability.

5. Conclusions

Film mulching improved SOC, C fractions (LFOC, HFOC, MBC, and DOC), and mineralization. P application increased SOC fractions and mineralization in the mulching and no mulching treatments, decreasing at high P levels with film mulching. P1 with film mulching increased SOC utilization efficiency and SOC stability. The CO2-C evolution data fitting divided SOC into two components: an active SOC pool and a slow SOC pool, with the latter having the lowest decomposability and highest stability in MP1. In conclusion, film mulching with ridges and furrows and 11.9 kg ha−1 P fertilizer was suitable for soil C accumulation under alfalfa cultivation in this semiarid environment due to high SOC content with high organic C utilization efficiency and stability and low decomposability. This quantitative analysis of SOC content, fractions, and decomposability under combined film mulching and P application is crucial for understanding soil C dynamics and soil quality in the long term.

Author Contributions

Data curation, Y.-J.G.; Formal analysis, C.-L.H.; Funding acquisition, Y.-J.G.; Investigation, Y.-J.G., C.-L.H. and M.K.; Project administration, F.-M.L.; Supervision, F.-M.L.; Writing—original draft, Y.-J.G.; Writing—review & editing, K.H.M.S. All authors have read and agreed to the published version of the manuscript.

Funding

This research was funded by the Basic Research Project of Qinghai Province Science Foundation [No. 2020-ZJ-969Q], National Natural Science Foundation of China [No. 31960625], and State Key Laboratory of Plateau Ecology and Agriculture [No. 2019-ZZ-17]. The APC was funded by the Basic Research Project of Qinghai Province Science Foundation [No. 2020-ZJ-969Q].

Data Availability Statement

All of the data generated or analyzed during this study are included in this published article.

Acknowledgments

The authors thank the Basic Research Project of Qinghai Province Science Foundation [No. 2020-ZJ-969Q], National Natural Science Foundation of China [No. 31960625], and State Key Laboratory of Plateau Ecology and Agriculture [No. 2019-ZZ-17] for funding. We also thank the anonymous reviewers for providing critical comments and suggestions that improved the manuscript.

Conflicts of Interest

The authors declare no conflict of interest.

References

  1. Lal, R. Soil carbon sequestration impacts on global climate change and food security. Science 2004, 304, 1623–1627. [Google Scholar] [CrossRef] [PubMed] [Green Version]
  2. Pinheiro, É.F.M.; de Campos, D.V.B.; de Carvalho Balieiro, F.; dos Anjos, L.H.C.; Pereira, M.G. Tillage systems effects on soil carbon stock and physical fractions of soil organic matter. Agric. Syst. 2015, 132, 35–39. [Google Scholar] [CrossRef]
  3. Luo, R.Y.; Fan, J.L.; Wang, W.J.; Luo, J.F.; Kuzyakov, Y.; He, J.S.; Chu, H.Y.; Ding, W.X. Nitrogen and phosphorus enrichment accelerates soil organic carbon loss in alpine grassland on the Qinghai-Tibetan Plateau. Sci. Total Environ. 2019, 650, 303–312. [Google Scholar] [CrossRef] [PubMed]
  4. Tian, Y.; Li, F.M.; Liu, P.H. Economic analysis of rainwater harvesting and irrigation methods, with an example from China. Agric. Water Manag. 2003, 60, 217–226. [Google Scholar]
  5. Jia, Y.; Li, F.M.; Wang, X.L.; Xu, J.Z. Dynamics of soil organic carbon and soil fertility affected by alfalfa productivity in a semiarid agro-ecosystem. Biogeochemistry 2006, 80, 233–243. [Google Scholar] [CrossRef]
  6. Liu, C.A.; Jin, S.L.; Zhou, L.M.; Jia, Y.; Li, F.M.; Xiong, Y.C.; Li, X.G. Effects of plastic film mulch and tillage on maize productivity and soil parameters. Eur. J. Agron. 2009, 31, 241–249. [Google Scholar] [CrossRef]
  7. Van der Meulen, E.S.; Nol, L.; Cammeraat, L.H. Effects of irrigation and plastic mulch on soil properties on semiarid abandoned fields. Soil Sci. Soc. Am. J. 2006, 70, 930–939. [Google Scholar] [CrossRef] [Green Version]
  8. Yu, P.J.; Han, K.X.; Li, Q.; Zhou, D.W. Soil organic carbon fractions are affected by different land uses in an agro-pastoral transitional zone in northeastern China. Ecol. Indic. 2017, 73, 331–337. [Google Scholar] [CrossRef]
  9. Malhi, S.S.; Brandt, S.; Gill, K.S. Cultivation and grassland type effects on light fraction and total organic C and N in a Dark Brown Chernozemic soil. Can. J. Soil Sci. 2003, 83, 145–153. [Google Scholar] [CrossRef]
  10. Zhou, L.M.; Jin, S.L.; Liu, C.A.; Xiong, Y.C.; Si, J.T.; Li, X.G.; Gan, Y.T.; Li, F.M. Ridge-furrow and plastic-mulching tillage enhances maize–soil interactions: Opportunities and challenges in a semiarid agroecosystem. Field Crops Res. 2012, 126, 181–188. [Google Scholar] [CrossRef]
  11. Nsabimana, D.; Haynes, R.J.; Wallis, F.M. Size, activity and catabolic diversity of the soil microbial biomass as affected by land use. Appl. Soil. Ecol. 2004, 26, 81–92. [Google Scholar] [CrossRef]
  12. Yang, X.; Meng, J.; Lan, Y.; Chen, W.F.; Yang, T.X.; Yuan, J.; Liu, S.N.; Han, J. Effects of maize stover and its biochar on soil CO2 emissions and labile organic carbon fractions in Northeast China. Agric. Ecosyst. Environ. 2017, 240, 24–31. [Google Scholar] [CrossRef]
  13. Martens, R. Current methods for measuring microbial biomas C in soil: Potentials and limitations. Biol. Fertil. Soils 1995, 19, 87–99. [Google Scholar] [CrossRef]
  14. Klotzbücher, T.; Kaiser, K.; Guggenberger, G.; Gatzek, C.; Kalbitz, K. A new conceptual model for the fate of lignin in decomposing plant litter. Ecology 2011, 92, 1052–1062. [Google Scholar] [CrossRef]
  15. Moore, T.R.; Paré, D.; Boutin, R. Production of dissolved organic carbon in Canadian forest soils. Ecosystems 2008, 11, 740–751. [Google Scholar] [CrossRef]
  16. Yuan, Z.Q.; Yu, K.L.; Guan, X.K.; Fang, C.; Li, M.; Shi, X.Y.; Li, F.M. Medicago sativa improves soil carbon sequestration following revegetation of degraded arable land in a semi-arid environment on the Loess Plateau, China. Agric. Ecosyst. Environ. 2016, 232, 93–100. [Google Scholar] [CrossRef]
  17. Yang, F.; Tian, J.; Meersmans, J.; Fang, H.J.; Yang, H.; Lou, Y.L.; Li, Z.F.; Liu, K.L.; Zhou, Y.; Blagodatskaya, E.; et al. Functional soil organic matter fractions in response to long-term fertilization in upland and paddy systems in South China. Catena 2018, 162, 270–277. [Google Scholar] [CrossRef] [Green Version]
  18. Li, F.M.; Song, Q.H.; Jjemba, P.K.; Shi, Y.C. Dynamics of soil microbial biomass C and soil fertility in cropland mulched with plastic film in a semiarid agro-ecosystem. Soil Biol. Biochem. 2004, 36, 1893–1902. [Google Scholar] [CrossRef]
  19. Wang, Y.P.; Li, X.G.; Fu, T.T.; Wang, L.; Turner, N.C.; Siddique, K.H.M.; Li, F.M. Multi-site assessment of the effects of plastic-film mulch on the soil organic carbon balance in semiarid areas of China. Agric. Forest Meteorol. 2016, 228, 42–51. [Google Scholar] [CrossRef] [Green Version]
  20. Li, S.; Zhang, S.R.; Pu, Y.L.; Li, T.; Xu, X.X.; Jia, Y.X.; Deng, O.P.; Gong, G.S. Dynamics of soil labile organic carbon fractions and C-cycle enzyme activities under straw mulch in Chengdu Plain. Soil Till. Res. 2016, 155, 289–297. [Google Scholar] [CrossRef]
  21. Haynes, R.J. Labile organic matter as an indicator of organic matter quality in arable and pastoral soils in New Zealand. Soil Biol. Biochem. 2000, 32, 211–219. [Google Scholar] [CrossRef]
  22. Gong, W.; Yan, X.Y.; Wang, J.Y.; Hu, T.X.; Gong, Y.B. Long-term manure and fertilizer effects on soil organic matter fractions and microbes under a wheat–maize cropping system in northern China. Geoderma 2009, 149, 318–324. [Google Scholar] [CrossRef]
  23. Fan, J.; Hao, M.D.; Malhi, S.S.; Wang, Q.J.; Huang, M.B. Influence of 24 annual applications of fertilisers and/or manure to alfalfa on forage yield and some soil properties under dryland conditions in northern China. Crop Pasture Sci. 2011, 62, 437–443. [Google Scholar] [CrossRef]
  24. Haynes, R.J.; Naidu, R. Influence of lime, fertilizer and manure applications on soil organic matter content and soil physical conditions: A review. Nutr. Cycl. Agroecosys. 1998, 51, 123–137. [Google Scholar] [CrossRef]
  25. Zhang, J.F.; Zhou, J.E.; Lambers, H.; Li, Y.W.; Li, Y.X.; Qin, G.M.; Wang, M.; Wang, J.; Li, Z.A.; Wang, F.M. Nitrogen and phosphorus addition exerted different influences on litter and soil carbon release in a tropical forest. Sci. Total Environ. 2022, 832, 155049. [Google Scholar] [CrossRef]
  26. Luo, R.Y.; Kuzyakov, Y.; Zhu, B.; Qiang, W.; Zhang, Y.; Pang, X.Y. Phosphorus addition decreases plant lignin but increases microbial necromass contribution to soil organic carbon in a subalpine forest. Glob. Chang. Biol. 2022, in press. [Google Scholar] [CrossRef]
  27. Jia, J.; Yu, D.P.; Zhou, W.M.; Zhou, L.; Bao, Y.; Meng, Y.Y.; Dai, L.M. Variations of soil aggregates and soil organic carbon mineralization across forest types on the northern slope of Changbai Mountain. Acta Ecol. Sin. 2015, 35, 1–7. [Google Scholar] [CrossRef]
  28. Schaedel, C.; Ernakovich, J.G.; Harden, J.W.; Natali, S.; Richter, A.; Schuur, E.; Treat, C.C. Strategizing a comprehensive laboratory protocol to determine the decomposability of soil organic matter in permafrost. In Proceedings of the AGU Fall Meeting, San Francisco, CA, USA, 12–16 December 2016; p. B41D-0464. [Google Scholar]
  29. Pires, C.V.; Schaefer, C.E.R.G.; Hashigushi, A.K.; Thomazini, A.; Filho, E.I.F.; Mendonça, E.S. Soil organic carbon and nitrogen pools drive soil C-CO2 emissions from selected soils in Maritime Antarctica. Sci. Total Environ. 2017, 596–597, 124–135. [Google Scholar] [CrossRef]
  30. Gu, Y.J.; Han, C.L.; Kong, M.; Shi, X.Y.; Zdruli, P.; Li, F.M. Plastic film mulch promotes high alfalfa production with phosphorus-saving and low risk of soil nitrogen loss. Field Crops Res. 2018, 229, 44–54. [Google Scholar] [CrossRef]
  31. Pascual, J.A.; Hernandez, T.; Garcia, C.; Ayuso, M. Carbon mineralization in an arid soil amended with organic wastes of varying degrees of stability. Commun. Soil Sci. Plan. 2008, 29, 835–846. [Google Scholar] [CrossRef]
  32. Jiang, J.P.; Xiong, Y.C.; Jia, Y.; Li, F.M.; Xu, J.Z.; Jiang, H.M. Soil quality dynamics under successional alfalfa field in the semi-arid Loess Plateau of northwestern China. Arid. Land Res. Manag. 2007, 21, 287–303. [Google Scholar] [CrossRef]
  33. Gu, Y.-J.; Han, C.-L.; Fan, J.-W.; Shi, X.-P.; Kong, M.; Shi, X.-Y.; Siddique, K.H.M.; Zhao, Y.-Y.; Li, F.-M. Alfalfa forage yield, soil water and P availability in response to plastic film mulch and P fertilization in a semiarid environment. Field Crops Res. 2018, 215, 94–103. [Google Scholar] [CrossRef]
  34. Graham, M.H.; Haynes, J.H.; Meyer, J.H. Soil organic matter content and quality: Effects of fertilizer applications, burning and trash retention on a long-term sugarcane experiment in South Africa. Soil Boil. Biochem. 2002, 34, 93–102. [Google Scholar] [CrossRef]
  35. Hai, L.; Li, X.G.; Li, F.M.; Suo, D.R.; Guggenberger, G. Long-term fertilization and manuring effects on physically-separated soil organic matter pools under a wheat–wheat–maize cropping system in an arid region of China. Soil Biol. Biochem. 2010, 42, 253–259. [Google Scholar] [CrossRef]
  36. Ci, E.; Al-Kaisi, M.M.; Wang, L.G.; Ding, C.H.; Xie, D.T. Soil organic carbon mineralization as affected by cyclical temperature fluctuations in a karst region of southwestern China. Pedosphere 2015, 25, 512–523. [Google Scholar] [CrossRef]
  37. Moscatelli, M.C.; Di Tizio, A.; Marinari, S.; Grego, S. Microbial indicators related to soil carbon in Mediterranean land use systems. Soil Till. Res. 2007, 97, 51–59. [Google Scholar] [CrossRef]
  38. Turrion, M.B.; Lafuente, F.; Mulas, R.; Lopez, O.; Ruiperez, C.; Pando, V. Effects on soil organic matter mineralization and microbiological properties of applying compost to burned and unburned soils. J. Environ. Manag. 2012, 95, S245–S249. [Google Scholar] [CrossRef]
  39. Dossa, E.L.; Khouma, M.; Diedhiou, I.; Sene, M.; Kizito, F.; Badiane, A.N.; Samba, S.A.N.; Dick, R.P. Carbon, nitrogen and phosphorus mineralization potential of semiarid Sahelian soils amended with native shrub residues. Geoderma 2009, 148, 251–260. [Google Scholar] [CrossRef]
  40. Ribeiro, H.M.; Fangueiro, D.; Alves, F.; Vasconcelos, E.; Coutinho, J.; Bol, R.; Cabral, F. Carbon-mineralization kinetics in an organically managed Cambic Arenosol amended with organic fertilizers. J. Soil Sci. Plant Nutr. 2010, 173, 39–45. [Google Scholar] [CrossRef]
  41. Fernández, J.M.; Plaza, C.; Hernández, D.; Polo, A. Carbon mineralization in an arid soil amended with thermally-dried and composted sewage sludges. Geoderma 2007, 137, 497–503. [Google Scholar] [CrossRef]
  42. Beauchamp, E.G.; Reynolds, W.D.; Brasche-Villeneuve, D.; Kirby, K. Nitrogen mineralization kinetics with different soil pretreatments and cropping histories. Soil Sci. Soc. Am. J. 1986, 50, 1478–1483. [Google Scholar] [CrossRef]
  43. Haer, H.S.; Benbi, D.K. Modeling nitrogen mineralization kinetics in arable soils of semiarid India. Arid Land Res. Manag. 2003, 17, 153–168. [Google Scholar] [CrossRef]
  44. Saviozzi, A.; Vanni, G.; Cardelli, R. Carbon mineralization kinetics in soils under urban environment. Appl. Soil. Ecol. 2014, 73, 64–69. [Google Scholar] [CrossRef]
  45. Wang, M.; Su, Y.; Yang, X. Spatial distribution of soil organic carbon and its influencing factors in desert grasslands of the Hexi Corridor, northwest China. PLoS ONE 2014, 9, e94652. [Google Scholar] [CrossRef] [PubMed]
  46. Rabbi, S.M.F.; Wilson, B.R.; Lockwood, P.V.; Daniel, H.; Young, I.M. Soil organic carbon mineralization rates in aggregates under contrasting land uses. Geoderma 2014, 216, 10–18. [Google Scholar] [CrossRef]
  47. Li, F.M.; Xu, J.Z.; Sun, G.J. Restoration of degraded ecosystem and development of water-harvesting ecological agriculture in the semiarid Loess Plateau of China. Acta Ecol. Sin. 2003, 23, 1901–1909, (In Chinese with English Abstract). [Google Scholar]
  48. Griffiths, B.S.; Spilles, A.; Bonkowski, M. C:N:P stoichiometry and nutrient limitation of the soil microbial biomass in a grazed grassland site under experimental P limitation or excess. Ecol. Process. 2012, 1, 6. [Google Scholar] [CrossRef] [Green Version]
  49. Cerli, C.; Celi, L.; Kalbitz, K.; Guggenberger, G.; Kaiser, K. Separation of light and heavy organic matter fractions in soil-Testing for proper density cut-off and dispersion level. Geoderma 2012, 170, 403–416. [Google Scholar] [CrossRef]
  50. Wang, X.L.; Jia, Y.; Li, X.G.; Long, R.J.; Ma, Q.F.; Li, F.M.; Song, Y.J. Effects of land use on soil total and light fraction organic, and microbial biomass C and N in a semi-arid ecosystem of northwest China. Geoderma 2009, 153, 285–290. [Google Scholar] [CrossRef]
  51. Zhang, J.B.; Song, C.C.; Wang, S.M. Dynamics of soil organic carbon and its fractions after abandonment of cultivated wetlands in northeast China. Soil Till. Res. 2007, 96, 350–360. [Google Scholar]
  52. Paul, E.A.; Follett, R.F.; Leavitt, S.W.; Halvorson, A.; Peterson, G.A.; Lyon, D.J. Radiocarbon dating for determination of soil organic matter pool sizes and dynamics. Soil Sci. Soc. Am. J. 1997, 61, 1058–1067. [Google Scholar] [CrossRef] [Green Version]
  53. Saggar, S.; Yeates, G.W.; Shepherd, T.G. Cultivation effects on soil biological properties, microfauna and organic matter dynamics in Eutric Gleysol and Gleyic Luvisol soils in New Zealand. Soil Till. Res. 2001, 58, 55–68. [Google Scholar] [CrossRef]
  54. Li, N.; Xu, Y.Z.; Han, X.Z.; He, H.B.; Zhang, X.D.; Zhang, B. Fungi contribute more than bacteria to soil organic matter through necromass accumulation under different agricultural practices during the early pedogenesis of a Mollisol. Eur. J. Soil Biol. 2015, 67, 51–58. [Google Scholar] [CrossRef]
  55. Pedra, F.; Polo, A.; Ribeiro, A.; Domingues, H. Effects of municipal solid waste compost and sewage sludge on mineralization of soil organic matter. Soil Biol. Biochem. 2007, 39, 1375–1382. [Google Scholar] [CrossRef]
  56. Dilly, O.; Munch, J.C. Ratios between estimates of microbial biomass content and microbial activity in soils. Biol. Fertil. Soils 1998, 27, 374–379. [Google Scholar] [CrossRef]
  57. Alvarez, R.; Díaz, R.A.; Barbero, N.; Santanatoglia, O.J.; Blotta, L. Soil organic carbon, microbial biomass and CO2-C production from three tillage systems. Soil Till. Res. 1995, 33, 17–28. [Google Scholar] [CrossRef]
  58. Giardina, C.P.; Ryan, M.G. Evidence that decomposition rates of organic carbon in mineral soil do not vary with temperature. Nature 2000, 404, 858–861. [Google Scholar] [CrossRef]
  59. Thornley, J.H.M.; Cannell, M.G.R. Soil carbon storage response to temperature: An hypothesis. Ann. Bot. 2001, 87, 591–598. [Google Scholar] [CrossRef] [Green Version]
  60. Riffaldi, R.; Saviozzi, A.; Levi-Minzi, R. Carbon mineralization kinetics as influenced by soil properties. Biol. Fertil. Soils 1996, 22, 293–298. [Google Scholar] [CrossRef]
  61. Bernal, M.P.; Sánchez-Monedero, M.A.; Paredes, C.; Roig, A. Carbon mineralization from organic wastes at different composting stages during their incubation with soil. Agric. Ecosyst. Environ. 1998, 69, 175–189. [Google Scholar] [CrossRef]
Figure 1. Soil organic C (SOC, a), soil total N (TN, b), and soil C/N ratio (c) under no film mulching (NM) and film mulching (M) at four P levels (P0, P1, P2, and P3). * p ≤ 0.05, ** p ≤ 0.01, and *** p ≤ 0.001. Numbers in brackets are LSD at p = 0.05. Error bars are standard deviations.
Agriculture 12 00816 g001
Figure 2. Relationship between soil organic C (SOC) and P application level (P0, P1, P2, and P3) under no film mulching (NM, a) and film mulching (M, b). There were three replicates. The solid red lines are fitted lines; the corresponding 95% confidence bands are shaded purple (the reader is referred to the web version of this article to interpret the color references in the figure legend).
Agriculture 12 00816 g002
Figure 3. Light fraction (LFOC, a) and heavy fraction (HFOC, b) organic C, soil microbial biomass C (MBC, c), and dissolved organic C (DOC, d) under no film mulching (NM) and film mulching (M) at four P levels (P0, P1, P2, and P3). * p ≤ 0.05, ** p ≤ 0.01, and *** p ≤ 0.001. Numbers in brackets are LSD at p = 0.05. Error bars are standard deviations.
Agriculture 12 00816 g003
Figure 4. Cumulative soil organic C (SOC) mineralization over 175 days (Cm, a), average mineralization rates (b), qCO2 (metabolic quotient, average cumulative SOC mineralization over 175 days per unit microbial biomass carbon in July 2015, c), and SOCmin (SOC mineralization intensity, cumulative SOC mineralization over 175 days per unit of initial SOC in July 2015, d) under no film mulching (NM) and film mulching (M) at four P levels (P0, P1, P2, and P3). * p ≤ 0.05, ** p ≤ 0.01, and *** p ≤ 0.001. Numbers in brackets are LSD at p = 0.05. Error bars are standard deviations.
Agriculture 12 00816 g004
Figure 5. Principal component analysis (PCA) for SOC fractions, SOC mineralization, and SOC mineralization kinetic parameters for all treatments. SOC: soil organic carbon; TN: total nitrogen; C/N ratio: SOC to TN ratio; LFOC: light fraction organic carbon; HFOC: heavy fraction organic carbon; MBC: microbial biomass carbon; DOC: dissolved organic carbon; Cm: cumulative SOC mineralization over 175 days; qCO2: metabolic quotient; SOCmin: SOC mineralization intensity; k: active SOC mineralization rate constant; h: slow SOC mineralization rate constant; C1: active SOC fraction; C2: slow SOC fraction.
Agriculture 12 00816 g005
Table 1. Kinetic models to describe SOC mineralization. The determination coefficient (R2) is displayed and used to evaluate goodness-of-fit for comparing kinetic models.
SOC Mineralization Kinetic ModelsZero-OrderFirst-OrderFirst-Order EFirst-Order Two-Component Simultaneous Reactions ModelSpecial ModelParabolic Function
EquationsCt = kt + interceptCt = C0 (1 − e−kt)Ct = C0 (1 − e−kt) + C1Ct = C1 (1 − e−kt) + C2 (1 − e−ht)Ct = C1 (1 − e−kt) + htCt = ktm
NMP00.98290.99270.99620.99980.99960.9993
P10.98350.99290.99620.99990.99980.9993
P20.98780.99450.99740.99980.99950.9993
P30.98390.99270.99600.99990.99980.9992
MP00.98810.99550.99790.99970.99950.9996
P10.98890.99480.99770.99970.99950.9994
P20.99110.99640.99850.99980.99950.9996
P30.98800.99600.99820.99980.99940.9997
Table 2. Repeated measures ANOVA for the effect of time (Ti), film mulching (M), and phosphorus application (P) on soil organic C (SOC), total N (TN), C/N ratio, and SOC fractions (LFOC, HFOC, MBC, and DOC).
CharacterSource of Variation
TiMPTi × MTi × PM × PTi × M × P
Soil organic C (SOC, g kg−1)*** (0.29)*** (0.26)n.s.** (0.45)n.s.*** (0.51)n.s.
Soil total N (TN, g kg−1)*** (0.023)*** (0.024)n.s.* (0.039)n.s.** (0.048)n.s.
Soil C/N ratio*** (0.39)*** (0.24)* (0.34)* (0.55)n.s.** (0.48)n.s.
Light fraction organic C (LFOC, g kg−1)*** (0.037)*** (0.024)*** (0.034)n.s.** (0.074)*** (0.049)* (0.105)
Heavy fraction organic C (HFOC, g kg−1)*** (0.23)*** (0.23)* (0.32)* (0.37)n.s.*** (0.45)n.s.
Soil microbial biomass C (MBC, mg kg−1)*** (6.22)*** (3.09)*** (4.37)* (8.39)n.s.*** (6.18)n.s.
Dissolved organic C (DOC, mg kg−1)*** (3.66)*** (3.06)** (4.33)*** (5.49)*** (7.76)*** (6.12)n.s.
n.s. indicates no significant difference between treatments. * p ≤ 0.05, ** p ≤ 0.01 and *** p ≤ 0.001. Numbers in parentheses are LSD among treatments (p = 0.05).
Table 3. SOC mineralization kinetic parameters (a) obtained from the model Ct = C1 (1 − e−kt) + C2 (1 − e−ht).
Kinetic Parametersk × 10−3 (d−1)C1 (mg kg−1)h × 10−3 (d−1)C2 (g kg−1)MRTk (d)MRTh (d)C1/(C1 + C2) (%)
NMP01083682.1667.989.284634.50
P196.84081.8239.3410.45564.21
P21083361.9769.139.315083.56
P31274611.74010.57.975754.22
MP090.53222.1269.2111.14823.44
P199.83561.71211.610.05872.98
P21163032.2849.468.804393.10
P398.52872.8847.2410.53473.80
LSD0.05 for analysis of variance (ANOVA) in randomized blocks of split-plot design
Mn.s.(36.11) *n.s.n.s.n.s.n.s.n.s.
Pn.s.(24.17) ***(0.2431) **(1.24) *n.s.(61.9) **(0.4591) *
M × P(20.01) *(34.72) ***(0.4373) ***(1.71) **n.s.(103.9) **n.s.
(a) C1 and C2 are active and slow SOC fractions, respectively; k and h are active and slow SOC mineralization rate constants, respectively; MRTk and MRTh are mean residence time (reciprocal of the active and slow SOC pool decomposition rate constants k and h, respectively) [36,46]; C1/(C1 + C2) (%) is the percentage of the more active pool relative to total mineralization carbon. n.s. indicates no significant difference between treatments. * p ≤ 0.05, ** p ≤ 0.01 and *** p ≤ 0.001. Numbers in parentheses are LSD among treatments (p = 0.05).
Publisher’s Note: MDPI stays neutral with regard to jurisdictional claims in published maps and institutional affiliations.

