Article

Performance Evaluation of Communication Systems Used for Internet of Things in Agriculture

1
Grupo De Investigación en Telecomunicaciones y Telemática (GITEL), Universidad Politécnica Salesiana, Cuenca EC10105, Ecuador
2
Department of Communications and Networking, Universidad de Cuenca, Cuenca EC010107, Ecuador
3
GRID Research Group, Universidad Internacional de Valencia, 46002 Valencia, Spain
*
Author to whom correspondence should be addressed.
Agriculture 2022, 12(6), 786; https://doi.org/10.3390/agriculture12060786
Submission received: 8 February 2022 / Revised: 22 May 2022 / Accepted: 26 May 2022 / Published: 30 May 2022
(This article belongs to the Special Issue Digital Innovations in Agriculture)

Abstract

:
The rapid development of Internet of Things (IoT) technology has provided ample opportunity for the implementation of intelligent agricultural production. Such technology can be used to connect various types of agricultural devices, which can collect and send data to servers for analysis. These tools can help farmers optimize the production of their crops. However, one of the main problems that arises in agricultural areas is a lack of connectivity or poor connection quality. For these reasons, in this paper, we present a method that can be used for the performance evaluation of communication systems used in IoT for agriculture, considering metrics such as the packet delivery ratio, energy consumption, and packet collisions. To achieve this aim, we carry out an analysis of the main Low-Power Wide-Area Networks (LPWAN) protocols and their applicability, from which we conclude that those most suited to this context are Long Range (LoRa) and Long Range Wide Area Network (LoRaWAN). After that, we analyze various simulation tools and select Omnet++ together with the Framework for LoRa (FLoRa) library as the best option. In the first stage of the simulations, the performances of LoRa and LoRaWAN are evaluated by comparing the average propagation under ideal conditions against moderate propagation losses, emulating a rural environment in the coastal region of Ecuador. In the second phase, metrics such as the package delivery ratio and energy consumption are evaluated by simulating communication between an increasing number of nodes and one or two gateways. The results show that using two gateways with the Adaptive Data Rate technique can actively increase the delivery ratio of the network while consuming the same amount of energy per node. Finally, a comparison is made between the results of the simulation scenario considered in this project and those of other research works, allowing for the validation of our analytical and simulation results.

1. Introduction

The Food and Agriculture Organization of the United Nations (FAO) has estimated that by the year 2050 the global population will reach 9.7 billion people. It is foreseen that for the decade 2050–2060 only one-third of the population will live in rural areas, whereas the remaining 66% will move to ever-growing cities, thus decreasing the size of the agricultural workforce. Furthermore, there are many regions worldwide that experience limited rainfall, meaning that between 80% and 90% of the available water is used by farmers, which in turn leads to shortages of primary sources of this resource (e.g., rivers and water reserves) [1].
The analysis of scarce water resources and the decline in agricultural labor, combined with soil infertility among other factors, has led researchers to consider how productivity could be improved in this sector to meet the growing demand for food [2]. Different studies focused on optimizing production in the agricultural sector have shown that the implementation of different systems based largely on the automation of processes is required [3,4,5,6,7]. Other investigations have focused on improving production systems according to the demand for quality foods and optimizing the use of water and other resources necessary in this field [8,9,10,11]. Advances in technological and communication solutions allow for the monitoring of field conditions in agricultural sectors through the use of various systems, including sensors that acquire agricultural data. These acquisition systems allow for the local transmission of information, potentially through the implementation of Internet of Things (IoT) technology based on Internet connectivity [12,13,14]. This interconnection entails a degree of intelligence, which allows for controlling and processing variables. The number of IoT applications has increased exponentially in recent years, playing an important role in the agricultural sector under the concepts of Precision Agriculture (PA) and Agriculture 4.0 [15,16]. One of the highlights of IoT devices in PA and Agriculture 4.0 is the low power consumption of devices, the low sampling rate, data transmission/reception, and advances in communication systems [17,18,19].
In the scientific literature, few studies have focused on the use of communication protocols such as RFID/WiFi/Bluetooth for monitoring variables related to the agricultural sector. This is due to the short range and low coverage of these technologies [20]. Traditional long-range communication systems, such as satellite communications [21], Wimax [22] and LTE/4G [23], are most commonly used in this sector. Solutions based on cellular phone communication could provide a greater range of coverage at the cost of a higher energy consumption by the end devices. On the other hand, Low-Density Parity-Check (LDPC) codes, Polar codes, and Ultra-Reliable and Low-Latency Communications (URLLC) are of particular importance in improving the transmission reliability of wireless networks; hence, they have been included in the 5G New Radio Standard and in 6G standard currently under development [24,25,26,27]. The requirements of IoT applications have led to the emergence of Low-Power Wide-Area Networks (LPWANs) [28].
LPWANs are perfect for devices that need to send small amounts of information over long distances. These distances can be up to 15 km in rural areas and 1–5 km in urban areas, with the added advantage of low energy consumption (i.e., the associated batteries can last for 10 years). These communication networks are seen as highly suitable for IoT applications [29]. Among the most popular LPWAN networks are Weightless, Ingenu RPMA, Symphony link Sigfox, Long Range (LoRa)/Long Range Wide Area Network (LoRaWAN), and Narrowband Internet of Things (NBIoT) [30,31,32].
In recent years, Sigfox and LoRa have been positioning themselves in the world of LPWANs. Sigfox was developed in France in 2010 and is currently operating in different countries such as the United States, Ecuador, Mexico, Colombia, South Africa, and Australia, among others. It is characterized as using an Ultra-Narrow Band (UNB), occupying little space within the frequency range and employing low data rates.
As for the frequency band, it uses the Industrial, Scientific, and Medical (ISM) frequency bands [33]. Sigfox uses Differential Binary Phase Shift Keying (DBPSK) modulation for ascending messages and Gaussian Frequency Shift Keying (GFSK) modulation for descending messages. Its main features are low power consumption [34], low cost of devices, and capacity for bidirectional communication [35,36].
LoRa/LoRaWAN are also networks that play big roles within LPWAN. LoRa was developed by the startup Cycle in 2010 and was later acquired by Semtech (USA), while LoRaWAN became a network specification proposal by the LoRa Alliance in 2015. It offers a MAC layer based on LoRa modulation [37]. LoRa operates in ISM bands, uses spread spectrum technology, is suitable for transmitting small amounts of data over long distances, and consumes little energy [38]. LoRaWAN defines three classes of devices for bidirectional communication through LoRa: Class A, Class B, and Class C. The choice of class depends on the application [39].
NB-IoT is a LPWAN which is currently one of the three main LPWANs. It is a narrowband network that can coexist with LTE or GSM networks on licensed frequencies. It is standardized by the Third Generation Partnership Project (3GPP), and its specifications were published in the 3GPP Release 13 in June 2016 [40]. NB-IoT operates on the same frequencies as LTE and uses QPSK and BPSK modulation, as well as the LTE architecture, but features some optimizations to meet the requirements of massive IoT users. NB-IoT devices consume additional energy due to their synchronous communication and Quality of Service (QoS) handling. This system also provides low latency connectivity for IoT applications [41].
Latency is considered one of the parameters that allows for measuring the performance of a communications network; however, there are other variables, such as throughput, latency, speed, propagation delay, network capacity, range coverage, device lifetime, duration of useful life, service quality, and cost, that serve as indicators of the quality of links for data transmission. If a network does not have good performance, it can cause delays, loss of information, and information transfer limitations [42].
Implementing this system of networks for innovation in the agricultural sector allows for greater profitability in production while at the same time reducing fertilizer use and environmental impacts. Farmers can readily obtain information and statistics on crop growth, and smartphones may be used to remotely control crops, equipment, and decision making.
The remainder of this document is structured as follows: An overview of LPWAN networks is presented in Section 2, including a comparison of the three main technologies used, followed by the analysis and results in Section 3. Finally, our conclusions and direction for future research are provided in Section 4.

2. Methodology

In this section, we analyze the main LPWAN technologies for IoT applications. Additionally, the different features that define LoRaWAN and its use in the agricultural sector are studied. Furthermore, the most important simulators used with this technology are studied, as well as the testing scenarios in this work.

2.1. Internet of Things

The IoT, which is defined as the connection of all types of objects (i.e., elements that send information) to the Internet, has been gaining in importance and participation in many fields [43]. IoT provides connectivity for thousands of devices such as sensors and actuators, among others, and allows for connectivity to a network, allowing the objects to exchange data. The information provided by the devices is stored in the cloud [44]. One of its application fields that has gained traction in recent years is agriculture. The use of such technology has allowed traditional agriculture to be transformed into intelligent agriculture based on detection, measurement, and response, which allows farmers to obtain a higher productivity for their crops and better quality products [45]. Some implementations of IoT in agriculture are: real-time monitoring of farms, meteorological prediction modelling, customized fertilizer profiles based on soil chemistry, and water conservation. For this purpose, farmers can implement different types of sensors to monitor pH levels, temperature levels, and humidity levels, among others. These collected data are stored in the cloud for later use and decision making [46].
With the continuous growth of devices with Internet connectivity, IoT applications require long-range communication technologies, large-scale connectivity, low energy consumption, and low cost. LPWAN technologies have the required parameters to cover these needs [47].

2.2. LPWAN Analysis: Technologies

The IoT boom in recent years has led to an increase in the number of connected devices, giving rise to new technologies capable of interconnecting large numbers of devices. Current wireless communication technologies such as Bluetooth and ZigBee have a short range, while cellular communication technologies (e.g., 3G, 4G, and 5G) have a medium range but are limited by high power consumption; however, this limitation has been mitigated with the emergence of LPWAN long-range technologies that have lower energy consumption [48]. Figure 1 shows the relationship between coverage and data transmission rate for the most important wireless networks.
LPWAN technologies are wireless networks that allow for the transmission of small amounts of data over long distances with low power consumption on their final devices. The technologies also provide connectivity for a large number of devices, making them ideal candidates for IoT applications [49].
Several types of LPWAN technologies are currently available, some using licensed frequencies, and others operating in unlicensed spectra. The most popular technologies in this category include LoRa [50,51] and NB-IoT [52], each with their own unique technical features. Table 1 compares the key technical features of LPWAN technologies.
To choose an appropriate LPWAN technology for IoT applications, several factors, including range, coverage, device lifetime, latency, scalability, payload duration, implementation complexity, quality of service, and cost, must be considered [53]. Consideration of these parameters allowed us to analyze which of the considered technologies was most suitable for this project.
From the analysis provided in Table 1, we can conclude that LoRa has advantages in terms of cost, battery life, and implementation; furthermore, it is commercially available in several countries. For these reasons, we focus on the use of this technology, which is adapted to the conditions of rural areas, making it particularly suited to agricultural applications. Implementation of LoRa will allow for the connection of a large number of devices over a long range with low power consumption, favoring the monitoring of climate variables, water consumption in irrigation systems, and crop fertilization. These parameters are expected to allow for improvements in the quality of products.

2.3. LoRa/LoRaWAN

LoRa is a physical layer technology developed by the Semtech Corporation [54]. LoRaWAN is the access layer developed by the LoRa Alliance, which employs LoRa technology for communication and device management [55].
LoRa allows for the transmission and reception of point-to-point information. Its low-power and long-range communication, patented by Semtech, is based on spectrum widening using the Chirp Spread Spectrum (CSS) technique, together with Forward Error Correction (FEC), making LoRa a robust technology against interference. The application of CSS is based on modulated pulses of linear frequency bandwidth whose frequency increases or decreases depending on the encoded information [56]. LoRa operates in several frequency ranges without license in the ISM bands according to the region [57]. In Table 2 a comparison of frequencies is given for areas in which it has higher penetration; Ecuador’s frequency range is also included in the table.
Table 2 provides parameters based on the ETSI standard, such as the frequency, number of channels, duty cycle, and Spreading Factor (SF), analyzed for Europe, North America, and Ecuador. The specifications define that there are 64 channels with a 125 kHz bandwidth and 8 uplink channels with 500 kHz bandwidth for a total of 72 uplink channels; however, the 8 channels with 500 kHz bandwidth overlap with the 64 channels. A Duty cycle is the fraction of time during which the device is occupied. SF allows for improved network efficiency and capacity while also admitting 7 to 12 bits per symbol; by varying this parameter, one can achieve long-range communications at the expense of decreased data speed. Alternatively, decreasing the SF will result in increased data speed at the expense of shorter distances. Furthermore, the speed varies depending on the area. In Table 3, a comparison of SF values and data speeds according to the location is provided. For Europe (EU), the speed ranges from 250 bps to 50 kbps; for North America (NA), it ranges from 980 bps to 21.9 kbps; for Ecuador (EC), it ranges from 250 bps to 21.9 kbps [58].
Table 3 indicates that the bitrate obtained under a given SF may vary with different bandwidth (BW); for example, SF7 allows us to obtain higher data speeds when using a higher BW. This analysis was carried out to indicate the maximum values that can be obtained. In summary, when the SF is varied with the bandwidth, the maximum and minimum values for the data speed can be defined.
LoRa utilizes a dynamic adjustment method called Adaptive Data Rate (ADR), which allows the final device to dynamically adjust the transmission power parameters and data rate according to the distance between the end device and the gateway. This helps to optimize energy consumption in end devices.
The most important parameters of the LoRa physical layer are the bandwidth, the scattering coefficient, the frequency, and the Coding Rate (CR). The modes supported for the CR are 4/5, 4/6, 4/7, and 4/8. When increasing the CR, the transmission time will be longer as the packet size is larger [59].

2.3.1. LoRaWAN Architecture

The LoRaWAN architecture uses a star network topology, which allows for ease of implementation and management as there is no need for routing elements.
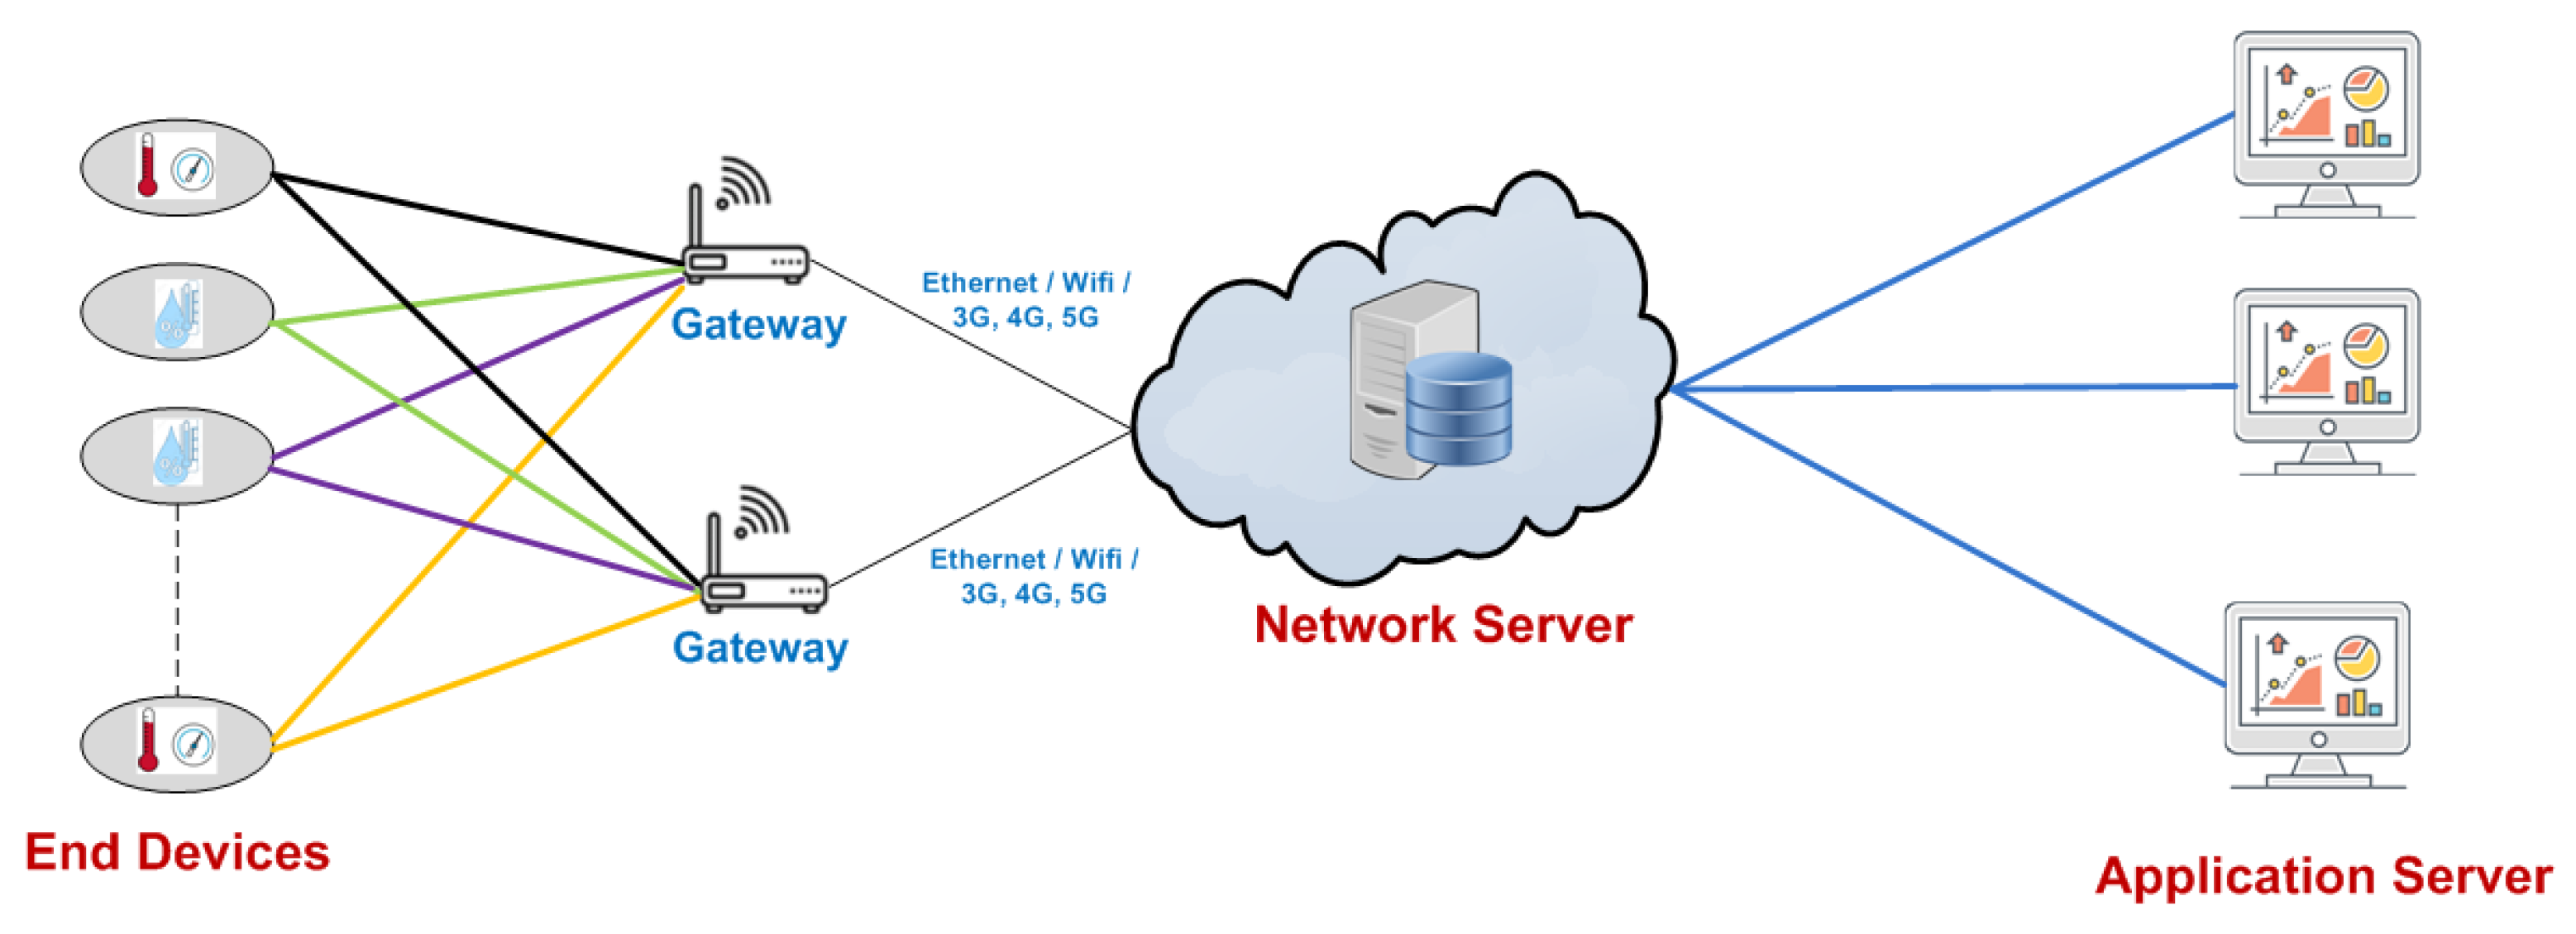
The devices that make up a LoRaWAN network are: end devices (e.g., sensors and actuators), gateways, network servers, and application servers [60]. Its operation starts when the end devices send encrypted messages to the gateways, which then forward information to the network server using TCP/IP protocols. In this way, the network server receives and processes information from the end devices, discarding messages that were received more than once from different gateways. Additionally, the network server is responsible for security between the end device and the application server. The application server decrypts messages and makes information available to the user [61]. In Figure 2, we show the architecture of a LoRaWAN network. Additionally, LoRaWAN allows for two-way communication through LoRa.

2.3.2. LoRaWAN Device Classes

In LoRaWAN, the study of energy consumption in end devices is very important. There are three types of device classes used to expand the battery life: Class A, Class B, and Class C.
  • Class A. Class A devices are bidirectional end devices with greater energy efficiency; most of the time, they are in sleep mode. The transmission for the uplink is followed by two descending link windows within a short period of time. They are used for applications which do not require the continuous receiving of data, and by default, all devices come pre-defined as Class A. Figure 3 shows the transmission type of Class A devices.
  • Class B. Class B devices are two-way devices with programmed reception slots that open additional receiving link windows at programmed times, where the time is synchronized with beacons transmitted by the gateway. These devices have additional power consumption. Figure 4 shows the transmission type of Class B devices.
  • Class C. Class C devices are two-way devices with a maximum reception slot, which keep their reception windows open continuously, only closing them when transmitting. The energy consumption of these devices is excessive, and it is recommended that they only be used in places where energy is not limited. These are employed for applications requiring low latency. Figure 5 shows the transmission type of Class C devices.

2.3.3. Security

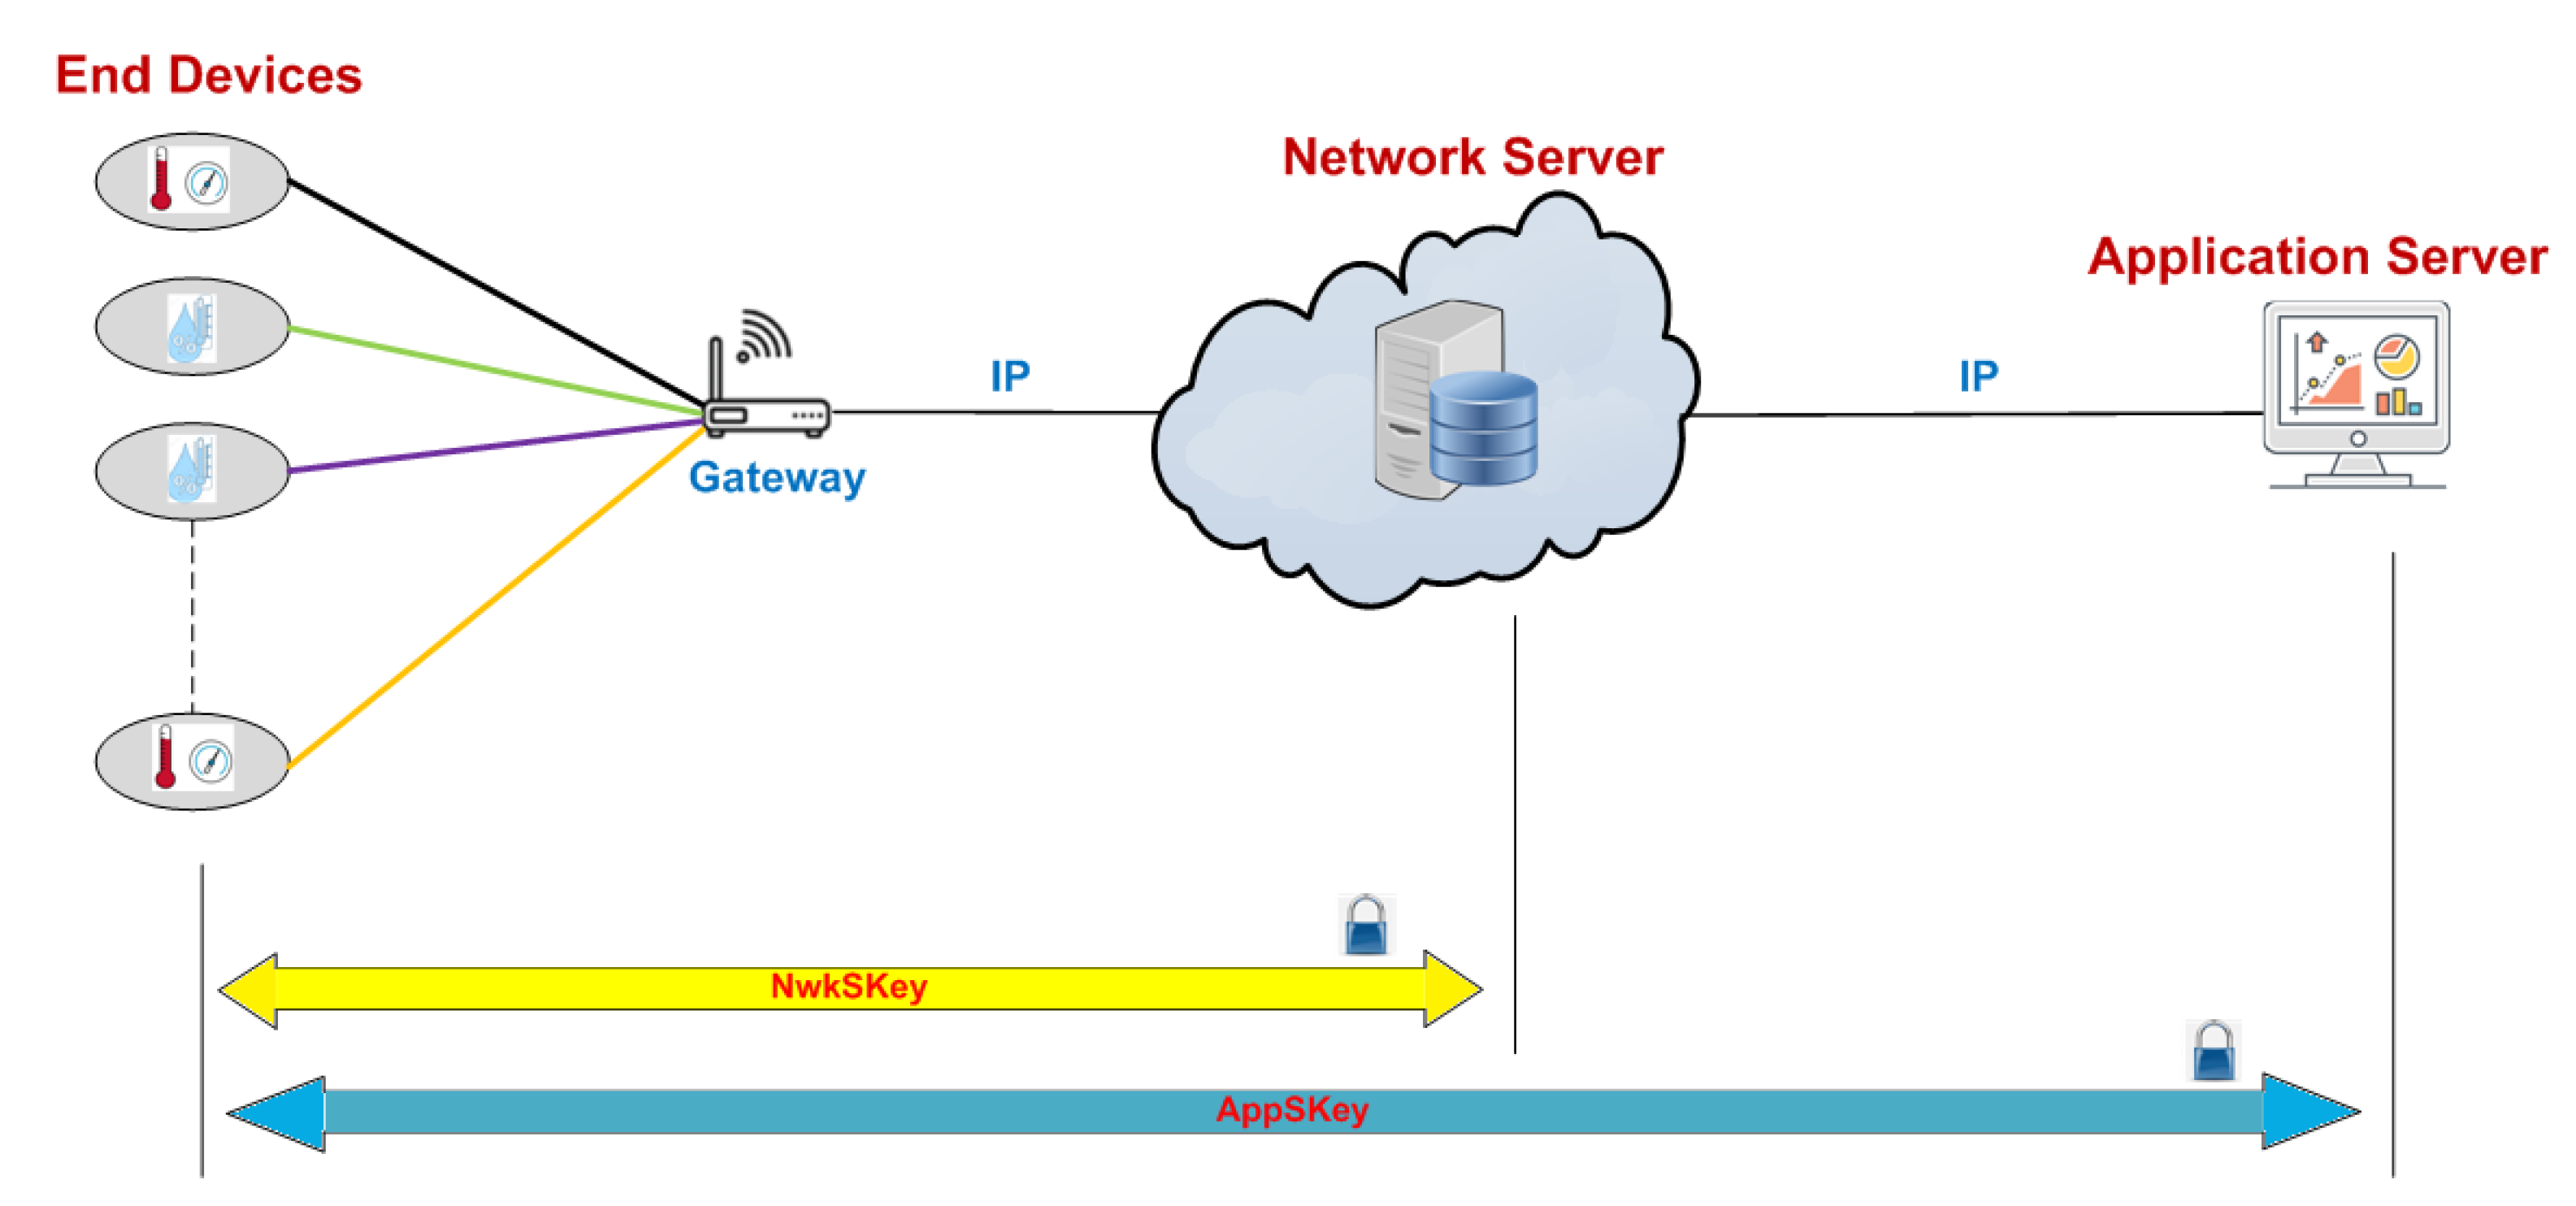
Security is one of the main features in wireless communications, which is why LoRaWAN is one of the few networks in IoT that employs Advanced Encryption Standard (AES) encryption for applications that require the secure transmission of data. The security protocol needs to meet the criteria of LoRAWAN, such as low energy consumption, installation, and implementation. LoRaWAN devices employ two types of session keys in the network:
  • NetworK Session Key (NwKSKey), consisting of an AES-128 bit encryption key that is unique to the network server and is shared between the final device and the network server.
  • Application Session Key (AppSKey), implementing end-to-end encryption between the final device and the application server, is an AES-128 bit encryption key that is unique to the application server [62].
The security types are depicted in Figure 6.
To be operational and part of the LoRaWAN network, the end device must be activated and authenticated, which can be accomplished in the following ways:
  • Air Activation. In this type of activation, the final device exchanges MAC messages with the server (e.g., request and acceptance). In the process, an address (DevAddr) and security key are assigned. This is performed each time the final device loses connection.
  • Activation By Personalization. In this type of activation, configuration is manual. When starting up, the device connects directly to the network. This application is not commonly used [44].

2.4. LoRaWAN Simulators

There are simulation tools for communication networks that allow users to specify specific scenarios they want to simulate for a given technology, such as WiFi, Ethernet, LTE, and so on. These simulations allow for the determination of the virtual behavior of the network, which is very close to the real conditions of evaluation scenarios. Unlike implementation scenarios, this field of research allows us to obtain reliable information at low cost.
There are several types of simulators, depending on the method used:
  • Continuous Simulation. These simulators show results produced at all points during the simulation, not in intervals.
  • Discrete-Event Simulation. These simulators model the operation of a system as a sequence of discrete events at different points in time.
It is important to know the simulators that are available for LoRAWAN, even though it is a technology that emerged in 2015. Work related to this technology started from 2018, in the physical layer of LoRa as a first stage [63]. In recent years, work has been ongoing to update simulators to include MAC support, energy consumption, and other LoRAWAN parameters [64]. The most commonly used simulators are detailed in the following:
  • NS3 is a discrete-event simulator that uses open-source code and is based on the C++ programming language coupled with Python. This simulator allows for the evaluation of LoRaWAN media access capabilities in comparison to a common ALOHA scheme [65]. By default, NS3 lacks a graphical interface. Another attribute of the simulator is that it allows for the generation of PCAP files (a file format used for capturing packets). It is available for Windows and Unix platforms [55,66].
  • Omnet++ is an open-source, free simulation software based on C++ programming for discrete events, which additionally uses a specific high-level language named NEtwork Description (NED). It has specific functionalities, such as the simulation of sensor networks, ad-hoc wireless networks, optical networks, and Internet protocols. OMNET++ has a graphical interface for modelling topologies and analyzing results. Another consideration is its modular architecture; the simulation kernel can easily be integrated with other applications. It is compatible with Windows and Unix. This simulator has been used in both academic and industrial environments. The components of OMNET++ are: kernel library (C++), NED language, eclipse-based IDE simulator, command line interface for running simulations (Cmdenv), time execution GUI for interactive simulations (Qtenv), utilities (file creation tools MAKE), documentation, and simulation examples [67,68].
  • There are also frameworks based on INET which extend it in specific directions, such as the case of LoRa with FLoRa, which allows for point-to-point simulations. Its functionality creates a LoRaWAN network with nodes for LoRa, gateways, and the LoRa server.
  • LoRaSim is a SimPy-based discrete event simulator employed for collision simulations and scalability analysis. Its functionality is limited to simulation between the final devices and gateways [55,69].
Table 4 compares the three simulators in which their main features for implementation in LoRa can be seen.
Table 4 indicates that the most notable simulators are NS3 and OMNET++; their use will depend on the required applications. In our case, we decided to use OMNET++ for our LoRa applications as it contains a high-level language allowing for analysis of the network. Furthermore, it contains the FLoRa library. Being an open-source simulator, changes or modifications to the network can be made by adding modules and extra functionalities. In our case, we evaluate our network by varying the number of nodes (or end devices), the number of gateways, and distances.

2.5. Use of LoRaWAN Technology in the Agricultural Sector

The use of LoRaWan for IoT applications in agriculture is very helpful, especially for water irrigation optimization in fields. This situation arises from limitations of access to this resource or due to droughts. With the implementation of IoT in agriculture, the efficient use of water and quality food production can be guaranteed. This technology allows farmers to cover large areas of farmland due to its long-range transmission ability; moreover, its star topology allows for easy implementation. The cost of implementation is low compared to the other technologies already analyzed. Another important factor is the low power consumption, allowing batteries to be used for years, making it ideal for such applications.
Below is a brief synopsis of some use cases in the agricultural sector:
  • In a vineyard for wine production, where air temperature and humidity monitoring is conducted for the optimal growing of grapes, the preferred range can be indicated to ensure quality. Other measurement methods were not optimal or were even harmful to production. This allows the growers to determine the best growing season and improve their production [70].
  • Organic fertilizer production is based on vermicomposting, a system that transforms organic matter through the combined action of earthworms and micro-organisms, yielding a natural fertilizer with physical, chemical, and biological properties that benefit soil crops. It is monitored for variables such as temperature and humidity, which must remain within specific ranges to ensure the survival and reproduction of earthworms [71].
  • Another use-case is temperature and humidity monitoring in a horse stable. Some tests were carried out, in which there were fluctuations in temperature that caused more messages to be sent. It was also considered that the fluctuations depended on the location of the sensors being near entrances and exits [39].

2.6. Evaluation Scenario

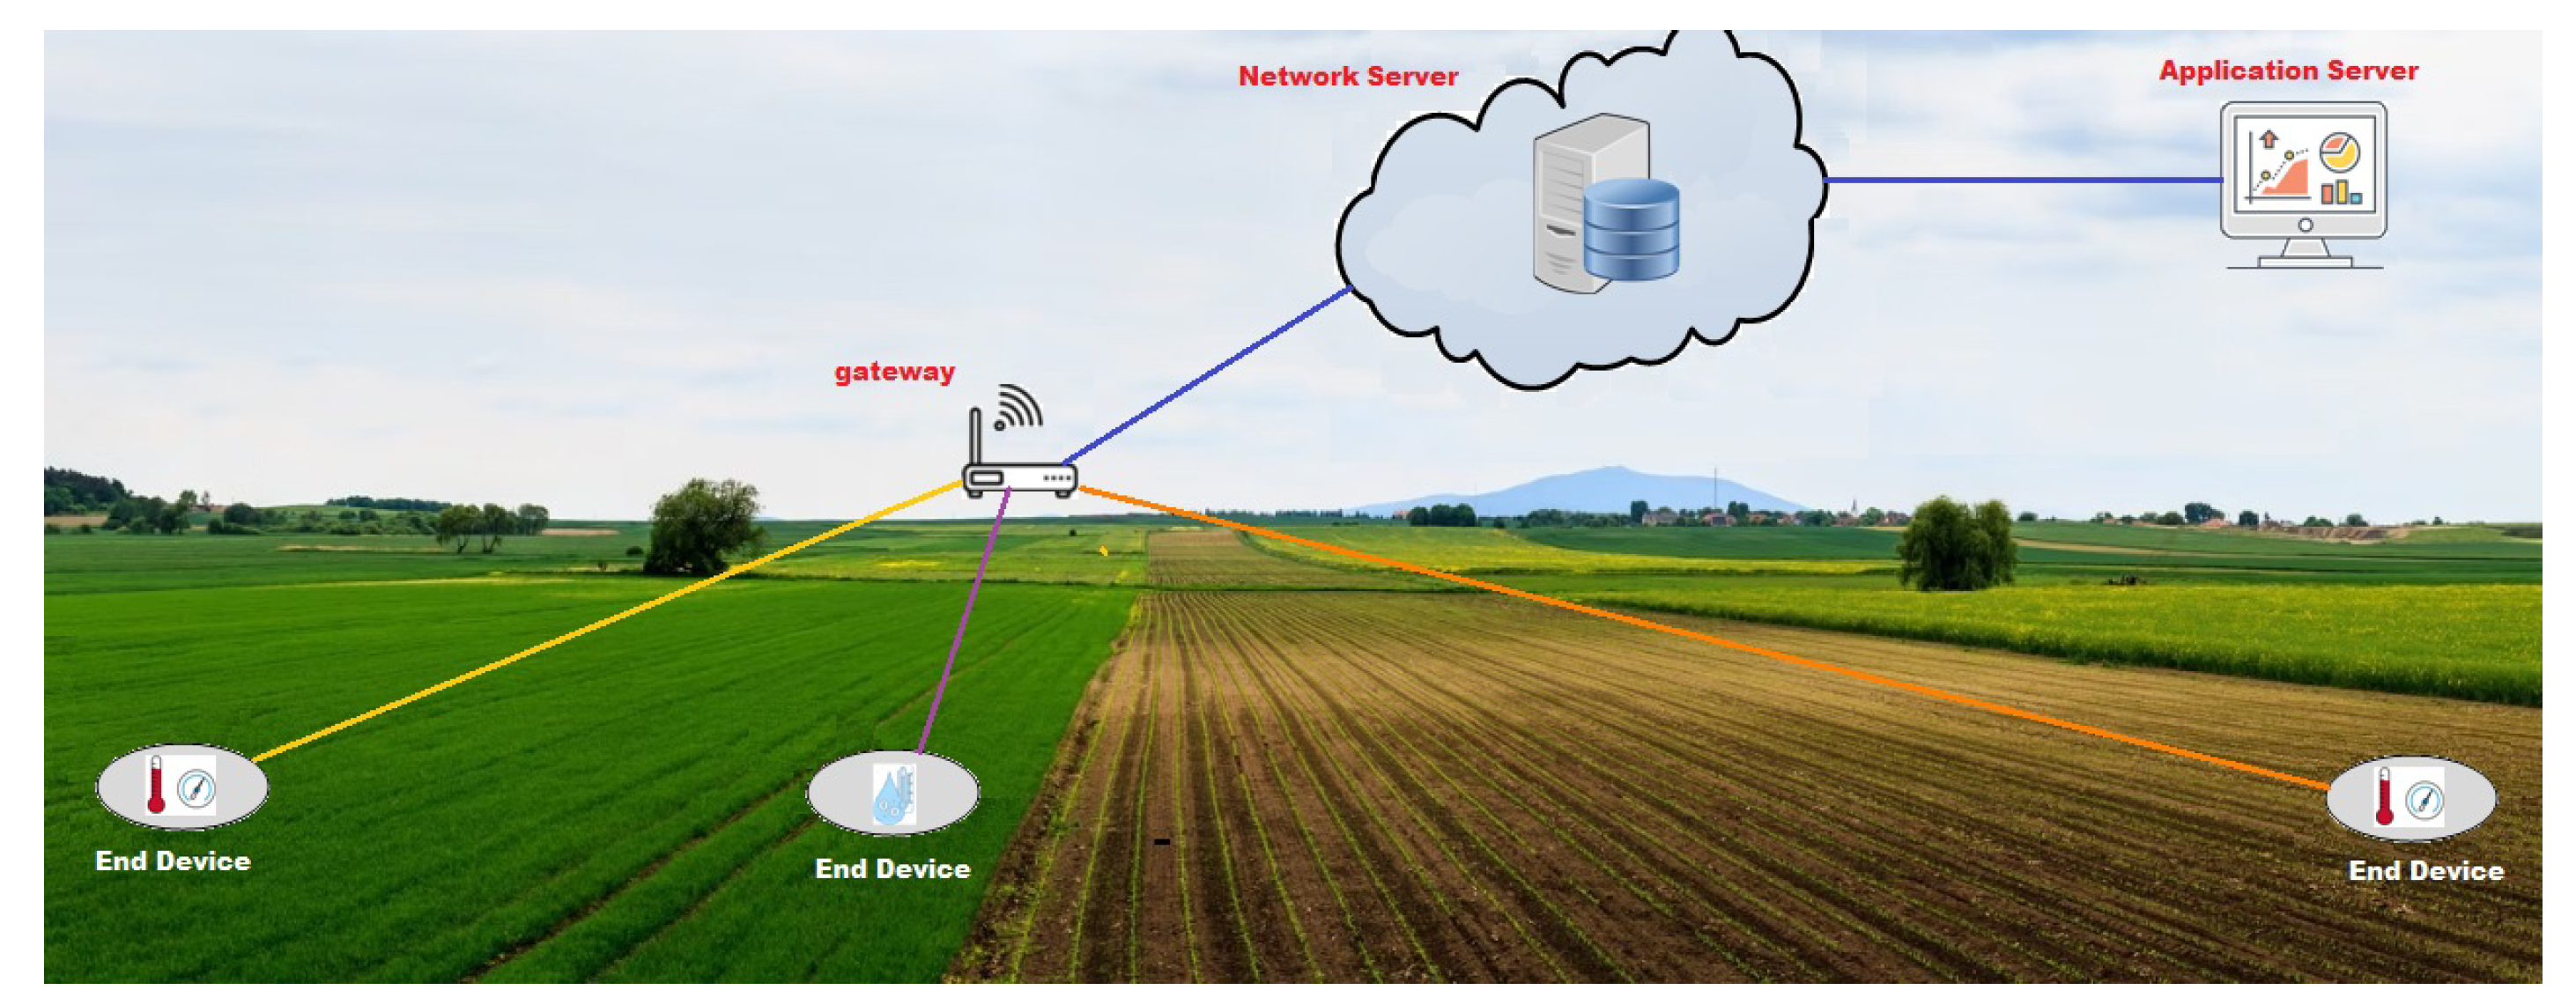
The analysis and evaluation in this work is based on an agricultural scenario applied in rural areas. The coastal region of Ecuador, which is made up of 7 provinces, was chosen. Manabí is the province with the highest extent of surface area, with 18,893 km 2 [72]. The technology employed for this scenario was LoRaWAN as it allows for wide coverage, scalability, low cost, and easy implementation. A coverage area of 5 × 5 km was considered, with a homogeneous distribution of nodes across the simulation area as well as a standard transmission packet size of 10 bytes. The assigned frequency band for Ecuador is 902–928 MHz. This frequency does not have a duty cycle restriction, which allowed it to be considered in this study. In Figure 7, the evaluation scenario is shown.
Some of the particular features of the chosen agricultural environment are:
  • Large areas of land with few obstacles or interferences from other networks as is often the case in urban environments;
  • High density of devices, which should be placed a few meters apart to achieve better resolution of data from climate monitors on crops;
  • Low heterogeneity of the data collected; this means that only a few climatic parameters, such as humidity, temperature, and so on, need to be acquired. For this reason, similar devices are needed for the implementation of the network.
For each measurement presented, the simulation window time was 1 day, and we ran the simulation five times. The results shown in this paper are the average of the five trials. We performed a simulation to measure the scalability of the LoRa/LoRaWAN network; so sensor data were not included in the simulation. Therefore, the size of each transmitted data packet was constant (i.e., 10 bytes long).

2.7. Simulation Environment

To evaluate the proposed scenario, a simulator called Omnet++ was used. This simulator includes a library of open code called FLoRa, developed by researchers at Aalto University in Finland for their studies on LoRa and LoRaWAN [73]. This simulation framework allows for the deployment of a large number of nodes and gateways, configuring the maximum distance in the coordinates X and Y, as well as the object coordinates; propagation loss coefficients in the wireless communication medium; and activating or deactivating the ADR technology in both nodes and the network server (see Section 2.3).
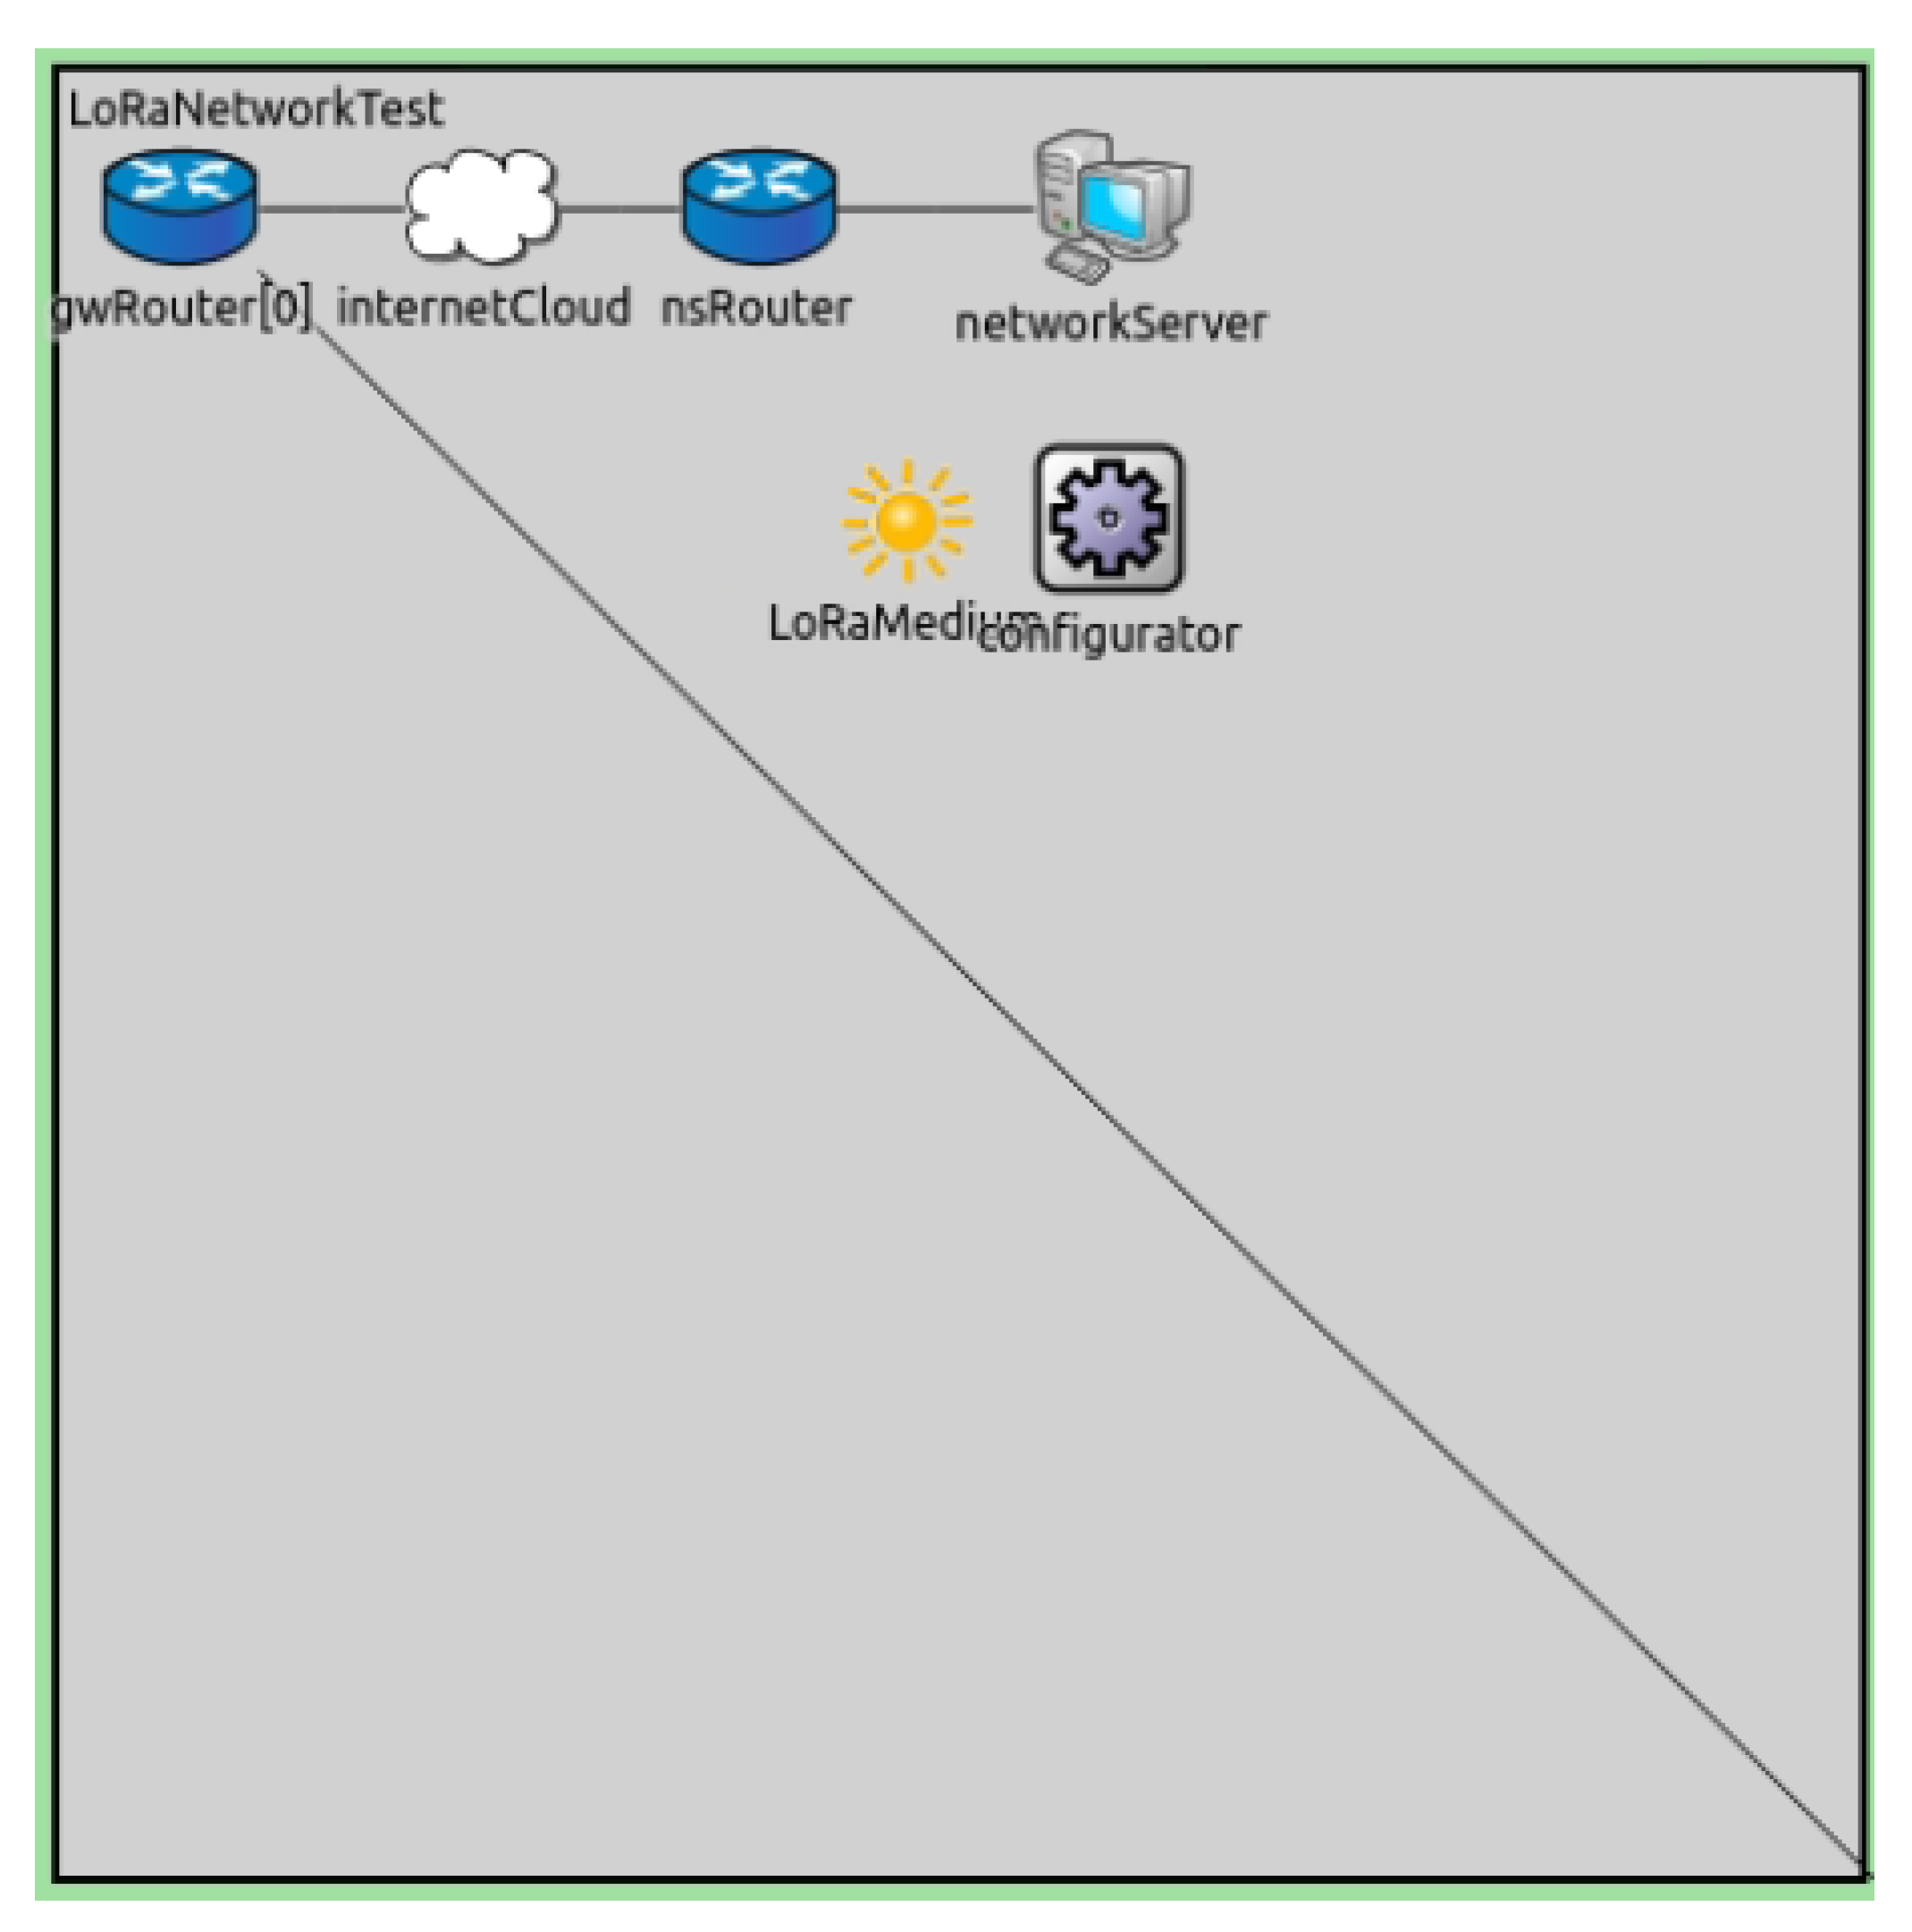
Figure 8 shows the implementation of the LoRa network architecture design, where the link connected to the GwRouter comes from the gateways located in the simulation area. This router is connected through any network link to the network server (networkServer in Figure 8) which, in this case, is represented by InternetCloud and nsRouter. As mentioned before, we could change the transmission media parameters—in our case, the propagation losses (LoRaMedium)—as well as other network configurations, such as the transmission latency, IPv4 routing, and so on, which we kept constant.
For simulations, the tool provides metrics that can be collected to analyze the behavior of the network that has been simulated. Some of the metrics considered in this study are:
  • Packet Delivery Ratio. This is the relationship between the supply of packets sent by all nodes and the successfully received packets by the network server.
  • Energy consumption. This is the total energy consumption of all nodes, expressed in Joules (J).
  • Packet collisions. This is the total number of packet collisions in all gateways present on the network.
One of the elements analyzed in this project is the scalability of the network, which was analyzed using the simulator. In the simulation environment, between 100 and 3000 LoRa devices were deployed. The simulation of scenarios was carried out by varying the following input parameters:
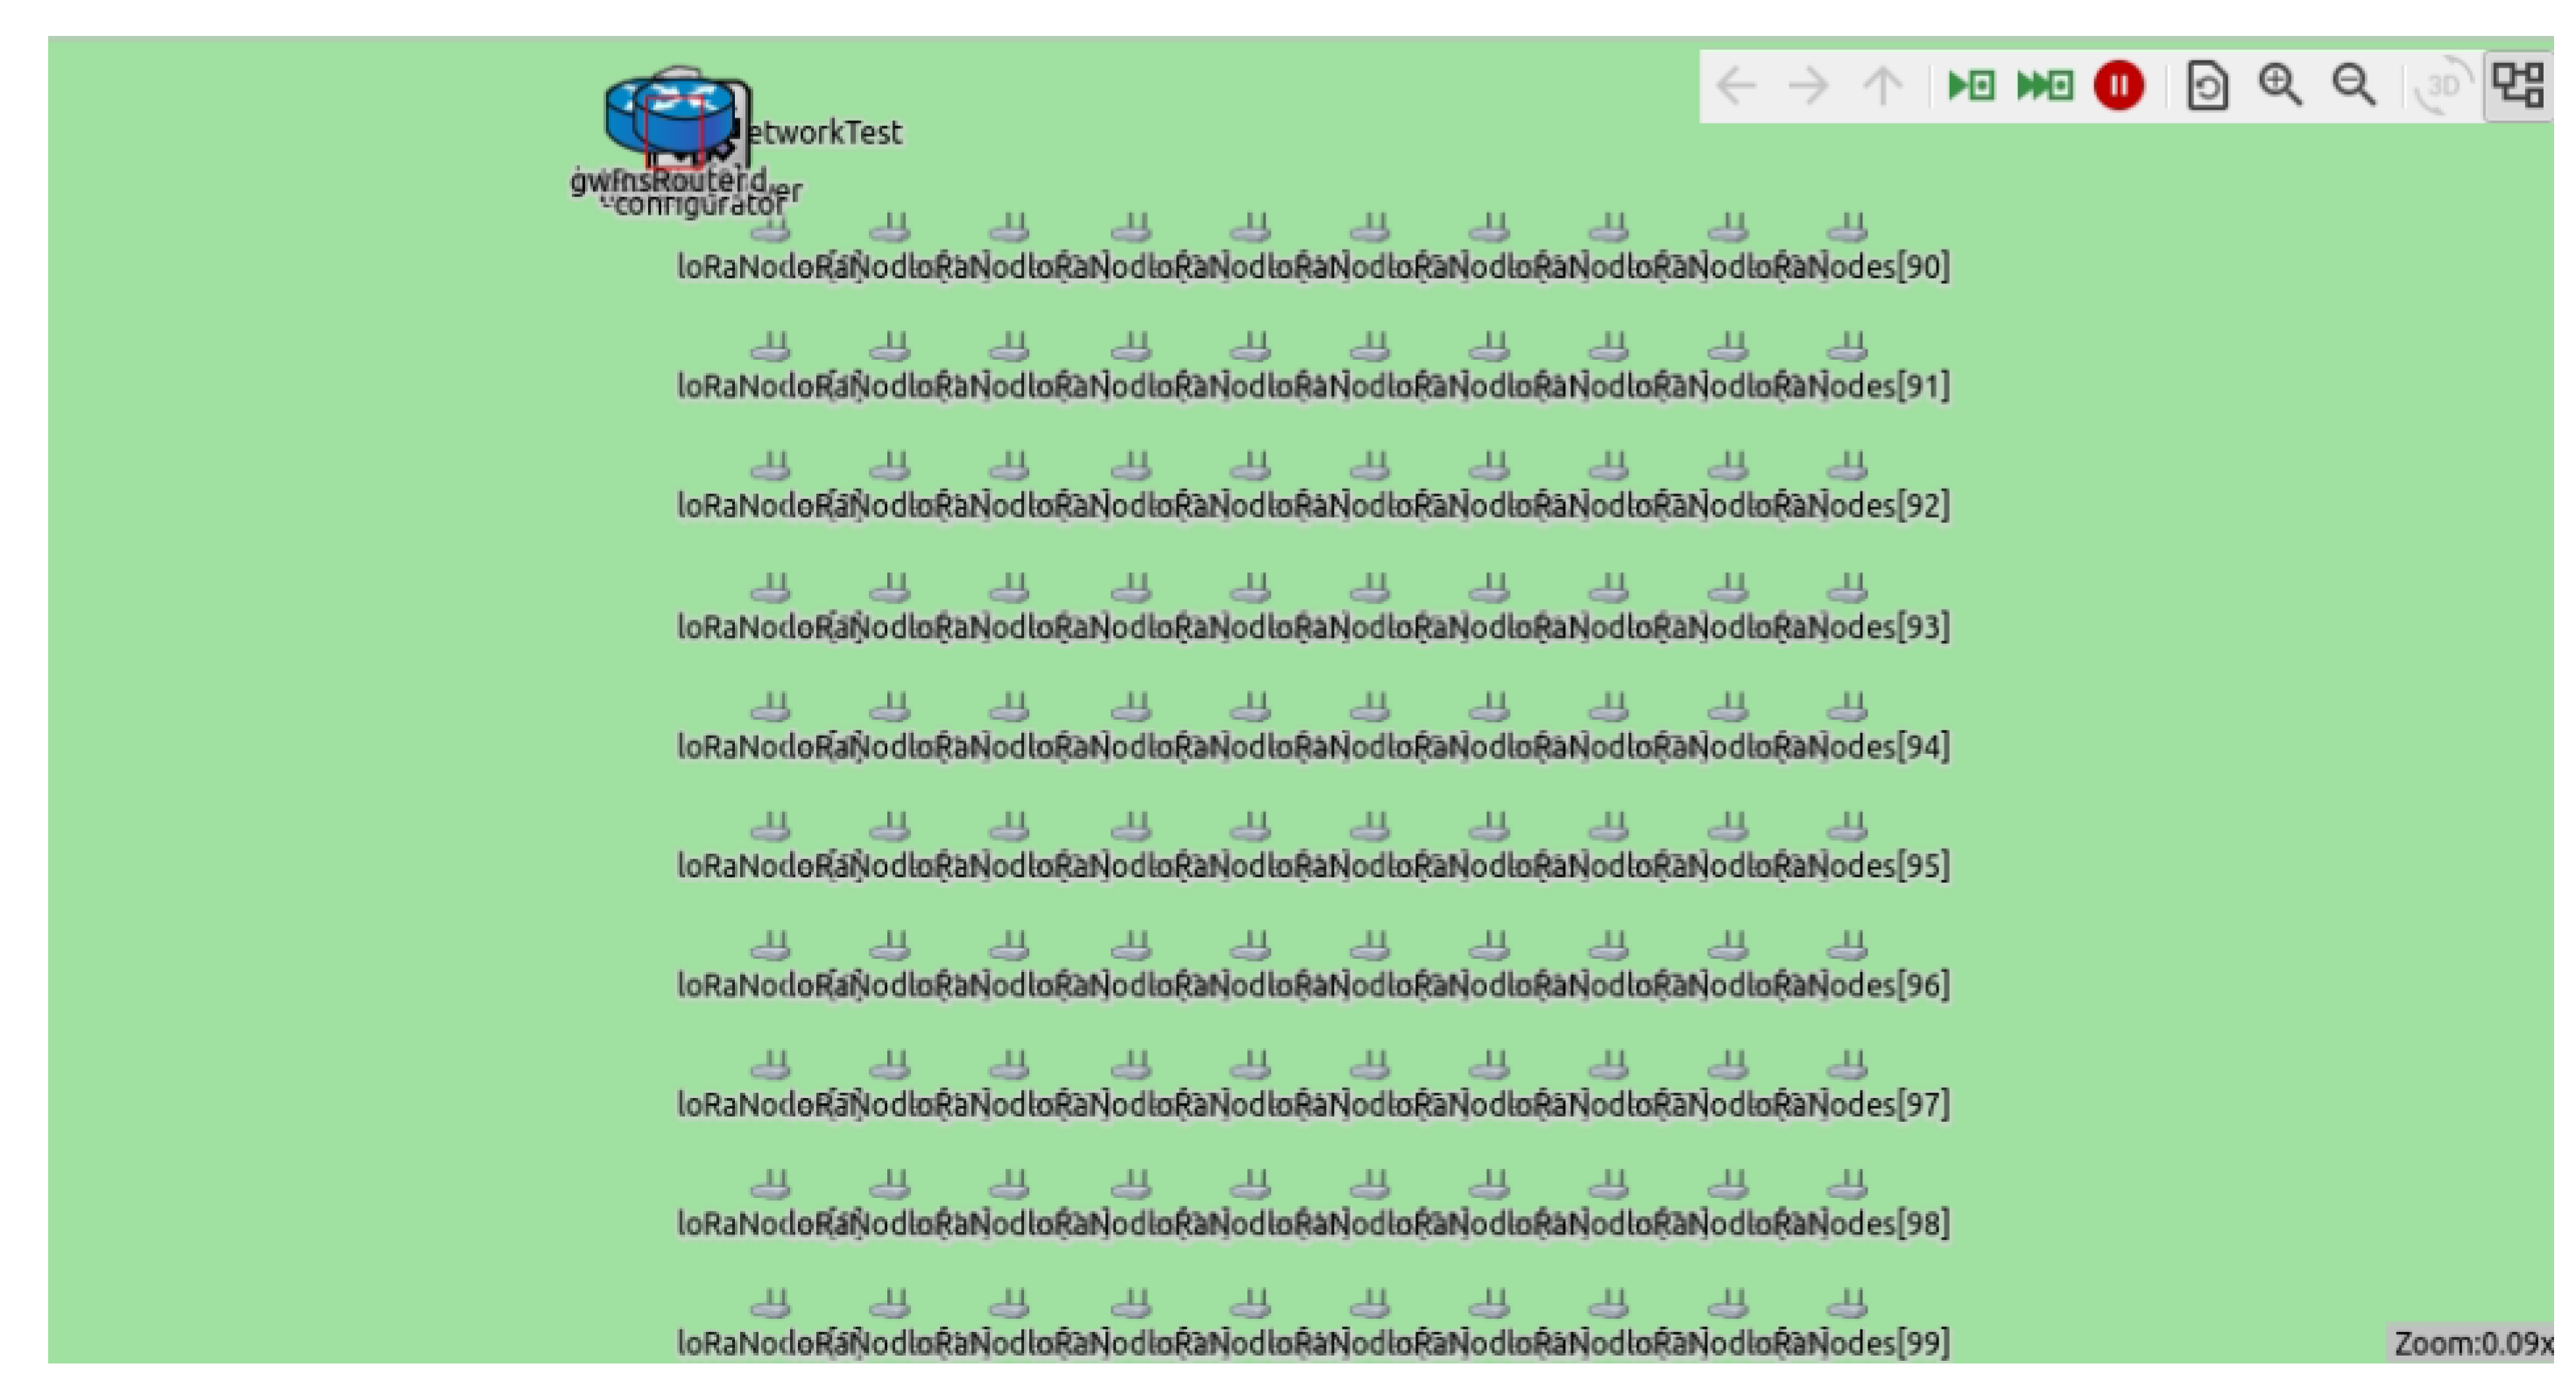
  • Number of nodes. A simulation was started with 100 nodes (Figure 9), and the number was increased by 100 nodes for each subsequent simulation. Considering computational power issues, we were able to achieve up to 3000 nodes in most cases, a scenario in which each simulation took more than 2 h.
  • Number of gateways. Two scenarios were considered—with 1 and 2 gateways—to observe the network behavior and determine which situation was better for each alternative.
  • ADR. The Adaptive Data Rate can be activated or disabled in the simulation configurations. Both options were checked to observe the impact of this mechanism.
  • Propagation losses. We considered configurations that allow for the simulation of ideal propagation conditions (i.e., with almost no losses), as well as moderate propagation conditions, which better represent wireless transmission in rural environments.

3. Results

The following section details the results obtained from the methodology proposed for assessing the performance of communication systems used in IoT, such as propagation losses, energy consumption, and collisions.
First, we detail the impact that the wireless propagation medium has on the packet delivery factor, contrasting ideal conditions (without losses) with medium conditions (with moderate losses) simulating the considered rural scenario. Next, simulations are performed with two gateways within the network to compare their metrics with those obtained with a single gateway. In the latter case, a rural propagation medium is considered to simulate as realistic an environment as possible. It should be noted that in all cases the network with ADR technology enabled is compared to that without (i.e., where transmission power parameters and the scattering coefficient SF are kept constant).

3.1. Impact of Wireless Medium Propagation with a Single Gateway

Simulating the impact of the propagation medium with a single gateway is one of the first parameters to consider. The simulation tool includes several scenarios, including an ideal wireless medium with no propagation losses, another with moderate losses, and a third with very high losses due to obstruction by buildings and trees, as well as interference from other networks using the same frequency band. The moderate loss scenario models an environment with few obstacles and negligible interference. This represents the rural/agricultural setting of the given LPWAN application. The positive impact of ADR commands on packet delivery ratio was also measured. When ADR technology is active, the network server receives information from the gateway about the Signal-to-Noise Ratio (SNR) to adjust the transmission power or SF. In this way, when a node has difficulty reaching the network server, adjustments are made such that the communication improves; conversely, when a node has excellent transmission parameters—either because it is close to the gateway or there is low interference—power consumption is reduced, thereby conserving energy. Thus, ADR optimizes energy consumption while guaranteeing communication between nodes.

3.1.1. Simulating Wireless Medium without Losses in Propagation: Ideal Environment

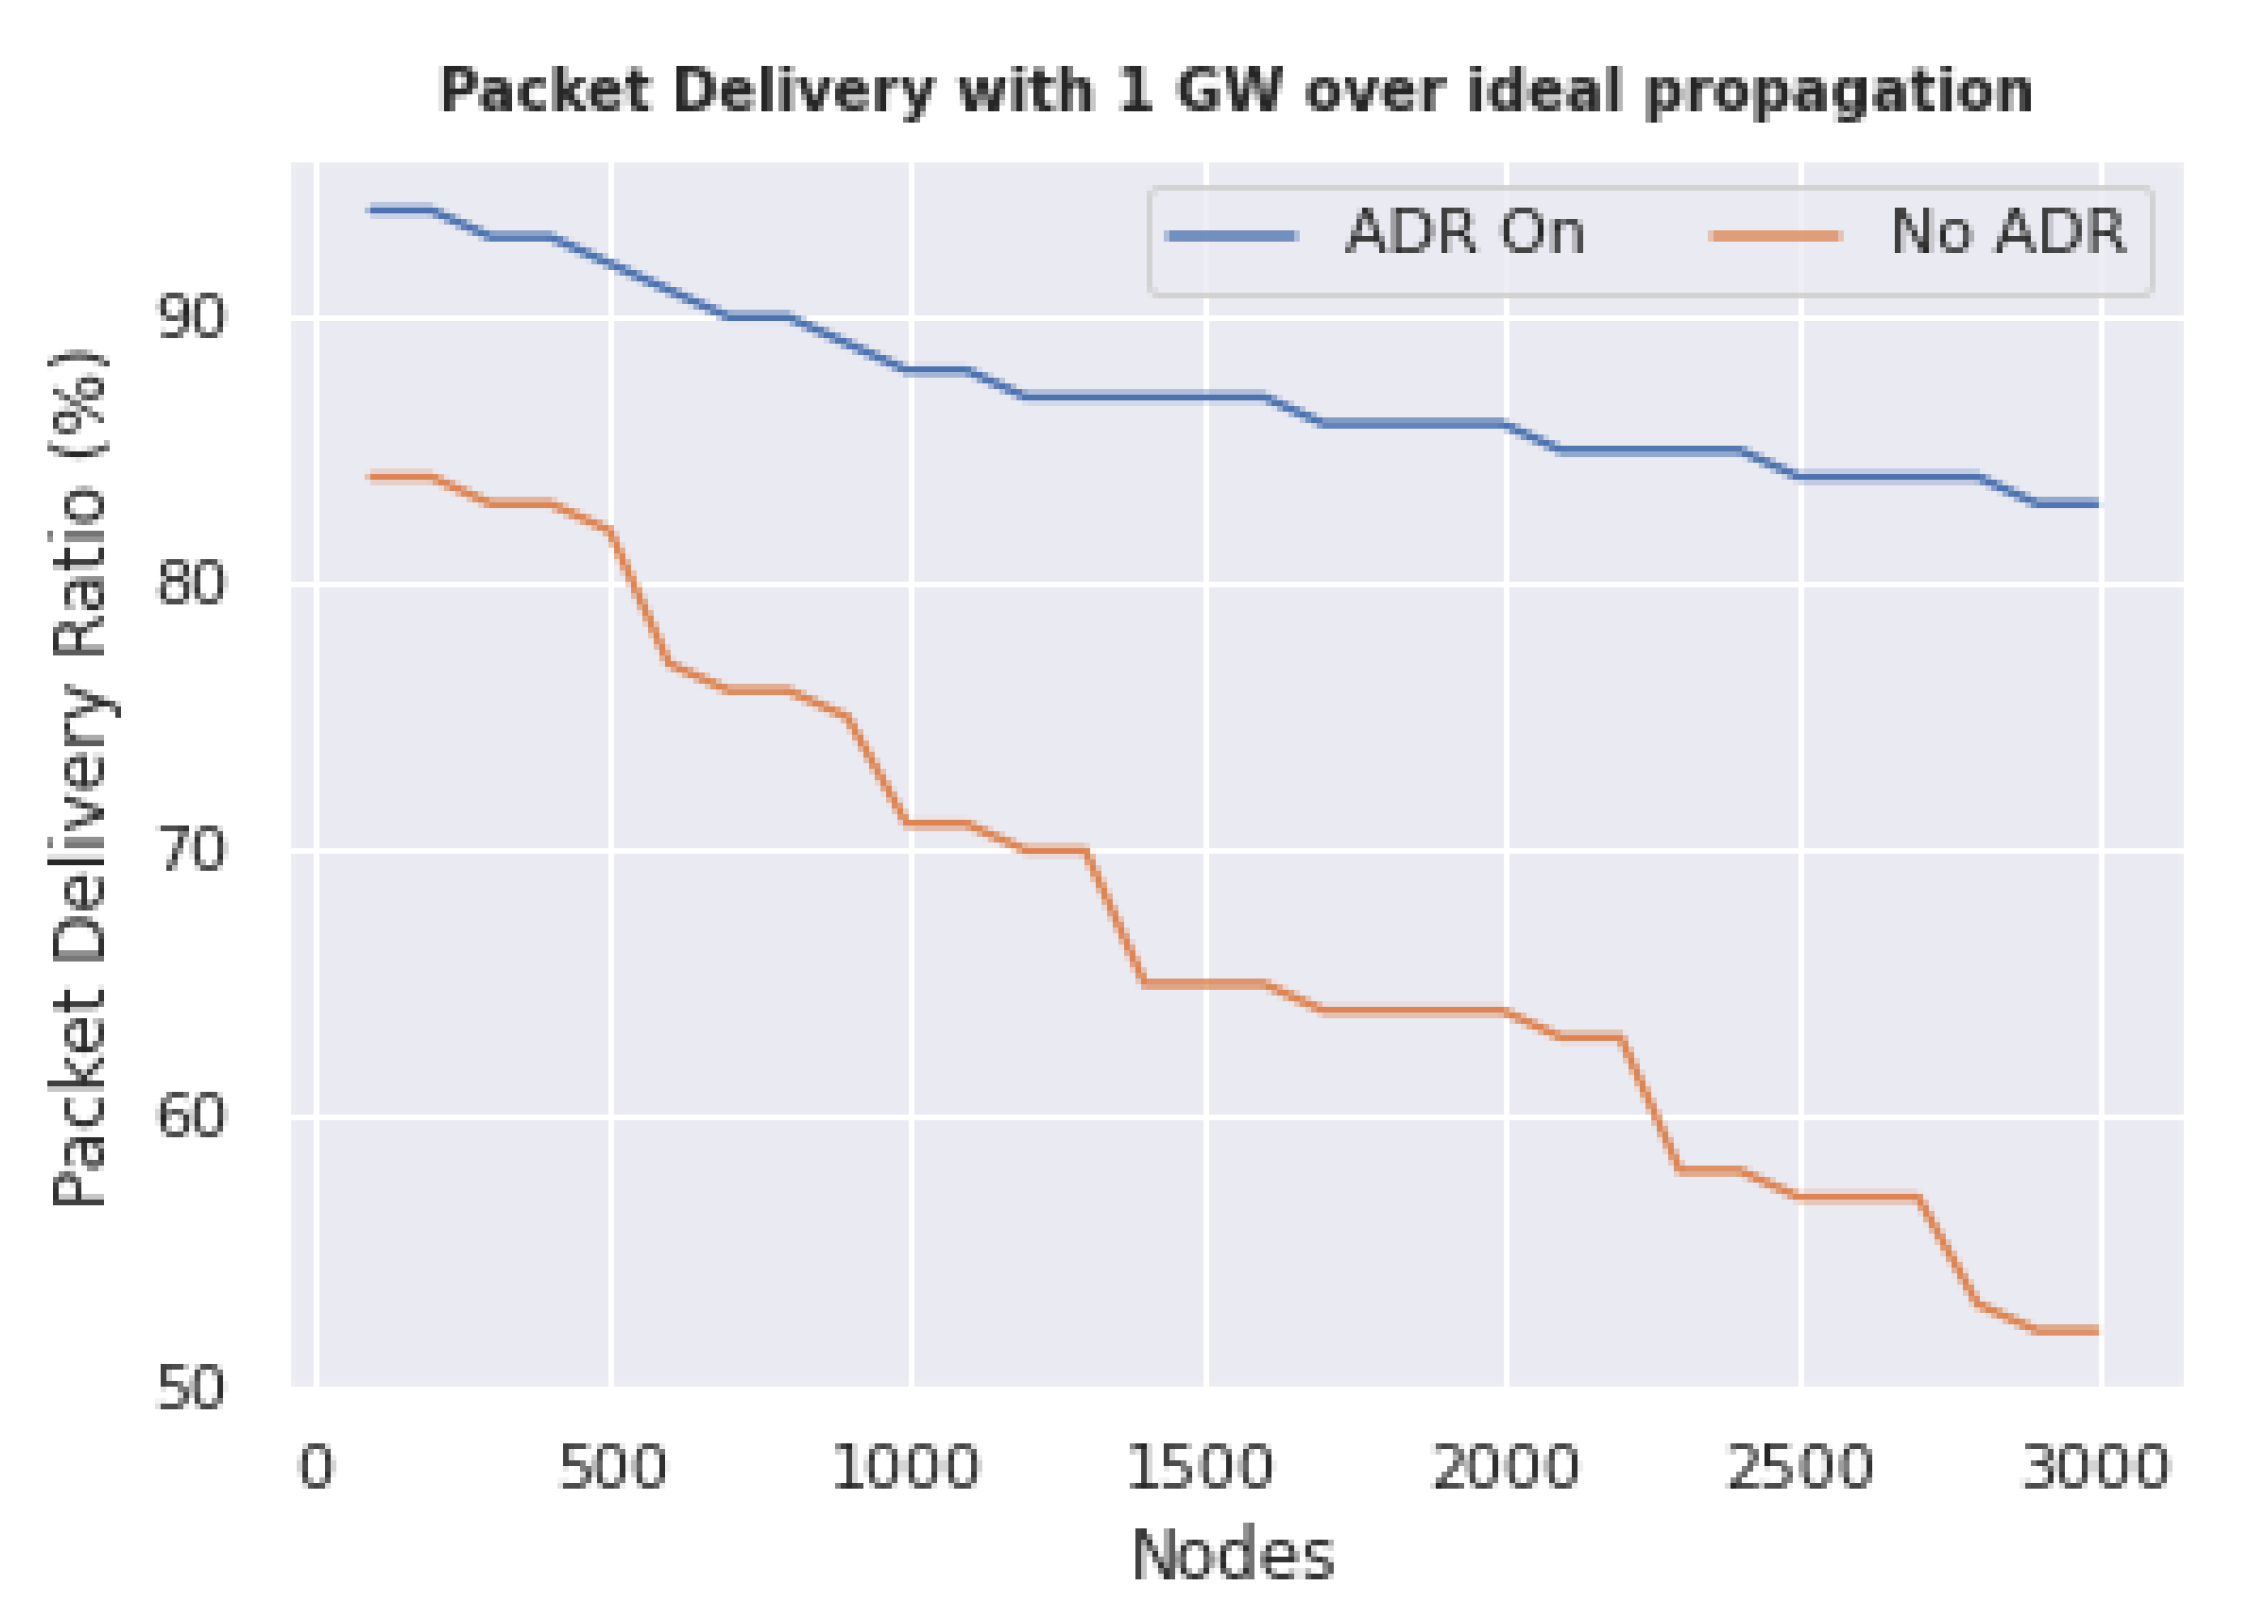
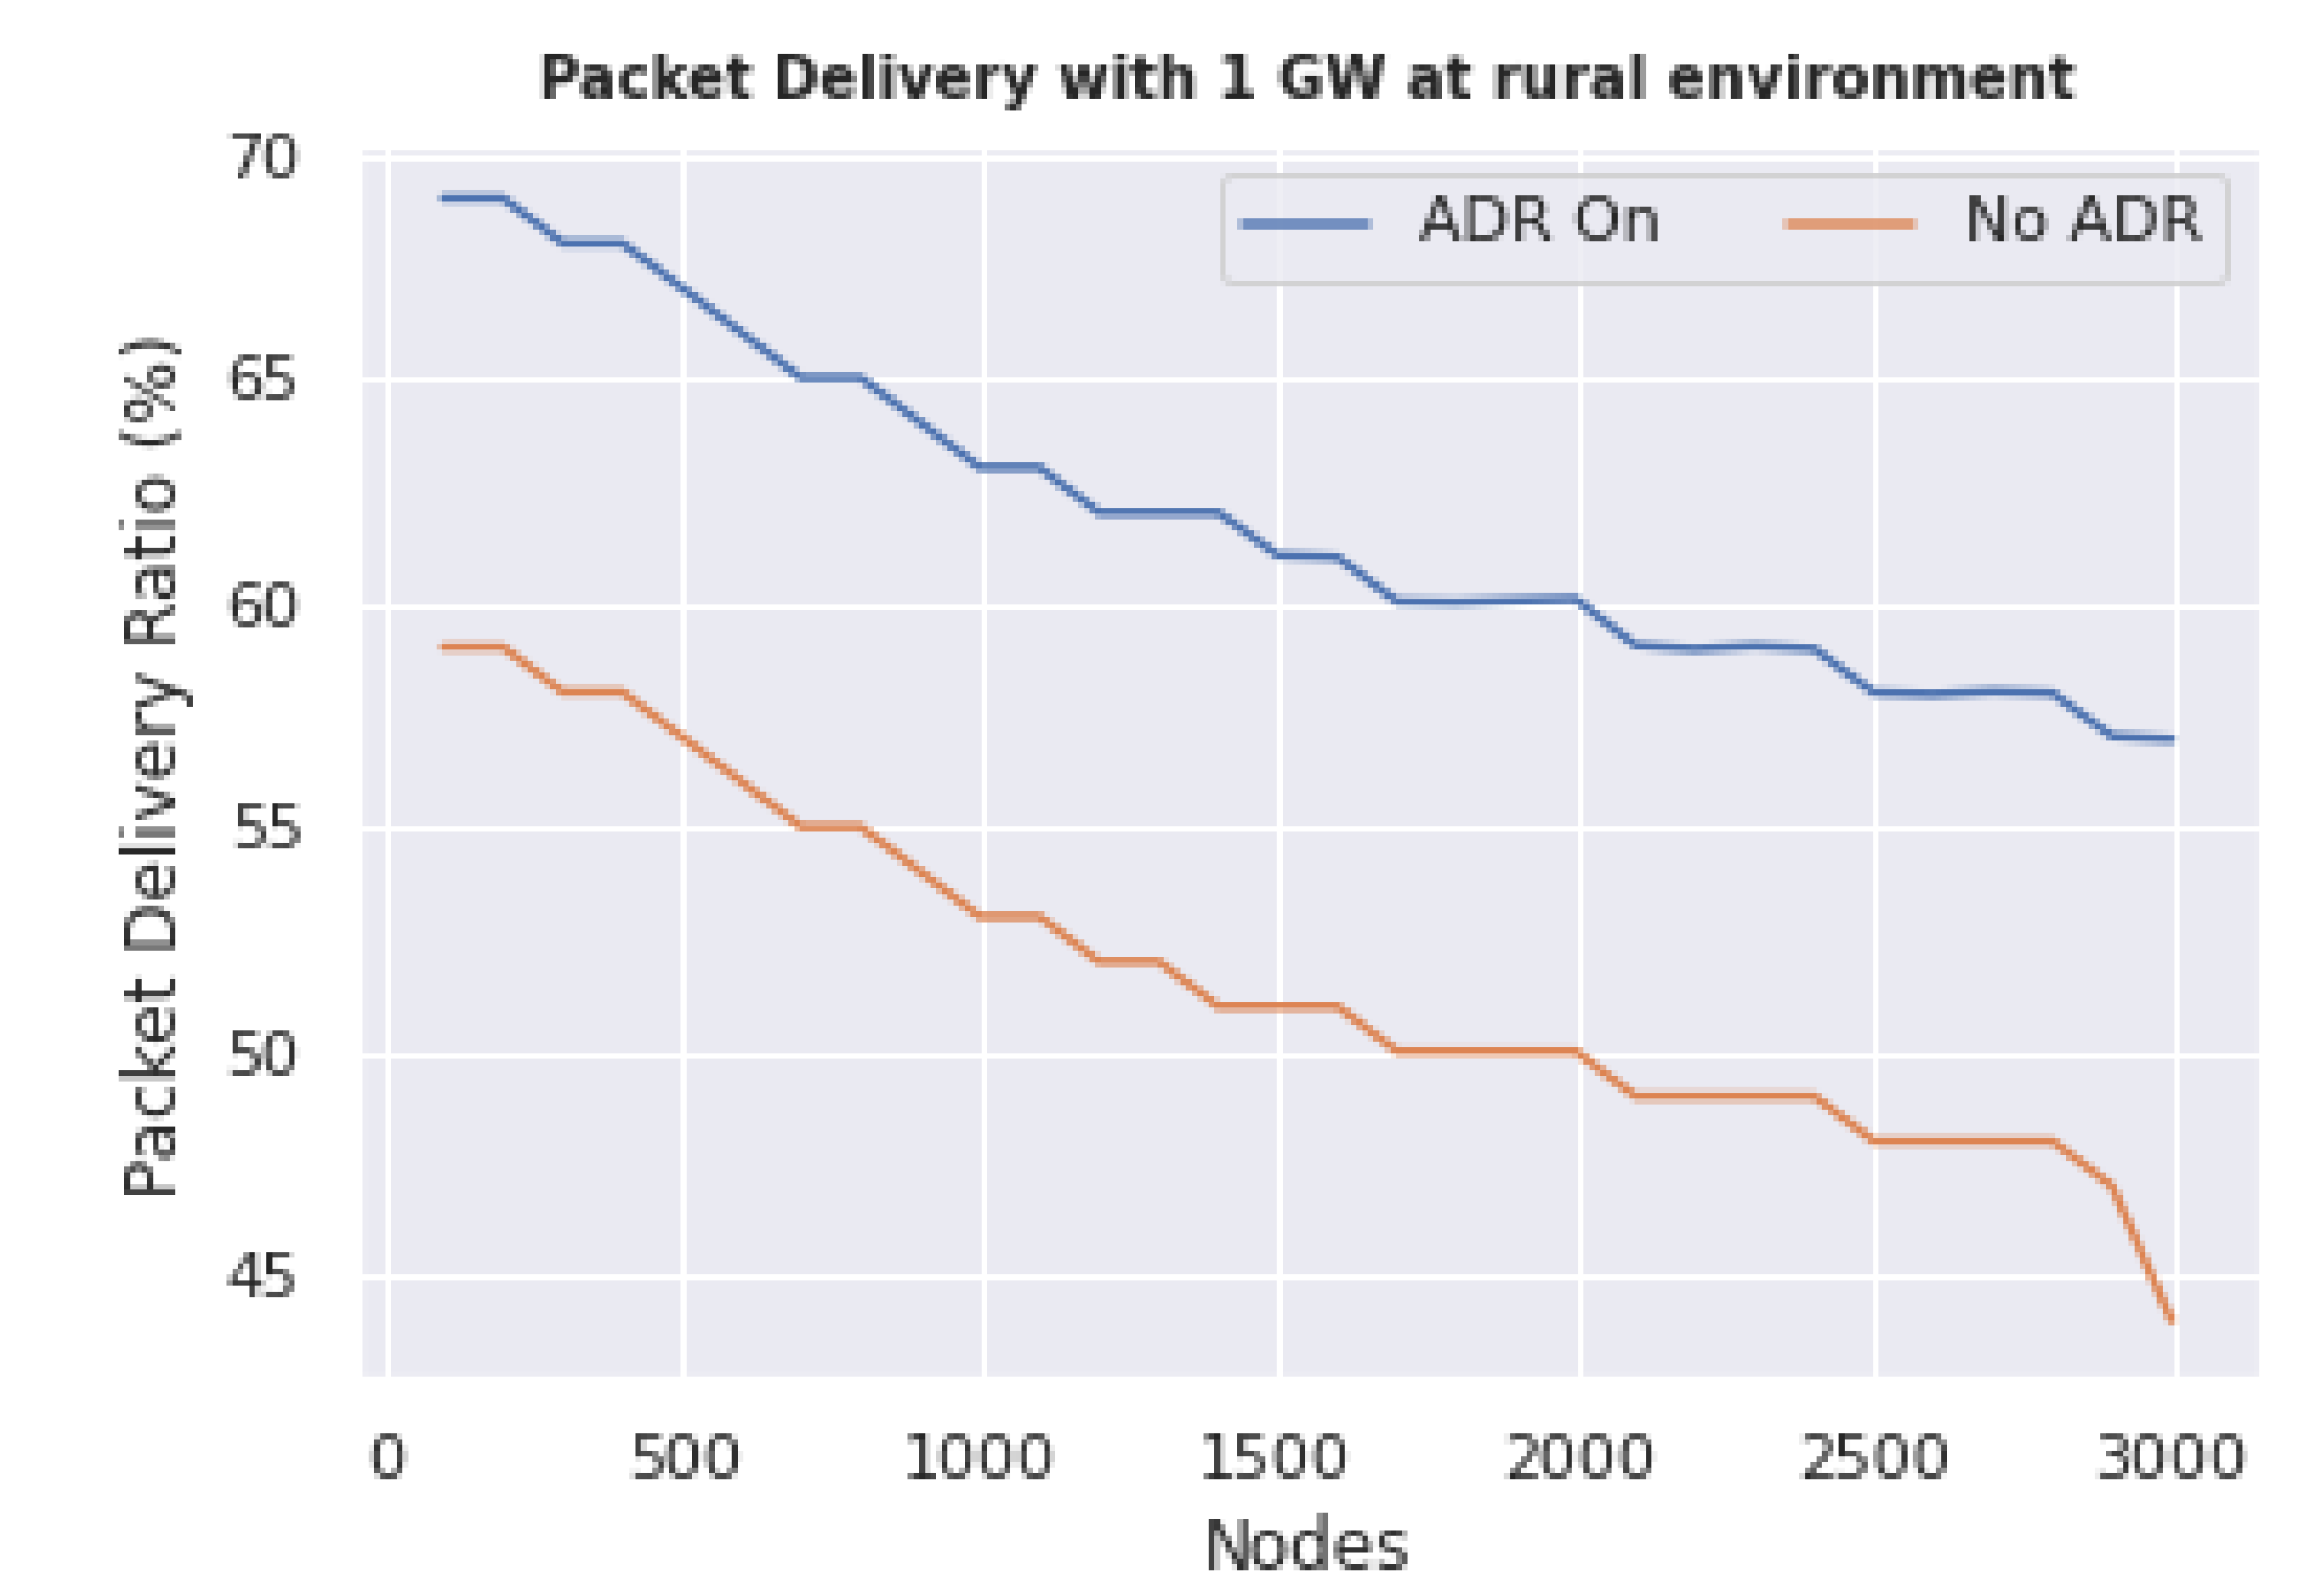
Figure 10 and Figure 11 show the results under ideal and rural conditions for the propagation medium, respectively. In both graphs, it can be seen that communication was maintained with high performance when ADR technology was active (ADR On), while it quickly declined when ADR was not active (No ADR), that is, when the nodes kept the power parameters and scattering factor settings with which they were originally configured.
To analyze the results of the simulation with a gateway, we will place the point at which there are 100 nodes and the ADR in state No ADR. It can be observed that the delivery ratio is 85%, and for the ADR in On it increases to 93%, an improvement of 9%.
For the case of 3000 nodes, the delivery of packets with the ADR in No ADR is 51%. When the ADR is in On for 3000 nodes, the packet delivery factor is 84%, an improvement of 64%.

3.1.2. Simulating Wireless Medium Moderate Propagation Losses: Rural Environment

In Figure 11, the packet delivery ratio results for the rural environment can be observed. To analyze these results, we located the point at which there were 100 nodes with the ADR in state No ADR. From this graph, it can be seen that the packet delivery ratio was 58%, while with the ADR in On mode, it increased to 68%, comprising an improvement of 17%. For 3000 nodes, parcel delivery with the ADR in state No ADR was 44% while, when the ADR was in On mode for 3000 nodes, the package delivery factor increased to 57%, representing a 30% improvement.
From these results, it can be seen that as the number of nodes increased—both for the ideal simulation environment and for rural settings—the delivery ratio also decreased, having a negative impact on the transmission quality. It was observed that ADR technology improved communication, although it struggled to maintain packet transmission performance as the number of nodes increased. This is consistent with the simulated obstacles and interference in the propagation medium.

3.2. Packet Delivery Ratio Simulation with Two Gateways

To achieve redundancy against incidents, one solution would be to place two gateways in the simulation area. In this case, if one of the gateways fails, communication between the nodes and the network server can be maintained. In LoRaWAN, when there are two gateways, the nodes transmit their packets in broadcast mode and are received indiscriminately by either gateway, with the network server removing duplicate packets. The latter also decides through which gateway a packet should be sent to a node based on the gateway with the least congestion and best SNR. In this simulation, we added two gateways and compared the results for various factors, such as the packet delivery ratio, when using a single gateway versus when using multiple gateways.
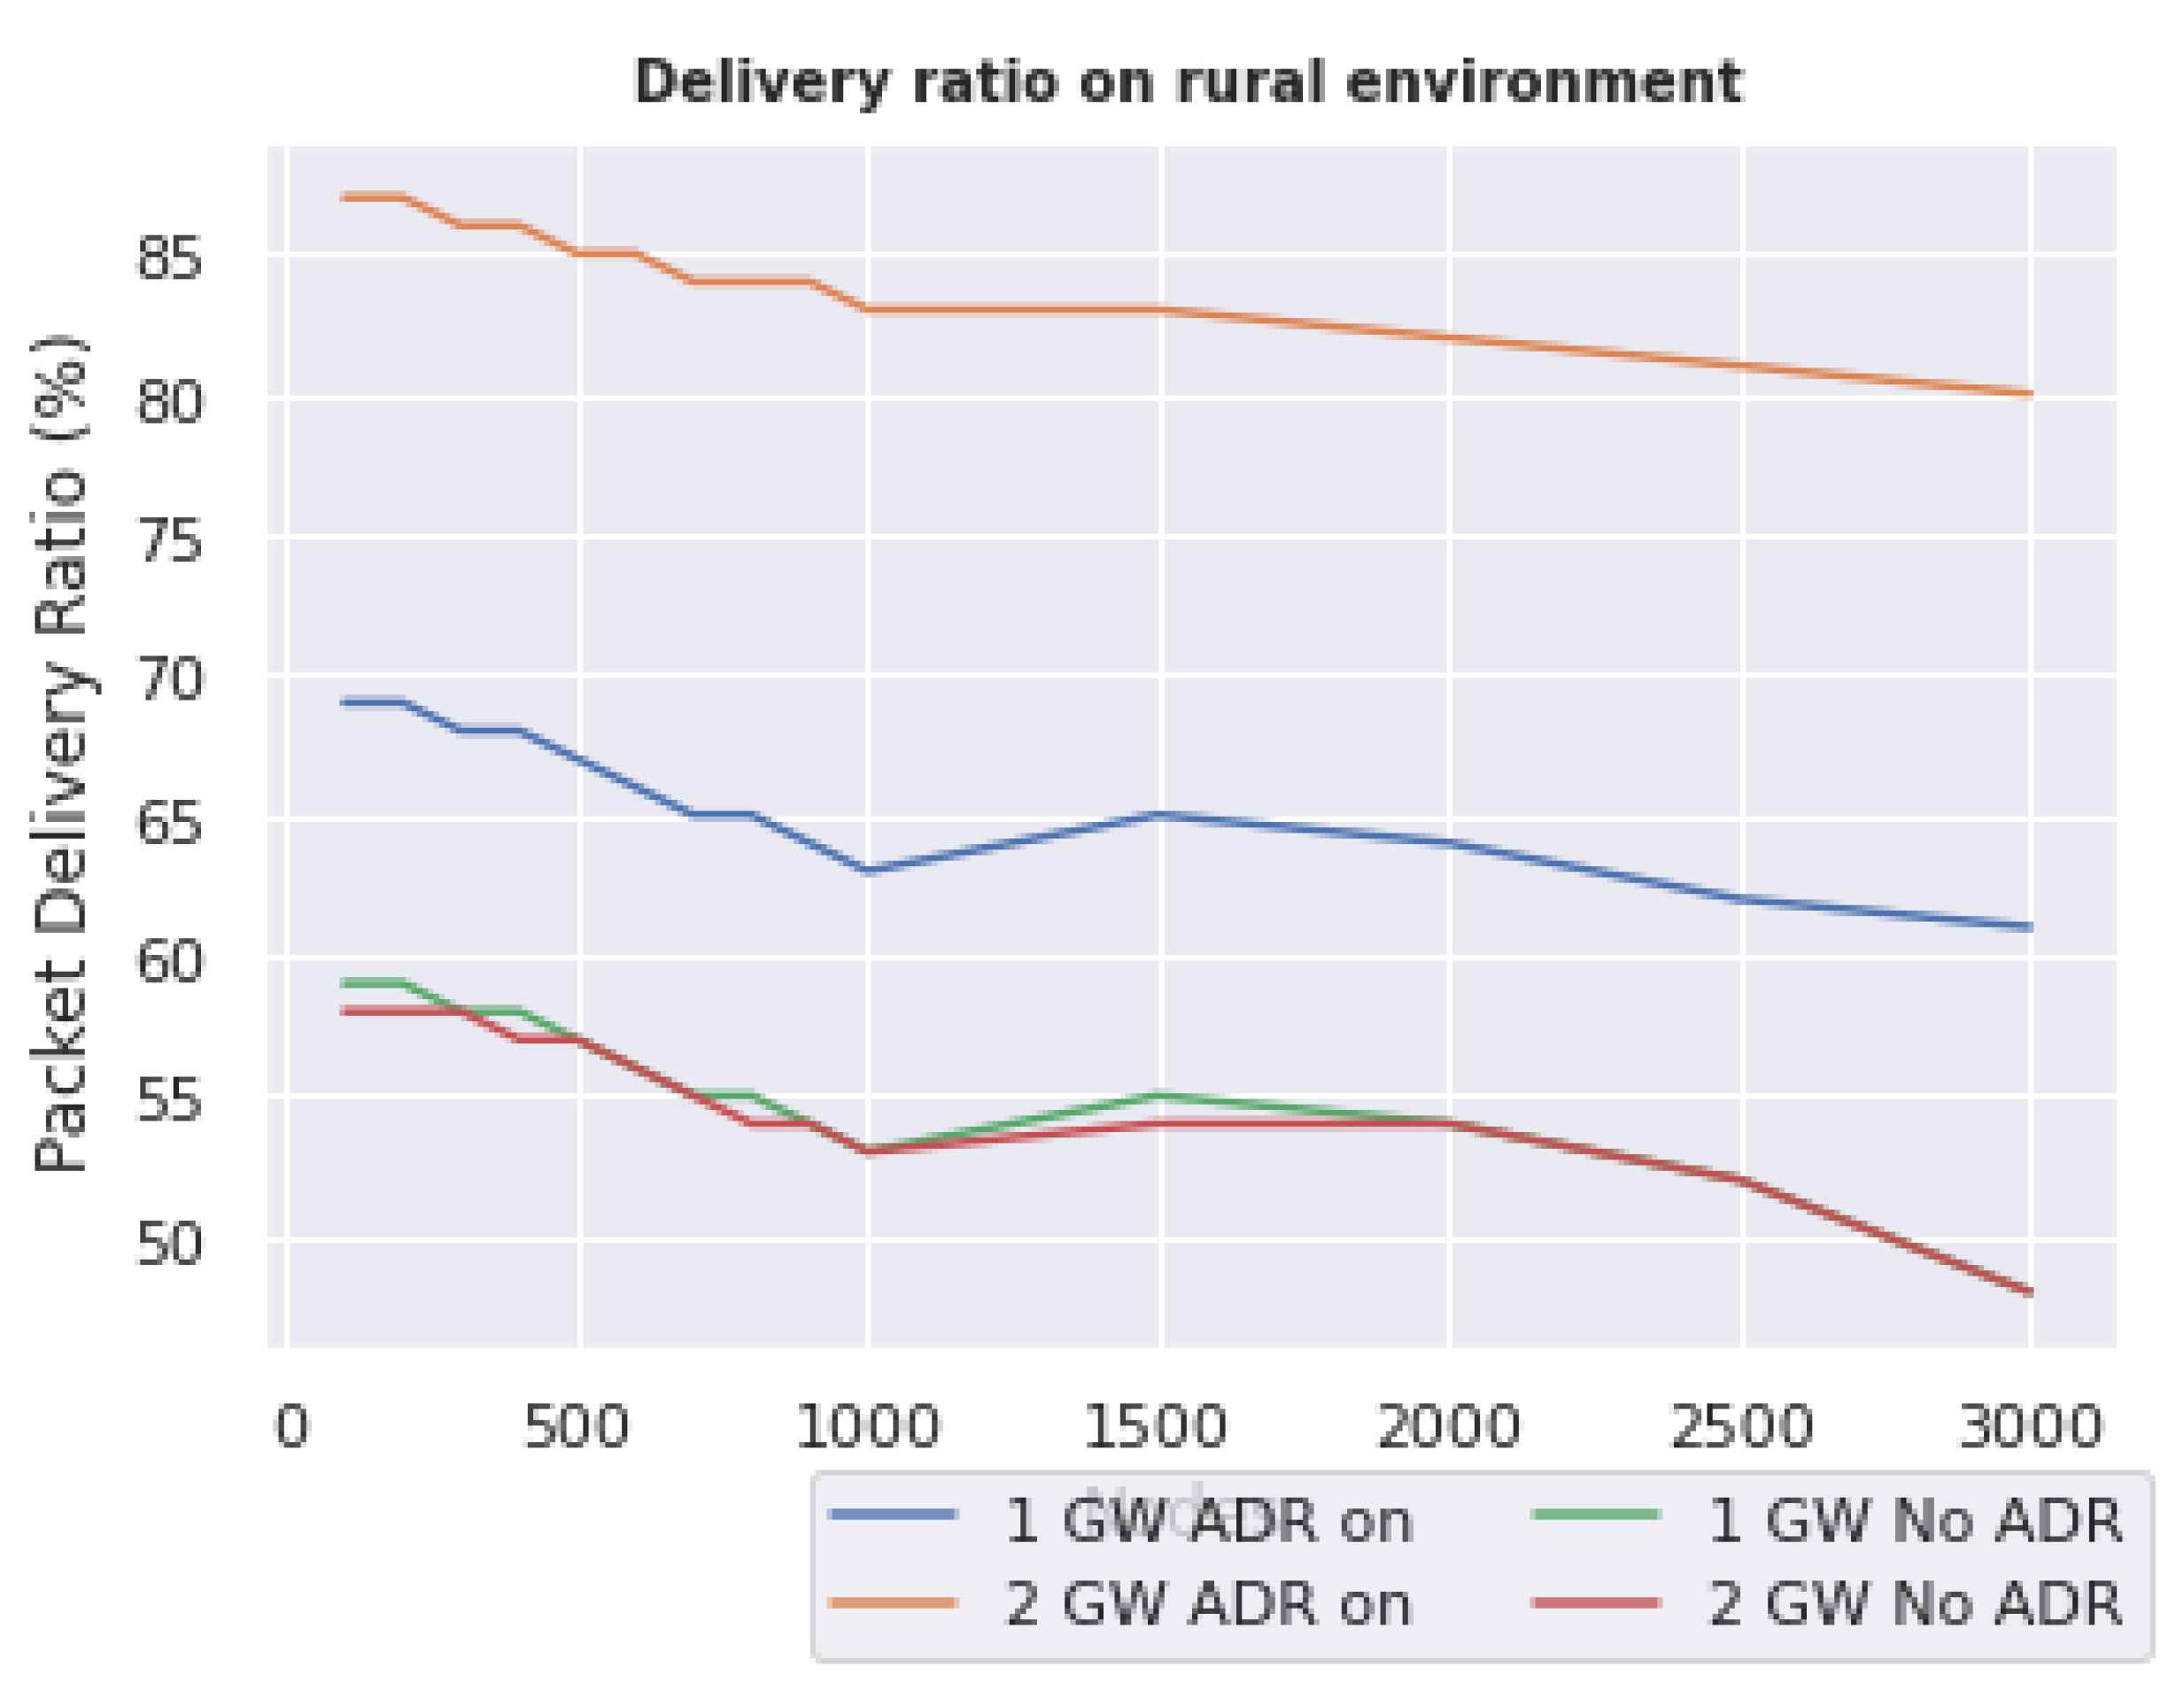
The advantage of having two gateways is that even if one gateway fails, the other can receive data from and send data to the network server. However, as shown in Figure 12, this is only true if ADR technology is activated On. The graphs show that the packet delivery ratio was the same with one or two gateways when ADR was not active (No ADR, green and red lines). In this case, the nodes maintained their communication parameters. This situation is also a result of the simulation area. However, it can be observed that the packet delivery ratio was further improved when ADR technology was active and both gateways were operational.
From the graph, it can be seen that the delivery ratio with two gateways, ADR off, and 100 nodes was 58%, while with two gateways, ADR on, and 100 nodes, it was 87%, comprising a 50% improvement. For the case of two gateways, ADR off, and 3000 nodes, the delivery ratio was 45%, while with two gateways, ADR on, and 3000 nodes, it was 80%, comprising a 77% improvement.
This means that commands sent from ADR when there is only one gateway may not reach certain nodes; therefore, communication for them will not improve. With two gateways, however, the improvement in the rate of successful packet deliveries, as well as scalability and consistency when the number of nodes increases, can be seen; only a 5% drop in successful packet delivery rate occurred.
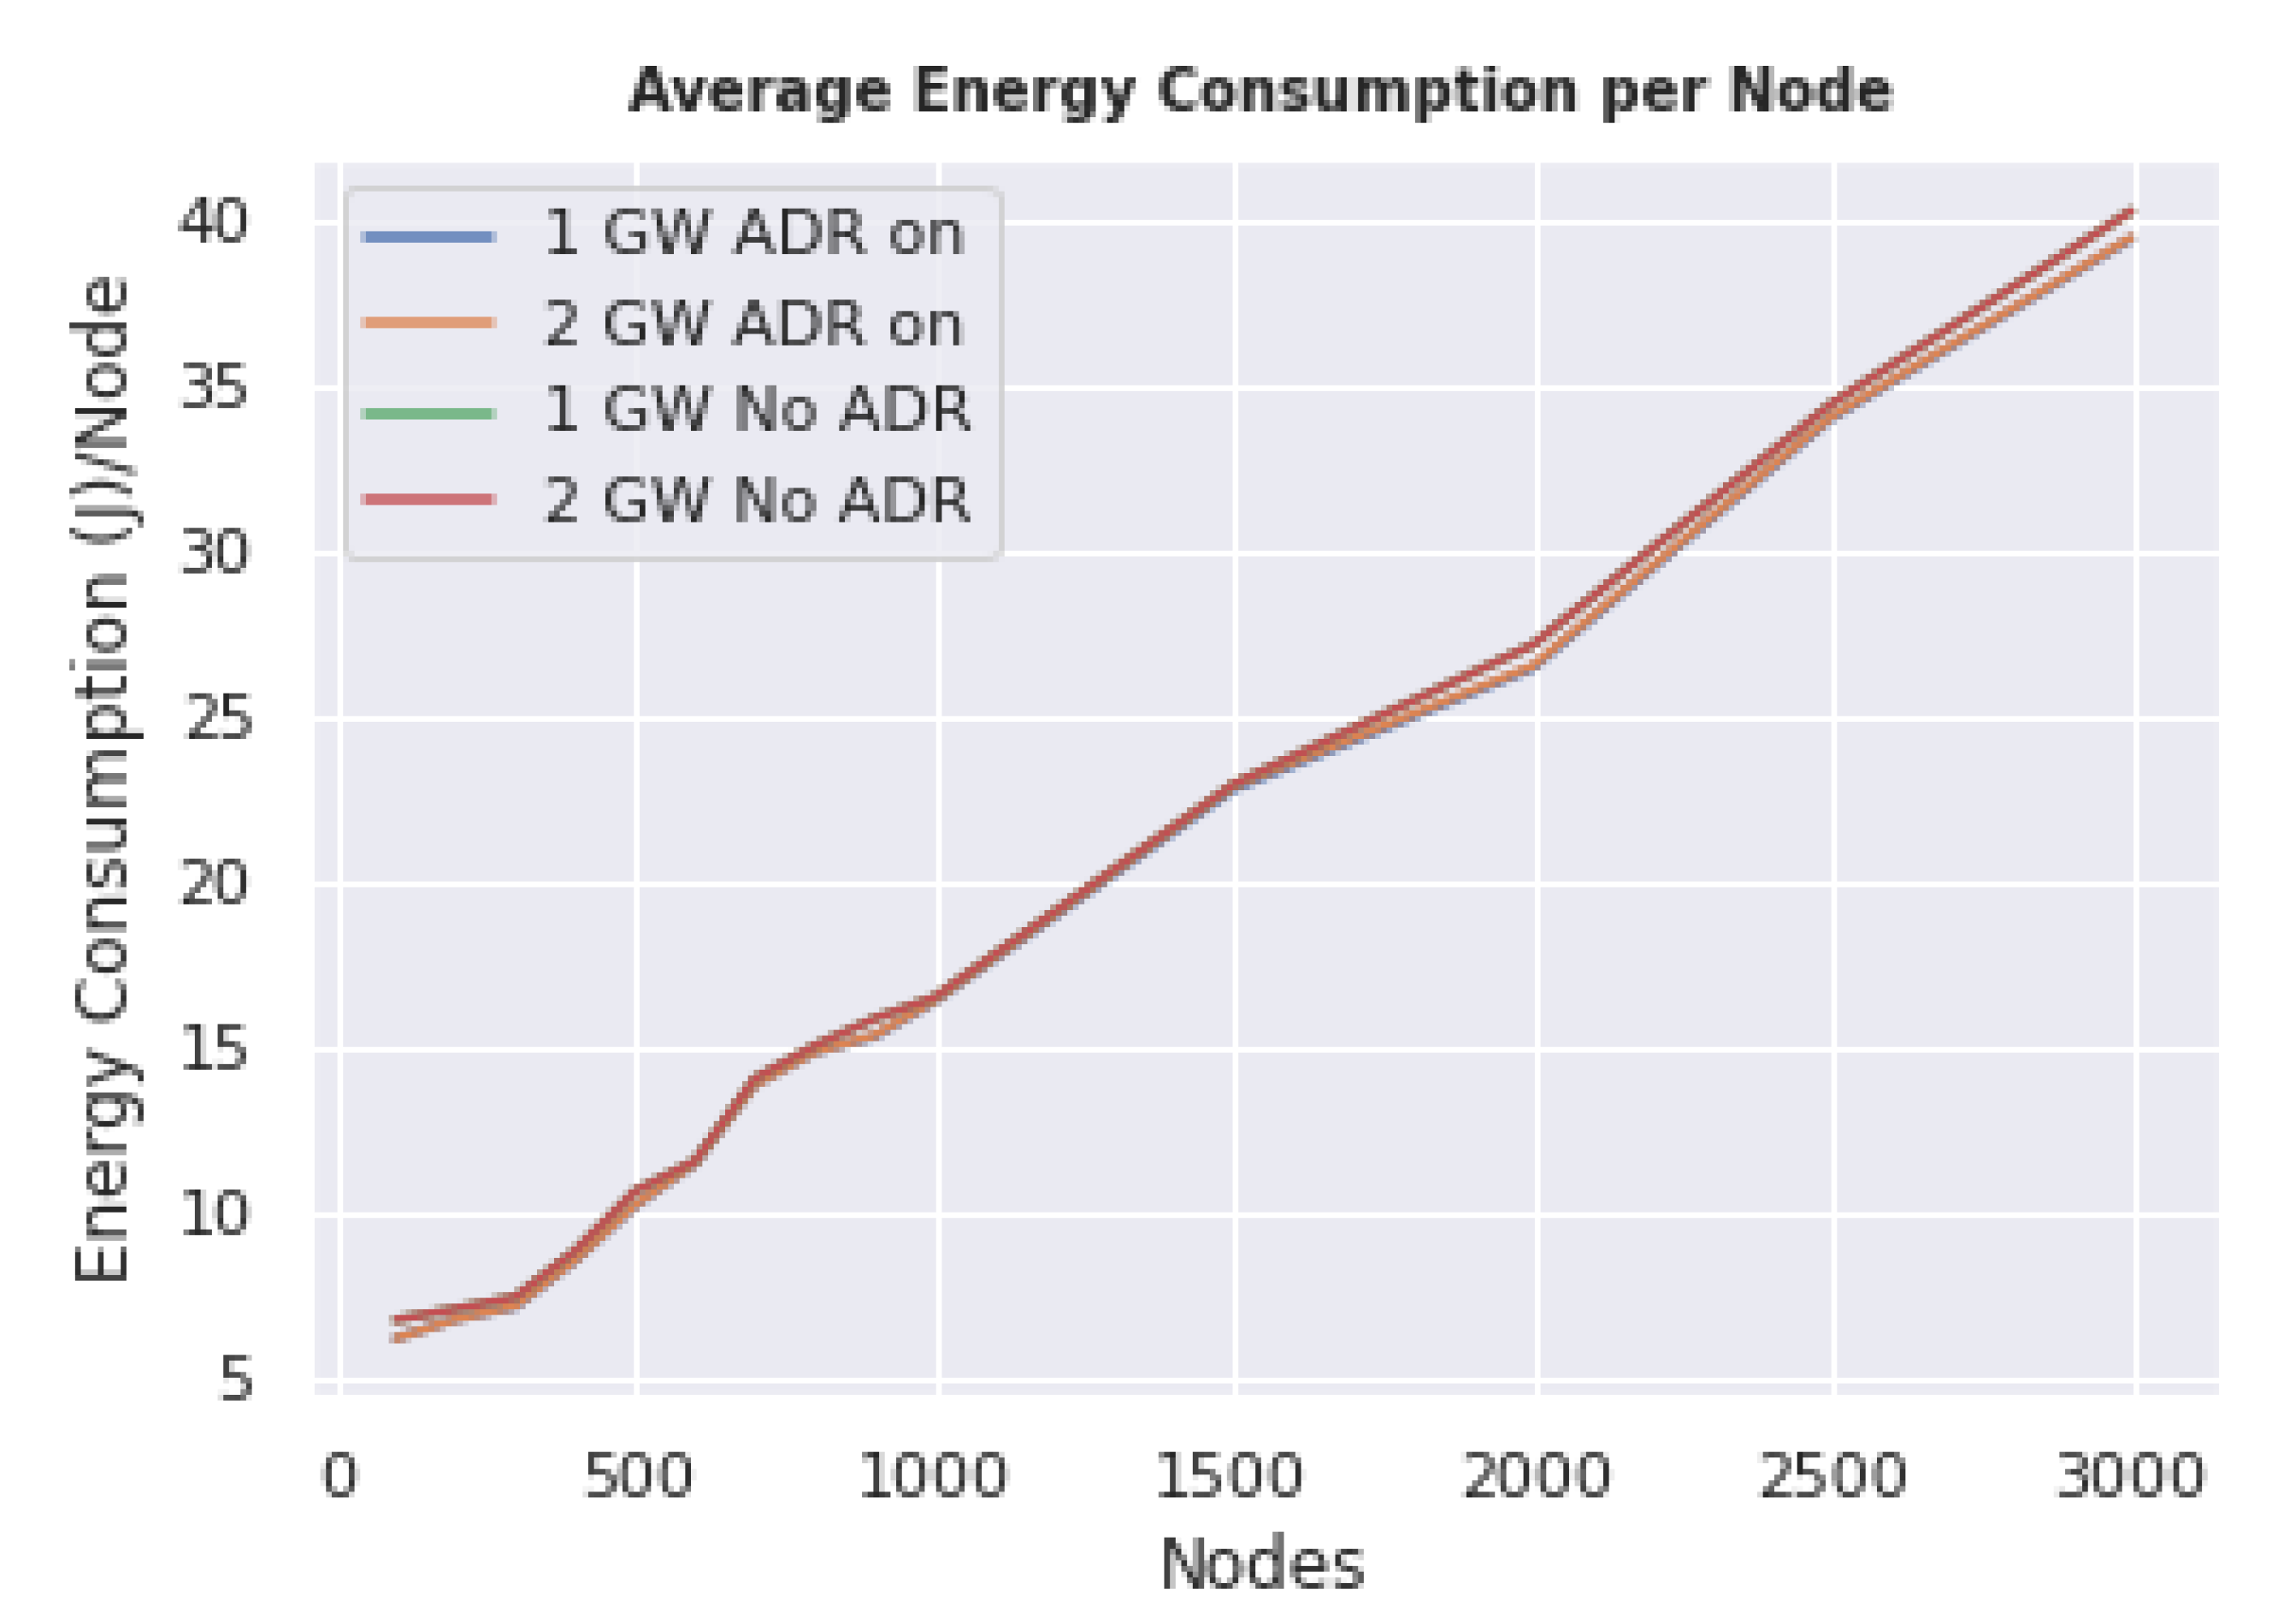
ADR technology seeks to increase energy consumption performance by improving communications. While it is true that the communication performance improves when it is activated, the simulation results show that the variation in energy consumption was minimal. In Figure 13, it can be clearly seen that using two gateways or ADR technology had a minimal impact on energy consumption per node. What can be observed instead, is that the average energy consumption per node increased linearly with the number of nodes in the network. This plainly means that with a larger number of nodes transmitting in the network the interference on each channel increases dramatically, causing each node to have to re-send packets and to listen to transmissions not directed at the particular node. This increases the time that the nodes are active, therefore increasing energy consumption.
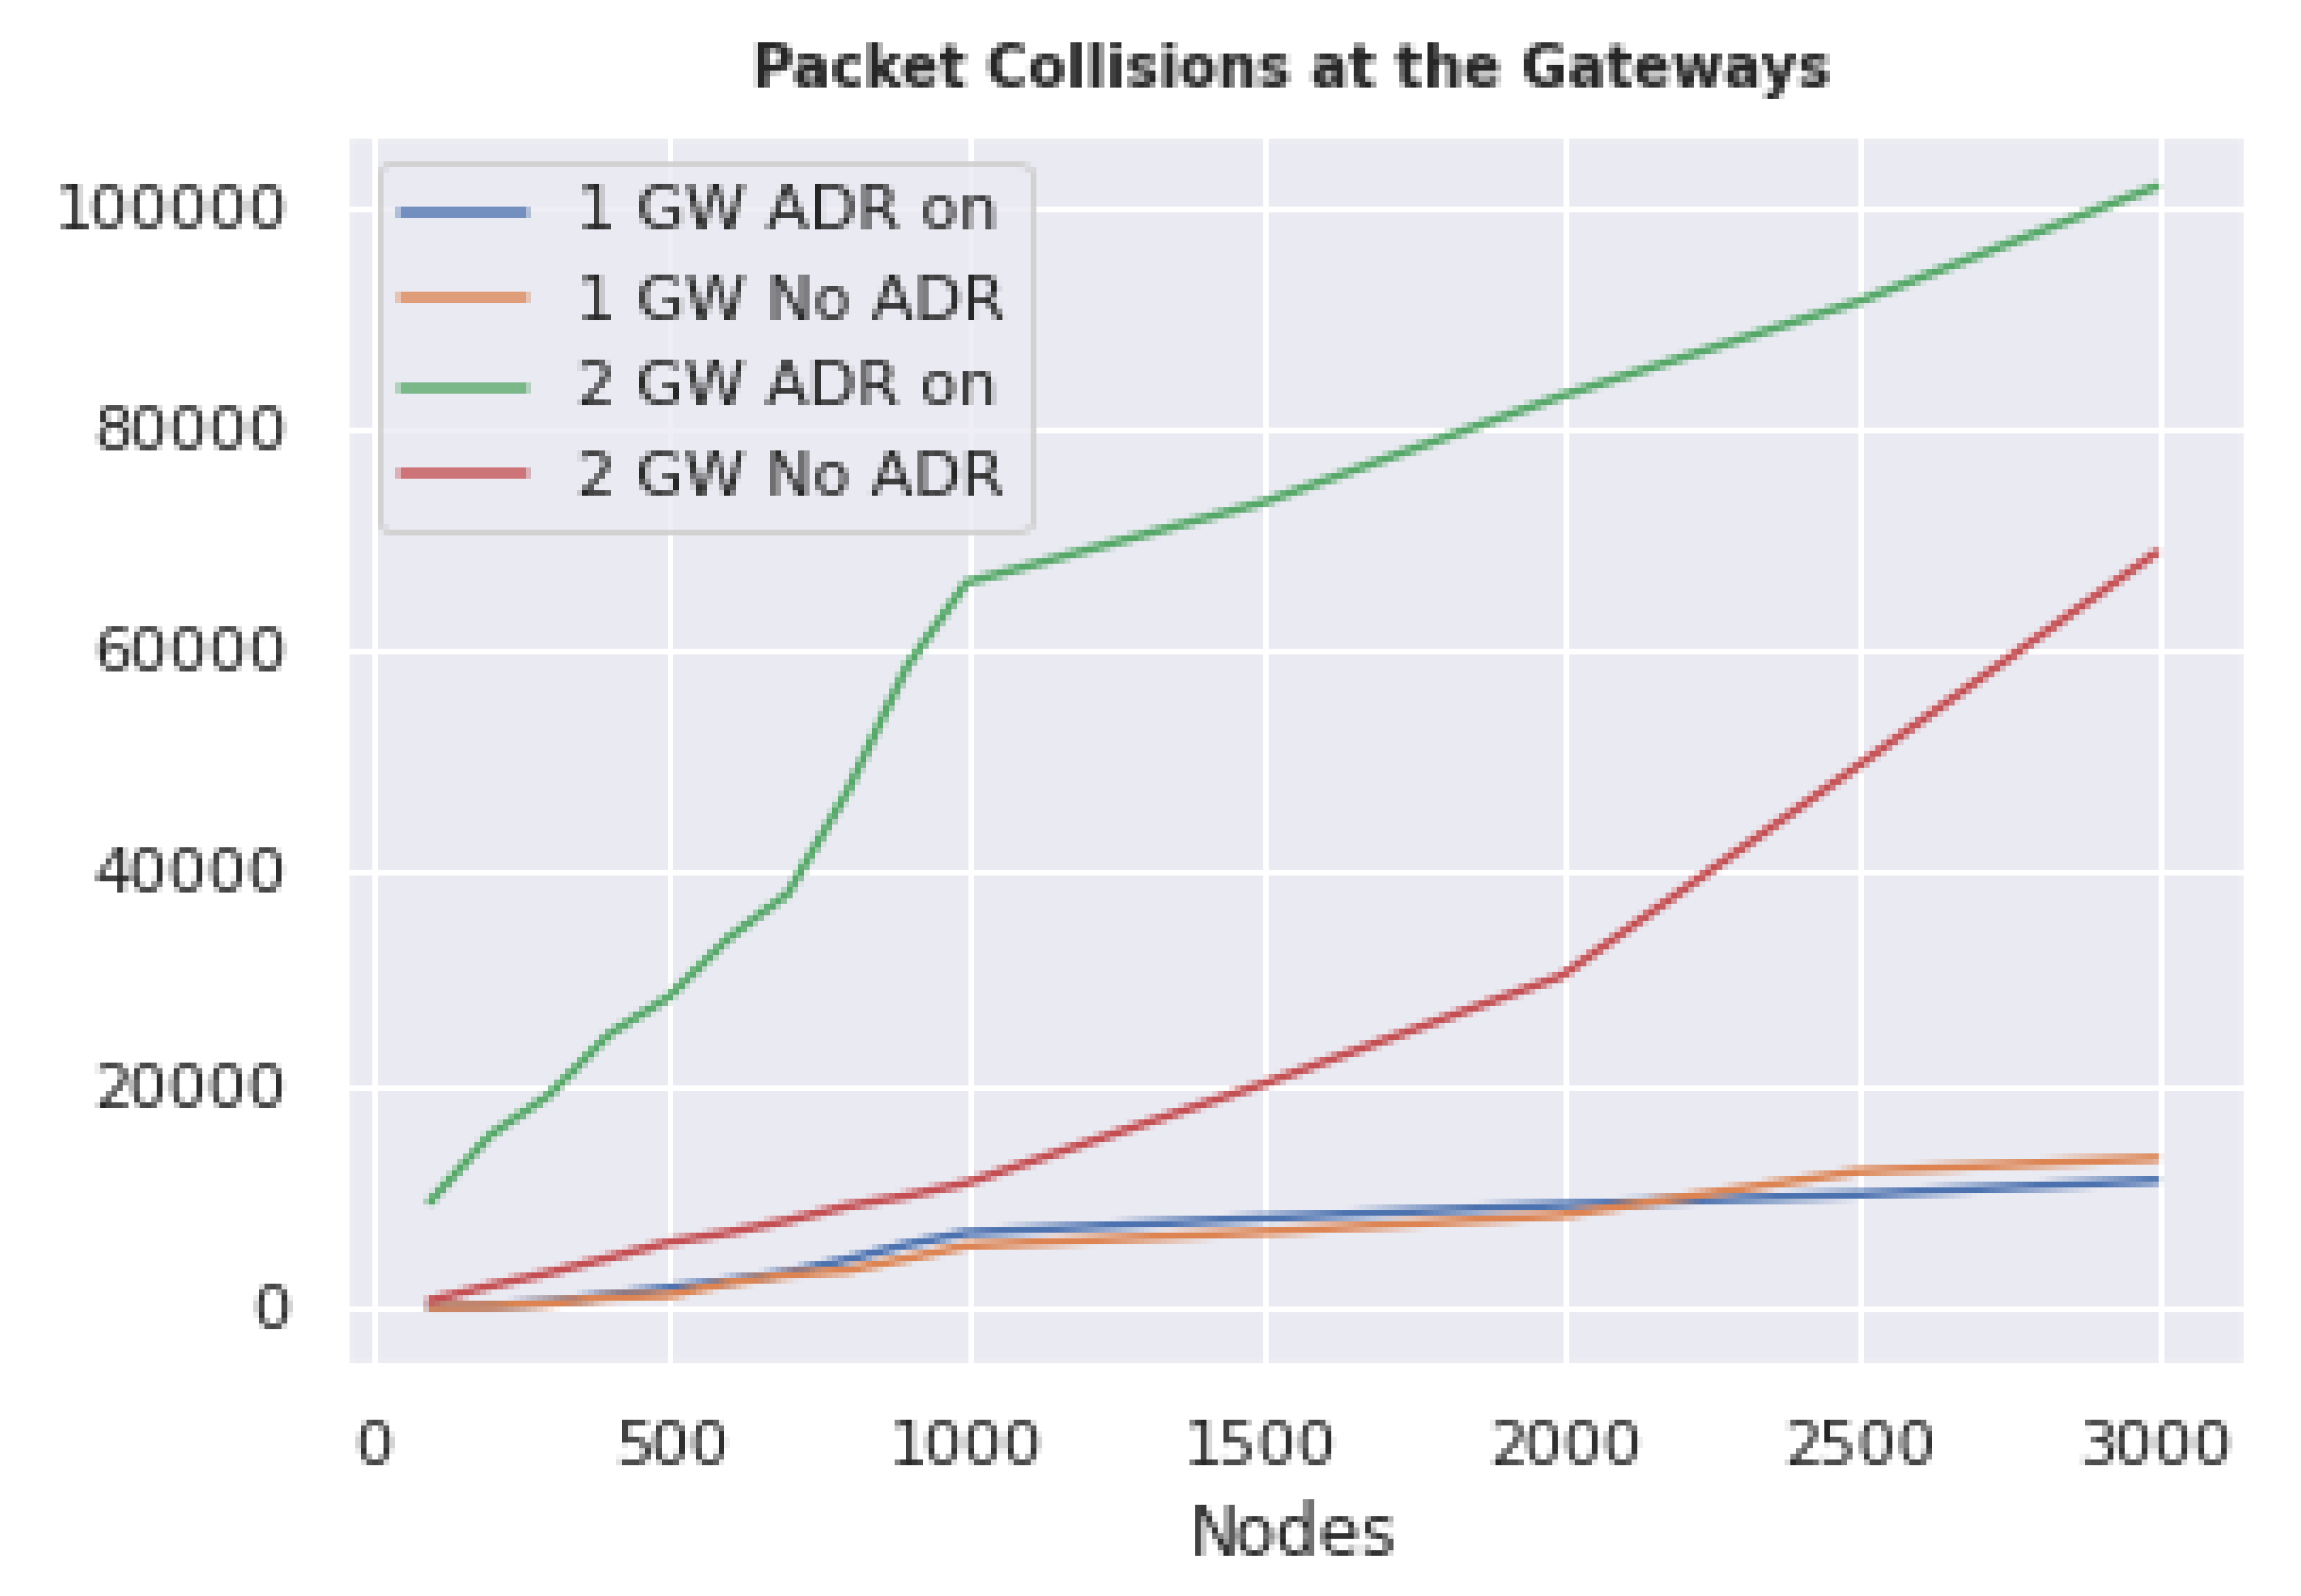
Having two gateways can in some ways be counterproductive. As shown in Figure 14, collisions remain low when only one gateway is present, regardless of whether ADR technology is active or not. When a new gateway is added, packet collisions at each gateway naturally increase as the packets sent by each node are duplicated. This situation worsens as the number of nodes increases. As communication is more effective and a greater number of packets arrive at gateways when ADR technology is active, collisions within each gateway become much higher and increase linearly as the number of nodes present in the network increases. Although the server in Figure 12 received packets successfully, having high numbers of collisions within the network affects the scalability of the gateways. This situation could be improved if there were some mechanism by which each node in the network knows which gateway to transmit packets to the server through, thereby making the other gateways ignore those packets.
It is necessary to emphasize that for all the results collected in these simulations we considered the use of a single channel in the LoRa communication band as the FLoRa tool does not have a feature or option to divide communications among the available channels. Thus, if we take into account that the channel plan for Ecuador contains 64 channels for node–gateway communication, network scalability could be increased considerably, being able to count 100 nodes per channel and, thus, reducing energy consumption while having high-quality communications.

3.3. Validation of the Proposed Simulation Environment

To validate the realism of the simulation results, we conducted a review of other studies on the capabilities of LoRaWAN protocols obtained both analytically and through simulation. Although the objectives of the presented articles were not the same as those of this study, the results serve to reinforce the reliability of the simulated results that have been collected.
The effect that ADR technology has on the packet delivery ratio has also been studied in [74]. This study analyzed how the Packet Delivery Ratio (PDR) decays with respect to an increase in distance, over a range between 50 and 300 m, with 1000 nodes deployed. In our study, the packet delivery rate had low values because the nodes were distributed within a wider space of 5000 m; but it was validated by the results of the aforementioned study, where the PDR was lower than 70% with 2000 nodes deployed and ADR activated.
The impact of packet collisions was analyzed in [75], where a technology called Adaptive Data Payload (or ADP) was proposed as an alternative to ADR, for which they conducted a comparison within a simulation environment using algorithms developed in the same study. The percentage of packet collisions on uplink packets at the gateway remained low when ADR technology was active, resembling the results obtained in our simulation.
In the article [76], a comparison of delivery ratio results was conducted, both analytically and through simulation, with respect to the distance and node number. There, the maximum distance presented was 3000 m, for which a delivery ratio of around 65% was achieved both theoretically and through simulation with 3000 nodes deployed.
The consumption of energy has also been reviewed, with respect to several scenarios, in [77]. Consumption was shown to grow linearly with respect to the number of nodes deployed—a trend very similar to that observed in the present study. Additionally, the PDR was also analyzed, indicating that it remains consistent as the number of nodes increases. The simulator used in the aforementioned document was LoRaSim, and a study of the scalability of LoRa/LoRaWAN networks was also conducted.
The cited studies provide evidence that the simulation environment proposed for the coastal region comes close to reality regarding the behaviour of LoRa networks; therefore, the validity of our results can be concluded. However, deployment under actual conditions and with appropriate instrumentation is always the most reliable way to characterize the parameters and ranges of a network in an agricultural setting.

4. Conclusions

In this work, we evaluated the performance of communication systems used for Internet of Things applications in the agricultural sector. LPWAN technology was chosen as the communication system paradigm for simulation as it allows for the deployment of wide-area networks with low power specifically for IoT. Within LPWAN, LoRaWAN was chosen as it met the requirements of the project in terms of scalability, energy consumption, frequency, data speed, and cost, among other aspects. The OMNET++ simulator was used, making use of the FLoRa library, which allowed for the modeling of the behavior of LoRaWAN networks. After analyzing other simulators, this was found to be the one that best suited the conditions of the evaluation scenario. For our evaluation, we proposed two propagation scenarios: ideal conditions and moderate losses. The number of nodes varied from 100 to 3000, and the scenarios were analyzed with respect to one or two gateways.
Based on the results of the simulations performed for evaluation of the LoRaWAN network in the proposed scenarios, we reached the following conclusions:
  • The results show that in an ideal wireless medium and with a single gateway, 100 nodes, and without ADR (No ADR), the packet delivery was 85%. With the activation of ADR (ON), this number increased to 93%. In the case of 3000 nodes, delivery with No ADR was 51% and that with ADR ON was 84%. Thus, with ADR, a better delivery of packets can be achieved.
  • For a medium wireless network with moderate losses and a single gateway, the results indicated that with 100 nodes and No ADR, delivery of packets was 58%, while that with ADR ON increased to 68%. For 3000 nodes, the delivery of packets with No ADR reached 47%, while with ADR ON, we obtained 62%. As was observed in both scenarios, as we increase the number of nodes, the packet delivery decreases, having a negative impact on transmission quality.
  • The results with two gateways indicated that with 100 nodes and No ADR, the delivery of packets was 58%; meanwhile, with the activation of ADR ON, this increased to 87%. In the case of 3000 nodes, the delivery of packets with No ADR reached 45%, while that with ADR ON was 80%. Thus, it was observed that the improvement in packet delivery was especially pronounced as the number of nodes increased.
  • The data obtained from the simulations indicated that energy consumption did not significantly change when ADR technology was turned on with two gateways in the network. However, the average node consumption increased linearly with the number of nodes. Additionally, it was found that with two gateways, the communication quality improves and the coverage radius is extended, albeit at a higher installation cost.
  • The number of collisions increased dramatically when the number of nodes in the network increased and there were two gateways present. This is due to the fact that all gateways receive packets transmitted by nodes using the broadcast mode then forward these packets to the network server, which is responsible for eliminating duplicates. This can be counterproductive if two gateways are present when there are few nodes in the network. Another situation that could improve this situation is if each node knows which of the gateways in the network it should communicate with—a mechanism that does not exist in the protocol, which should be studied further.
  • In Ecuador, the frequency band used offers 64 channels for communication uplink. Taking into account that the scenarios presented here were only simulated with the use of one channel, the results could be improved if a high number of nodes were spread among the available channels. LoRaWAN technology has high scalability and allows for a high density of nodes in a wide terrain area; these are highly desirable characteristics for applications in rural areas such as precision agriculture, which can contribute to improving the transmission of data acquired from climatic variables, visibility state of crops, efficiency in water usage, fertilizer levels, and agricultural product production capacity.
  • Farmland environments have few obstacles to data connectivity, with the SNR received by gateways directly correlating to the distance from the node, thus influencing the spreading factor and transmission power. This scenario does not apply in urban environments, where a node may be close to a gateway but have low SNR due to nearby obstructions such as buildings.
A comparison was made with the results of other studies, such as those considering the ADR, particularly in evaluating the effect that it has on the packet delivery ratio. The results of our study showed low values as the nodes in our scenario were distributed across 5 km. This demonstrates that as the distance between nodes increases, the packet delivery ratio decreases. Another case studied packet collisions, where the ADR was used; the results of the previous study were similar to those obtained in our analysis. Additionally, energy consumption has also been analyzed in other studies, showing that it grows linearly with respect to the number of deployed nodes; this trend was also observed in our case.

Further Studies

In future work, we expect to simulate the LoRaWAN network behavior with the presence of several channels, as well as testing frequency change mechanisms when unfavorable communication conditions are present—situations that the simulator used in this study cannot handle, despite being one of the most complete simulators available.
The simulation of downlink packets was beyond the scope of this study; this is a situation that must be considered to simulate communication with devices that, in addition to collecting data with several sensors, have actuators that allow for the regulation of water and fertilizer supply in agriculture.
The LoRaWAN protocol is characterized by having devices that send packets to all nodes simultaneously, which leads to an increase in packet collisions as the number of nodes increases, directly impacting the protocol’s scalability. Therefore, future studies should focus on implementing mechanisms that reduce this weakness while preserving low energy consumption and high communication quality levels.
Finally, a real-life scalability study in a rural setting would be of utmost importance as it could reveal characteristics that simulators do not allow for or do not model adequately. A deployment with fewer than 50 nodes could be carried out at a reasonable cost, while a study involving 5000 to 10,000 nodes would require significant financial investment—not counting the deployment land rights and instrumentation needed to carry out measurements.

Author Contributions

Conceptualization, G.Y., M.H. and R.C.; data curation, G.Y., M.H. and M.S.; formal analysis, G.Y., M.H. and R.C.; funding acquisition, M.H.; investigation, G.Y. and M.H.; methodology, G.Y. and M.H.; project administration, M.H.; software, M.S.; supervision, M.H.; validation, G.Y., M.H., M.S. and R.C.; visualization, M.H. and R.C.; writing—original draft, G.Y., M.H. and M.S.; writing—review and editing, M.H. and R.C. All authors have read and agreed to the published version of the manuscript.

Funding

This research was funded by projects CYTED 788 [REDTPI4.0-320RT0006], CYTED [EFIMOVI-720RT0014], PLAGRI project by Telecommunications and Telematics Research Group (GITEL) from Universidad Politécnica Salesiana, Cuenca, Ecuador.

Conflicts of Interest

The authors declare no conflict of interest.

References

  1. Organización de las Naciones Unidas para Alimentación y la Agricultura. El Futuro de la Alimentación y la Agricultura; Tendencias y desafíos; Food and Agriculture Organization: Rome, Italy, 2017. [Google Scholar]
  2. Feng, X.; Yan, F.; Liu, X. Study of wireless communication technologies on Internet of Things for precision agriculture. Wirel. Pers. Commun. 2019, 108, 1785–1802. [Google Scholar] [CrossRef]
  3. Giri, A.; Dutta, S.; Neogy, S. Enabling agricultural automation to optimize utilization of water, fertilizer and insecticides by implementing Internet of Things (IoT). In Proceedings of the 2016 International Conference on Information Technology (InCITe)-The Next Generation IT Summit on the Theme-Internet of Things: Connect your Worlds, Noida, India, 6–7 October 2016; pp. 125–131. [Google Scholar]
  4. Benke, K.; Tomkins, B. Future food-production systems: Vertical farming and controlled-environment agriculture. Sustain. Sci. Pract. Policy 2017, 13, 13–26. [Google Scholar] [CrossRef] [Green Version]
  5. Lavanya, R.; Chakkaravarthy, G.V.; Alli, P. An Integrated GIS and Knowledge-Based Automated Decision Support System for Precision Agriculture Using IoT. In IoT and WSN Applications for Modern Agricultural Advancements: Emerging Research and Opportunities; IGI Global: Hershey, PA, USA, 2020; pp. 86–98. [Google Scholar]
  6. Erazo, M.; Rivas, D.; Pérez, M.; Galarza, O.; Bautista, V.; Huerta, M.; Rojo, J.L. Design and implementation of a wireless sensor network for rose greenhouses monitoring. In Proceedings of the 2015 6th International Conference on Automation, Robotics and Applications (ICARA), Queenstown, New Zealand, 17–19 February 2015; pp. 256–261. [Google Scholar]
  7. Guillermo, J.C.; García-Cedeño, A.; Rivas-Lalaleo, D.; Huerta, M.; Clotet, R. Iot architecture based on wireless sensor network applied to agricultural monitoring: A case of study of cacao crops in ecuador. In Advances in Intelligent Systems and Computing, Proceedings of the 2nd International Conference of ICT for Adapting Agriculture to Climate Change (AACC’18), Cali, Colombia, 21–23 November 2018; Springer: Cham, Switzerland, 2018; pp. 42–57. [Google Scholar]
  8. Tzounis, A.; Katsoulas, N.; Bartzanas, T.; Kittas, C. Internet of Things in agriculture, recent advances and future challenges. Biosyst. Eng. 2017, 164, 31–48. [Google Scholar] [CrossRef]
  9. Bell, J.M.; Schwartz, R.C.; McInnes, K.J.; Howell, T.A.; Morgan, C.L. Effects of irrigation level and timing on profile soil water use by grain sorghum. Agric. Water Manag. 2020, 232, 106030. [Google Scholar] [CrossRef]
  10. Kirby, R.M.; Bartram, J.; Carr, R. Water in food production and processing: Quantity and quality concerns. Food Control 2003, 14, 283–299. [Google Scholar] [CrossRef]
  11. Wallace, J. Increasing agricultural water use efficiency to meet future food production. Agric. Ecosyst. Environ. 2000, 82, 105–119. [Google Scholar] [CrossRef]
  12. Pérez, D.; Risc, R. Implementación de Lora y Lorawan como escenario futuro de la industrias 4.0 en el sector agroindustrial peruano. Rev. Campus 2020, 25. Available online: https://www.aulavirtualusmp.pe/ojs/index.php/rc/article/view/1829 (accessed on 25 May 2022).
  13. Muangprathub, J.; Boonnam, N.; Kajornkasirat, S.; Lekbangpong, N.; Wanichsombat, A.; Nillaor, P. IoT and agriculture data analysis for smart farm. Comput. Electron. Agric. 2019, 156, 467–474. [Google Scholar] [CrossRef]
  14. Sreekantha, D.; Kavya, A. Agricultural crop monitoring using IOT-a study. In Proceedings of the 2017 11th International Conference on Intelligent Systems and Control (ISCO), Coimbatore, India, 5–6 January 2017; pp. 134–139. [Google Scholar]
  15. Sarker, V.K.; Queralta, J.P.; Gia, T.N.; Tenhunen, H.; Westerlund, T. A survey on LoRa for IoT: Integrating edge computing. In Proceedings of the 2019 Fourth International Conference on Fog and Mobile Edge Computing (FMEC), Rome, Italy, 10–13 June 2019; pp. 295–300. [Google Scholar]
  16. Liu, Y.; Ma, X.; Shu, L.; Hancke, G.P.; Abu-Mahfouz, A.M. From Industry 4.0 to Agriculture 4.0: Current Status, Enabling Technologies, and Research Challenges. IEEE Trans. Ind. Informatics 2020, 17, 4322–4334. [Google Scholar] [CrossRef]
  17. Samie, F.; Tsoutsouras, V.; Bauer, L.; Xydis, S.; Soudris, D.; Henkel, J. Computation offloading and resource allocation for low-power IoT edge devices. In Proceedings of the 2016 IEEE 3rd World Forum on Internet of Things (WF-IoT), Reston, VA, USA, 12–14 December 2016; pp. 7–12. [Google Scholar]
  18. Huerta, M.; Garcia, A.; Guillermo, J.C.; Martinez, R.C. Wireless Sensor Networks Applied to Precision Agriculture: A worldwide literature review with emphasis on Latin America. IEEE Geosci. Remote Sens. Mag. 2021, 9, 209–222. [Google Scholar] [CrossRef]
  19. Erazo-Rodas, M.; Sandoval-Moreno, M.; Muñoz-Romero, S.; Huerta, M.; Rivas-Lalaleo, D.; Naranjo, C.; Rojo-Álvarez, J.L. Multiparametric monitoring in equatorian tomato greenhouses (I): Wireless sensor network benchmarking. Sensors 2018, 18, 2555. [Google Scholar] [CrossRef] [PubMed] [Green Version]
  20. Chi, T.; Chen, M. A frequency hopping method for spatial RFID/WiFi/Bluetooth scheduling in agricultural IoT. Wirel. Netw. 2019, 25, 805–817. [Google Scholar] [CrossRef]
  21. Stombaugh, T. Satellite-based Positioning Systems for Precision Agriculture. In Precision Agriculture Basics; Wiley Online Library: Hoboken, NJ, USA, 2018; pp. 25–35. [Google Scholar]
  22. Rani, M.U.; Suganya, C.; Kamalesh, S.; Sumithra, A. An integration of wireless sensor network through Wi-max for agriculture monitoring. In Proceedings of the 2014 International Conference on Computer Communication and Informatics, Coimbatore, India, 3–5 January 2014; pp. 1–5. [Google Scholar]
  23. Beritelli, F.; Capizzi, G.; Sciuto, G.L.; Napoli, C.; Scaglione, F. Rainfall estimation based on the intensity of the received signal in a LTE/4G mobile terminal by using a probabilistic neural network. IEEE Access 2018, 6, 30865–30873. [Google Scholar] [CrossRef]
  24. Ji, H.; Park, S.; Yeo, J.; Kim, Y.; Lee, J.; Shim, B. Ultra-Reliable and Low-Latency Communications in 5G Downlink: Physical Layer Aspects. IEEE Wirel. Commun. 2018, 25, 124–130. [Google Scholar] [CrossRef] [Green Version]
  25. Dai, L.; Fang, Y.; Yang, Z.; Chen, P.; Li, Y. Protograph LDPC-Coded BICM-ID With Irregular CSK Mapping in Visible Light Communication Systems. IEEE Trans. Veh. Technol. 2021, 70, 11033–11038. [Google Scholar] [CrossRef]
  26. Shao, S.; Hailes, P.; Wang, T.; Wu, J.; Maunder, R.; Bashir, M.; Hanzo, L. Survey of Turbo, LDPC, and Polar Decoder ASIC Implementations. IEEE Commun. Surv. Tutor. 2019, 21, 2309–2333. [Google Scholar] [CrossRef] [Green Version]
  27. Fang, Y.; Bu, Y.; Chen, P.; Lau, F.C.M.; Otaibi, S.A. Irregular-Mapped Protograph LDPC-Coded Modulation: A Bandwidth-Efficient Solution for 6G-Enabled Mobile Networks. IEEE Trans. Intell. Transp. Syst. 2021. [Google Scholar] [CrossRef]
  28. Mekki, K.; Bajic, E.; Chaxel, F.; Meyer, F. Overview of cellular LPWAN technologies for IoT deployment: Sigfox, LoRaWAN, and NB-IoT. In Proceedings of the 2018 Ieee International Conference on Pervasive Computing and Communications Workshops (Percom Workshops), Athens, Greece, 19–23 March 2018; pp. 197–202. [Google Scholar]
  29. Liya, M.L.; Arjun, D. A Survey of LPWAN Technology in Agricultural Field. In Proceedings of the 2020 Fourth International Conference on I-SMAC (IoT in Social, Mobile, Analytics and Cloud) (I-SMAC), Palladam, India, 7–9 October 2020; pp. 313–317. [Google Scholar] [CrossRef]
  30. Mermer, G.B.; Zeydan, E. A comparison of LP-WAN technologies: An overview from a mobile operators’ perspective. In Proceedings of the 2017 25th Signal Processing and Communications Applications Conference (SIU), Antalya, Turkey, 15–18 May 2017; pp. 1–4. [Google Scholar]
  31. Vejlgaard, B.; Lauridsen, M.; Nguyen, H.; Kovács, I.Z.; Mogensen, P.; Sorensen, M. Coverage and capacity analysis of sigfox, lora, gprs, and nb-iot. In Proceedings of the 2017 IEEE 85th Vehicular Technology Conference (VTC Spring), Sydney, NSW, Australia, 4–7 June 2017; pp. 1–5. [Google Scholar]
  32. García-Cedeño, A.; Guillermo, J.C.; Barzallo, B.; Punín, C.; Soto, A.; Rivas, D.; Clotet, R.; Huerta, M. PLATANO: Intelligent technological support platform for azuay province farmers in Ecuador. In Proceedings of the 2019 IEEE International Conference on Engineering Veracruz (ICEV), Boca del Rio, Mexico, 14–17 October 2019; Volume 1, pp. 1–7. [Google Scholar]
  33. Pérez Hernández, R. Desarrollo de prototipo de sensor IoT usando la red SigFox. In Trabajo Fin de Grado en Ingeniería de las Tecnologías de Telecomunicación (pp. 171); Universidad de Sevilla, Departamento de Ingeniería Telemática: Seville, Spain, 2015. [Google Scholar]
  34. Gomez, C.; Veras, J.C.; Vidal, R.; Casals, L.; Paradells, J. A Sigfox energy consumption model. Sensors 2019, 19, 681. [Google Scholar] [CrossRef] [Green Version]
  35. Aernouts, M.; Berkvens, R.; Van Vlaenderen, K.; Weyn, M. Sigfox and LoRaWAN datasets for fingerprint localization in large urban and rural areas. Data 2018, 3, 13. [Google Scholar] [CrossRef] [Green Version]
  36. Fourtet, C.; Ponsard, B. An introduction to Sigfox radio system. In LPWAN Technologies for IoT and M2M Applications; Elsevier: Amsterdam, The Netherlands, 2020; pp. 103–118. [Google Scholar]
  37. Pérez García, R. Avaluació de LoRa/LoRaWAN per a Escenaris de Smart City. Bachelor’s Thesis, Universitat Politècnica de Catalunya, Barcelona, Spain, 2017. [Google Scholar]
  38. Ji, M.; Yoon, J.; Choo, J.; Jang, M.; Smith, A. LoRa-based Visual Monitoring Scheme for Agriculture IoT. In Proceedings of the 2019 IEEE Sensors Applications Symposium (SAS), Sophia Antipolis, France, 11–13 March 2019; pp. 1–6. [Google Scholar]
  39. Grunwald, A.; Schaarschmidt, M.; Westerkamp, C. LoRaWAN in a rural context: Use cases and opportunities for agricultural businesses. In Proceedings of the Mobile Communication-Technologies and Applications; 24. ITG-Symposium, Osnabrueck, Germany, 15–16 May 2019; pp. 1–6. [Google Scholar]
  40. Wang, Y.P.E.; Lin, X.; Adhikary, A.; Grovlen, A.; Sui, Y.; Blankenship, Y.; Bergman, J.; Razaghi, H.S. A primer on 3GPP narrowband Internet of Things. IEEE Commun. Mag. 2017, 55, 117–123. [Google Scholar] [CrossRef]
  41. Ayoub, W.; Samhat, A.E.; Nouvel, F.; Mroue, M.; Prévotet, J.C. Internet of mobile things: Overview of lorawan, dash7, and nb-iot in lpwans standards and supported mobility. IEEE Commun. Surv. Tutor. 2018, 21, 1561–1581. [Google Scholar] [CrossRef] [Green Version]
  42. Chaudhari, B.; Borkar, S. Design considerations and network architectures for low-power wide-area networks. In LPWAN Technologies for IoT and M2M Applications; Elsevier: Amsterdam, The Netherlands, 2020; pp. 15–35. [Google Scholar]
  43. Rubio-Aparicio, J.; Cerdan-Cartagena, F.; Suardiaz-Muro, J.; Ybarra-Moreno, J. Design and implementation of a mixed IoT LPWAN network architecture. Sensors 2019, 19, 675. [Google Scholar] [CrossRef] [Green Version]
  44. Devalal, S.; Karthikeyan, A. LoRa technology-an overview. In Proceedings of the 2018 Second International Conference on Electronics, Communication and Aerospace Technology (ICECA), Coimbatore, India, 29–31 March 2018; pp. 284–290. [Google Scholar]
  45. Pallavi, S.; Mallapur, J.D.; Bendigeri, K.Y. Remote sensing and controlling of greenhouse agriculture parameters based on IoT. In Proceedings of the 2017 International Conference on Big Data, IoT and Data Science (BID), Pune, India, 20–22 December 2017; pp. 44–48. [Google Scholar]
  46. Kodali, R.K.; Yerroju, S.; Sahu, S. Smart farm monitoring using LoRa enabled IoT. In Proceedings of the 2018 Second International Conference on Green Computing and Internet of Things (ICGCIoT), Bangalore, India, 16–18 August 2018; pp. 391–394. [Google Scholar]
  47. Sari, E.K.; Wirara, A.; Harwahyu, R.; Sari, R.F. Lora characteristics analysis for IoT application using NS3 simulator. In Proceedings of the 2019 IEEE R10 Humanitarian Technology Conference (R10-HTC)(47129), Depok, West Java, Indonesia, 12–14 November 2019; pp. 205–210. [Google Scholar]
  48. Chen, M.; Miao, Y.; Jian, X.; Wang, X.; Humar, I. Cognitive-LPWAN: Towards intelligent wireless services in hybrid low power wide area networks. IEEE Trans. Green Commun. Netw. 2018, 3, 409–417. [Google Scholar] [CrossRef] [Green Version]
  49. Sanchez-Gomez, J.; Gallego-Madrid, J.; Sanchez-Iborra, R.; Santa, J.; Skarmeta, A.F. Impact of schc compression and fragmentation in lpwan: A case study with lorawan. Sensors 2020, 20, 280. [Google Scholar] [CrossRef] [PubMed] [Green Version]
  50. Hattarge, S.; Kekre, A.; Kothari, A. LoRaWAN based GPS tracking of city-buses for smart public transport system. In Proceedings of the 2018 First International Conference on Secure Cyber Computing and Communication (ICSCCC), Jalandhar, India, 15–17 December 2018; pp. 265–269. [Google Scholar]
  51. Lavric, A.; Petrariu, A.I.; Popa, V. Long range sigfox communication protocol scalability analysis under large-scale, high-density conditions. IEEE Access 2019, 7, 35816–35825. [Google Scholar] [CrossRef]
  52. Duangsuwan, S.; Takarn, A.; Nujankaew, R.; Jamjareegulgarn, P. A study of air pollution smart sensors lpwan via nb-iot for thailand smart cities 4.0. In Proceedings of the 2018 10th International Conference on Knowledge and Smart Technology (KST), Chiang Mai, Thailand, 31 January–3 February 2018; pp. 206–209. [Google Scholar]
  53. Casals, L.; Mir, B.; Vidal, R.; Gomez, C. Modeling the energy performance of LoRaWAN. Sensors 2017, 17, 2364. [Google Scholar] [CrossRef] [PubMed] [Green Version]
  54. Yousuf, A.M.; Rochester, E.M.; Ousat, B.; Ghaderi, M. Throughput, coverage and scalability of LoRa LPWAN for internet of things. In Proceedings of the 2018 IEEE/ACM 26th International Symposium on Quality of Service (IWQoS), Banff, AB, Canada, 4–6 June 2018; pp. 1–10. [Google Scholar]
  55. Hernández Caballero, S.; Estudio en Detalle de LoRaWAN. Comparación con otras Tecnologías LPWAN Considerando Diferentes Patrones de tráfico. 2020. Available online: http://hdl.handle.net/10609/106369 (accessed on 25 May 2022).
  56. Angelov, K.; Manchev, N.; Kogias, P.; Sadinov, S. Design and development of a platform for test applications in LoRa/LoRaWAN. Papers of International Conference in Telecommunications, Informatics, Energy and Management. 2019, p. 27. Available online: http://www.jestr.org/downloads/SpecialIssue2020/fulltext3SE.pdf (accessed on 25 May 2022).
  57. Zorbas, D. Design Considerations for Time-Slotted LoRa (WAN). 2020. Available online: https://cora.ucc.ie/handle/10468/9723 (accessed on 25 May 2022).
  58. Polonelli, T.; Brunelli, D.; Marzocchi, A.; Benini, L. Slotted aloha on lorawan-design, analysis, and deployment. Sensors 2019, 19, 838. [Google Scholar] [CrossRef] [Green Version]
  59. Moya Quimbita, M.A. Evaluación de Pasarela LoRa/LoRaWAN en Entornos Urbanos. 2018. Available online: http://hdl.handle.net/10251/109791 (accessed on 25 May 2022).
  60. Fraga-Lamas, P.; Celaya-Echarri, M.; Azpilicueta, L.; Lopez-Iturri, P.; Falcone, F.; Fernández-Caramés, T.M. Design and empirical validation of a lorawan IoT smart irrigation system. Multidiscip. Digit. Publ. Inst. Proc. 2020, 42, 62. [Google Scholar]
  61. Petrariu, A.I.; Lavric, A.; Coca, E. LoRaWAN Gateway: Design, Implementation and Testing in Real Environment. In Proceedings of the 2019 IEEE 25th International Symposium for Design and Technology in Electronic Packaging (SIITME), Cluj-Napoca, Romania, 23–26 October 2019; pp. 49–53. [Google Scholar]
  62. Rizzi, M.; Ferrari, P.; Flammini, A.; Sisinni, E. Evaluation of the IoT LoRaWAN solution for distributed measurement applications. IEEE Trans. Instrum. Meas. 2017, 66, 3340–3349. [Google Scholar] [CrossRef]
  63. Haxhibeqiri, J.; De Poorter, E.; Moerman, I.; Hoebeke, J. A survey of LoRaWAN for IoT: From technology to application. Sensors 2018, 18, 3995. [Google Scholar] [CrossRef] [Green Version]
  64. Marais, J.M.; Abu-Mahfouz, A.M.; Hancke, G.P. A review of LoRaWAN simulators: Design requirements and limitations. In Proceedings of the 2019 International Multidisciplinary Information Technology and Engineering Conference (IMITEC), Vanderbijlpark, South Africa, 21–22 November 2019; pp. 1–6. [Google Scholar]
  65. Capuzzo, M.; Magrin, D.; Zanella, A. Confirmed traffic in LoRaWAN: Pitfalls and countermeasures. In Proceedings of the 2018 17th Annual Mediterranean Ad Hoc Networking Workshop (Med-Hoc-Net), Capri, Italy, 20–22 June 2018; pp. 1–7. [Google Scholar]
  66. NS3. Available online: https://www.nsnam.org (accessed on 25 May 2022).
  67. Omnet++. Available online: https://omnetpp.org (accessed on 25 May 2022).
  68. Ruz Nieto, A. Simulación realista de Comunicaciones IoT en Entornos Urbanos. 2021. Available online: https://repositorio.upct.es/handle/10317/9646 (accessed on 25 May 2022).
  69. LoRaSim. Available online: https://www.lancaster.ac.uk/scc/sites/lora/lorasim.html (accessed on 25 May 2022).
  70. Davcev, D.; Mitreski, K.; Trajkovic, S.; Nikolovski, V.; Koteli, N. IoT agriculture system based on LoRaWAN. In Proceedings of the 2018 14th IEEE International Workshop on Factory Communication Systems (WFCS), Imperia, Italy, 13–15 June 2018; pp. 1–4. [Google Scholar]
  71. Girón, N.A.G.; LópezHurtado, M.A. Selección de tecnologías LPWAN para la implementación de un sistema IoT aplicado a la lombricultura. Memorias 2020. Available online: https://hemeroteca.unad.edu.co/index.php/memorias/article/view/4170 (accessed on 25 May 2022).
  72. Zambrano Aguayo, M.D.; Pérez Ruano, M.; Rodríguez Villafuerte, X. Brucelosis Bovina en la Provincia Manabí, Ecuador: Estudio de los Factores de Riesgo. Rev. Investig. Vet. Del Perú 2016, 27, 607–617. [Google Scholar] [CrossRef] [Green Version]
  73. Slabicki, M.; Premsankar, G.; Di Francesco, M. Adaptive configuration of LoRa networks for dense IoT deployments. In Proceedings of the NOMS 2018-2018 IEEE/IFIP Network Operations and Management Symposium, Taipei, Taiwan, 23–27 April 2018; pp. 1–9. [Google Scholar]
  74. Zhou, Q.; Xing, J.; Hou, L.; Xu, R.; Zheng, K. A novel rate and channel control scheme based on data extraction rate for LoRa networks. In Proceedings of the 2019 IEEE Wireless Communications and Networking Conference (WCNC), Marrakesh, Morocco, 15–18 April 2019; pp. 1–6. [Google Scholar]
  75. Sisinni, E.; Bellagente, P.; Depari, A.; Ferrari, P.; Flammini, A.; Marella, S.; Pasetti, M.; Rinaldi, S.; Cagiano, A. A new LoRaWAN adaptive strategy for smart metering applications. In Proceedings of the 2020 IEEE International Workshop on Metrology for Industry 4.0 & IoT, Roma, Italy, 3–5 June 2020; pp. 690–695. [Google Scholar]
  76. Gusev, O.; Turlikov, A.; Kuzmichev, S.; Stepanov, N. Data delivery efficient spreading factor allocation in dense LoRaWAN deployments. In Proceedings of the 2019 XVI International Symposium ”Problems of Redundancy in Information and Control Systems” (REDUNDANCY), Moscow, Russia, 21–25 October 2019; pp. 199–204. [Google Scholar]
  77. Bor, M.; Roedig, U.; Voigt, T.; Alonso, J. Do LoRa Low-Power Wide-Area Networks Scale? In Proceedings of the 19th ACM International Conference on Modeling, Analysis and Simulation of Wireless and Mobile Systems, Malta, 13–17 November 2016; pp. 59–67. [Google Scholar]
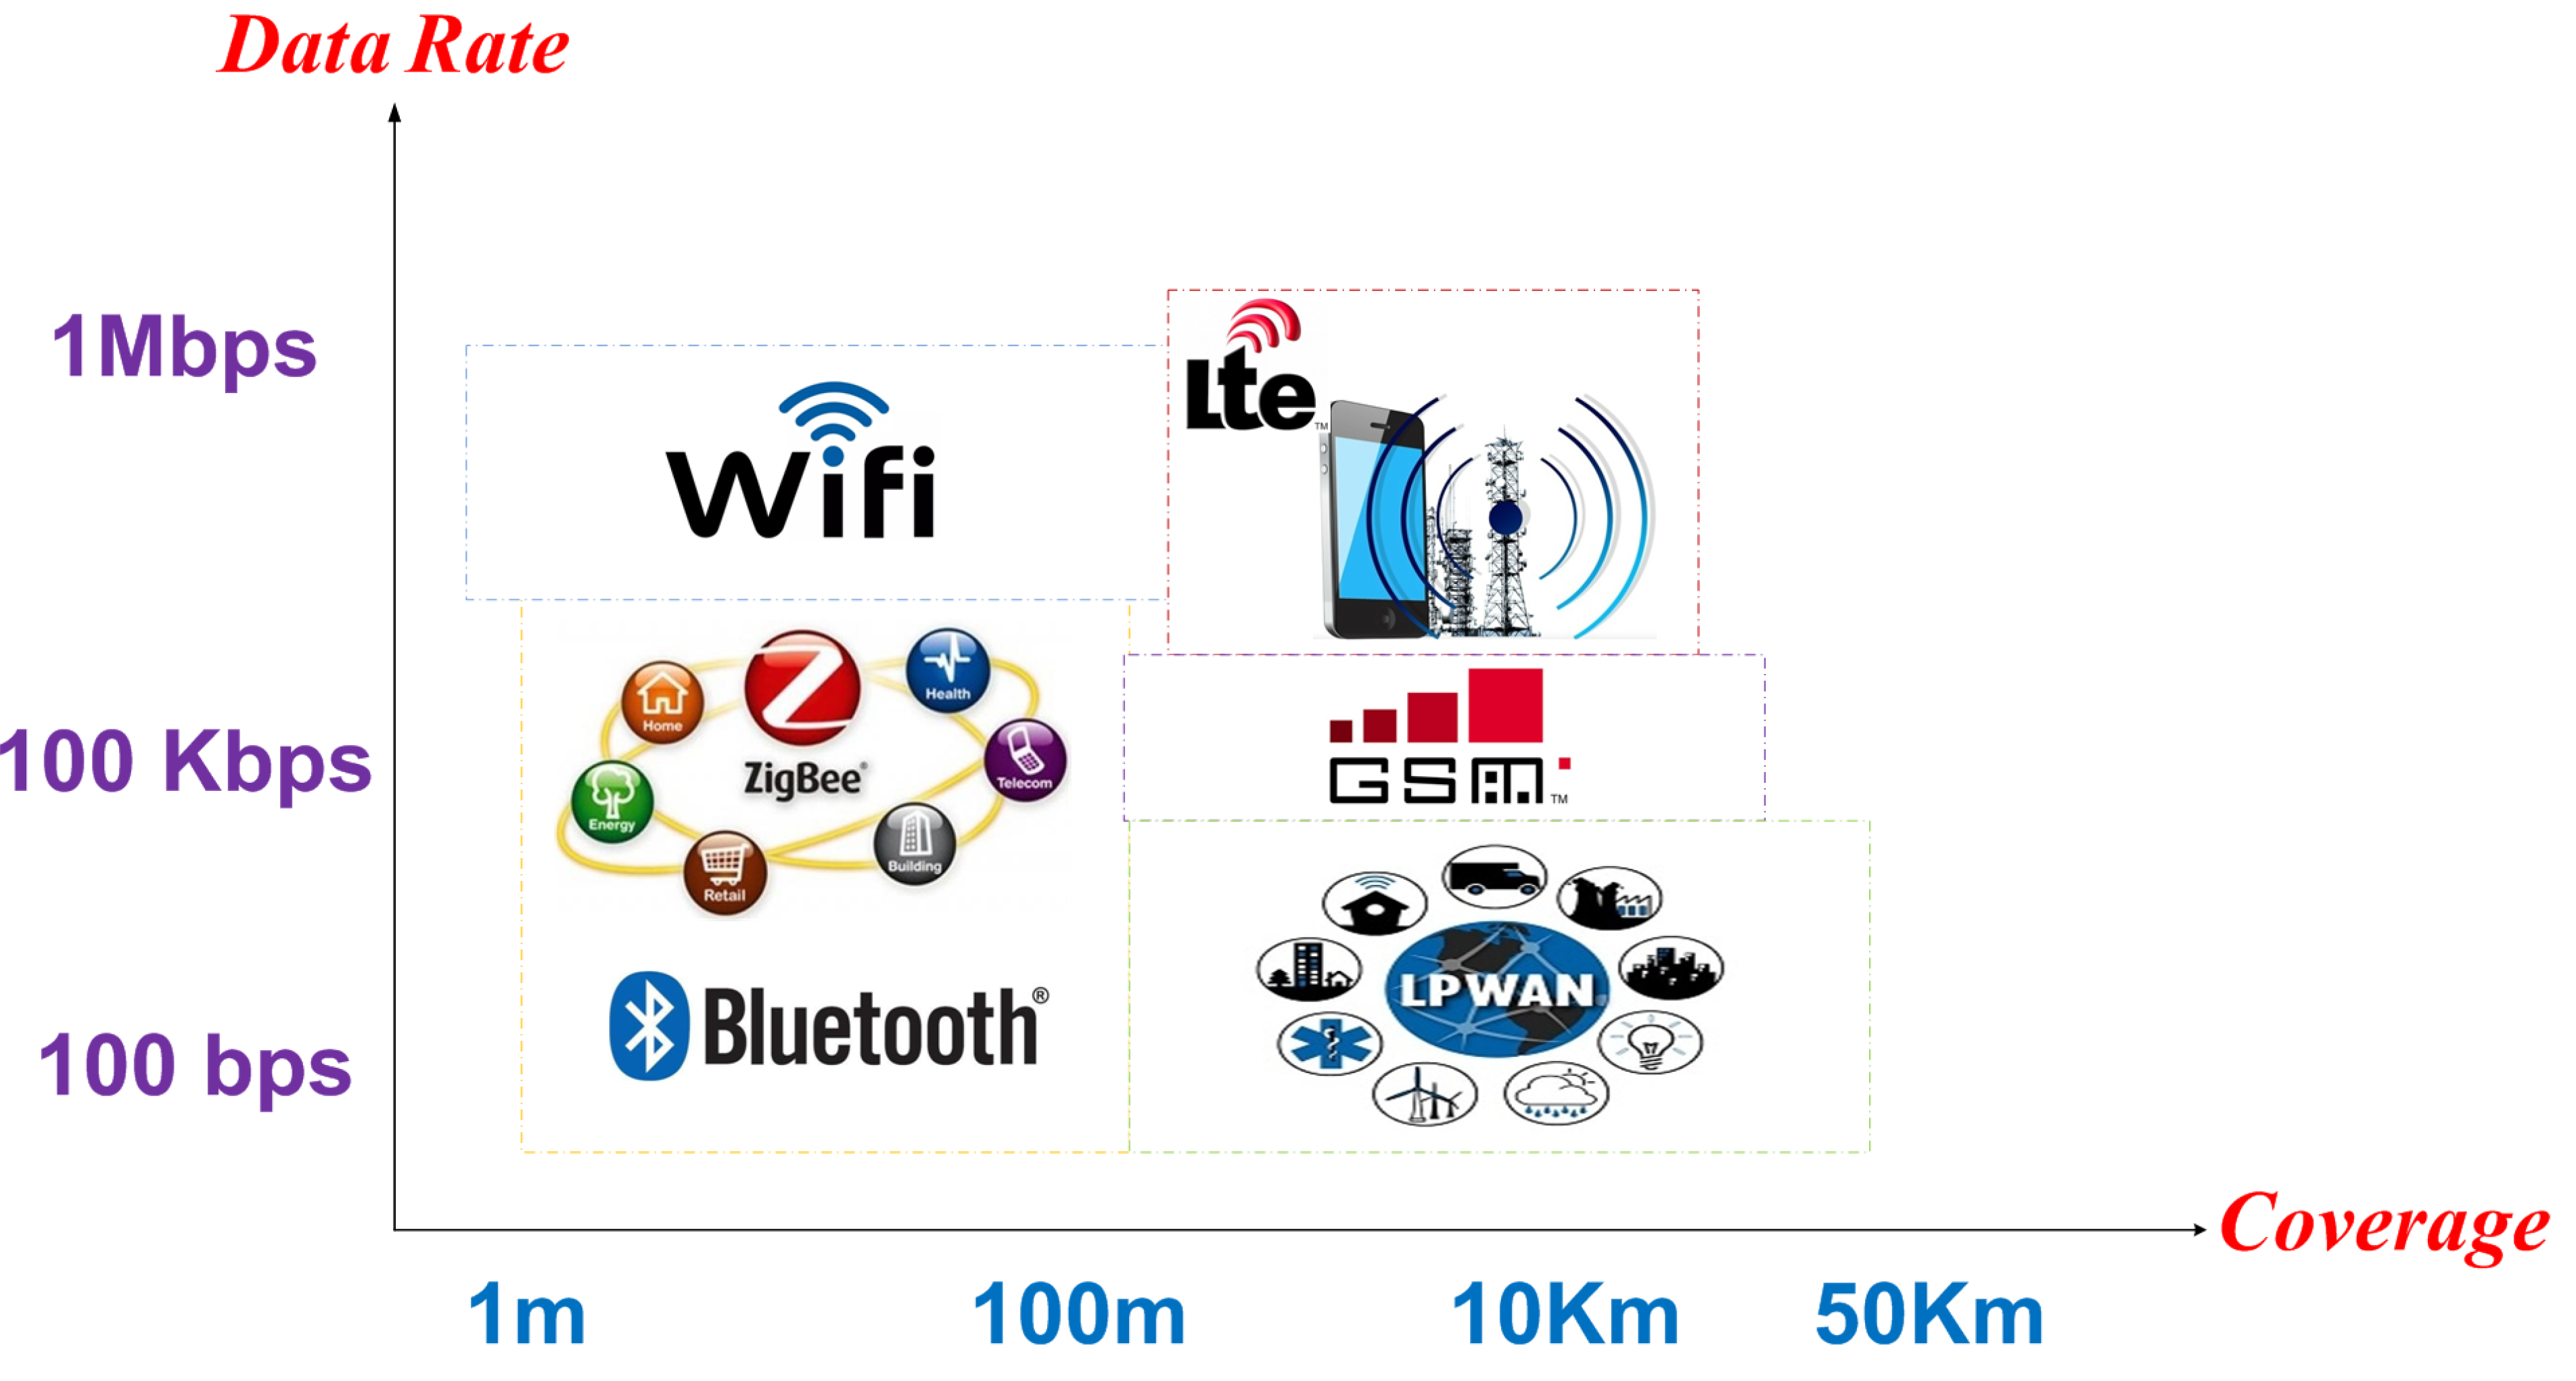
Figure 1. Relationship between coverage and data rate for various wireless communication technologies.
Agriculture 12 00786 g001
Figure 2. Long Range Wide Area Network (LoRaWAN) architecture.
Agriculture 12 00786 g002
Figure 3. Class A transmission.
Agriculture 12 00786 g003
Figure 4. Class B transmission.
Agriculture 12 00786 g004
Figure 5. Class C transmission.
Agriculture 12 00786 g005
Figure 6. LoRaWAN Security.
Agriculture 12 00786 g006
Figure 7. Evaluation scenario.
Agriculture 12 00786 g007
Figure 8. Configuration of the network architecture for LoRa in the FLoRa simulation environment.
Agriculture 12 00786 g008
Figure 9. FLoRa simulation environment with 100 nodes placed in the simulation area.
Agriculture 12 00786 g009
Figure 10. Packet delivery ratio to the network server with a single gateway under ideal propagation conditions.
Agriculture 12 00786 g010
Figure 11. Packet delivery ratio to the network server with a single gateway under propagation conditions simulating a rural environment.
Agriculture 12 00786 g011
Figure 12. Packet delivery ratio measured with one and two gateways, with and without Adaptive Data Rate (ADR).
Agriculture 12 00786 g012
Figure 13. Average energy consumption per node with one and two gateways deployed, with and without Adaptive Data Rate (ADR).
Agriculture 12 00786 g013
Figure 14. Packet collisions measured in all gateways of each simulation.
Agriculture 12 00786 g014
Table 1. Comparative chart of the three main Low-Power Wide-Area Networks (LPWANs) technologies.
Types of LPWAN TechnologyLoRaWANSIGFOXNB-IoT
Coverage2–5 km urban zone
10–20 km rural zone
3–10 km urban zone
20–40 km rural zone
1 km urban zone
10 km rural zone
StandardLoRa AllianceSigfox3GPP release 13
Licensed spectrumNoNoYes
FrequencyISM Bands
433 MHz Asia,
868 MHz Europe,
915 MHz N. America
ISM Bands
433 MHz Asia,
868 MHz Europe,
915 MHz N. America
Cell Band LTE
ModulationChirp Spread Spectrum (CSS)DBPSK/GFSKQPSK/BPSK
Data speed250 bps–50 kbps100 bps200 Kbps
Bandwidth125–250 KHz100 Hz200 KHz
TopologystarstarLTE network
Capacity Connected device50 K per cell50 K per cell100 K per cell
Bidirectional communicationyes/Half duplexLimited/Half duplexyes/Half Duplex
Protocolasynchronousasynchronoussynchronous
Message per dayunlimited140 uplink
4 downlink
unlimited
Maximum payload length243 bytes12 bytes uplink
8 bytes downlink
1600 bytes
SecurityYes (AES 128b)NoYes (LTE)
GeolocationTDoARSSIOTDoA
QoSNoNoYes
Energy consumptionlowlowhigh
LatencyLow with class Chighlow
Interference immunityhighhighlow
Installation cost per base station>EUR 1000>EUR 4000>EUR 15,000
Final device costEUR 3–5<EUR 2>EUR 20
Table 2. Comparative LoRa frequency chart for Europe, North America, and Ecuador.
ParametersEuropeNorth AmericaEcuador
Frequency863–870 MHz902–928 MHz902–928 MHz
Channel planEU863–870US902–928AU915–928
Duty cycle<1%No limitNo limit
Channel uplink125/250 KHz125/500 KHz125/500 KHz
Channel downlink125 KHz500 KHz500 KHz
Channels1064 + 8 + 864 + 8 + 8
SF7–127–107–12
Table 3. Comparative chart of Long Range (LoRa) Spreading Factor (SF) parameters according to the analyzed areas.
SFBWBitrate (EU)Bitrate (NA)Bitrate (EC)
LoRaSF12125 kHz250 bps-250 bps
LoRaSF11125 kHz440 bps-440 bps
LoRaSF10125 kHz980 bps980 bps980 bps
LoRaSF9125 kHz1.7 Kbps1.7 Kbps1.7 Kbps
LoRaSF8125 kHz3.1 Kbps3.1 Kbps3.1 Kbps
LoRaSF7125 kHz5.4 Kbps5.4 Kbps5.4 Kbps
LoRaSF7250 kHz11 Kbps--
LoRaSF7500 kHz-21.9 Kbps21.9 Kbps
FSK--50 Kbps--
Table 4. Comparison of simulators. Adapted from [64] and completed with new data by authors.
NS-3OMNET++LoRaSim
Discrete event simulatorYesYesYes
Open source simulatorYesYesNo
LanguageC++/PythonC++/NEDPython/SimPy
Graphic interfaceNoYesYes
Operating systemWindows/Unix/macOsWindows/Linux/macOsLinux
Applicationinvestigative/academicinvestigative/academicinvestigative
LPWANNB-IoT/LoRaLoRaLoRa
FrameworkLoraPhy/LoramacLoRaloraDir.py/loraDirMulBs.py/
directionalLoraIntf.py
ADRYesYesNo
Energy ConsumptionYesYesYes
Bidirectional communicationYesYesNo
Medium spreadYesYesNo
Publisher’s Note: MDPI stays neutral with regard to jurisdictional claims in published maps and institutional affiliations.