
Application of Artificial Neural Network Sensitivity Analysis to Identify Key Determinants of Harvesting Date and Yield of Soybean (Glycine max [L.] Merrill) Cultivar Augusta

 ,
,  ,
,  ,
,  ,
,  and
and 
Abstract
1. Introduction
2. Materials and Methods
2.1. Plant Material
2.2. Field Test
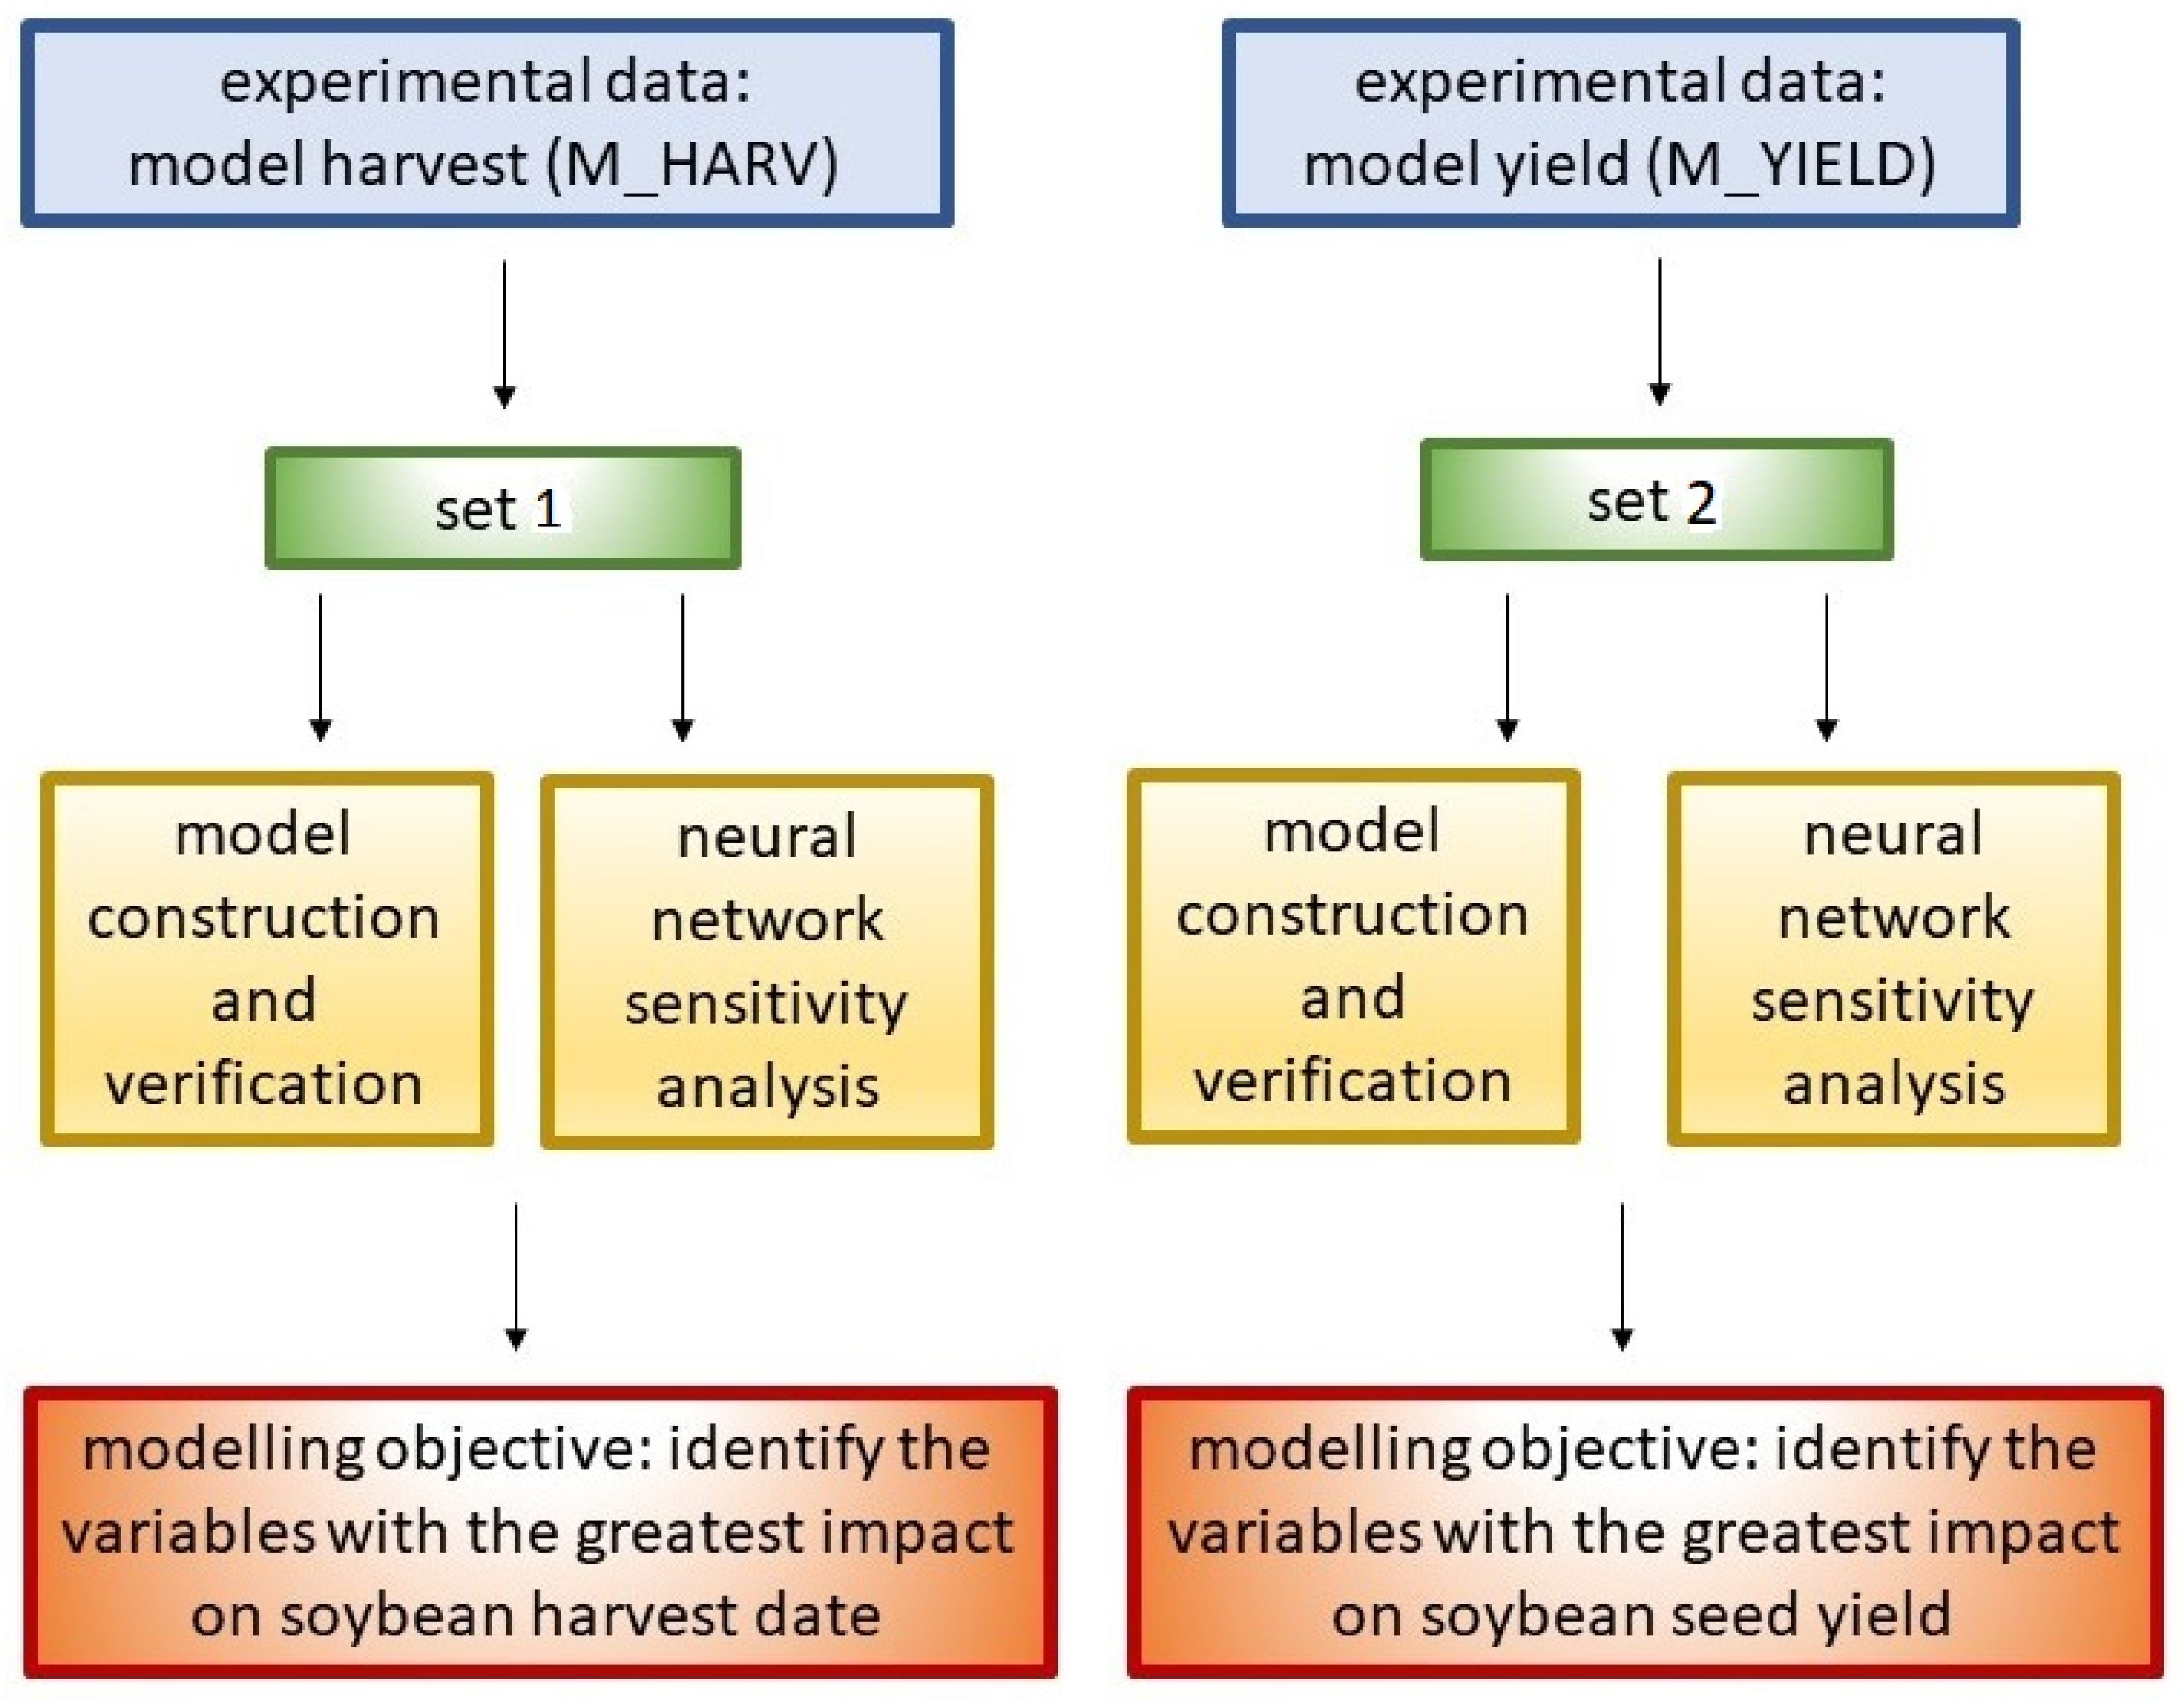
2.3. Division of Experimental Data into Sets Used in the Analyses
2.4. Methodology for Predictive Model Development
- P—total monthly rainfall (mm),
- Σt—sum of monthly average daily air temperatures > 6 °C.
2.5. Neural Network Sensitivity Analysis
3. Results
Comparison of Models M_HARV and M_YIELD Quality Characteristics
4. Discussion
5. Conclusions
Author Contributions
Funding
Institutional Review Board Statement
Informed Consent Statement
Data Availability Statement
Conflicts of Interest
Appendix A


References
- World Agricultural Production. Available online: https://apps.fas.usda.gov/psdonline/circulars/production.pdf (accessed on 5 April 2022).
- Powierzchnie Upraw W Gminach. Available online: https://rejestrupraw.arimr.gov.pl/ (accessed on 5 April 2022).
- Niwińska, B.; Witaszek, K.; Niedbała, G.; Pilarski, K. Seeds of n-GM Soybean Varieties Cultivated in Poland and Their Processing Products as High-Protein Feeds in Cattle Nutrition. Agriculture 2020, 10, 174. [Google Scholar] [CrossRef]
- Gawęda, D.; Nowak, A.; Haliniarz, M.; Woźniak, A. Yield and Economic Effectiveness of Soybean Grown Under Different Cropping Systems. Int. J. Plant Prod. 2020, 14, 475–485. [Google Scholar] [CrossRef]
- Boerma, H.R.; Specht, J.E. Soybeans: Improvement, Production, and Uses, 3rd ed.; American Society of Agronomy, Crop Science Society of America, Soil Science Society of America: Madison, WI, USA, 2004. [Google Scholar]
- Miladinović, J.; Ćeran, M.; Đorđević, V.; Balešević-Tubić, S.; Petrović, K.; Đukić, V.; Miladinović, D. Allelic Variation and Distribution of the Major Maturity Genes in Different Soybean Collections. Front. Plant Sci. 2018, 9, 1286. [Google Scholar] [CrossRef]
- Krużel, J.; Ziernicka-Wojtaszek, A.; Borek, Ł.; Ostrowski, K. The changes in the duration of the meteorological vegetation period in Poland in the years 1971–2000 and 1981–2010. Inż. Ekol. 2015, 44, 47–52. [Google Scholar] [CrossRef]
- Michałek, S.; Borowski, E. Yielding, oil, fatty acids and protein content in the seeds of polish soybean cultivars under drought conditions. Acta Agrophysica 2006, 8, 459–471. [Google Scholar]
- Kołodziej, J.; Pisulewska, E. Effect of climatic factors on seed yield, fat yield and fat content in seeds of two soybean cultivars. Oilseed Crop. 2000, XXI, 759–776. [Google Scholar]
- Sobko, O.; Stahl, A.; Hahn, V.; Zikeli, S.; Claupein, W.; Gruber, S. Environmental Effects on Soybean (Glycine Max (L.) Merr) Production in Central and South Germany. Agronomy 2020, 10, 1847. [Google Scholar] [CrossRef]
- Novikova, L.Y.; Bulakh, P.P.; Nekrasov, A.Y.; Seferova, I.V. Soybean Response to Weather and Climate Conditions in the Krasnodar and Primorye Territories of Russia over the Past Decades. Agronomy 2020, 10, 1278. [Google Scholar] [CrossRef]
- Penalba, O.C.; Bettolli, M.L.; Vargas, W.M. The impact of climate variability on soybean yields in Argentina. Multivariate regression. Meteorol. Appl. 2007, 14, 3–14. [Google Scholar] [CrossRef]
- Choi, D.-H.; Ban, H.-Y.; Seo, B.-S.; Lee, K.-J.; Lee, B.-W. Phenology and Seed Yield Performance of Determinate Soybean Cultivars Grown at Elevated Temperatures in a Temperate Region. PLoS ONE 2016, 11, e0165977. [Google Scholar] [CrossRef]
- Gao, X.-B.; Guo, C.; Li, F.-M.; Li, M.; He, J. High Soybean Yield and Drought Adaptation Being Associated with Canopy Architecture, Water Uptake, and Root Traits. Agronomy 2020, 10, 608. [Google Scholar] [CrossRef]
- Lambers, H.; Chapin, F.S.; Pons, T.L. The Plant’s Energy Balance. In Plant Physiological Ecology; Springer: New York, NY, USA, 2008; pp. 225–236. [Google Scholar]
- Miladinov, Z.; Maksimovic, I.; Tubic, S.B.; Miladinovic, J.; Djordevic, V.; Vasiljevic, M.; Radic, V. The Impact of Water Deficit on The Soybean (Glycine max L.) Reproductive Stage of Development. Legum. Res.-AN Int. J. 2020, 43, 693–697. [Google Scholar] [CrossRef]
- Staniak, M.; Czopek, K.; Stępień-Warda, A.; Kocira, A.; Przybyś, M. Cold Stress during Flowering Alters Plant Structure, Yield and Seed Quality of Different Soybean Genotypes. Agronomy 2021, 11, 2059. [Google Scholar] [CrossRef]
- Ogunkanmi, L.; MacCarthy, D.S.; Adiku, S.G.K. Impact of Extreme Temperature and Soil Water Stress on the Growth and Yield of Soybean (Glycine max (L.) Merrill). Agriculture 2021, 12, 43. [Google Scholar] [CrossRef]
- Cheng-Zhi, C.; Cong-Jian, L.; Dan, X.; Xiao-Shan, Z.; Jin, Z. Global warming and world soybean yields. J. Agrometeorol. 2021, 23, 367–374. [Google Scholar] [CrossRef]
- Tacarindua, C.R.P.; Shiraiwa, T.; Homma, K.; Kumagai, E.; Sameshima, R. The response of soybean seed growth characteristics to increased temperature under near-field conditions in a temperature gradient chamber. F. Crop. Res. 2012, 131, 26–31. [Google Scholar] [CrossRef]
- Tacarindua, C.R.P.; Shiraiwa, T.; Homma, K.; Kumagai, E.; Sameshima, R. The effects of increased temperature on crop growth and yield of soybean grown in a temperature gradient chamber. F. Crop. Res. 2013, 154, 74–81. [Google Scholar] [CrossRef]
- Zhao, C.; Liu, B.; Piao, S.; Wang, X.; Lobell, D.B.; Huang, Y.; Huang, M.; Yao, Y.; Bassu, S.; Ciais, P.; et al. Temperature increase reduces global yields of major crops in four independent estimates. Proc. Natl. Acad. Sci. USA 2017, 114, 9326–9331. [Google Scholar] [CrossRef] [PubMed]
- Nawracała, J. Analiza Genetyczno-Hodowlana Mieszańców i Linii Soi Otrzymanych z Krzyżowania Międzygatun-Kowego Glycine Max x Glycine Soja; Rozprawa naukowa w serii Rozprawy Naukowe Uniwersytetu Przyrodniczego w Poznaniu nr 394; Wydawnictwo Uniwersytetu Przyrodniczego w Poznaniu: Poznań, Poland, 2008. [Google Scholar]
- Mandić, V.; Đorđević, S.; Đorđević, N.; Bijelić, Z.; Krnjaja, V.; Petričević, M.; Brankov, M. Genotype and Sowing Time Effects on Soybean Yield and Quality. Agriculture 2020, 10, 502. [Google Scholar] [CrossRef]
- Piekutowska, M.; Niedbała, G.; Piskier, T.; Lenartowicz, T.; Pilarski, K.; Wojciechowski, T.; Pilarska, A.A.; Czechowska-Kosacka, A. The Application of Multiple Linear Regression and Artificial Neural Network Models for Yield Prediction of Very Early Potato Cultivars before Harvest. Agronomy 2021, 11, 885. [Google Scholar] [CrossRef]
- Hara, P.; Piekutowska, M.; Niedbała, G. Selection of Independent Variables for Crop Yield Prediction Using Artificial Neural Network Models with Remote Sensing Data. Land 2021, 10, 609. [Google Scholar] [CrossRef]
- Pentoś, K. The methods of extracting the contribution of variables in artificial neural network models—Comparison of inherent instability. Comput. Electron. Agric. 2016, 127, 141–146. [Google Scholar] [CrossRef]
- Niazian, M.; Niedbała, G. Machine Learning for Plant Breeding and Biotechnology. Agriculture 2020, 10, 436. [Google Scholar] [CrossRef]
- Kujawa, S.; Dach, J.; Kozłowski, R.J.; Przybył, K.; Niedbała, G.; Mueller, W.; Tomczak, R.J.; Zaborowicz, M.; Koszela, K. Maturity classification for sewage sludge composted with rapeseed straw using neural image analysis. In Proceedings of the SPIE—The International Society for Optical Engineering, Chengu, China, 20–22 May 2016; Volume 10033, p. 100332H. [Google Scholar]
- Wojciechowski, T.; Niedbala, G.; Czechlowski, M.; Nawrocka, J.R.; Piechnik, L.; Niemann, J. Rapeseed seeds quality classification with usage of VIS-NIR fiber optic probe and artificial neural networks. In Proceedings of the 2016 International Conference on Optoelectronics and Image Processing, ICOIP 2016, Warsaw, Poland, 10–12 June 2016. [Google Scholar]
- Niedbała, G.; Piekutowska, M.; Rudowicz-Nawrocka, J.; Adamski, M.; Wojciechowski, T.; Herkowiak, M.; Szparaga, A.; Czechowska-Kosacka, A. Application of artificial neural networks to analyze the emergence of soybean seeds after applying herbal treatments. J. Res. Appl. Agric. Eng. 2018, 63, 145–149. [Google Scholar]
- Majkovič, D.; O’Kiely, P.; Kramberger, B.; Vračko, M.; Turk, J.; Pažek, K.; Rozman, Č. Comparison of using regression modeling and an artificial neural network for herbage dry matter yield forecasting. J. Chemom. 2016, 30, 203–209. [Google Scholar] [CrossRef]
- Gorzelany, J.; Belcar, J.; Kuźniar, P.; Niedbała, G.; Pentoś, K. Modelling of Mechanical Properties of Fresh and Stored Fruit of Large Cranberry Using Multiple Linear Regression and Machine Learning. Agriculture 2022, 12, 200. [Google Scholar] [CrossRef]
- Sabzi-Nojadeh, M.; Niedbała, G.; Younessi-Hamzekhanlu, M.; Aharizad, S.; Esmaeilpour, M.; Abdipour, M.; Kujawa, S.; Niazian, M. Modeling the Essential Oil and Trans-Anethole Yield of Fennel (Foeniculum vulgare Mill. var. vulgare) by Application Artificial Neural Network and Multiple Linear Regression Methods. Agriculture 2021, 11, 1191. [Google Scholar] [CrossRef]
- Lu, M.; AbouRizk, S.M.; Hermann, U.H. Sensitivity Analysis of Neural Networks in Spool Fabrication Productivity Studies. J. Comput. Civ. Eng. 2001, 15, 299–308. [Google Scholar] [CrossRef]
- Nourani, V.; Sayyah Fard, M. Sensitivity analysis of the artificial neural network outputs in simulation of the evaporation process at different climatologic regimes. Adv. Eng. Softw. 2012, 47, 127–146. [Google Scholar] [CrossRef]
- IUSS Working Group WRB. World Reference Base for Soil Resources 2014, Update 2015 International Soil Classification System for Naming Soils and Creating Legends for Soil Maps. World Soil Resources Reports No. 106; FAO: Rome, Italy, 2015; ISBN 978-92-5-108369-7. [Google Scholar]
- TIBCO Statistica® Automated Neural Networks. Available online: https://community.tibco.com/wiki/tibco-statistica-automated-neural-networks (accessed on 10 January 2022).
- Bhojani, S.H.; Bhatt, N. Wheat crop yield prediction using new activation functions in neural network. Neural Comput. Appl. 2020, 32, 13941–13951. [Google Scholar] [CrossRef]
- Niedbała, G.; Piekutowska, M.; Weres, J.; Korzeniewicz, R.; Witaszek, K.; Adamski, M.; Pilarski, K.; Czechowska-Kosacka, A.; Krysztofiak-Kaniewska, A. Application of Artificial Neural Networks for Yield Modeling of Winter Rapeseed Based on Combined Quantitative and Qualitative Data. Agronomy 2019, 9, 781. [Google Scholar] [CrossRef]
- Schober, P.; Boer, C.; Schwarte, L.A. Correlation Coefficients. Anesth. Analg. 2018, 126, 1763–1768. [Google Scholar] [CrossRef] [PubMed]
- Mas, D.M.L.; Ahlfeld, D.P. Comparing artificial neural networks and regression models for predicting faecal coliform concentrations. Hydrol. Sci. J. 2007, 52, 713–731. [Google Scholar] [CrossRef]
- Hadzima-Nyarko, M.; Nyarko, E.K.; Morić, D. A neural network based modelling and sensitivity analysis of damage ratio coefficient. Expert Syst. Appl. 2011, 38, 13405–13413. [Google Scholar] [CrossRef]
- Farjam, A.; Omid, M.; Akram, A.; Fazel Niari, Z. A neural network based modeling and sensitivity analysis of energy inputs forpredicting seed and grain corn yields. J. Agric. Sci. Technol. 2014, 16, 767–778. [Google Scholar]
- Niedbała, G.; Kozłowski, R.J. Application of Artificial Neural Networks for Multi-Criteria Yield Prediction of Winter Wheat. J. Agric. Sci. Technol. 2019, 21, 51–61. [Google Scholar]
- Ku, Y.-S.; Au-Yeung, W.-K.; Yung, Y.-L.; Li, M.-W.; Wen, C.-Q.; Liu, X.; Lam, H.-M. Drought Stress and Tolerance in Soybean. In A Comprehensive Survey of International Soybean Research—Genetics, Physiology, Agronomy and Nitrogen Relationships; InTech: Palm Beach, FL, USA, 2013; Available online: https://books.google.co.jp/books?hl=zh-CN&lr=&id=87WiDwAAQBAJ&oi=fnd&pg=PA209&dq=Drought+Stress+and+Tolerance+in+Soybean&ots=fzzy8-mhTX&sig=Eqnob_LJ7Xh4MsPOQCWxpjwH6ng#v=onepage&q=Drought%20Stress%20and%20Tolerance%20in%20Soybean&f=false (accessed on 10 January 2022).
- Oya, T.; Lima Nepomuceno, A.; Neumaier, N.; Bouças Farias, J.R.; Tobita, S.; Ito, O. Drought Tolerance Characteristics of Brazilian Soybean Cultivars—Evaluation and characterization of drought tolerance of various Brazilian soybean cultivars in the field. Plant Prod. Sci. 2004, 7, 129–137. [Google Scholar] [CrossRef]
- Kucharik, C.J.; Serbin, S.P. Impacts of recent climate change on Wisconsin corn and soybean yield trends. Environ. Res. Lett. 2008, 3, 34003. [Google Scholar] [CrossRef]


| Symbol | Unit of Measure | Variable Name | Model M_HARV | Model M_YIELD | The Scope of Data |
|---|---|---|---|---|---|
| T-IV-1 | °C | Average air temperature in the 1st decade of April | + | + | 1.8–12 |
| T-IV-2 | °C | Average air temperature in the 2nd decade of April | + | + | 5.9–15.9 |
| T-IV-3 | °C | Average air temperature in the 3rd decade of April | + | + | 6.9–17.4 |
| T-V-1 | °C | Average air temperature in the 1st decade of May | + | + | 9.4–18 |
| T-V-2 | °C | Average air temperature in the 2nd decade of May | + | + | 10.7–17.9 |
| T-V-3 | °C | Average air temperature in the 3rd decade of May | + | + | 11.1–22 |
| T-VI-1 | °C | Average air temperature in the 1st decade of June | + | + | 14.1–22.5 |
| T-VI-2 | °C | Average air temperature in the 2nd decade of June | + | + | 15.8–24.6 |
| T-VI-3 | °C | Average air temperature in the 3rd decade of June | + | + | 15.5–24.1 |
| T-VII-1 | °C | Average air temperature in the 1st decade of July | + | + | 16.4–25.2 |
| T-VII-2 | °C | Average air temperature in the 2nd decade of July | + | + | 17.9–25.6 |
| T-VII-3 | °C | Average air temperature in the 3rd decade of July | + | + | 16.3–26.9 |
| T-VIII-1 | °C | Average air temperature in the 1st decade of August | + | + | 17.2–26.4 |
| T-VIII-2 | °C | Average air temperature in the 2nd decade of August | + | + | 17.8–24.5 |
| T-VIII-3 | °C | Average air temperature in the 3rd decade of August | + | + | 15.8–22.3 |
| T-IX-1 | °C | Average air temperature in the 1st decade of September | + | + | 12.9–20.7 |
| T-IX-2 | °C | Average air temperature in the 2nd decade of September | + | + | 11.5–18.8 |
| T-IX-3 | °C | Average air temperature in the 3rd decade of September | + | + | 10.3–16.4 |
| O-IV-1 | mm | Total precipitation in the 1st decade of April | + | + | 0–28.5 |
| O-IV-2 | mm | Total precipitation in the 2nd decade of April | + | + | 0–32.5 |
| O-IV-3 | mm | Total precipitation in the 3rd decade of April | + | + | 0–22.4 |
| O-V-1 | mm | Total precipitation in the 1st decade of May | + | + | 3–40.2 |
| O-V-2 | mm | Total precipitation in the 2nd decade of May | + | + | 0–71 |
| O-V-3 | mm | Total precipitation in the 3rd decade of May | + | + | 0.4–62 |
| O-VI-1 | mm | Total precipitation in the 1st decade of June | + | + | 0–61.8 |
| O-VI-2 | mm | Total precipitation in the 2nd decade of June | + | + | 0.4–67.7 |
| O-VI-3 | mm | Total precipitation in the 3rd decade of June | + | + | 0–69 |
| O-VII-1 | mm | Total precipitation in the 1st decade of July | + | + | 0–94 |
| O-VII-2 | mm | Total precipitation in the 2nd decade of July | + | + | 4–109 |
| O-VII-3 | mm | Total precipitation in the 3rd decade of July | + | + | 1.2–76 |
| O-VIII-1 | mm | Total precipitation in the 1st decade of August | + | + | 0–189.5 |
| O-VIII-2 | mm | Total precipitation in the 2nd decade of August | + | + | 1.5–53 |
| O-VIII-3 | mm | Total precipitation in the 3rd decade of August | + | + | 2.3–74.5 |
| O-IX-1 | mm | Total precipitation in the 1st decade of September | + | + | 0–41.4 |
| O-IX-2 | mm | Total precipitation in the 2nd decade of September | + | + | 0–72 |
| O-IX-3 | mm | Total precipitation in the 3rd decade of September | + | + | 0–52.5 |
| STE_SK | °C | Growing Degree-Days (GDD) in the sowing-flowering period | + | + | 873.67–1146.53 |
| STE_SZ | °C | Growing Degree-Days (GDD) in sowing-harvest period | + | + | 2309.87–2818.43 |
| SO_SK | mm | Total precipitation in the sowing-flowering period | + | + | 37.5–236.9 |
| SO_SZ | mm | Total precipitation in the sowing-harvest period | + | + | 180–584.2 |
| S_SK | - | HTC in the sowing-flowering period | + | + | 0.37–2.59 |
| S_SZ | - | HTC in the sowing-harvest period | + | + | 0.66–2.1 |
| S | Day | Sowing date | + | + | 108–116 |
| K | Day | Flowering date | + | + | 160–174 |
| Z | Day | Harvest date | - | + | 240–271 |
| W | Day | Length of vegetation | + | + | 128–156 |
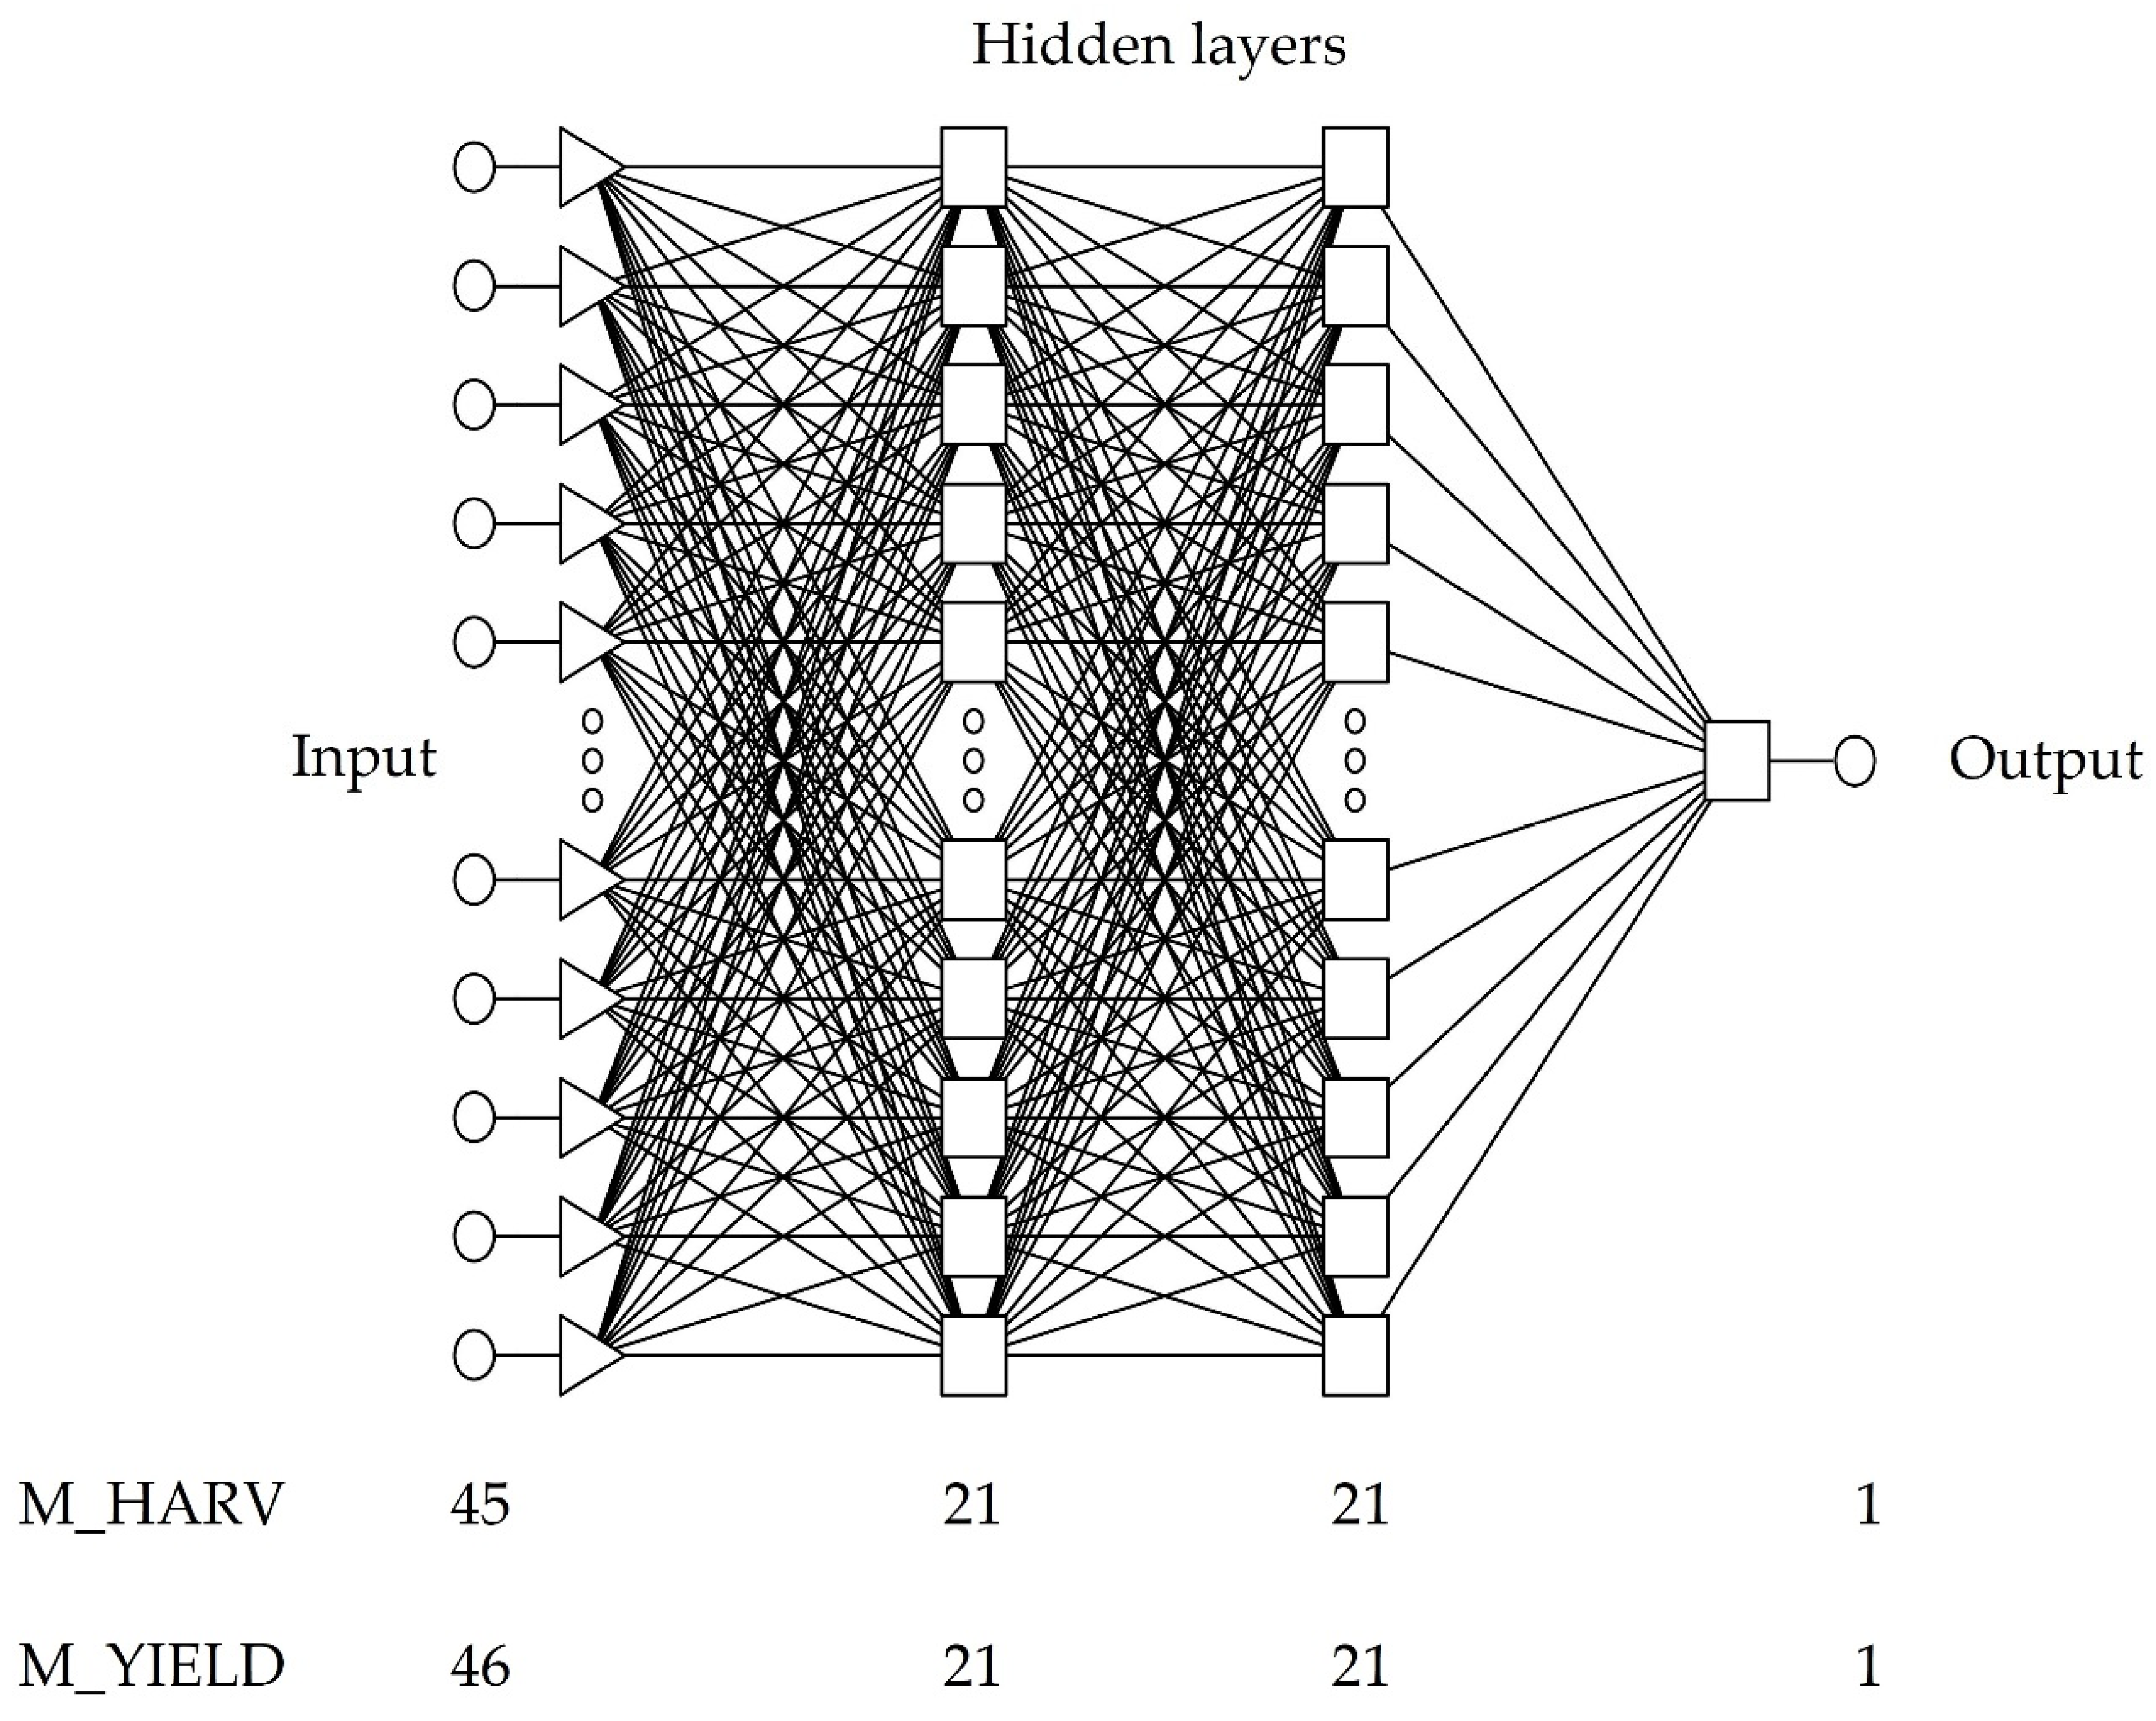
| Predictive Model | M_HARV | M_YIELD |
|---|---|---|
| Neural network architecture | MLP 45:45-21-21-1:1 | MLP 46:46-21-21-1:1 |
| The training epochs | ||
| Back-propagation method | 2 * | 30 * |
| Variable | Model | |||
|---|---|---|---|---|
| M_HARV | M_YIELD | |||
| Quotient | Rank | Quotient | Rank | |
| T-IV-1 | 1.019 | 38 | 0.991 | 35 |
| T-IV-2 | 0.977 | 44 | 1.024 | 26 |
| T-IV-3 | 1.060 | 33 | 0.990 | 36 |
| T-V-1 | 1.065 | 31 | 1.006 | 30 |
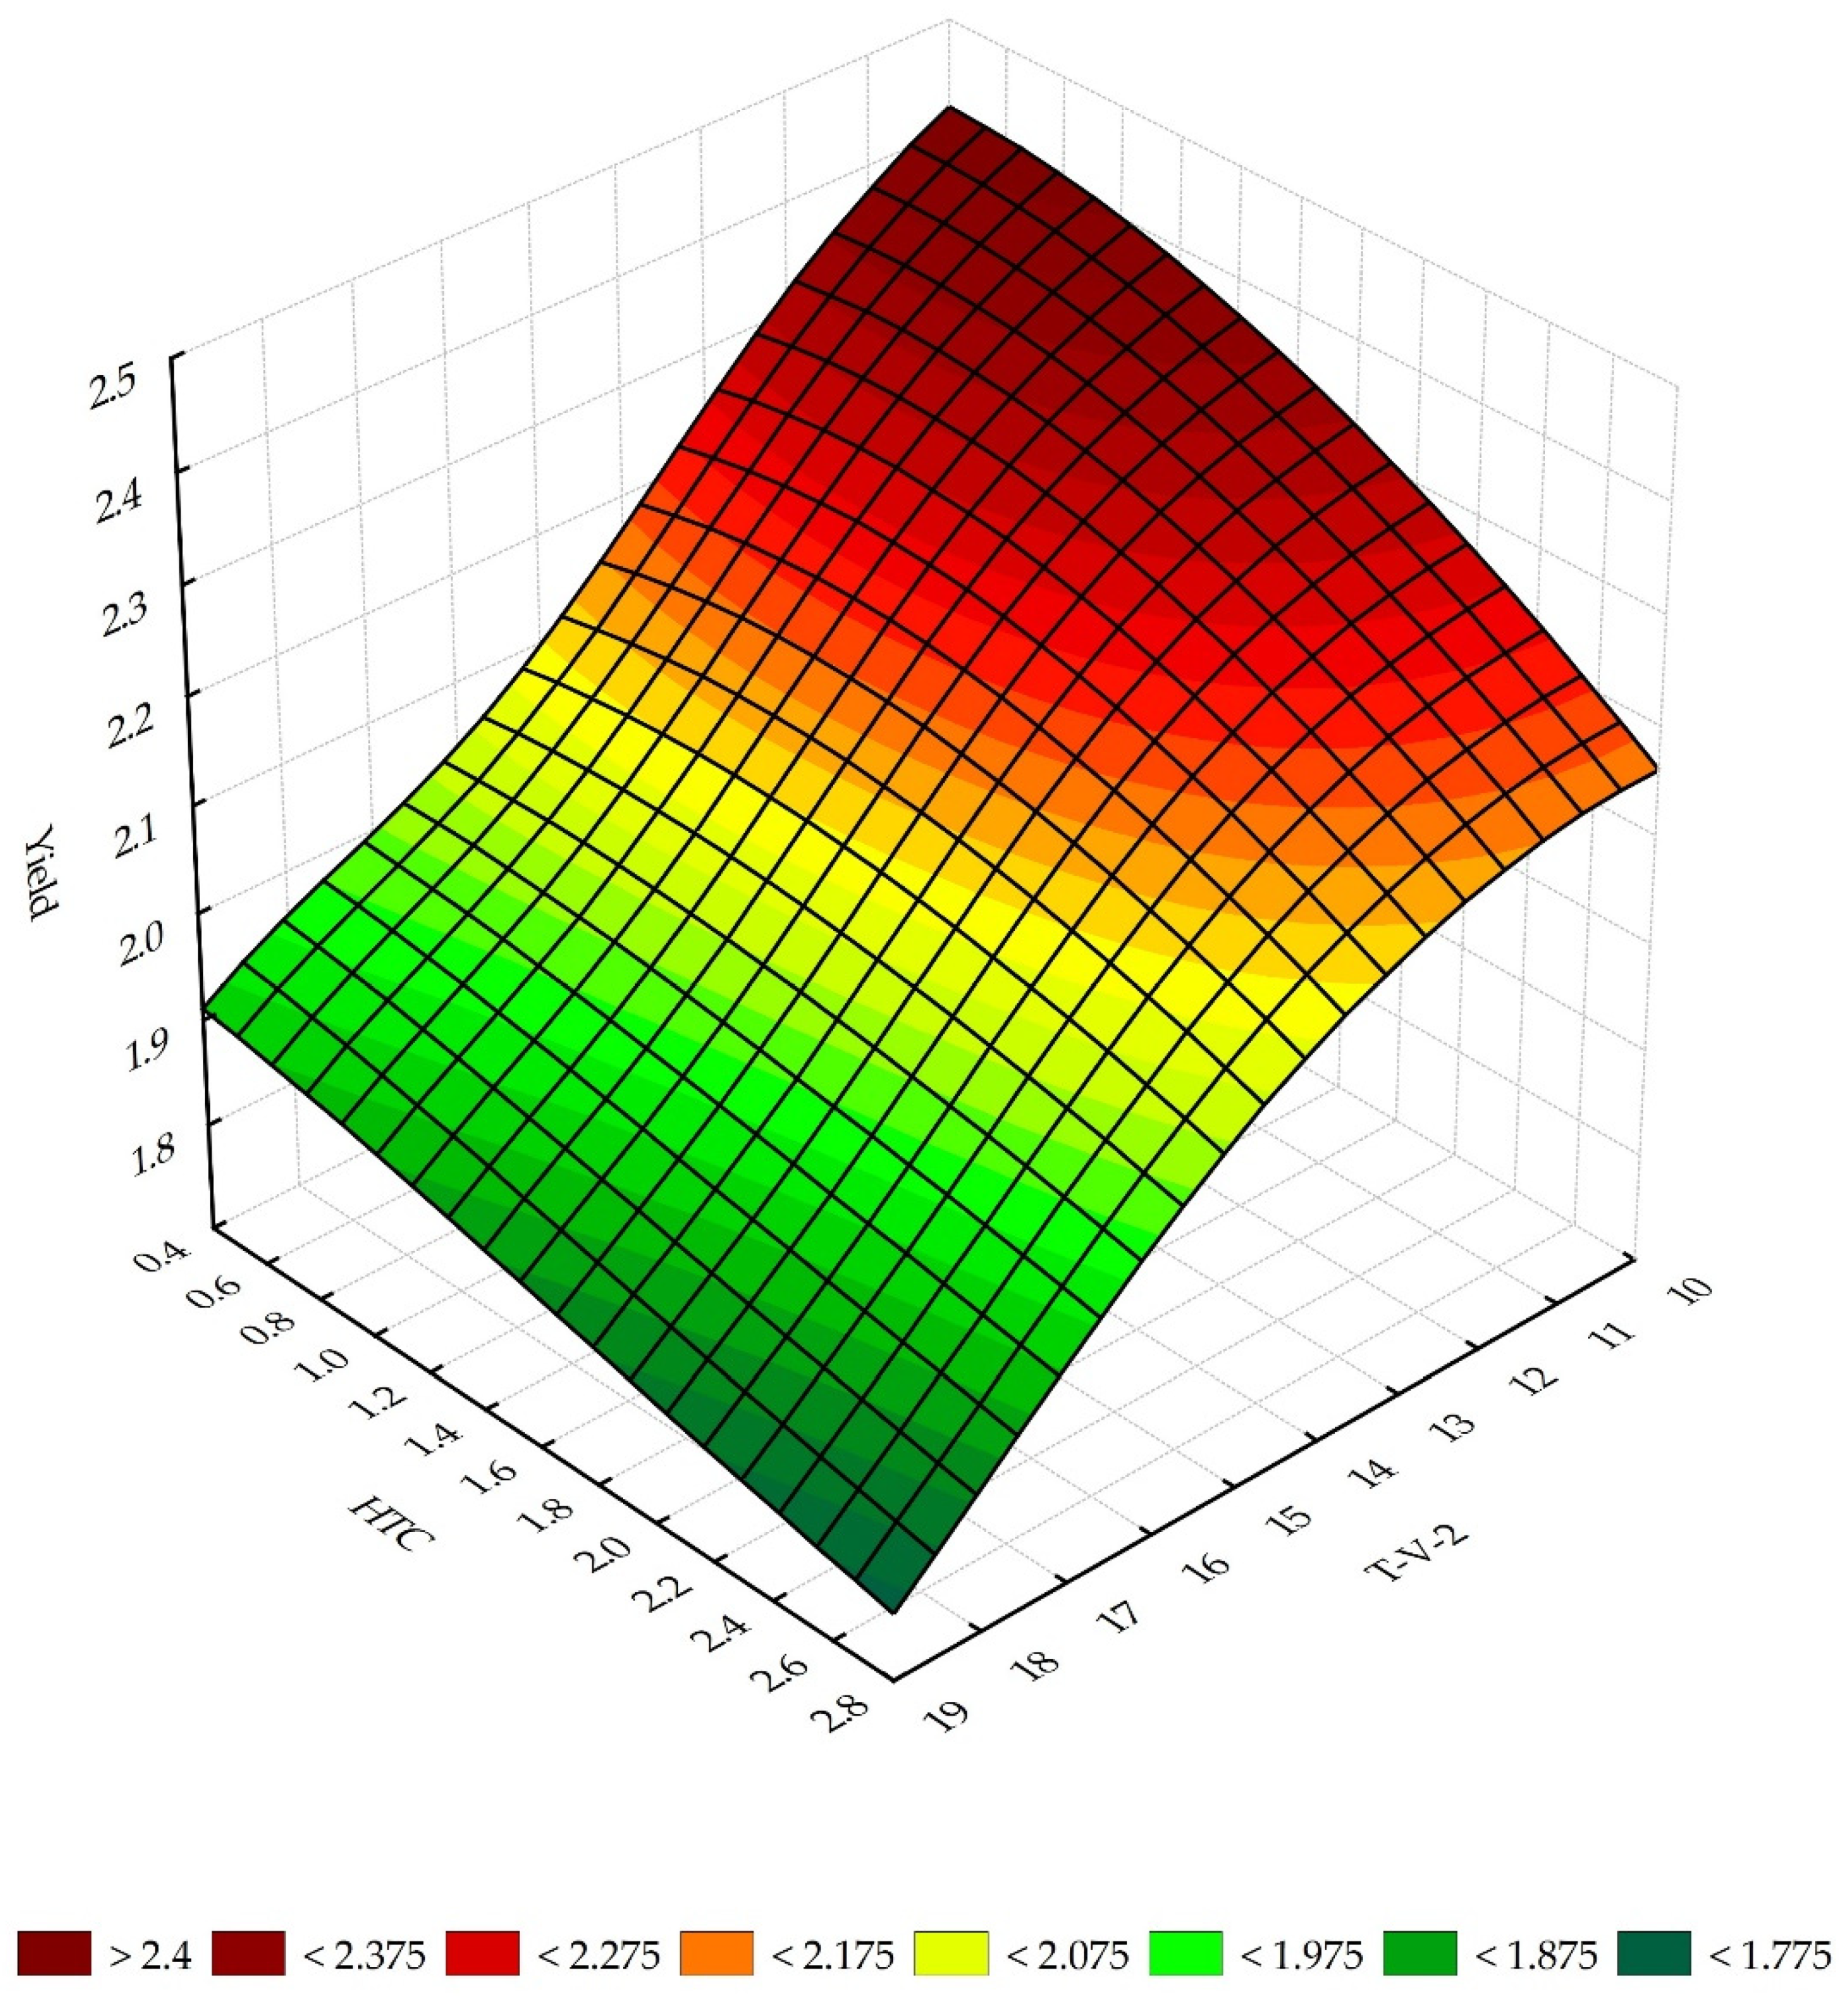
| T-V-2 | 1.325 | 6 | 1.225 | 1 |
| T-V-3 | 1.281 | 12 | 1.021 | 27 |
| T-VI-1 | 1.091 | 26 | 1.036 | 22 |
| T-VI-2 | 1.013 | 39 | 1.006 | 31 |
| T-VI-3 | 1.052 | 34 | 0.979 | 39 |
| T-VII-1 | 1.266 | 13 | 1.134 | 5 |
| T-VII-2 | 1.320 | 7 | 1.097 | 10 |
| T-VII-3 | 1.201 | 16 | 0.962 | 45 |
| T-VIII-1 | 0.930 | 45 | 1.013 | 28 |
| T-VIII-2 | 1.111 | 22 | 1.101 | 7 |
| T-VIII-3 | 1.065 | 30 | 0.971 | 42 |
| T-IX-1 | 1.172 | 18 | 1.034 | 23 |
| T-IX-2 | 1.008 | 42 | 1.134 | 4 |
| T-IX-3 | 1.075 | 29 | 1.053 | 18 |
| O-IV-1 | 1.185 | 17 | 1.100 | 9 |
| O-IV-2 | 1.008 | 40 | 0.972 | 41 |
| O-IV-3 | 1.286 | 10 | 0.914 | 46 |
| O-V-1 | 1.338 | 5 | 1.127 | 6 |
| O-V-2 | 1.338 | 4 | 1.042 | 21 |
| O-V-3 | 1.028 | 37 | 1.067 | 15 |
| O-VI-1 | 1.707 | 1 | 0.966 | 44 |
| O-VI-2 | 1.298 | 8 | 1.087 | 11 |
| O-VI-3 | 1.147 | 19 | 1.101 | 8 |
| O-VII-1 | 1.064 | 32 | 1.032 | 24 |
| O-VII-2 | 1.087 | 27 | 0.976 | 40 |
| O-VII-3 | 1.209 | 15 | 0.969 | 43 |
| O-VIII-1 | 1.486 | 2 | 1.056 | 17 |
| O-VIII-2 | 1.129 | 20 | 1.076 | 13 |
| O-VIII-3 | 1.034 | 35 | 1.069 | 14 |
| O-IX-1 | 1.008 | 41 | 1.002 | 33 |
| O-IX-2 | 1.029 | 36 | 1.004 | 32 |
| O-IX-3 | 1.096 | 24 | 1.027 | 25 |
| STE_SK | 1.127 | 21 | 0.984 | 38 |
| STE_SZ | 1.083 | 28 | 1.049 | 19 |
| SO_SK | 1.286 | 9 | 0.989 | 37 |
| SO_SZ | 1.099 | 23 | 1.012 | 29 |
| S_SK | 1.282 | 11 | 1.163 | 2 |
| S_SZ | 1.345 | 3 | 1.153 | 3 |
| S | 1.007 | 43 | 1.080 | 12 |
| K | 1.216 | 14 | 1.064 | 16 |
| Z | - | - | 0.995 | 34 |
| W | 1.094 | 25 | 1.042 | 20 |
| Quality Parameter | M_HARV | M_YIELD |
|---|---|---|
| Neural network structure | 45:45-21-21-1:1 | 46:46-21-21-1:1 |
| Learning error [-] | 0.1875 | 0.1273 |
| Validation error [-] | 0.0259 | 0.0062 |
| Mean [day], [t∙ha−1] | 250.5625 | 1.825 |
| Standard deviation [day], [t∙ha−1] | 8.3289 | 0.4322 |
| Average error [day], [t∙ha−1] | 1.2849 | 0.0152 |
| Deviation error [day], [t∙ha−1] | 3.6788 | 0.2865 |
| Mean Absolute error [day], [t∙ha−1] | 2.8846 | 0.2034 |
| Quotient deviations [-] | 0.4416 | 0.6629 |
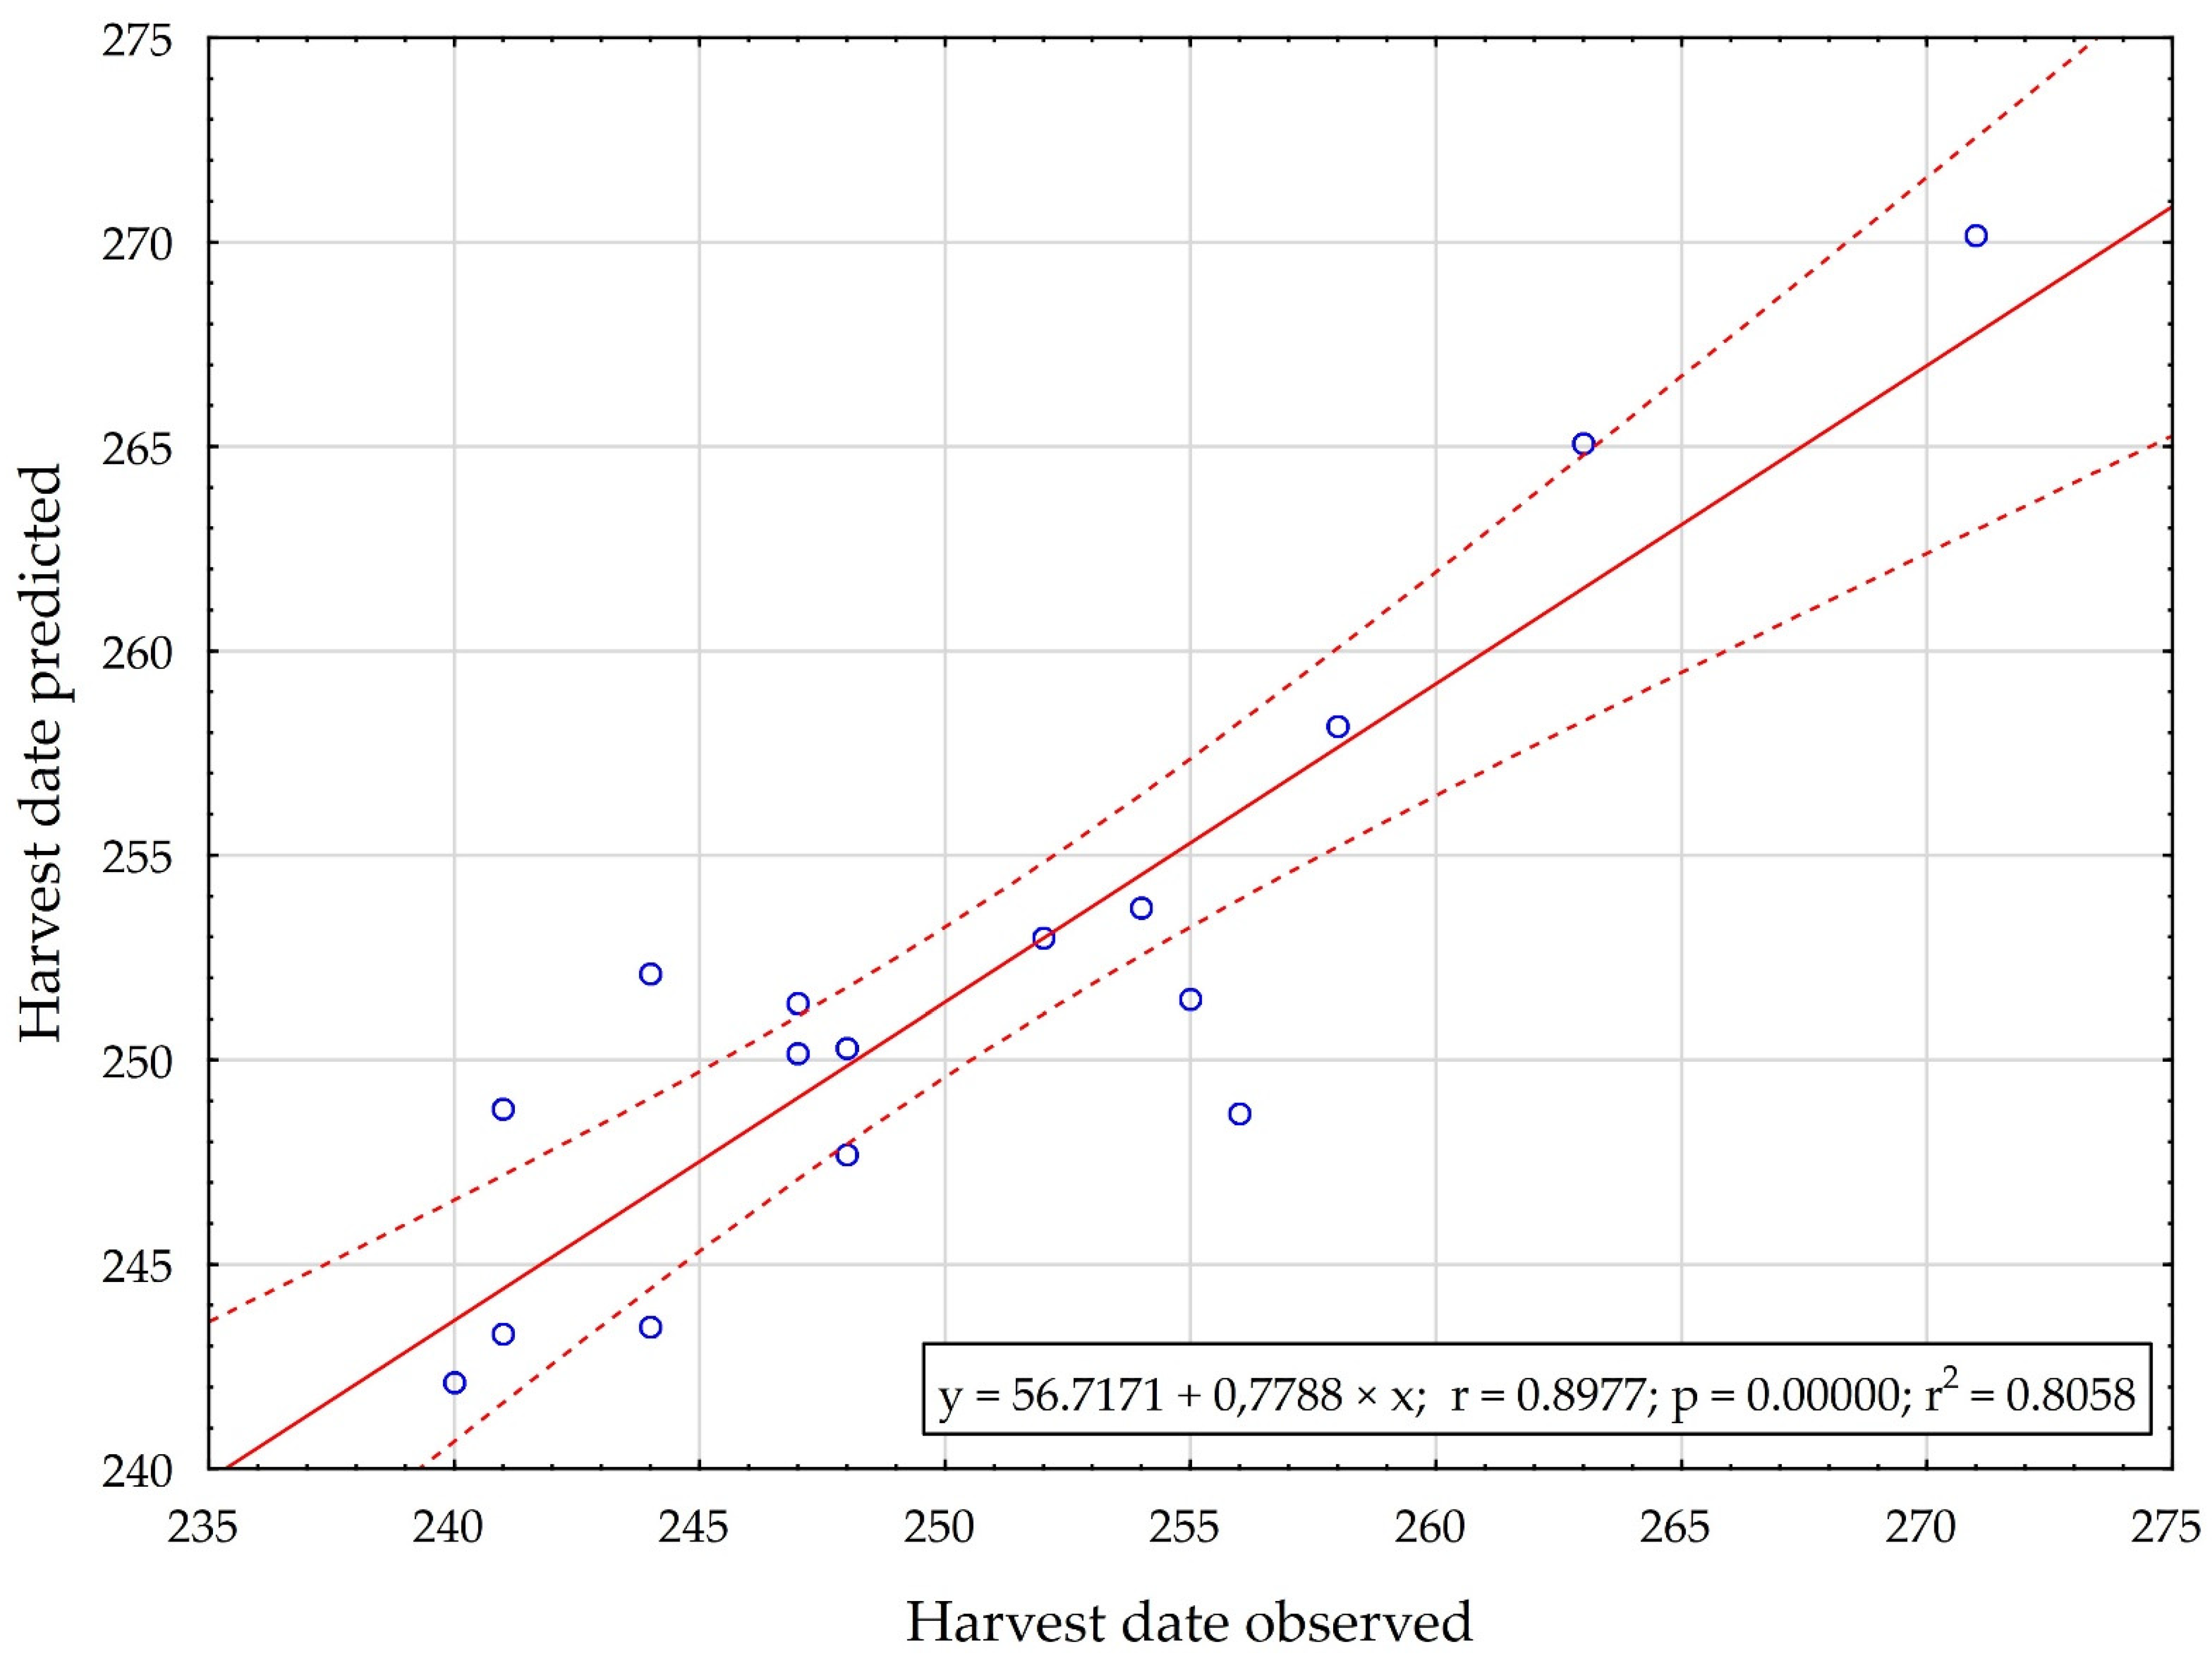
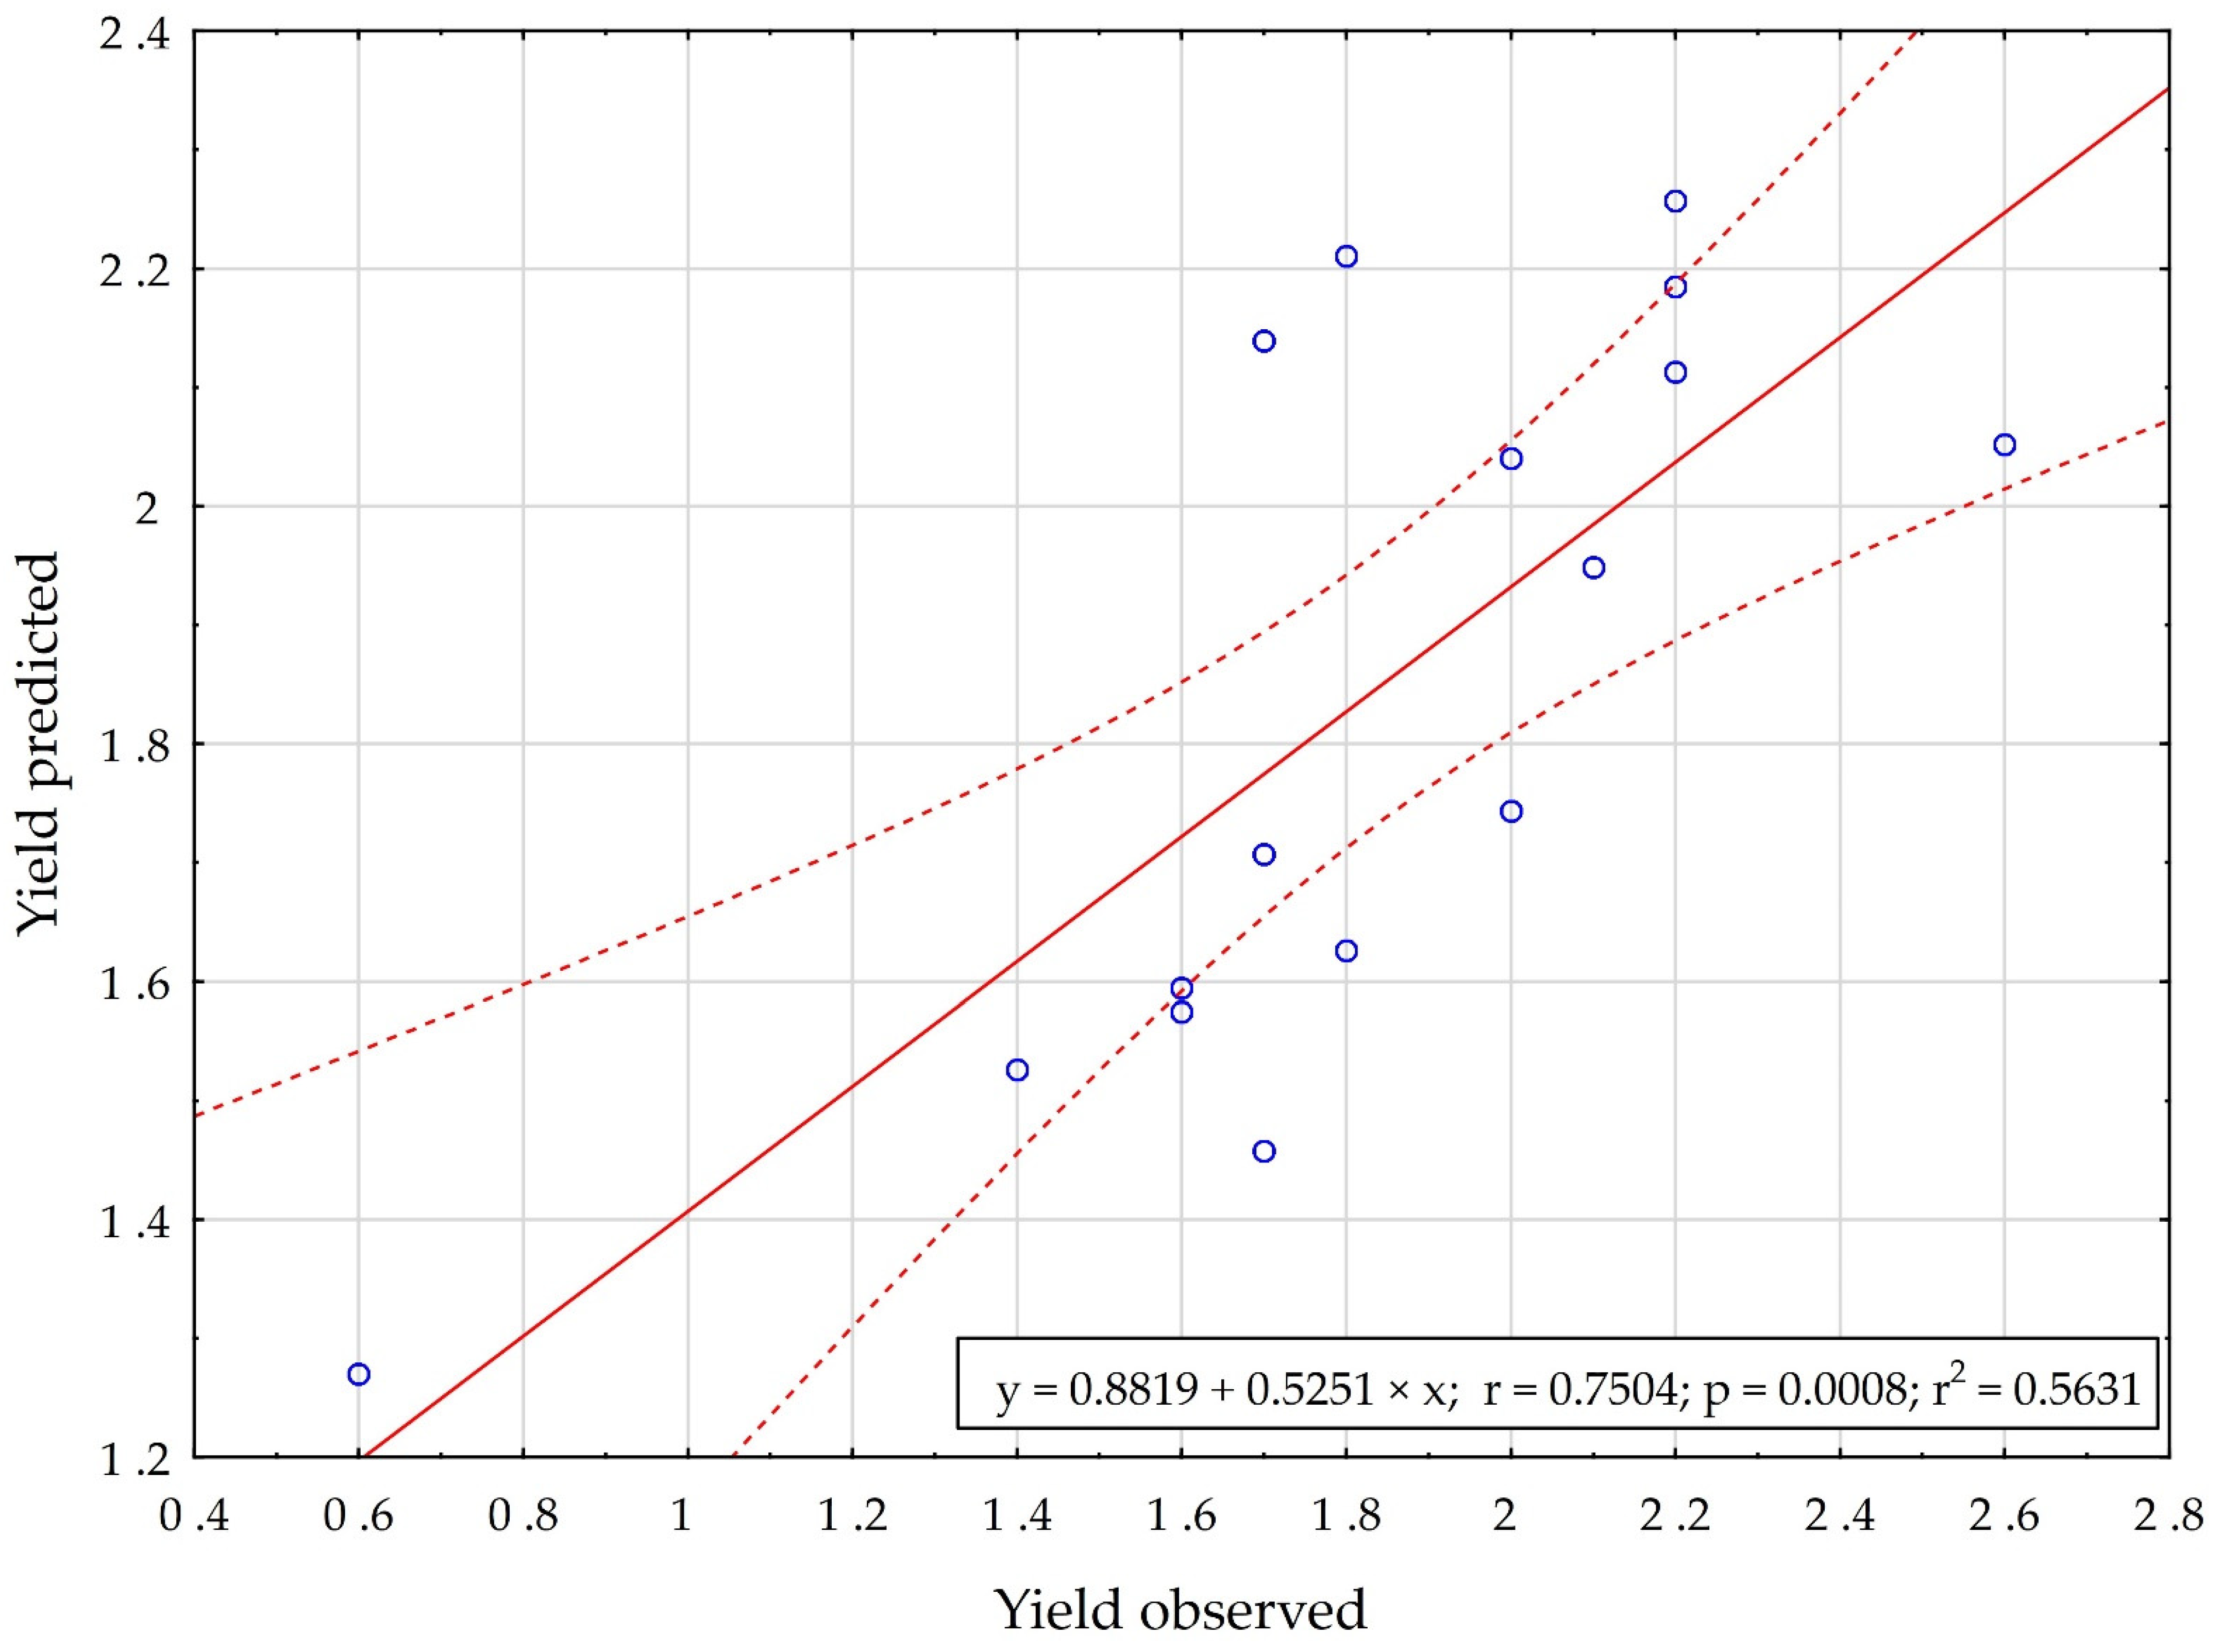
| Correlation [-] | 0.8976 | 0.7503 |
Publisher’s Note: MDPI stays neutral with regard to jurisdictional claims in published maps and institutional affiliations. |
© 2022 by the authors. Licensee MDPI, Basel, Switzerland. This article is an open access article distributed under the terms and conditions of the Creative Commons Attribution (CC BY) license (https://creativecommons.org/licenses/by/4.0/).
Share and Cite
Niedbała, G.; Kurasiak-Popowska, D.; Piekutowska, M.; Wojciechowski, T.; Kwiatek, M.; Nawracała, J. Application of Artificial Neural Network Sensitivity Analysis to Identify Key Determinants of Harvesting Date and Yield of Soybean (Glycine max [L.] Merrill) Cultivar Augusta. Agriculture 2022, 12, 754. https://doi.org/10.3390/agriculture12060754
Niedbała G, Kurasiak-Popowska D, Piekutowska M, Wojciechowski T, Kwiatek M, Nawracała J. Application of Artificial Neural Network Sensitivity Analysis to Identify Key Determinants of Harvesting Date and Yield of Soybean (Glycine max [L.] Merrill) Cultivar Augusta. Agriculture. 2022; 12(6):754. https://doi.org/10.3390/agriculture12060754
Chicago/Turabian StyleNiedbała, Gniewko, Danuta Kurasiak-Popowska, Magdalena Piekutowska, Tomasz Wojciechowski, Michał Kwiatek, and Jerzy Nawracała. 2022. "Application of Artificial Neural Network Sensitivity Analysis to Identify Key Determinants of Harvesting Date and Yield of Soybean (Glycine max [L.] Merrill) Cultivar Augusta" Agriculture 12, no. 6: 754. https://doi.org/10.3390/agriculture12060754
APA StyleNiedbała, G., Kurasiak-Popowska, D., Piekutowska, M., Wojciechowski, T., Kwiatek, M., & Nawracała, J. (2022). Application of Artificial Neural Network Sensitivity Analysis to Identify Key Determinants of Harvesting Date and Yield of Soybean (Glycine max [L.] Merrill) Cultivar Augusta. Agriculture, 12(6), 754. https://doi.org/10.3390/agriculture12060754