Article

The Genetic Assessment of South African Nguni Sheep Breeds Using the Ovine 50K Chip

by
Khanyisani S. Nxumalo
1,2,
Paul Grobler
1,
Karen Ehlers
1,
Lucky T. Nesengani
3 and
Ntanganedzeni O. Mapholi
3,*
1
Department of Genetics, University of the Free State, P.O. Box 339, Bloemfontein 9300, South Africa
2
Department of Animal Breeding and Genetics, Agricultural Research Council-Animal Production, Private Bag X2, Irene 0062, South Africa
3
Department of Agriculture and Animal Health, University of South Africa, Private Bag X6, Florida 1710, South Africa
*
Author to whom correspondence should be addressed.
Agriculture 2022, 12(5), 663; https://doi.org/10.3390/agriculture12050663
Submission received: 25 March 2022 / Revised: 22 April 2022 / Accepted: 27 April 2022 / Published: 4 May 2022

Abstract

:
The indigenous sheep breeds of South Africa, such as the Nguni, are well adapted to different ecological regions throughout the country. This has resulted into different ecotypes. However, it is not clear if the differences among Nguni sheep are genetically distinct. The present study aimed to use the latest technology to assess the genetic relationship between Nguni sheep ecotypes and the relationship to other selected South African breeds using SNP markers. In the current study, 144 South African sheep samples (75 Nguni sheep and 69 mixed-breed sheep as a reference) were genotyped using the OvineSNP50 Bead Chip assay from Illumina. The Nguni consisted of 25 Pedi, 25 Swazi, and 25 Zulu sheep, with the reference group comprising 25 Namaqua, 23 Dorper, and 21 Damara sheep. After quality control of 54,241 SNPs, 48,429 SNPs remained for analysis (MAF > 0.05). There were genetic differences in the Nguni sheep population; notably, the Zulu and Swazi populations clustered together, but with a clear distinction from the Pedi ecotype. Genetic admixtures were detected in the Damara and Dorper sheep. This is most likely a consequence of recent intermixing between indigenous and commercial breeds. The levels of genetic diversity within individual types were generally lower compared to commercial breeds. This study revealed an understanding regarding genetic variation within and among indigenous sheep breeds, which can be used as baseline information for establishing conservation and breeding programmes.

1. Introduction

Nguni sheep are an indigenous breed in South Africa that are adapted to different ecological regions. They are characterised by having fat tails and multicoloured coats for wool or hair [1]. This breed is subdivided into four ecotypes, namely, Zulu, Swazi, Landim, and Pedi [1,2]. In the case of Landim, awareness of the significance of conservation and sustainable use of animal genetic resources is often limited at the policy level [3]. This plays a major role in the limited representation of the breed in genetic studies of this population for genetic diversity analysis as compared to the other three ecotypes. South Africa consists of two predominant animal production systems, the communal or small holder and the commercial production systems [4]. The Nguni sheep is a valuable resource for sustenance production among South African smallholder farmers. They are characterised by their hardiness, coat colour, and pattern variations [5]. Their genetic ability to withstand high temperatures or humidity and generally unstable environmental conditions needs to be unravelled for conservation purpose [6,7,8]. The genetic documentation of this sheep is important for the identification of its unique features that may be at risk of extinction.
The Nguni sheep is experiencing terminal crossbreeding with commercial or exotic breeds that could potentially result in the dilution of their unique adaptation traits [9]. This sheep is mainly kept in communal land, where farming systems are given little attention because grazing areas are communal property allocated by the local chiefs [10,11,12]. The communal farming consists of indiscriminate breeding practices that expose the indigenous breeds to terminal crossbreeding effects [13].
The scientific literature shows that Nguni sheep have been studied for both phenotypic and genetic diversity. The phenotypic studies include those conducted by Mavule et al., [2,14], which involved populations from different flocks in South Africa and Eswatini. The genetic diversity analysis accounted for variations between and within breed types from South Africa and the Eswatini, but they were performed using low-density markers, including random amplified polymorphic DNA (RAPD) [2,6,9] and microsatellite markers [1,9]. The analysis from these markers indicated a close genetic relationship between the Zulu and Swazi populations from both the RAPD and microsatellite data. Moreover, the results marked the clear distinction of the Pedi population from the other Nguni populations [2,15]. More recently, the analysis of genetic diversity using single nucleotide polymorphism (SNPs) markers has been given more attention due to their abundance throughout the genome [16,17]. The objective of the current study was to use the Ovine50KSNP Bead Chip technology to assess the genetic relationship between Nguni sheep ecotypes in South Africa.
Analysis of molecular variances can be used to examine the variation within and between populations; therefore, an understanding of genetic variation and the relationships between and within Nguni sheep ecotypes is essential for the implementation of breeding and conservation programmes [8]. In this regard, breed characterisation is a recognised approach by which to evaluate genetic variations within and between populations [18]. It is regarded as an ideal approach to better understand the genetic history of sheep breeds in order to identify the present patterns of diversity among populations and to describe breed origin [19]. Therefore, the characterisation of indigenous sheep for genetic diversity in indigenous breeds is important in the study of the population genetic history so as to develop a well-managed breeding programme [5,20]. The present study aimed to use the latest technology to assess the genetic relationship between Nguni sheep ecotypes and the relationship to other selected South African breeds, using SNP markers.

2. Materials and Methods

2.1. Sampled Populations and Sample Collection

Ethical approval for this study was obtained from the University of the Free State (UFS-AED2017/0003) and the Agricultural Research Council (APIEC16/031) Animal Ethic Committees (AECs). A total of 144 samples (blood) were collected, with 75 samples representing the three South African Nguni sheep ecotypes distributed as follows: 25 Swazi sheep from Eswatini (Swaziland Department of Agriculture) and KwaZulu -Natal (South Africa); 25 Pedi sheep from Mara Research Station, Limpopo Province of South Africa; and 25 Zulu sheep from Gauteng province and the Northern region of the KwaZulu-Natal Province of South Africa. Extensive crossbreeding of Nguni sheep has been previously reported [1,2,8,9]. Three reference populations, namely, Namaqua Afrikaner (n = 25), Dorper (n = 23), and Damara (n = 21), were also included to determine whether the Nguni populations has genetic links with these sheep breeds. The areas where the samples were collected are represented in Figure 1. Blood samples were collected using 6 mL EDTA blood collection tubes, as approved by both the UFS and ARC-API Animal Ethic Committees.

2.2. Laboratory Techniques

A total of 200 µL from each blood sample collected was used for DNA isolation, using the QIAGEN DNeasy blood and tissue kit (Hilden, Germany). DNA extraction procedures were performed as per the manufacturer’s protocol. Genomic DNA (gDNA) for all the samples was quantified by measuring both DNA concentration and purity. Genomic DNA concentrations were observed using the Qubit® 2.0 Fluorometer, after instrument calibration with dsDNA BR (broad range) Assay Standards 1 and 2. The sample concentration was standardised to 50 ng/µL (from sample starting concentrations of between 10 ng/µL and 100 ng/µL). The samples were further subjected to Nanodrop 2000 spectrophotometer testing for purity measurements, and the values were in the A260/A280 range 2.0 ≥ x ≥ 1.7. DNA quality was also confirmed visually on a 1% agarose gel by checking for sharp bands indicating non-degraded DNA. A DNA concentration of 50 ng/μL and the presence of a sharp band on the agarose gel for each sample were used as indicators of a sample suitable for genotyping. Genotyping was conducted at the Agricultural Research Council Biotechnology Platform in Pretoria, South Africa, with the Illumina Ovine50KSNP Bead Chip that features 54,241 SNP probes distributed across the whole ovine genome, using the Infinium Assay. Approximately 12 μL of DNA loaded in each well of a BeadChip of genomic DNA was used to genotype each sample. The samples were processed according to the Illumina Infinium–II assay protocol [21].

2.3. Statistical Analysis

2.3.1. Quality Control

Quality control (QC) was performed in all six population data sets using PLINK, a whole-genome association analysis toolset [22]. The data files for the final analysis were generated after pruning the merged dataset, with a sample call rate of less than 90% and SNPs that had a call rate below 95%, an MAF below 5%, or those that violated HWE (p < 0.001) were removed from further analysis. Screening for linkage disequilibrium (LD) was conducted since the LD between SNP markers could introduce bias during the analysis [23]. The LD-based pruning was conducted using the pairwise threshold model implemented in PLINK (command: —indep-pairwise 50 5 0.2).

2.3.2. Estimates of Within-Breed Genetic Diversity

Deviations from Hardy–Weinberg equilibrium (HWE) were estimated using the PLINK1.9 software. The mean heterozygosity HE and HO, calculated across few loci, serves as a valuable parameter for genetic variation within a population, whereas an inbreeding coefficient serves as a measure of the non-random association of alleles within population individuals. Therefore, the Fis determines the inbreeding effects within subpopulations, among subpopulations, and within population [24]. The summary statistics calculated were the estimation of relatedness, mean expected heterozygosity (HE), observed (HO) heterozygosity, and average individual inbreeding coefficients (Fis), which were calculated for LD-filtered mapped, autosomal SNPs within and across the different subpopulation; p values were calculated using ARLEQUIN version 3.5.2 with 1023 permutations [25]. Relatedness was calculated according to PLINK’s PI_HAT value between individual pairs as the proportion of identity-by-descent (IBD).

2.3.3. Genetic Differentiation

Analysis of molecular variance (AMOVA) was carried out using ARLEQUIN version 3.5.2 [25] to detect differentiation within and between all six populations using the pruned SNP dataset by assigning the populations into four groups: Nguni sheep, Damara, Doper, and Namaqua Afrikaner. The analyses were performed twice, with all breeds included and with the Nguni sheep types only, to detect population differentiation within and between groups. PGD Spider version 2.0.8.2 [26] was used to convert PLINK MAP and PED files to ARLEQUIN format. Genetic differentiation between the South African Nguni sheep populations was further evaluated by means of the ARLEQUIN software and expressed as pairwise Fst with associated p values.

2.4. Principal Component Analysis and Population Structure Analysis

Eigenvalues and eigenvectors were estimated using the principal component [27] command: --pca and evec file in PLINK [22]. Genesis software version 0.2.3 [28] was used to view the evec file in PCA format. ADMIXTURE 2.0 software [29] was used to infer the most probable number of ancestral populations based on the SNP genotype data and levels of admixture within individuals. Prior information on breed of origin was not used in the determination of the number of distinct genetic populations or in assigning individuals to populations. The ADMIXTURE software was run with K values from K = 2 to K = 8, and the optimal number of clusters (K value) was determined as that which had the lowest cross-validation error (CV error). Genesis software version 0.2.3 [28] was then used to generate the population admixture results.

2.5. Construction of Phylogenetic Trees and Ancestry Graphs

PGD Spider version 2.0.8.2 [26] was used to convert PLINK-generated MAP and PED files to FASTA format. Tree cluster analysis was performed on the genetic distance matrix using the neighbour-joining algorithm implemented in molecular evolutionary genetics analysis MEGA version 7.0.18 [30].
The maximum likelihood was tested using TreeMix [31] to evaluate historical gene flow within and between studied populations. For the core sample set, the Soay population was used as an outgroup. The number of migration events (m) between populations varied between 1 and 13.

3. Results

3.1. SNP Polymorphism and Within-Breed Genetic Diversity

All of the 54,241 SNPs were considered before marker-based quality filtering. The results from a total of 139 samples were considered suitable for analysis following quality control. Two and three individuals were removed from the Damara and Namaqua Afrikaner populations, respectively, due to poor call rate (<90%). Genotyping call rates were relatively high for all three Nguni ecotypes: 0.939 (Swazi), 0.941 (Pedi), and 0.998 (Zulu). Table 1 indicates the average minor allele frequency (MAF) in all of the populations, which ranged from 0.175 (Pedi) to 0.347 (Damara) and with 0.269 for all of the populations merged. The Pedi (42,078), Zulu (44,306), and Swazi (43,546), all indigenous Nguni sheep types, had higher proportions of polymorphic SNPs compared to the Namaqua Afrikaner (37,473). The markers with minor allele frequencies ≤0.05 were excluded for further analysis. The observed heterozygosity (HO) values (Table 1) in the Nguni types varied between 0.27 and 0.32, compared to a range of 0.26–0.42 in the reference breeds. The Nguni populations marked the higher end of the range for the observed heterozygosity, which differed by 0.10. The reference breeds values at the higher end of expected heterozygosity differed by only 0.02. There was no consistent trend in the Fis values, with values ranging from −0.118 (Pedi) to +0.330 (Swazi), suggesting heterozygote excesses and deficits in the respective populations.

3.2. Analysis of Molecular Variances and Fst

The analysis of molecular variance among all six breeds revealed that a high percentage of genetic variation resided within the populations (86.30%). For the remaining component of overall variation, the genetic variation the between populations within groups (8.08%) was higher than among population (5.62%). The fixation index (Fst) across all the populations was 0.137 (Table 2).
With the AMOVA repeated using the three Nguni sheep populations only, genetic variation accounted for 97.28% within the population, leaving 2.72% as the between-population component. The fixation index (Fst) across all three Nguni populations was 0.027 in this case (Table 3).
The pairwise Fst estimates identified the most related populations as Swazi and Zulu (Fst = 0.044), while the Pedi sheep showed the most differentiation from the other two Nguni populations (Fst = 0.106 in both cases, Table 4). It was observed that both the Swazi and Zulu populations showed less differentiation with Damara than Pedi, at 0.070 and 0.063, respectively. The highest degree of differentiation was observed between Pedi and Namaqua Afrikaner 0.223.

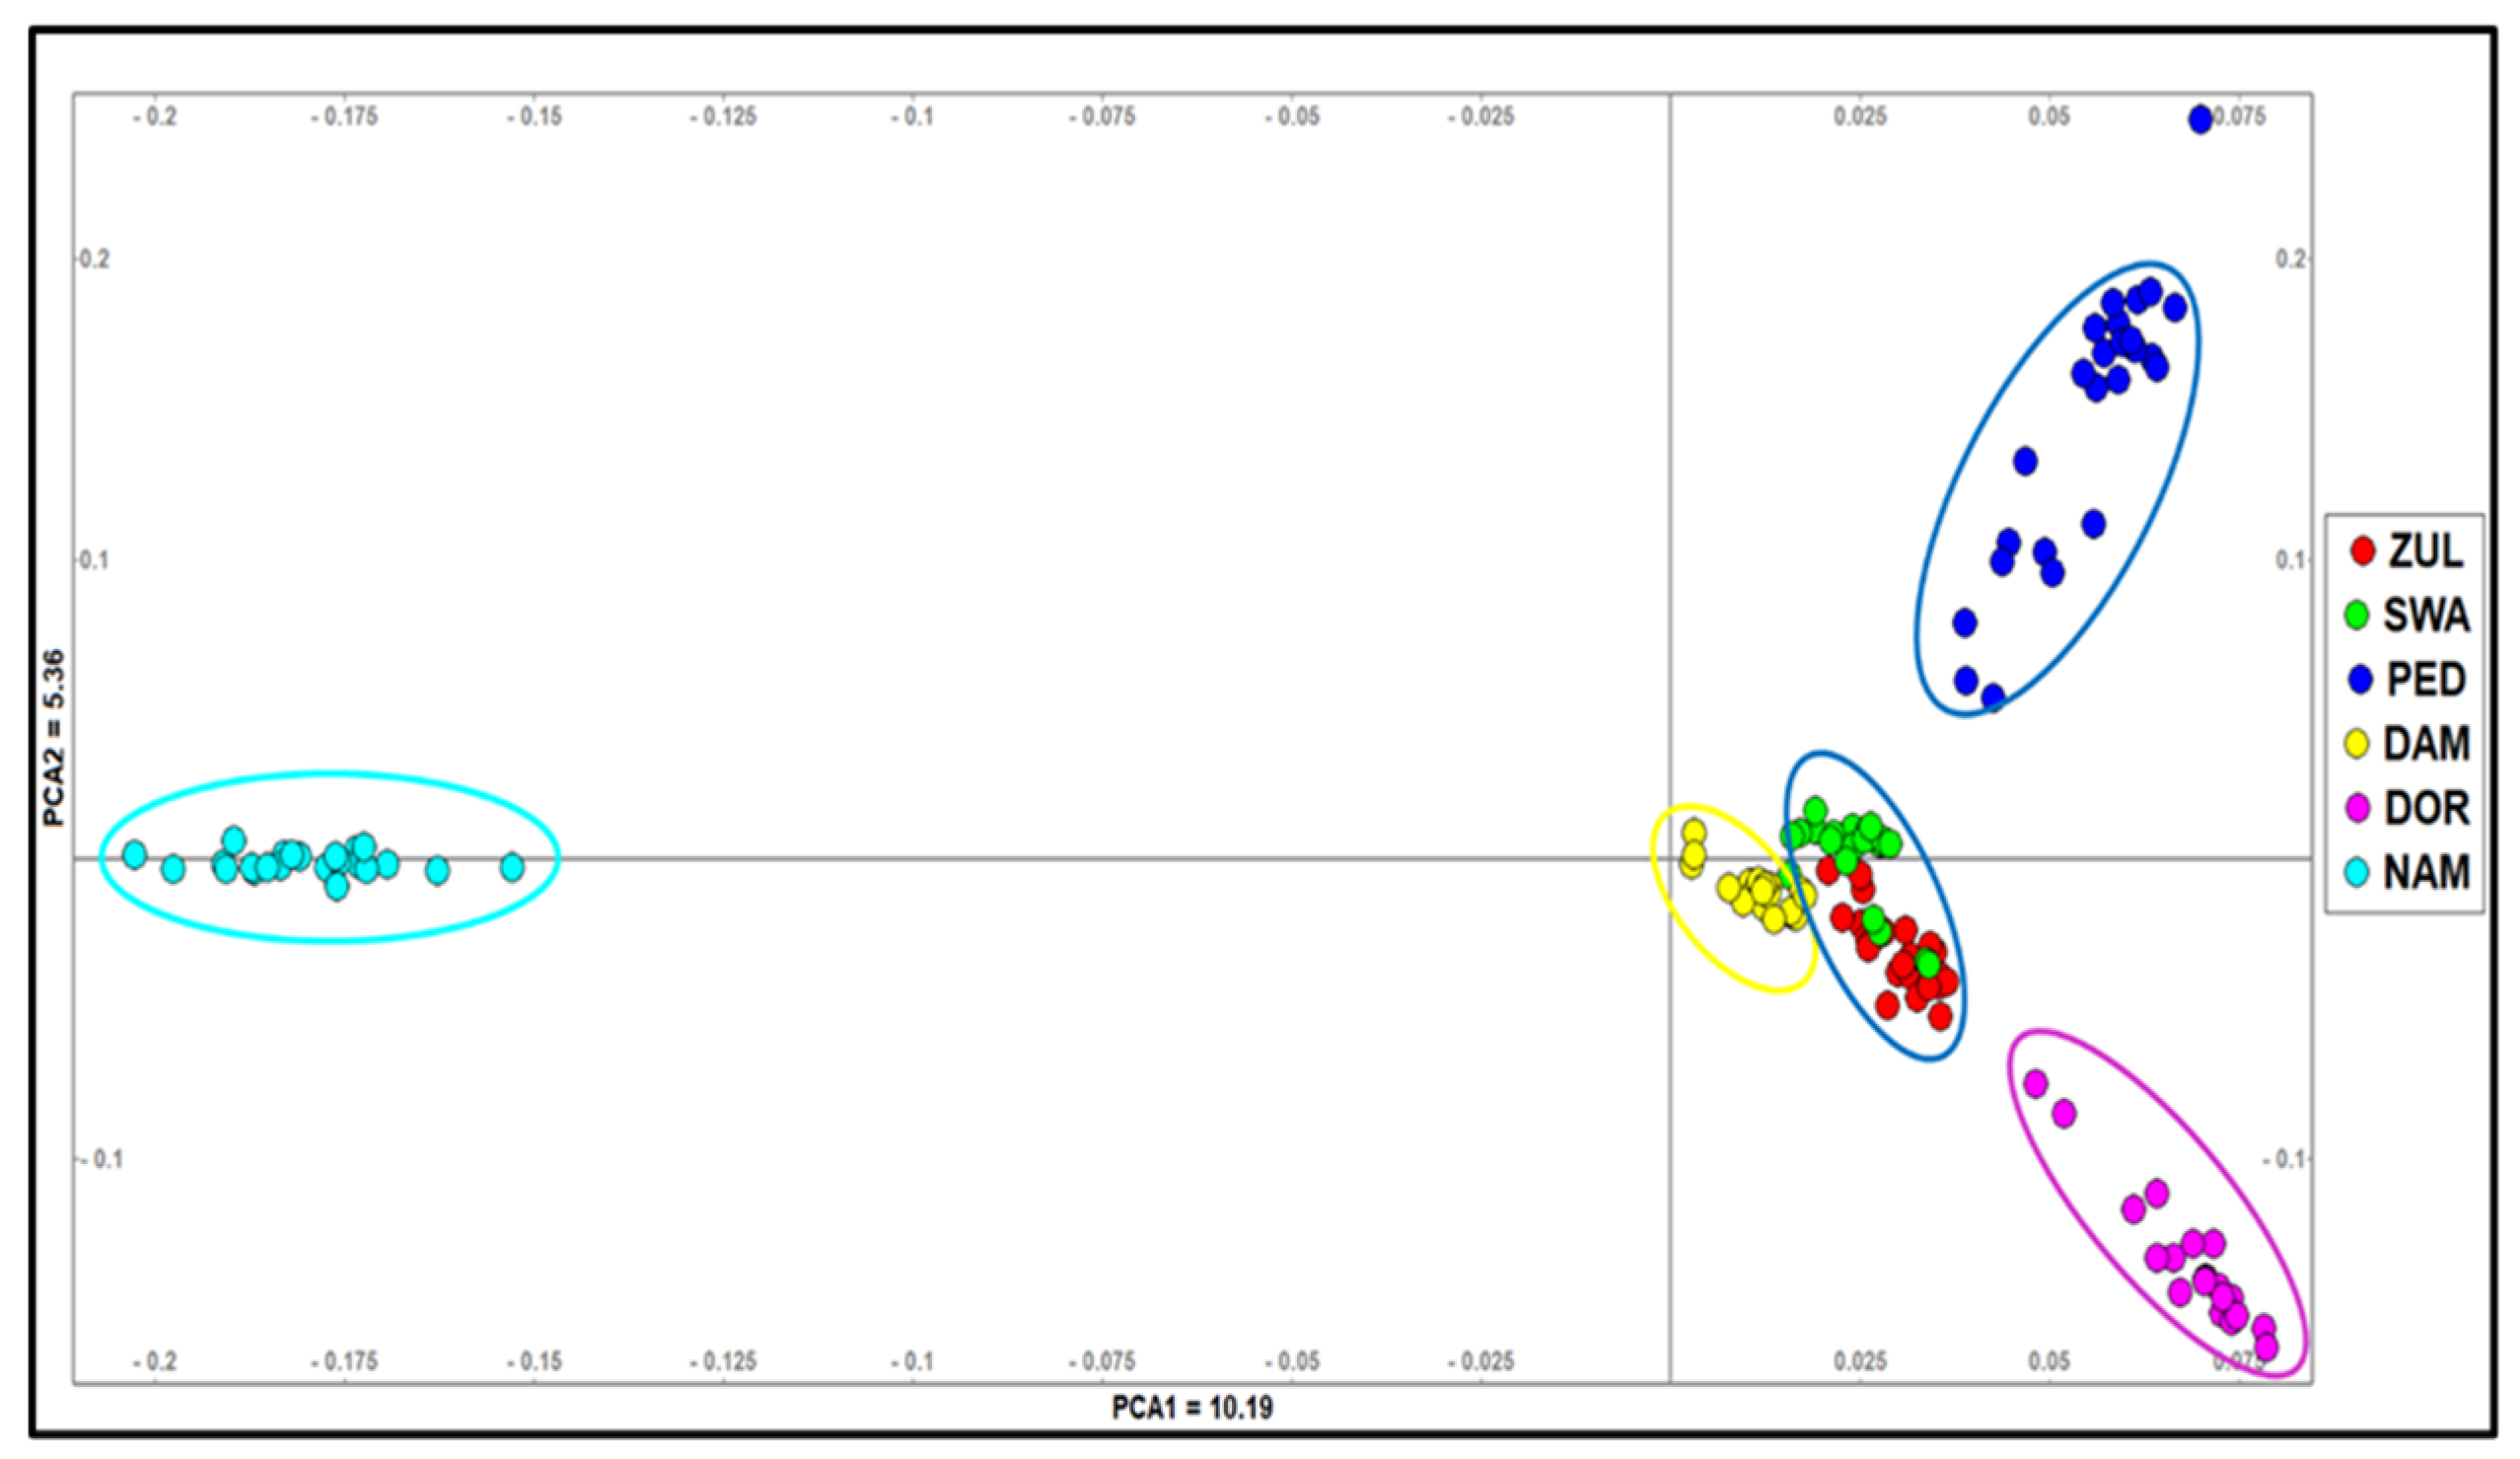
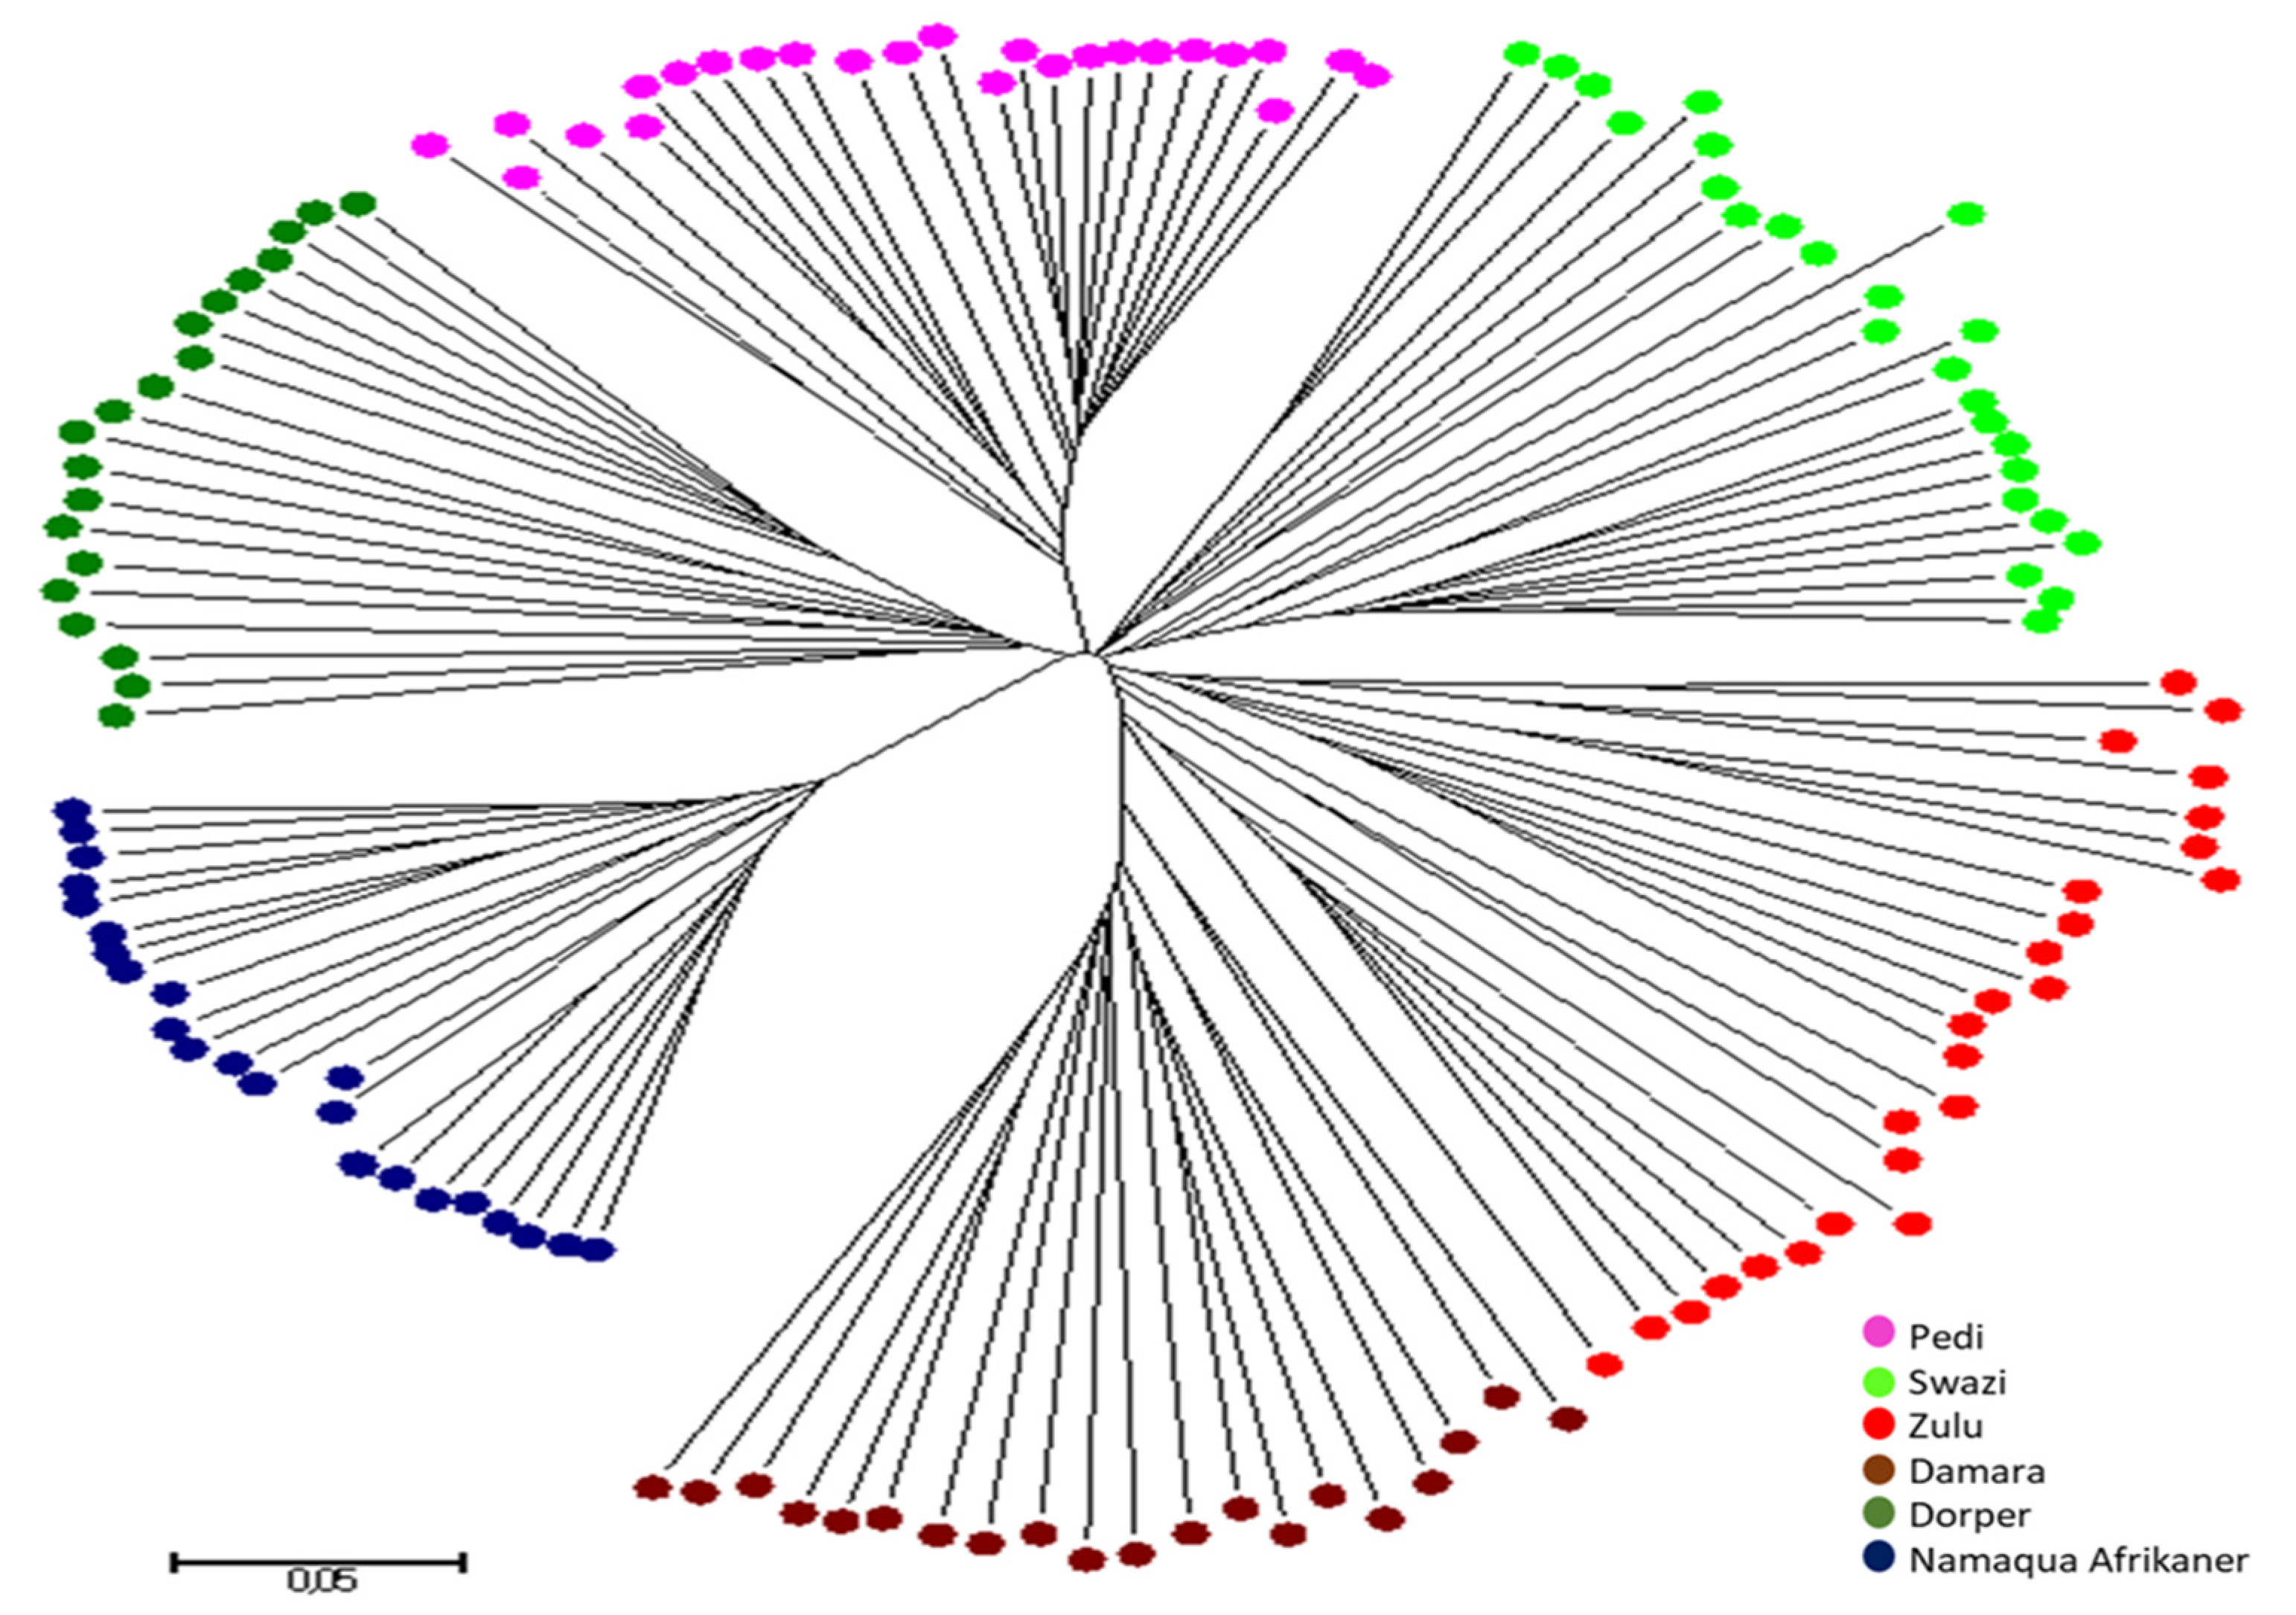
3.3. Population Structure and Relationships

In the population structure analysis, the K value that had the lowest cross-validation error was then estimated as the actual K value. At the value of K = 5, the line graph reached the lowest point of the cross-validation error (Supplementary Figure S1). There were three Nguni sheep ecotype populations studied in the current study, and the other three populations were used as reference.
The results of the ADMIXTURE analysis (Figure 2) showed high levels of genetic admixture between the Zulu, Swazi, Damara, and Dorper breeds. However, the Pedi sheep formed its own distinct cluster, also separated from the other two Nguni sheep populations. Some Pedi individuals showed little admixture, including a little influence from this population of the Doper breed, indicating more purity in this type compared to the other Nguni sheep populations, as is also evident from the TreeMix analysis. The Zulu and Swazi sheep populations formed one highly admixed cluster; hence, the optimal K value was observed at K = 5. However, the results suggest that a lack of gene flow between the Zulu and Swazi populations or different management regimes may account for the genetic subdivision shown by the population structure analysis.
The principal component analysis (Figure 3) confirmed the clusters between populations observed using the admixture analysis. The results from PCA thus confirmed the clustering of the Zulu, Swazi, and Damara populations, with the Pedi sheep distinct from the other Nguni populations.
The results obtained from the UPGMA tree (Figure 4) revealed one clade shared by the Swazi, Zulu, and Damara sheep populations. The Pedi sheep population branched separately from other Nguni sheep populations, as observed using other methods.

4. Discussion

The successful use of SNP markers for genetic characterisation has been observed in several recent studies [32,33,34,35], and the use of these markers was also found to be feasible for the genetic assessment of South African Nguni sheep populations in the current study. This was demonstrated by the high number of polymorphic loci that remained for further analysis after quality control and the new data generated to describe genetic diversity within and between populations.
Among the Nguni breed, the Swazi and Zulu ecotypes showed relatively high HE values of 0.380 and 0.320, respectively. The Zulu population also showed the highest number of polymorphic loci amongst the Nguni populations. In contrast, the Pedi population demonstrated the lowest level of genetic diversity at HE = 0.251 (comparable to the Namaqua Afrikaner breed) and had the lowest number of polymorphic loci that remained for further analysis after QC. The low levels of diversity in the Pedi type reported here are comparable with the results reported by Hlophe [36] and can possibly be attributed to selective breeding. A breeders’ club for Pedi sheep was established in 1998, and this has been functioning as the Bapedi Sheep Breeders Society since 2006 [37] before its recognition as a breeders’ society. These values patent a history of prolonged isolation for the Pedi type, with a recent management from a different population that has caused the recorded increase in Ho.
The comparatively high level of genetic diversity observed in the Zulu type most likely reflects the large number of extant flocks, spread over various areas of different ecological regions in KwaZulu-Natal [1,2]. An inbreeding coefficient close to zero suggests a lack of negative breeding practices in the breed. In the case of the Swazi type, the level of diversity was at the higher end of the range reported here for the Nguni type, but a comparatively high inbreeding coefficient of 0.330 was observed, suggesting a degree of inbreeding in individual flocks. A lack of breeding rams could play a major role in explaining the finding of these positive values [14], which showed more than 30 percent inbreeding. Hence, proper breeding strategies need to be implemented, preferably under the oversight of a breeding society. This should be based on ram exchange among the breeders to ensure gene flow among fragmented populations.
Of the reference populations, the Namaqua Afrikaner displayed the least diversity. This breed has been reported to be at risk of extinction; thus, their population sizes are very limited [8], and this can account for the low diversity observed.
The results were analysed for three Nguni sheep ecotypes, namely, Swazi, Pedi, and Zulu. Individuals from three more breeds (Damara, Dorper, and Namaqua Afrikaner) were also included as reference populations for genetic diversity. The results from the all measures used, including Fst, admixture, PCA, and the UPGMA tree, provided a similar outcome: the Swazi and Zulu ecotypes are very similar, whereas the Pedi is distant from the other Nguni ecotypes. The Swazi and Zulu ecotypes show clear signs of mixing with other breeds. Crossbreeding poses a threat to the genetic integrity of the Zulu and Swazi ecotypes as both types were highly admixed with Damara sheep and the analysis indicated a possible contribution directed from these two to Damara, indicating genetic fusion across these populations. These population clusters observed agree with results reported by other authors, including Buduram [38], Hlophe [36], Gwala et al., [2] and Selepe et al. [1]. The Zulu and Swazi populations were treated as different types since they arrived in their respective regions (Swaziland and Zululand) in early 200–400AD [1]. However, these types both came from the same migration route into the respective locations where they are currently found [39]. Furthermore, there is no evidence to suggest any historical geographic barriers between the two subpopulations. This may have facilitated gene flow, resulting in low genetic differentiation between the populations, as also reported for Moroccan sheep raised in close geographical proximity [40]. From an ecological perspective, animals potentially respond similarly to environmental challenges caused by similar environmental conditions and disease vectors [36]. Hence, close genetic distance between Zulu and Swazi ecotypes could be driven by the close geographical proximity as well as similar environmental conditions in the areas where these two populations occur. Different management regimes may account for the genetic subdivision shown by the population admixture analysis of the Zulu and Swazi populations. However, the occurrence within Swazi of two groups of individuals with different genomic backgrounds is already visible at K = 4. Since this substructure may mirror a lack of gene flow due to management practices, it is important to consider this for conservation programmes. Furthermore, both the Zulu and Swazi populations show high levels of admixture with Damara, as also reported by Kunene et al. [9], who described the use of the Dorper and Damara breeds in crossbreeding with the Nguni sheep.
The uniqueness of the Pedi sheep ecotype can be partially explained by its early history: separation between the latter type and Zulu or Swazi occurred during the migration period whereby the Bapedi people (whereby the Pedi ecotype is derived) migrated to northern parts of the country (Limpopo). The TreeMix analysis (Figure S1) suggested gene flow possibilities between the South African sheep populations, while the Damara was intermediate between these populations. Drift was higher between the Swazi ecotype and Namaqua than between any other populations. Strong migration weight was observed among the Nguni ecotypes. In addition, the Pedi ecotype was less admixed with commercial sheep compared to other breeds across the studied Nguni ecotypes, contributing to genetic characteristics distinct from the Zulu and Swazi ecotypes.

5. Conclusions

This study showed that SNP markers can be successfully used to assess genetic variation amongst South African Nguni sheep ecotypes. The results obtained from the analysis of populations revealed little variation between the Zulu and Swazi Nguni sheep ecotypes, while also indicating differentiation between these two ecotypes and the Pedi sheep ecotype. Thus, the former two ecotypes can instead be regarded as one Nguni sheep ecotype. However, the subdivision within the Swazi ecotype, despite its close relationship with the Zulu ecotype, suggests a lot of uncontrolled breeding and the influx of exotic genetic material. Future investigations within this population considering the general management and farming system will provide a conclusion regarding the currently observed subdivisions. The establishment of a conservation nucleus for Nguni breed ecotypes is recommended to prevent the loss of these valuable genetic resources, and conservation flocks may be established whereby the populations will be separated from the Damara. Further investigation is also recommended for the validation of the current work and to expand the database on Nguni sheep genetics. Future analysis of the Zulu ecotype should include population from the Makhathini and Zululand Research Stations in South Africa. Finally, it is recommended that a development programme for Nguni sheep be considered, with a commercial incentive for application in smallholder farming, to increase their numbers in South Africa.

Supplementary Materials

The following supporting information can be downloaded at: https://www.mdpi.com/article/10.3390/agriculture12050663/s1, Figure S1: Tree Mix plot showing a phylogenetic network of relationship among populations as a diverging maximum-likelihood tree.

Author Contributions

Conceptualization, N.O.M., P.G., and K.E.; methodology, N.O.M. and P.G.; formal analysis, K.S.N.; investigation, K.S.N., P.G., and K.E.; resources, N.O.M.; data curation, K.S.N.; writing—original draft preparation, K.S.N. writing—review and editing, N.O.M., P.G., K.E., and L.T.N.; supervision, N.O.M., P.G., and K.E.; funding acquisition, N.O.M. All authors have read and agreed to the published version of the manuscript.

Funding

This research was funded by the South African Department of Agriculture, Land Reform and Rural Development and the Council for Scientific and Industrial Research-Southern African Science Service Centre for Climate Change and Adaptive Land Management (TASK 229).

Institutional Review Board Statement

Ethical approval for this study was obtained from the University of the Free State (UFS-AED2017/0003-14 February 2017) and the Agricultural Research Council (APIEC16/031) Animal Ethics Committees (AECs), 10 October 2016.

Informed Consent Statement

Not applicable.

Data Availability Statement

Not applicable.

Acknowledgments

The Ministry of Agriculture’s Director of Veterinary and Livestock Services in Swaziland for availing their animals for this study. Special acknowledgement is given to Gerrit van de Pypekamp and Bongani Magagula for providing Zulu and Swazi samples respectively. The Agricultural Research Council Research Council–Animal Production (ARC-AP) and Biotechnology Platform (BTP) laboratories were used to process the samples.

Conflicts of Interest

The authors declare no conflict of interest.

References

  1. Selepe, M.M.; Ceccobelli, S.; Lasagna, E.; Kunene, N.W. Genetic structure of South African Nguni (Zulu) sheep populations reveals admixture with exotic breeds. PLoS ONE 2018, 13, e0196276. [Google Scholar] [CrossRef] [PubMed] [Green Version]
  2. Gwala, P.E.; Kunene, N.W.; Bezuidenhout, C.C.; Mavule, B.S. Genetic and phenotypic variation among four Nguni sheep breeds using random amplified polymorphic DNA (RAPD) and morphological features. Trop. Anim. Health Prod. 2015, 47, 1313–1319. [Google Scholar] [CrossRef] [PubMed]
  3. Cumbula, D.; Taela, M. Animal genetic resources (AnGR) in Mozambique. In IOP Conference Series: Earth and Environmental Science; IOP Publishing: Bristol, UK, 2020. [Google Scholar]
  4. Peters, F.; Kotze, A.; van der Bank, F.; Soma, P.; Grobler, J. Genetic profile of the locally developed Meatmaster sheep breed in South Africa based on microsatellite analysis. Small Rumin. Res. 2010, 90, 101–108. [Google Scholar] [CrossRef]
  5. Ramey, H.R.; Decker, J.E.; McKay, S.D.; Rolf, M.M.; Schnabel, R.D.; Taylor, J.F. Detection of selective sweeps in cattle using genome-wide SNP data. BMC Genom. 2013, 14, 382. [Google Scholar] [CrossRef] [PubMed] [Green Version]
  6. Kunene, N.; Bezuidenhout, C.; Nsahlai, I. Genetic and phenotypic diversity in Zulu sheep populations: Implications for exploitation and conservation. Small Rumin. Res. 2009, 84, 100–107. [Google Scholar] [CrossRef]
  7. Mwai, O.; Hanotte, O.; Kwon, Y.-J.; Cho, S. African Indigenous Cattle: Unique Genetic Resources in a Rapidly Changing World. Asian-Australas. J. Anim. Sci. 2015, 28, 911–921. [Google Scholar] [CrossRef] [Green Version]
  8. Qwabe, S.O.; van Marle-Köster, E.; Visser, C. Genetic diversity and population structure of the endangered Namaqua Afrikaner sheep. Trop. Anim. Health Prod. 2012, 45, 511–516. [Google Scholar] [CrossRef] [Green Version]
  9. Kunene, N.W.; Ceccobelli, S.; Di Lorenzo, P.; Hlophe, S.R.; Bezuidenhout, C.C.; Lasagna, E. Genetic Diversity in Four Populations of Nguni (Zulu) Sheep Assessed by Microsatellite Analysis. Ital. J. Anim. Sci. 2014, 13, 3083. [Google Scholar] [CrossRef]
  10. Steyn, G.J.; Tapson, D.R. Farming systems research and extension (FSR/E) approach to livestock development in parts of sub-Saharan Africa. Dev. S. Afr. 1993, 10, 411–419. [Google Scholar] [CrossRef]
  11. Senda, T.S.; Robinson, L.W.; Gachene, C.K.; Kironchi, G. Formalization of communal land tenure and expectations for pastoralist livelihoods. Land Use Policy 2021, 114, 105961. [Google Scholar] [CrossRef]
  12. Legesse, G.; Abebe, G.; Siegmund-Schultze, M.; Zárate, A.V. Small Ruminant Production in Two Mixed-Farming Systems of Southern Ethiopia: Status and Prospects for Improvement. Exp. Agric. 2008, 44, 399–412. [Google Scholar] [CrossRef]
  13. Nyamushamba, G.B.; Mapiye, C.; Tada, O.; Halimani, T.E.; Muchenje, V. Conservation of indigenous cattle genetic resources in Southern Africa’s smallholder areas: Turning threats into opportunities—A review. Asian-Australas. J. Anim. Sci. 2016, 30, 603–621. [Google Scholar] [CrossRef] [PubMed]
  14. Mavule, B.S.; Sarti, F.M.; Lasagna, E.; Kunene, N.W. Morphological differentiation amongst Zulu sheep populations in KwaZulu-Natal, South Africa, as revealed by multivariate analysis. Small Rumin. Res. 2016, 140, 50–56. [Google Scholar] [CrossRef] [Green Version]
  15. Sheriff, O.; Alemayehu, K. Genetic diversity studies using microsatellite markers and their contribution in supporting sustainable sheep breeding programs: A review. Cogent Food Agric. 2018, 4, 1459062. [Google Scholar] [CrossRef]
  16. Gama, L.; Bressan, M. Biotechnology applications for the sustainable management of goat genetic resources. Small Rumin. Res. 2011, 98, 133–146. [Google Scholar] [CrossRef]
  17. Shirasawa, K.; Ishii, K.; Kim, C.; Ban, T.; Suzuki, M.; Ito, T.; Muranaka, T.; Kobayashi, M.; Nagata, N.; Isobe, S.; et al. Development of Capsicum EST–SSR markers for species identification and in silico mapping onto the tomato genome sequence. Mol. Breed. 2012, 31, 101–110. [Google Scholar] [CrossRef] [Green Version]
  18. Edea, Z.; Dadi, H.; Kim, S.-W.; Dessie, T.; Lee, T.; Kim, H.; Kim, J.-J.; Kim, K.-S. Genetic diversity, population structure and relationships in indigenous cattle populations of Ethiopia and Korean Hanwoo breeds using SNP markers. Front. Genet. 2013, 4, 35. [Google Scholar] [CrossRef] [Green Version]
  19. Decker, J.E.; McKay, S.D.; Rolf, M.M.; Kim, J.; Alcalá, A.M.; Sonstegard, T.S.; Hanotte, O.; Götherström, A.; Seabury, C.M.; Praharani, L.; et al. Worldwide Patterns of Ancestry, Divergence, and Admixture in Domesticated Cattle. PLoS Genet. 2014, 10, e1004254. [Google Scholar] [CrossRef] [Green Version]
  20. Rezvannejad, E.; Nanaei, H.A.; Esmailizadeh, A. Detection of candidate genes affecting milk production traits in sheep using whole-genome sequencing analysis. Veter Med. Sci. 2022, 8, 1–8. [Google Scholar] [CrossRef]
  21. Illumina, I. Infinium® HD Assay: Ultra Protocol Guide; © Illumina, Inc.: San Diego, CA, USA, 2009. [Google Scholar]
  22. Purcell, S.; Neale, B.; Todd-Brown, K.; Thomas, L.; Ferreira, M.A.R.; Bender, D.; Maller, J.; Sklar, P.; de Bakker, P.I.W.; Daly, M.J.; et al. PLINK: A Tool Set for Whole-Genome Association and Population-Based Linkage Analyses. Am. J. Hum. Genet. 2007, 81, 559–575. [Google Scholar] [CrossRef] [Green Version]
  23. Manel, S.; Gaggiotti, O.; Waples, R.S. Assignment methods: Matching biological questions with appropriate techniques. Trends Ecol. Evol. 2005, 20, 136–142. [Google Scholar] [CrossRef] [PubMed] [Green Version]
  24. Caballero, A.; Toro, M.A. Analysis of genetic diversity for the management of conserved subdivided populations. Conserv. Genet. 2002, 3, 289–299. [Google Scholar] [CrossRef]
  25. Excoffier, L.; Laval, G.; Schneider, S. Arlequin (version 3.0): An integrated software package for population genetics data analysis. Evol. Bioinform. 2005, 1, 47–50. [Google Scholar] [CrossRef] [Green Version]
  26. Lischer, H.E.L.; Excoffier, L. PGDSpider: An automated data conversion tool for connecting population genetics and genomics programs. Bioinformatics 2011, 28, 298–299. [Google Scholar] [CrossRef] [Green Version]
  27. Shlens, J. A tutorial on principal component analysis. arXiv 2014, arXiv:1404.1100. [Google Scholar]
  28. Buchmann, R.; Hazelhurst, S. Genesis Manual [Internet]; University of Witwatersrand: Johannesburg, South Africa, 2014. [Google Scholar]
  29. Alexander, D.H.; Novembre, J.; Lange, K. Fast model-based estimation of ancestry in unrelated individuals. Genome Res. 2009, 19, 1655–1664. [Google Scholar] [CrossRef] [Green Version]
  30. Kumar, S.; Stecher, G.; Tamura, K. MEGA7: Molecular evolutionary genetics analysis version 7.0 for bigger datasets. Mol. Biol. Evol. 2016, 33, 1870–1874. [Google Scholar] [CrossRef] [Green Version]
  31. Pickrell, J.K.; Pritchard, J.K. User Manual for TreeMix v1. 2012. Available online: http://docplayer.net/31797577-User-manual-for-treemix-v1-0-joseph-k-pickrell-jonathan-k-pritchard.html (accessed on 12 March 2020).
  32. Abdelkader, A.A.; Ata, N.; Benyoucef, M.T.; Djaout, A.; Azzi, N.; Yilmaz, O.; Cemal, I.; Gaouar, S.B.S. New genetic identification and characterisation of 12 Algerian sheep breeds by microsatellite markers. Ital. J. Anim. Sci. 2017, 17, 38–48. [Google Scholar] [CrossRef]
  33. Liu, S.; He, S.; Chen, L.; Li, W.; Di, J.; Liu, M. Estimates of linkage disequilibrium and effective population sizes in Chinese Merino (Xinjiang type) sheep by genome-wide SNPs. Genes Genom. 2017, 39, 733–745. [Google Scholar] [CrossRef] [Green Version]
  34. Tosser-Klopp, G.; Bardou, P.; Bouchez, O.; Cabau, C.; Crooijmans, R.; Dong, Y.; Donnadieu-Tonon, C.; Eggen, A.; Heuven, H.C.M.; Jamli, S.; et al. Design and Characterization of a 52K SNP Chip for Goats. PLoS ONE 2014, 9, e86227. [Google Scholar] [CrossRef]
  35. Deniskova, T.E.; Okhlopkov, I.M.; Sermyagin, A.A.; Gladyr, E.; Bagirov, V.A.; Sölkner, J.; Mamaev, N.V.; Brem, G.; Zinov’Eva, N.A. Whole genome SNP scanning of snow sheep (Ovis nivicola). Dokl. Biochem. Biophys. 2016, 469, 288–293. [Google Scholar] [CrossRef] [PubMed]
  36. Hlophe, S.R. Genetic variation between and within six selected South African sheep breeds using random amplified polymorphic DNA and protein markers. Unizulu Inst. Repos. 2011. Available online: http://hdl.handle.net/10530/611 (accessed on 18 September 2021).
  37. Hoffmann, I.; Scherf, B. Animal genetic resources-time to worry. Livest. Rep. 2006, 2006, 57–74. [Google Scholar]
  38. Buduram, P. Genetic Characterization of Southern African Sheep Breeds Using DNA Markers. Doctoral Dissertation, University of the Free State, Bloemfontein, South Africa, 2004. [Google Scholar]
  39. Oosthuizen, P.A. Distribution, Phenotype and Factors Influencing the Production Potential of Nguni Sheep. Doctoral Dissertation, University of KwaZulu-Natal, Durban, South Africa, 2018. [Google Scholar]
  40. Gaouar, S.B.S.; Kdidi, S.; Ouragh, L. Estimating population structure and genetic diversity of five Moroccan sheep breeds by microsatellite markers. Small Rumin. Res. 2016, 144, 23–27. [Google Scholar] [CrossRef]
Figure 1. Map of South Africa indicating the sites of animals sampled from different geographical locations.
Agriculture 12 00663 g001
Figure 2. Population admixture representing six sheep populations (K = 5 had the lowest cross-validation error). Zul, Zulu sheep; SWA, Swazi sheep; PED, Pedi sheep; DAM, Damara; DOR, Dorper; NAM, Namaqua Afrikaner.
Agriculture 12 00663 g002
Figure 3. A principal component analysis representing the genetic similarities among breeds. Zul, Zulu sheep; SWA, Swazi sheep; PED, Pedi sheep; DAM, Damara; DOR, Dorper; NAM, Namaqua Afrikaner.
Agriculture 12 00663 g003
Figure 4. UPGMA tree (population clades) representing the genetic relationships among breeds. Zul, Zulu sheep; SWA, Swazi sheep; PED, Pedi sheep; DAM, Damara; DOR, Dorper; NAM, Namaqua Afrikaner.
Agriculture 12 00663 g004
Table 1. Measures of genetic diversity among populations studied.
Polymorphic Loci
(MAF > 0.05)
Ho (SD)He (SD)MAF (SD)Fisp-Value
Pedi42,0780.28 (0.22)0.25 (0.18)0.18 (0.16)−0.1040.988
Swazi43,5460.27 (0.16)0.38 (0.19)0.20 (0.16)0.0030.460
Zulu44,3060.32 (1.77)0.32 (1.60)0.24 (0.15)0.0280.237
Damara44,7090.42 (0.18)0.40 (0.14)0.35 (0.16)0.0170.343
Dorper45,9390.32 (0.17)0.33 (0.16)0.25 (0.15)0.0420.171
Namaqua Afrikaner37,4730.26 (0.21)0.25 (0.19)0.18 (0.16)−0.0170.591
Merged48,4290.32 (0.16)0.33 (0.17)0.27 (0.15)
Abbreviations used: Ho, observed heterozygosity; He, expected heterozygosities; MAF, minor allele frequencies; F, inbreeding coefficient; SD, standard deviation.
Table 2. Analysis of molecular variance among all six sheep populations in the study.
Source of
Variation
Sum of
Squares
Variance
Components
Percentage of
Variation
Among208,055.192489.845.62
groups
Among
populations84,735.08704.858.08
within
groups
Within populations2,080,828.927528.5686.30
Total2,373,6198723.26
Fixation index Fst = 0.137.
Table 3. Analysis of molecular variance among three Nguni populations.
Source of Variationd.f.Sum SquaresVariance of
Components
Percentage of Variation
Among populations248,837.13284.642.72
Within populations1471,497,42810,186.5897.28
Total1491,546,26510,471.22
Fixation index Fst = 0.027.
Table 4. Genetic differentiation among pairs of sheep populations, with Fst values below the diagonal.
PopulationPedSwaZulDamDorNam
Ped***
Swa0.11***
Zul0.110.04***
Dam0.130.070.06***
Dor0.160.110.080.12***
Nam0.220.160.150.170.19***
Zul, Zulu sheep; SWA, Swazi sheep; PED, Pedi sheep; DAM, Damara; DOR, Dorper; NAM, Namaqua Afrikaner; ***,0.
Publisher’s Note: MDPI stays neutral with regard to jurisdictional claims in published maps and institutional affiliations.

