Article

Forever Young? Late Shoot Pruning Affects Phenological Development, Physiology, Yield and Wine Quality of Vitis vinifera cv. Malbec

1
Chemical Engineering Department, Ariel University, Ariel 40700, Israel
2
Eastern Regional R&D Center, Ariel 40700, Israel
3
The Robert H. Smith Institute of Plant Sciences and Genetics in Agriculture, The Robert H. Smith Faculty of Agriculture, Food & Environment, The Hebrew University of Jerusalem, Rehovot 76100, Israel
4
Carmel Winery, Soham 608500, Israel
5
Jacob Blaustein Insts. for Desert Research, French Associates Institute for Agriculture & Biotechnology of Drylands, Ben-Gurion University of the Negev, Sde Boker Campus, Midreshet Ben-Gurion 84990, Israel
6
Independent Researcher, Variability, Ashalim 85512, Israel
*
Author to whom correspondence should be addressed.
Agriculture 2022, 12(5), 605; https://doi.org/10.3390/agriculture12050605
Submission received: 15 March 2022 / Revised: 19 April 2022 / Accepted: 20 April 2022 / Published: 25 April 2022
(This article belongs to the Special Issue Sustainable Management of Grape Production and Vineyards)

Abstract

:
‘Malbec’ grapevines commonly have high yield, thus intermittently negatively affecting wine quality parameters. Here, we describe the use of late shoot pruning (LSP) practice applied for wine quality improvement. We examined the effect of timing of LSP on ‘Malbec’ vines grown in Mediterranean conditions during three consecutive seasons (2016–2018) in Israel. The timing of LSP treatment applications (applied one, two and three weeks after bud break) were compared with cluster-thinned, winter-pruned vines (WP + T) and standard winter pruning (WP). The LSP practice postponed bud break of target buds but did not have a temporal effect on the onset of veraison. Midday stem water potential was less negative and stomatal conductance and net CO2 assimilation rate were higher in the LSP vines. This practice led to a substantial reduction in the number of clusters and crop yield. Finally, wine quality was positively affected by applying LSP treatment. Performing the inexpensive LSP treatment at the precise timing after bud burst was found to save labor, decrease crop yield and improve grape and wine parameters. LSP application should be considered in adequate varieties as a significant tool for the enhanced effectiveness of vine growing in warm regions.

1. Introduction

Cultivating vines for winemaking is a great challenge, especially in warm climatic regions. The climate in the eastern Mediterranean region is characterized by dry summers accompanied by heatwaves, no summer rains and mild, wet winters. Most of the grapevine growing regions in Israel are defined by the Winkler index as zone five, with a minority of higher elevation regions, which are defined as zone four [1]. The combination of low precipitation rates, high average temperatures and multiple heat waves throughout the growing season results in enhanced periods of plant heat and drought stress.
One of the limitations of grapevine cultivation in warm Mediterranean regions is the slow ripening of high-yielding vineyards. Due to heavy yields, the sugar accumulation rate is slow, while at the same time respiration rates are high due to the high temperatures. This leads to a decrease in the levels of tartaric and malic acid at harvest, which elevates must pH, possibly impacting wine quality [2,3]. In some cultivars, elevated temperatures may also lead to berry shriveling and pronounced, undesirable yield reduction [4].
During the past decades, multiple studies illustrated the effects of the global warming trend on grapevine cultivation. One manifestation of this trend is the observed changes in the vines’ phenology in diverse regions used for grape growing [5] as changes in phenology are directly associated with the rise in air temperature [6,7,8]. In European vineyards, one of the problems caused by higher temperature levels is the decoupling of the sugar–acid ratio, leading to a flat wine flavor, low microbial stability and inferior wine color [2].
Although climate-related effects differ among countries and vineyard regions, it is clear that in most cultivated vineyards there is a need to respond to the increase in ambient temperatures, which will intensify in the near future. There are several ways of approaching the changes in climatic conditions: (1) Attempting to postpone vine phenology so that at least the last phase of sugar and phenolic ripening occurs during cooler conditions after the summer peak temperatures [9,10]. (2) Decreasing crop levels by cluster thinning so that the assimilating leaf area can provide the carbohydrates to a smaller number of clusters. In a broader context, it can be stated that changes in the crop–canopy ratio (crop load) may affect the sugar accumulation and the rate of acid reduction in fruit [11,12,13,14]. (3) Inducing changes to the photosynthetic performance of the vine’s canopy. These changes can be induced by improving vine water status via irrigation [7,15,16] or by grafting on specific rootstocks [17,18], though excessive improvement of the vine water status will be detrimental to the quality of the must and wine [19]. An alternative is the selection of enhanced performance varieties via traditional hybrids [20,21] or genetic engineering [22], but such changes are not trivial in the conservative wine industry. Yet another option is to perform agro-technical practice that may rejuvenate the foliage and improve photosynthetic performance.
As previously mentioned, one of the common practices used to overcome adverse climatic conditions and improve wine quality is cluster thinning [13,23,24], which is a manual agro-technical practice intended to improve quality but with significant increases in the costs of standard grape cultivation. The positive effects of cluster thinning on the quality of berries are derived from an increase in sugar accumulation, berry mass and skin anthocyanin [25,26]. Cluster thinning can up-regulate the expression of genes related to anthocyanin biosynthesis [27], thus creating wines with increased quality and health potential benefits. Crop load adjustment is widely accepted as an important vineyard management tool for premium red wine production [28]. However, little information is available on its effectiveness under warm and dry climatic conditions. Although it is clear that considerably high yields delay ripening and reduce grape and wine quality [29], evidence for a strict yield–quality relationship is limited, inconsistent and mostly based on data collected in temperate climate regions [30] or from vineyards bearing very high yields [31,32].
Pruning is a viticulture technique carried out in a routine manner during the winter or early spring. Its main purpose is to maintain the structure of the vine and to control the yield by the number of buds left on the spurs or canes [1]. The pruning method has a direct effect on the vegetative development and productivity of the vine [33,34]. The retained number of buds and spurs or canes does not allow an accurate assessment of the number of clusters that will develop on the vine, but, in general, severe pruning will allow for fewer buds to mature, which will lead to a decreased number of clusters. Pruning also serves as a bud break catalyzer, provided that the buds have evolved from the endodormancy to the ecodormancy phase [35]. Late shoot pruning (also referred to as delayed winter pruning) is a pruning technique practiced in the spring, after the natural bud break occurs. The purpose of applying such a technique differs according to the growing region. In temperate regions, late pruning delays bud break of the cluster-bearing buds, thus reducing the susceptibility of the young shoots to spring frost [36,37]. However, contrasting results of late shoot pruning were reported regarding the effect of the treatment on yield. Late shoot pruning decreased the yield of cv. Sangiovese in Italy [38] and in cv. Syrah in Australia [39], while significantly increasing the yield of cv. Merlot in New Zealand [40]. These contrasting findings suggest an interaction between the variety, the environmental conditions and/or the timing of application.
In this current work, we hypothesized that restarting the phenological cycle by practicing late shoot pruning (LSP) would result in the postponement of grape maturation, meaning the final stages of phenolic maturation would commence at more favorable meteorological conditions (autumn), along with a decrease in total yields, which can together result in higher wine quality. To test our hypothesis, we conducted a comprehensive field experiment on Vitis vinifera cv. Malbec in a warm Mediterranean area while examining the effects of different timings of late shoot pruning on the phenology, physiology, vegetation, crop yields, fruit composition and wine quality. To the best of our knowledge, no comprehensive research has so far been conducted to examine the effects of LSP on the final quality of the wine.

2. Materials and Methods

2.1. Experimental Site, Plant Material and Meteorological Conditions

The study was conducted in a 6-year-old vineyard located at Ayalon Valley, Israel, during the growing seasons of 2016–2018. The experimental plot was part of a large commercial vineyard (100 ha) located in the Judean Plain (31°86′ N; 35°01′ E), 186 m above sea level. Row orientation was east/west, with a slight tendency to the south, and vine and row spacing were 1.5 and 3 m, respectively (4.5 m2 per vine). The plant material included Vitis vinifera L. cv. Malbec grafted on 110 Richter rootstock and trained onto a two-wire vertical shoot positioning trellis. Pest management, irrigation and fertilization of the vineyard were applied according to the standard local agricultural practice.
This region is characterized by a semi-arid climate with predominantly winter rainfall. Maximal average temperature is 25 °C during March-April and 35 °C during August. Maximal values of reference evapotranspiration (Penman–Monteith) reach 6 mm day−1. Average precipitation ranges between 298 and 437 mm, 98% of which occurs during the winter (from October until the end of March).

2.2. Experimental Design

The experimental layout was a randomized complete block design with five treatments replicated four times [41], where each block consisted of three rows (one data row and two border rows). Each replicate comprised 15 vines with the outer two vines on each end being buffer vines and the inner 11 vines selected for measurement (a total of 220 measurement vines, i.e., 11 vines × 5 treatments × 4 replicates). All measurement vines were measured for yield parameters and pruning weights and were evaluated for phenological development. In each plot, three representative vines were marked and used for physiological and vegetative measurements.

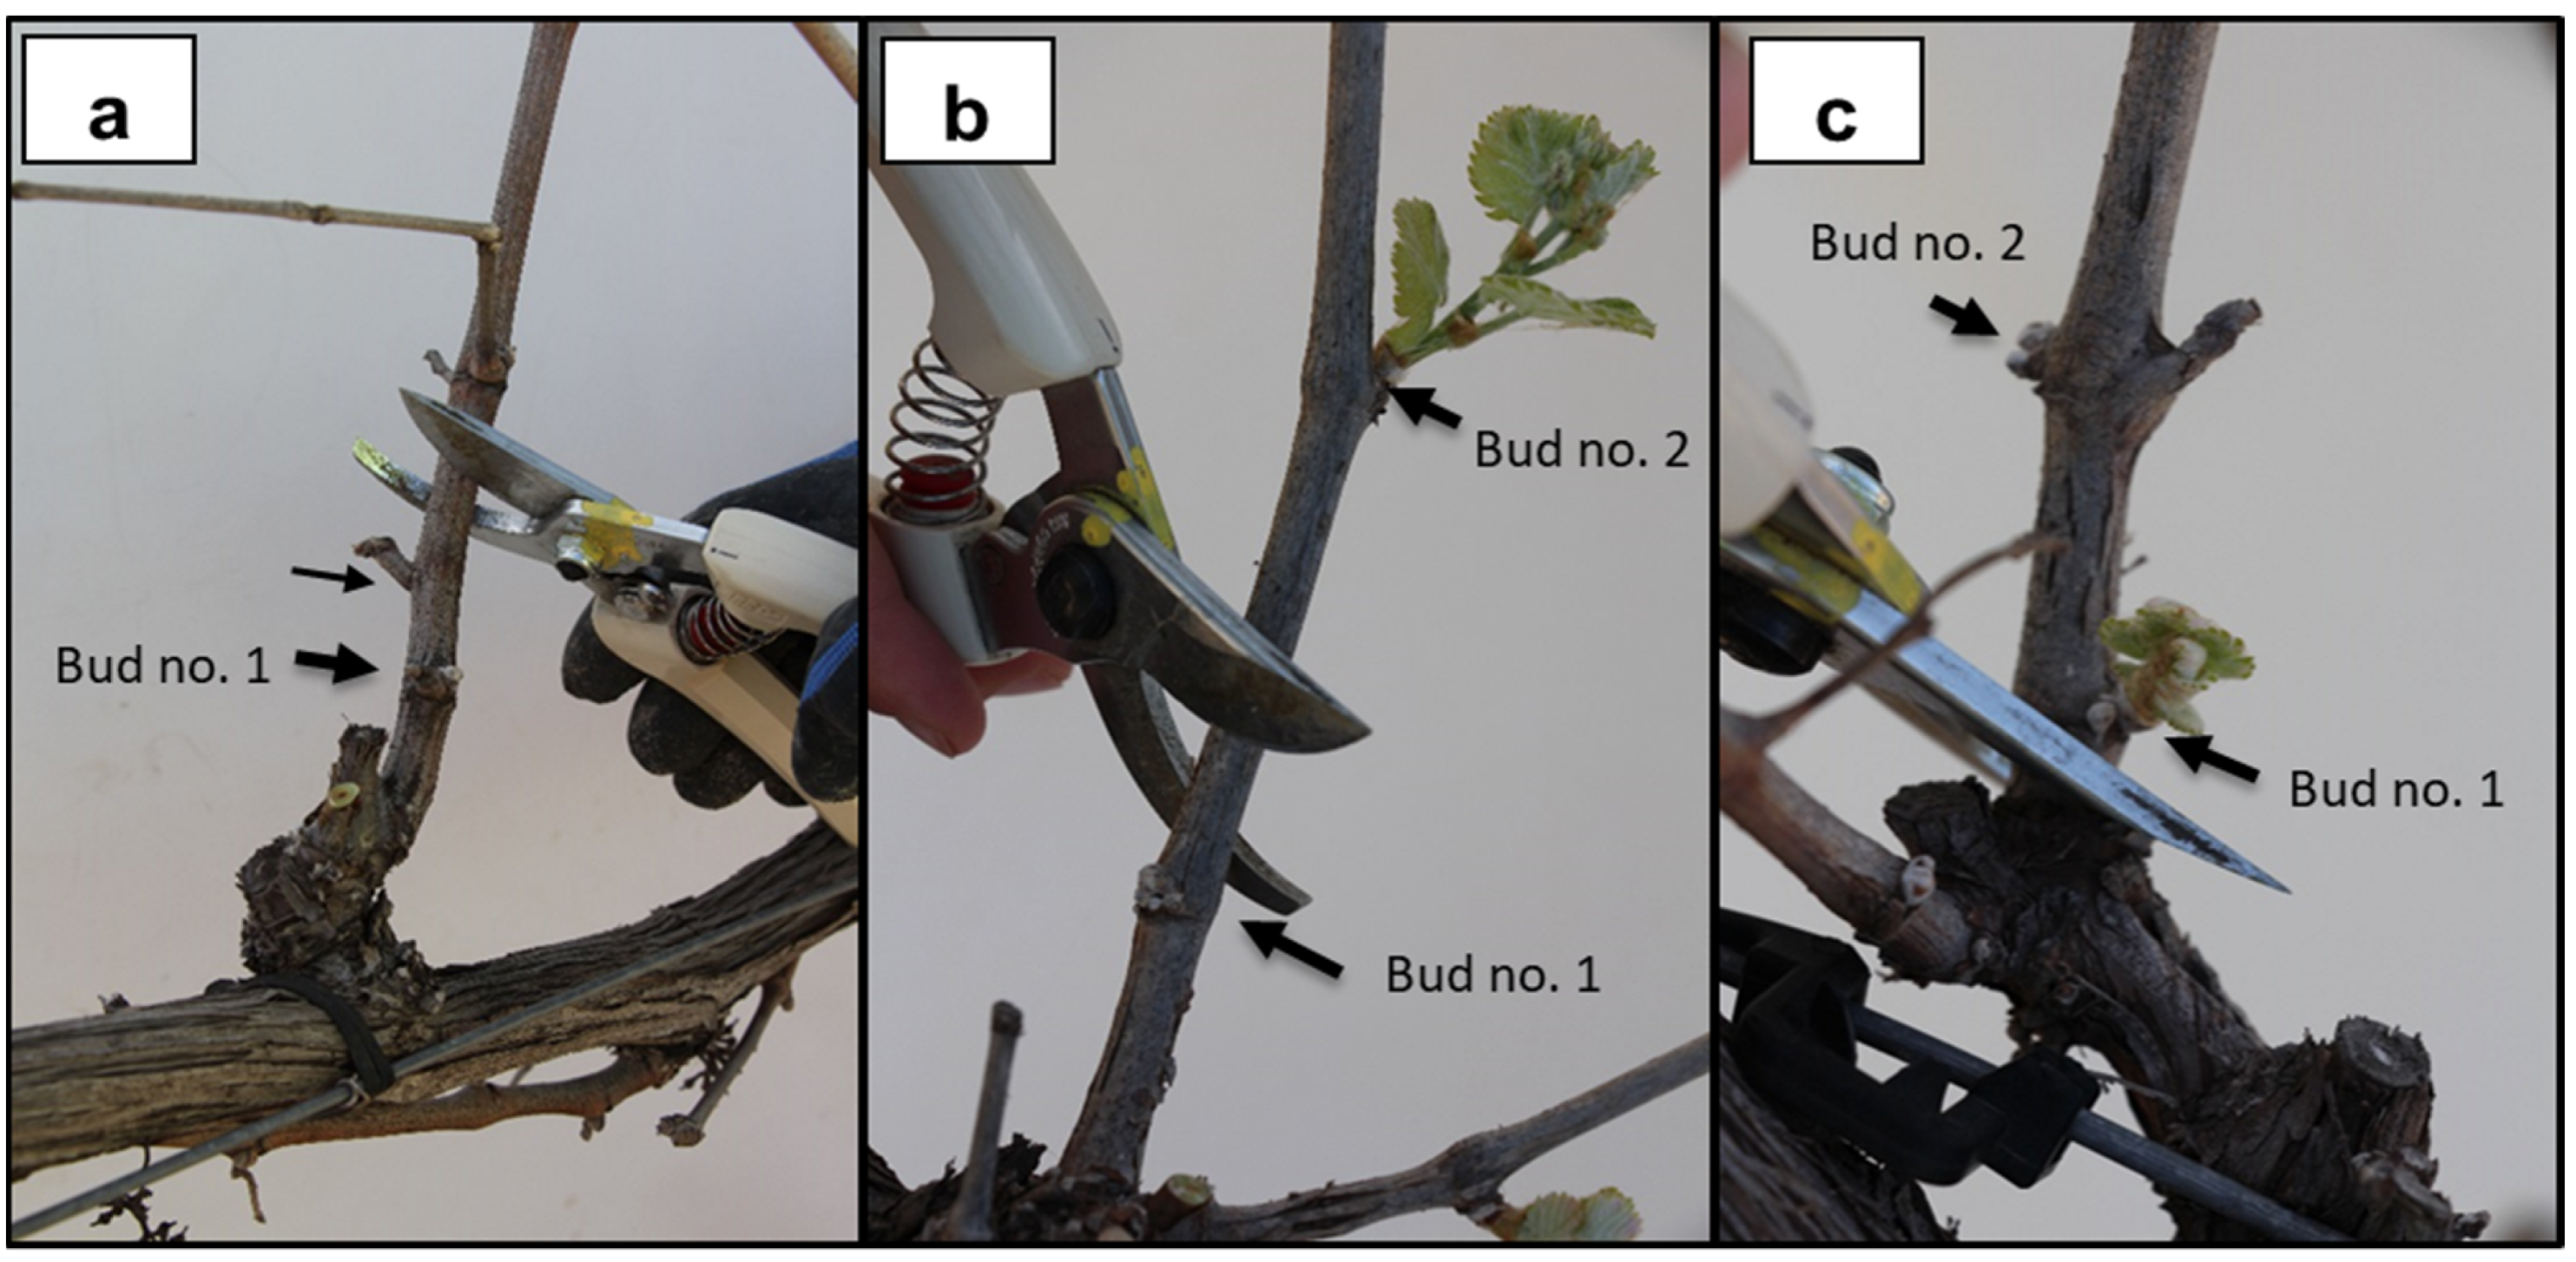
2.3. Pruning Treatments

The five pruning treatments were as follows (Table 1): (1) late shoot pruning (LSP1), performed 1 week after BBCH stage 4 (i.e., bud break); (2) late shoot pruning (LSP2), performed 2 weeks after BBCH stage 4; (3) late shoot pruning (LSP3), performed 3 weeks after BBCH stage 4; (4) winter pruning (WP + T) performed at BBCH stage 1 (dormant bud), and cluster thinning in early summer; (5) standard winter pruning (WP) at BBCH stage 1. All phenological stages were determined according to Lorenz et al. (1995). All treatments except WP included shoot removal (of non-fertile shoots) preformed during spring.

2.4. Standard Winter Pruning Method

In the WP and WP + T treatments, winter spur pruning was conducted during February of each year, about one month before estimated natural bud break (Table 1). The canes were pruned to short spurs with 2 buds each (not counting the basal/crown bud), spaced about 10 cm apart (12–16 spurs per vine).

2.5. Late Shoot Pruning Method

The three late shoot pruning (LSP) treatments were conducted according to the time of bud break of the WP treatment, with one-week intervals between application dates (Table 1). While classic pruning is generally conducted during late winter when buds are dormant, the LSP treatments were performed after some of the buds were already developed into young shoots. Thus, we termed this agro-technical practice shoot pruning as we actually removed the winter canes with a mass of young growing shoots. Due to apical dominance, most of the buds that emerged were located in the upper part of the cane, while the middle of the cane was bare. The buds located close to the base of the cane broke dormancy in lower numbers and with lower vigor compared to the distal buds. The LSP practice was performed so that the number of spurs left after pruning was similar to that left after the winter pruning of control treatments. However, the number of buds per spur might have differed due to the differences in the developmental stage of each of the relevant buds. The basic principle of the LSP agro-technical practice is to remove every bud that displays green leaves. In winter pruning treatments, 2 true buds per spur were retained (without counting the basal bud). The same practice was applied in LSP treatments, provided that none of the target buds exceeded bud break (Figure 1a). For example, if bud number 2 displayed green leaves and buds 1 and 0 were still dormant, the pruning cut was made on the internode between buds 1 and 2 (Figure 1b). If bud number 1 displayed green leaves, then the cut was made on the internode between buds 0 and 1 (Figure 1c). By the end of the pruning process, the vines were left with dormant buds only. Each treatment was applied to the same vines and border rows throughout the 3 growing seasons of the experiment.

2.6. Phenology, Canopy Evaluation and Meteorological Data

The phenological stages were determined according to BBCH, as proposed by Lorentz et al. [42]. The evaluation of each treatment was preformed once a week from BBCH stage 1 (dormant bud) until BBCH stage 35 (veraison).
The leaf area index (LAI) of three representative vines per replicate (12 vines per treatment) was measured two to four times a month using a non-destructive Sunscan canopy analysis system (model SS1- R3-BF3, Delta-T Devices, Cambridge, UK). Eight radiation measurements (spaced every 20 cm) were taken underneath each vine, covering the total area under the vine, as described by Munitz et al. (2020) [43].

2.7. Water Relations and Gas Exchange Measurements

Midday stem water potential (SWP) was measured twice a month at solar noon, one day before irrigation was applied. A pressure chamber was used (model AriMad 3000, MRC, Holon, Israel) according to the procedures outlined by Boyer et al. (1995). Three sunlit, mature, fully expanded leaves from each replicate (12 leaves per treatment) were double bagged 2 h prior to measurement with plastic bags covered with an aluminum foil bag. The time that passed between leaf excision and chamber pressurization was less than 30 s.
The diurnal pattern (5 times during daytime) of SWP and the parameters of leaf gas exchange were determined only for 2017 on the following dates: 29 of May, 10 of July and 14 of August. Leaf net CO2 assimilation rate (A) and stomatal conductance (gs) were measured on three leaves per replicate (12 leaves per treatment), using a portable infrared gas analyzer system (model LI-6400, Li-Cor, Lincoln, NE, USA). Measurements of gas exchange were taken at the same time as SWP measurements were taken.

2.8. Yield Components and Fruit Quality

Each replicate (11 vines) was harvested when the fruit total soluble solids (TSS) reached 23°Brix and the pH did not exceed the value of 3.7. All 11 vines within each replicate were harvested individually, the total yield per vine was weighed and the number of clusters per vine was recorded. Average cluster mass was calculated by dividing the yield of each vine by the number of clusters per vine. During harvest, 33 bunches were randomly selected per plot, 100 berries were randomly sampled from the sampled bunches and berry mass was determined. The average number of berries per cluster was calculated from bunch mass and berry mass. At ‘Merom Ariel’ research winery, the yield from each replicate was crushed separately for micro-vinification. Must samples were taken to determine the total soluble solids, titratable acidity (TA) and pH.

2.9. Wine Vinification

A sample of 50 kg of grapes (from bulked replicates in each treatment in 2016 and from each replicate in each treatment in 2017) was processed for winemaking. Entire clusters were destemmed, crushed and placed in 100 L stainless-steel, always-full tanks. To initiate alcoholic fermentation, 10 g of the commercial Saccharomyces cerevisiae strain Clos (Lallemand, Montreal, QC, Canada) was added. The cap punch down operations for the extraction of color and polyphenols from the skins were carried out three times a day during the 8 days of maceration in a temperature-controlled room at 25 °C. On day 9, wine was separated from the pomace by pressing it using a hydraulic press and was kept at the same temperature until its density dropped below 0.994 g mL−1. The dry young wine was decanted and left at 20 °C for malolactic fermentation. Following completion of malolactic fermentation, sulfur dioxide was added to the wine (as potassium metabisulfite) at a rate of 60 mg L−1. The wine was decanted a week later and stored at 15 °C in 10 L demijohns. Two months later, 2 g L−1 of French Oak wood chips (World Cooperage, Napa, CA, USA) was added to the demijohns and left to age for an additional month, when the wine was racked again and bottled in 750 mL dark wine bottles until used for further analyses.

2.10. Must and Wine Analysis

Must samples were prepared from harvested grapes by crushing. The juice was left to settle for an hour and then decanted. The basic parameters of must are total soluble solids (TSS, °Brix), titratable acidity (TA) and pH. For TSS determination, a digital refractometer was used (Pocket PAL-1, ATAGO, Tokyo, Japan). TA and pH were measured by a Hana HI 2211 pH meter (Hanna Instruments, Woonsocket, RI, USA). TA is expressed as concentration of tartaric acid (g l−L) and was determined by diluting 10 mL of must with 10 mL of distilled water and by subsequent titration with 0.1 M NaOH to pH 8.2 according to the following calculation: TA = (Vol.NaOH × 0.75), where Vol.NaOH is the volume of added NaOH. The red color of berries was determined using the following extraction method: 100 g of berries was crushed for 2 min and homogenized for 60 s with a solution consisting of 1.5 M HCl (7.5% of the solution), ethanol (42.5%) and distilled water (50%). The blend was left in a closed tube for one hour and then transferred for 15 min to a centrifuge operating at 90 RPM. The clear fluid fraction was spectrometrically analyzed for absorbance at 518 nm.
The basic parameters of wine samples (concentration of ethanol and soluble sugars, TA, pH, concentrations of tartaric, malic and acetic acids) were determined by the software ‘OenoFoss’ (FOSS, Hillerød, Denmark), and a Super Dee digital distillator and Super Alcomat electronic hydrostatic balance (Gibertini, Milano, Italy) were used too.

2.11. Wine Tasting

Following wine stabilization and initial aging for 6–5 months, the wines were blind-tasted by a qualified panel of eight oenologists for their sensory quality attributes. The tasting was conducted using a method adopted from that of the OIV )International Organisation of Vine and Wine) score sheet for dry red wines [44]. Shortly, the wine score sums up to 100 points, combined from ‘Visual’—including color quality (up to 5 points) and color intensity (up to 10); ‘Nose’—including aroma intensity (up to 8), aroma genuineness (up to 6) and aroma quality (up to 16); ‘Taste’—including taste intensity (up to 8), taste genuineness (up to 6), taste quality (up to 22) and after-taste (up to 8); and general harmony (up to 11). The wines were tasted in 4 flights of 5 wines, in a random pattern.

2.12. Statistical Analyses

One-way ANOVA was conducted followed by the Tukey post-hoc test for analyzing differences among means of yield, must and wine characteristics and percentage of dehydrated leaves in each replicated plot (4 plots per treatment) to determine the statistical significance (a = 0.05). The analysis was conducted using JMP Pro 13.0.0 Statistical Software (SAS Institute Inc., Cary, NC, USA).
An additional analysis was conducted to extract multivariate patterns from the 2017 data, which were characterized by overall high variability among treatments. This analysis considered three measured vines per plot, with a total of 59 measurements (i.e., 3 vines × 5 treatments × 4 replicates; one vine was excluded due to missing values). The variables used for this analysis were SWP and LAI records, each measured on 9 dates during the growing season, at two-week intervals, with yield components including crop yield (kg vine−1), cluster mass (g), clusters (number vine−1) and wine quality attributes. For the latter, the 20 records (5 treatments × 4 replicates) were incorporated into the analyzed dataset by being duplicated three times to represent all vines within each replicate. This dataset was analyzed using principal component analysis (PCA), conducted to extract meaningful patterns in the data and quantify the interrelations between specific variables and their interactions with the different pruning treatments. This method is designed to reduce the dimensionality of a multivariate dataset with a large number of interrelated variables while preserving as much of the variation present in the dataset [45,46] by conducting a linear combination of the variables. The set of variables is transformed to a new, uncorrelated set of variables, or principal components (PCs), ordered by their ability to retain most of the variation present in all the original variables. A two-dimensional sub-space may then be displayed using a biplot to provide a lower dimensional summary of the data. The biplot represents the inner product of the vectors corresponding to the records (vines) and fields (variables) of the data [47]. The PCA biplot plots points, which represent the observations, and vectors, which represent the variables, and thus reveals the clustering (distance between observations) within the data as well as the variances, varied influences and the relationships between the variables.

3. Results

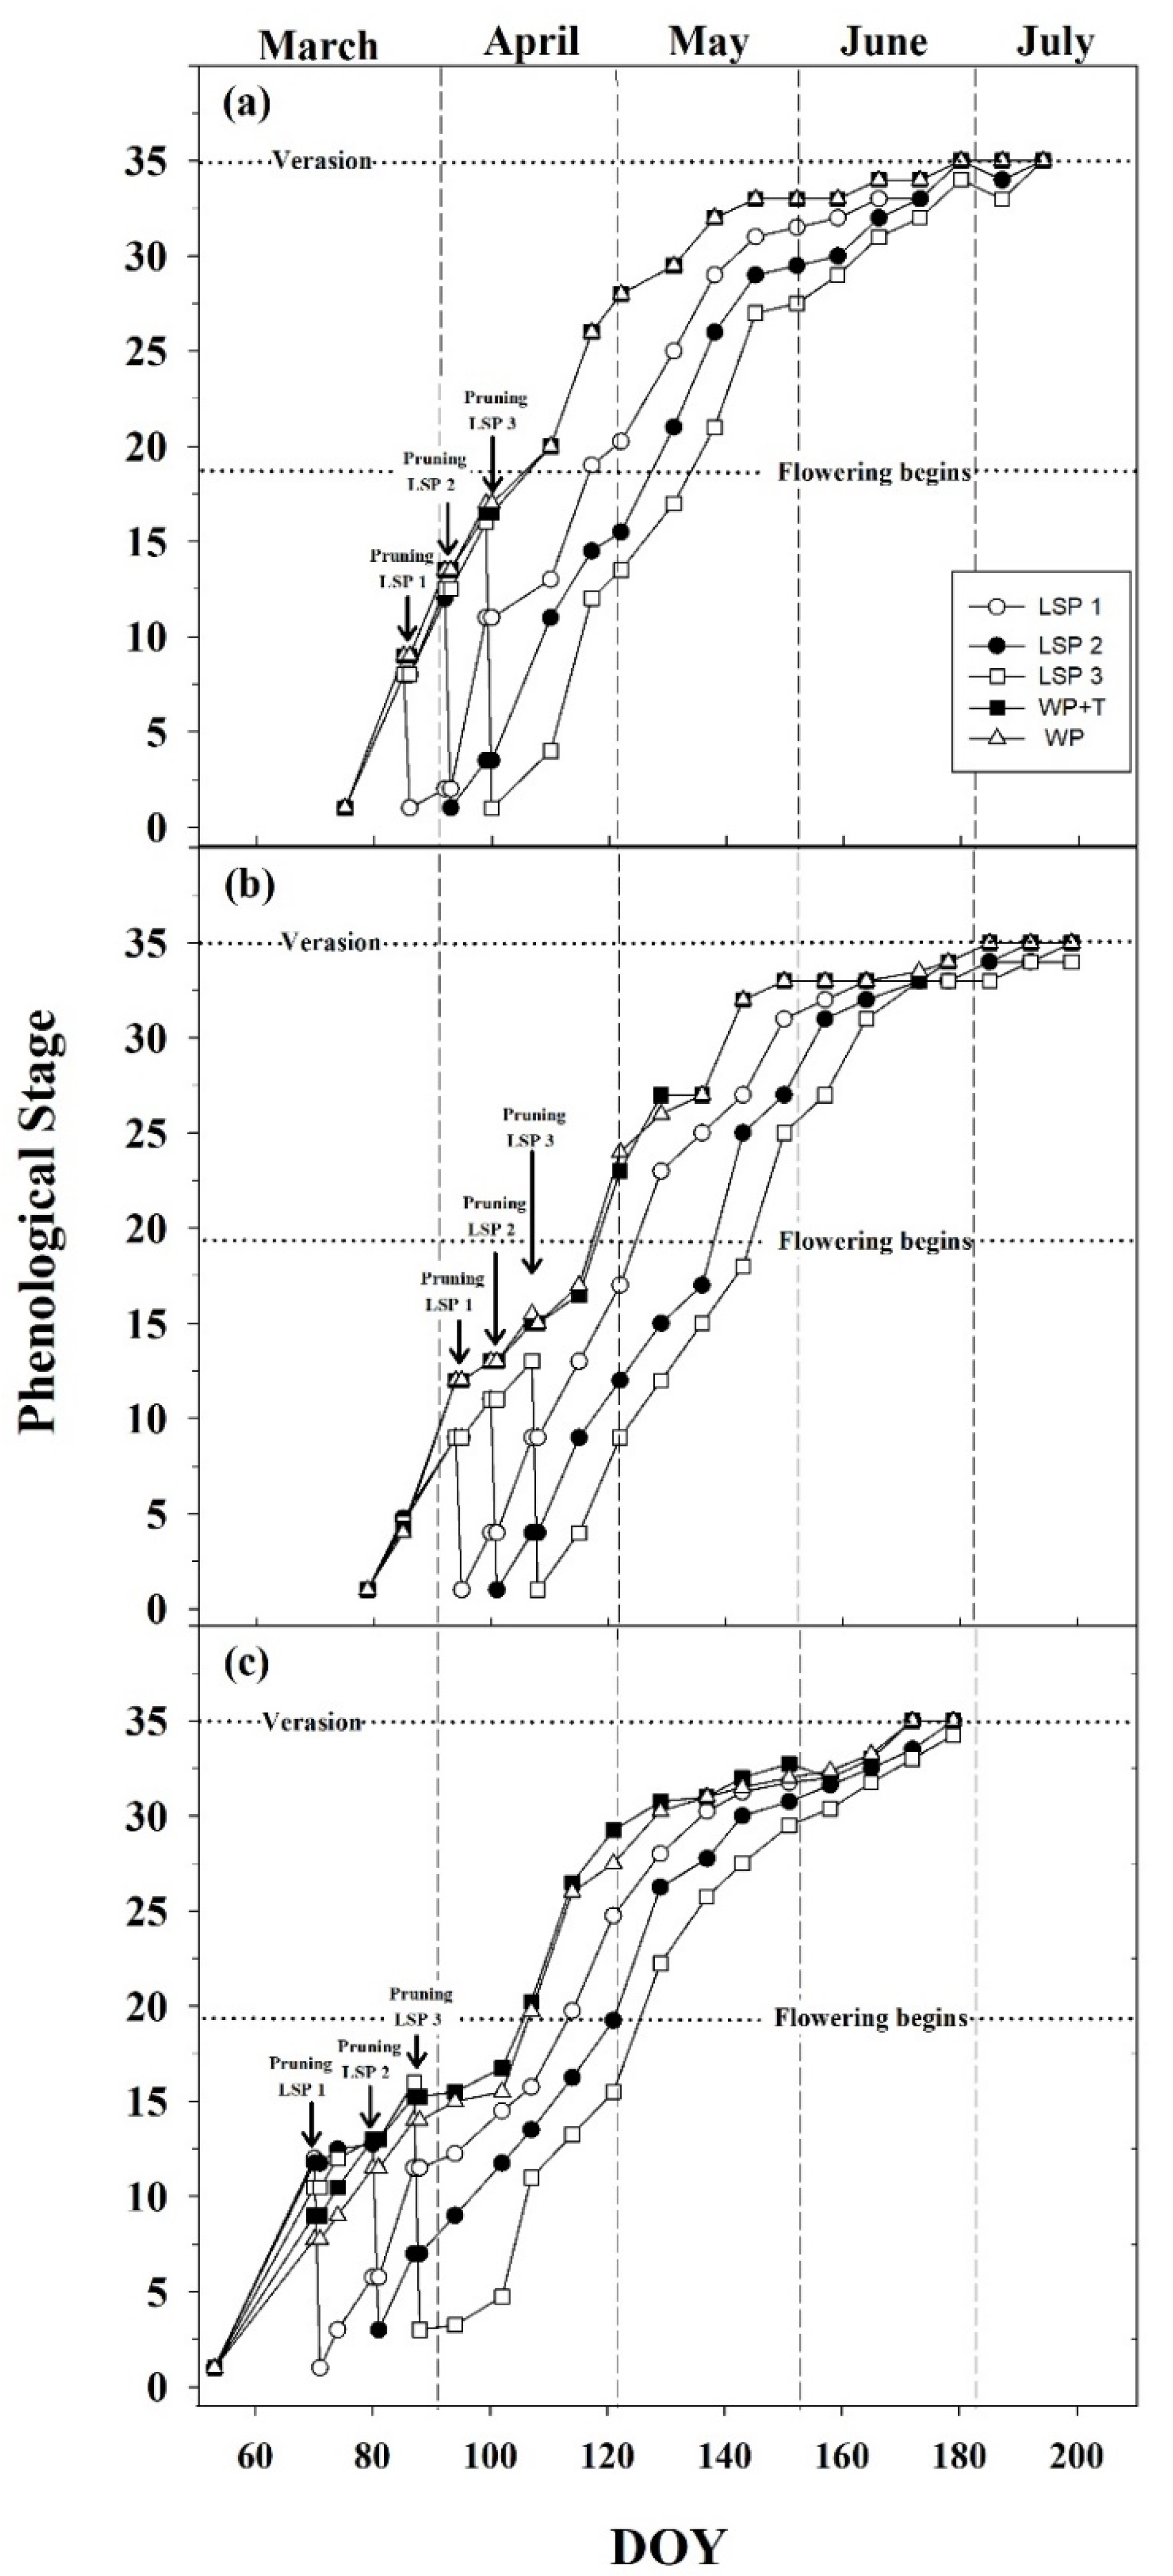
3.1. Seasonal Phenological Course

Standard winter pruning at the two WP control treatments was conducted according to common agricultural practice in mid-February (DOY 48–51). When examining the seasonal patterns of the phenological development over the course of three seasons (Figure 2), our findings show that the bud break of those treatments began on the 16 March 2016 (DOY 75), the 26 March 2017 (DOY 85) and on the 11 March 2018 (DOY 70). During the course of the study, no discernible phenological differences were observed between WP and WP + T. In those treatments, flowering (phenological stage 19) took place between mid- and late-April of each year (Figure 2). Bunch closure at the beginning of phase II of berry development (phenological stage 32) began at the end of May, and veraison (phenological stage 35) began during June. The phenological development pace of the LSP treatments was similar to the ones of the WP treatments, until the late pruning was conducted, which reset the ‘phenological clock’. Once late pruning was conducted, each of the LSP treatments re-started the phenological process at a similar pace. The one-week difference between dates of LSP, conducted in accordance with the relevant treatments, was evident in the phenological pattern until mid-May. A drastic increase in the pace of the phenological development of vines in the LSP treatments was apparent from mid-May until the end of June, meaning that at veraison (stage 35) there was full consolidation between all treatments.

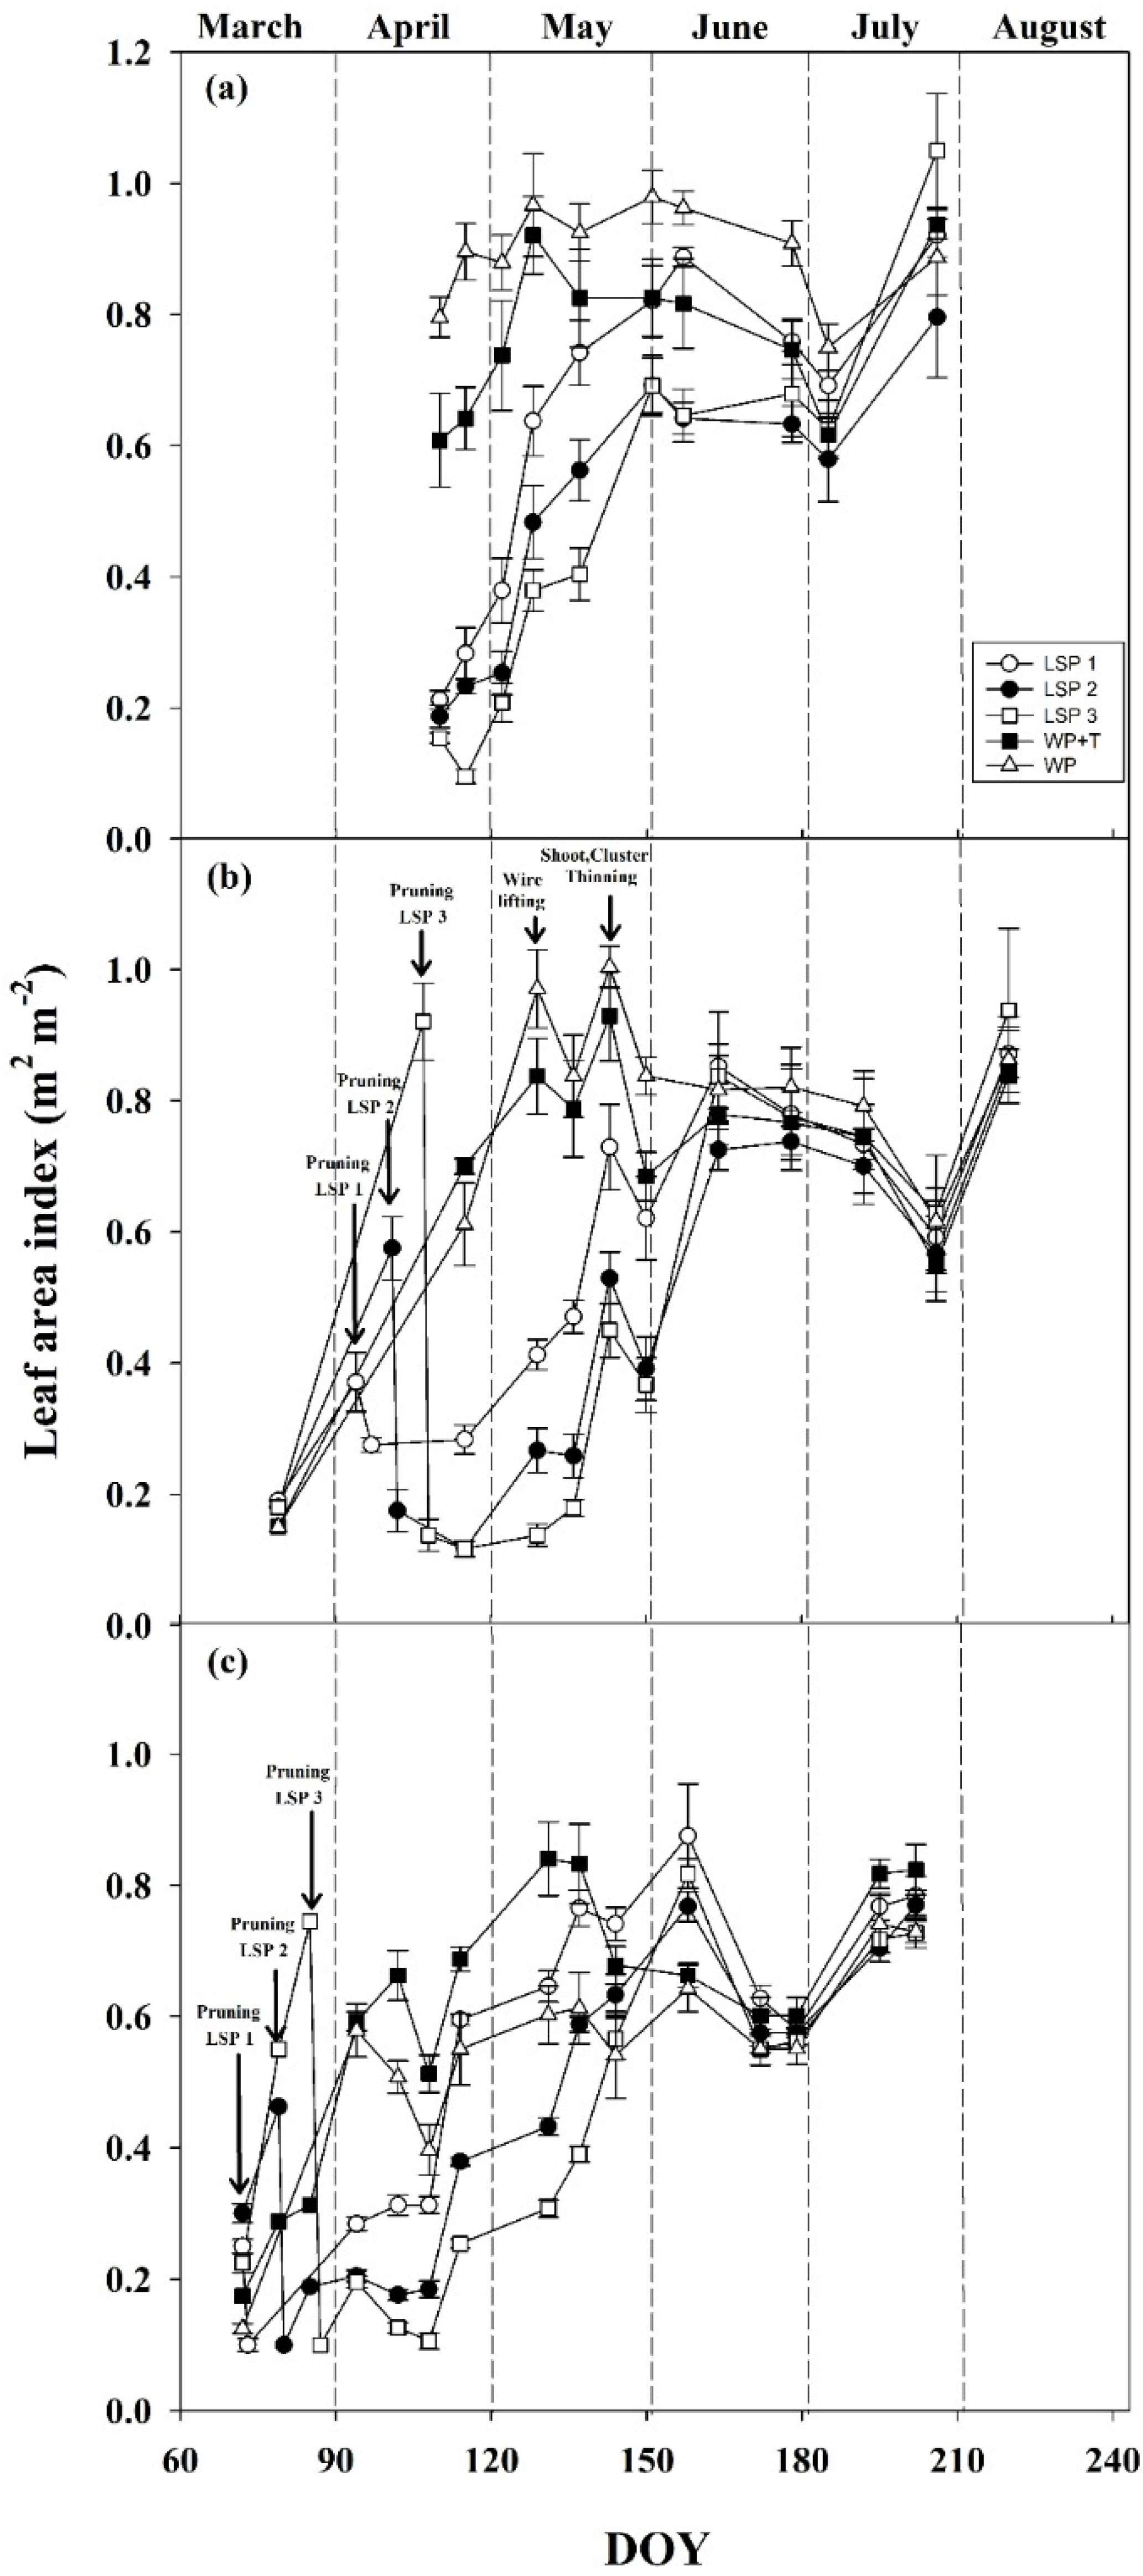
3.2. Seasonal Vegetative Development

At the beginning of leaf area index (LAI) measurements in 2016 (after the pruning of the LSP3 treatment), the LAI of the WP vines reached 0.8, while that of the WP + T vines reached only 0.6, and the LAI of the three LSP treatments was 0.2 (Figure 3a). The LAI of WP vines gradually increased, leveling off at 0.95 on DOY 130. The LAI of WP + T increased more linearly and rapidly, reaching 0.9 at that date, steadily decreasing from that point until the beginning of July. After the onset of shoot growth, the LAI of the LSP treatments increased, reaching a peak of 0.9 for LSP1 (DOY 160) and 0.7 for LSP2 and LSP2 at DOY 150. Then, the LAI of all three LSP treatments decreased until the beginning of July. Thereafter, the LAI of all the treatments continued their development, with LSP3 reaching the highest value (1.1) at the end of July (DOY 210).
In 2017, the LAI of the LSP3 treatment developed most rapidly after bud break, reaching 0.9 at DOY 110, a value that was reached by WP only on DOY 130 and by WP + T on DOY 140 (Figure 3b). Pruning of the canes of the LSP vines decreased the LAI of those vines close to minimum (LAI of ~0.1 is an artifact of the shade of the trunk and cordon). For all the LSP treatments, there was a delay in shoot growth after pruning, with LSP1 renewing growth first, followed by LSP2 and LSP3. The LAI of the LSP treatments increased gradually, reaching its peak (of about 0.8) on DOY 170. The LAI of the two WP treatments increased almost linearly, reaching almost 1.0 at DOY 140, decreasing a bit and then leveling off, with the rest of the treatments at DOY 190. All treatments decreased simultaneously to LAI values of 0.6 at DOY 210 and then increased to LAI of 0.8–0.9 at DOY 220 (last measurement).
During 2018, WP + T vines developed a larger leaf area than WP vines (Figure 3c), while all the LSP treatments showed a similar trend to previous seasons, with a slight shift towards an earlier onset of bud break and early shoot growth.

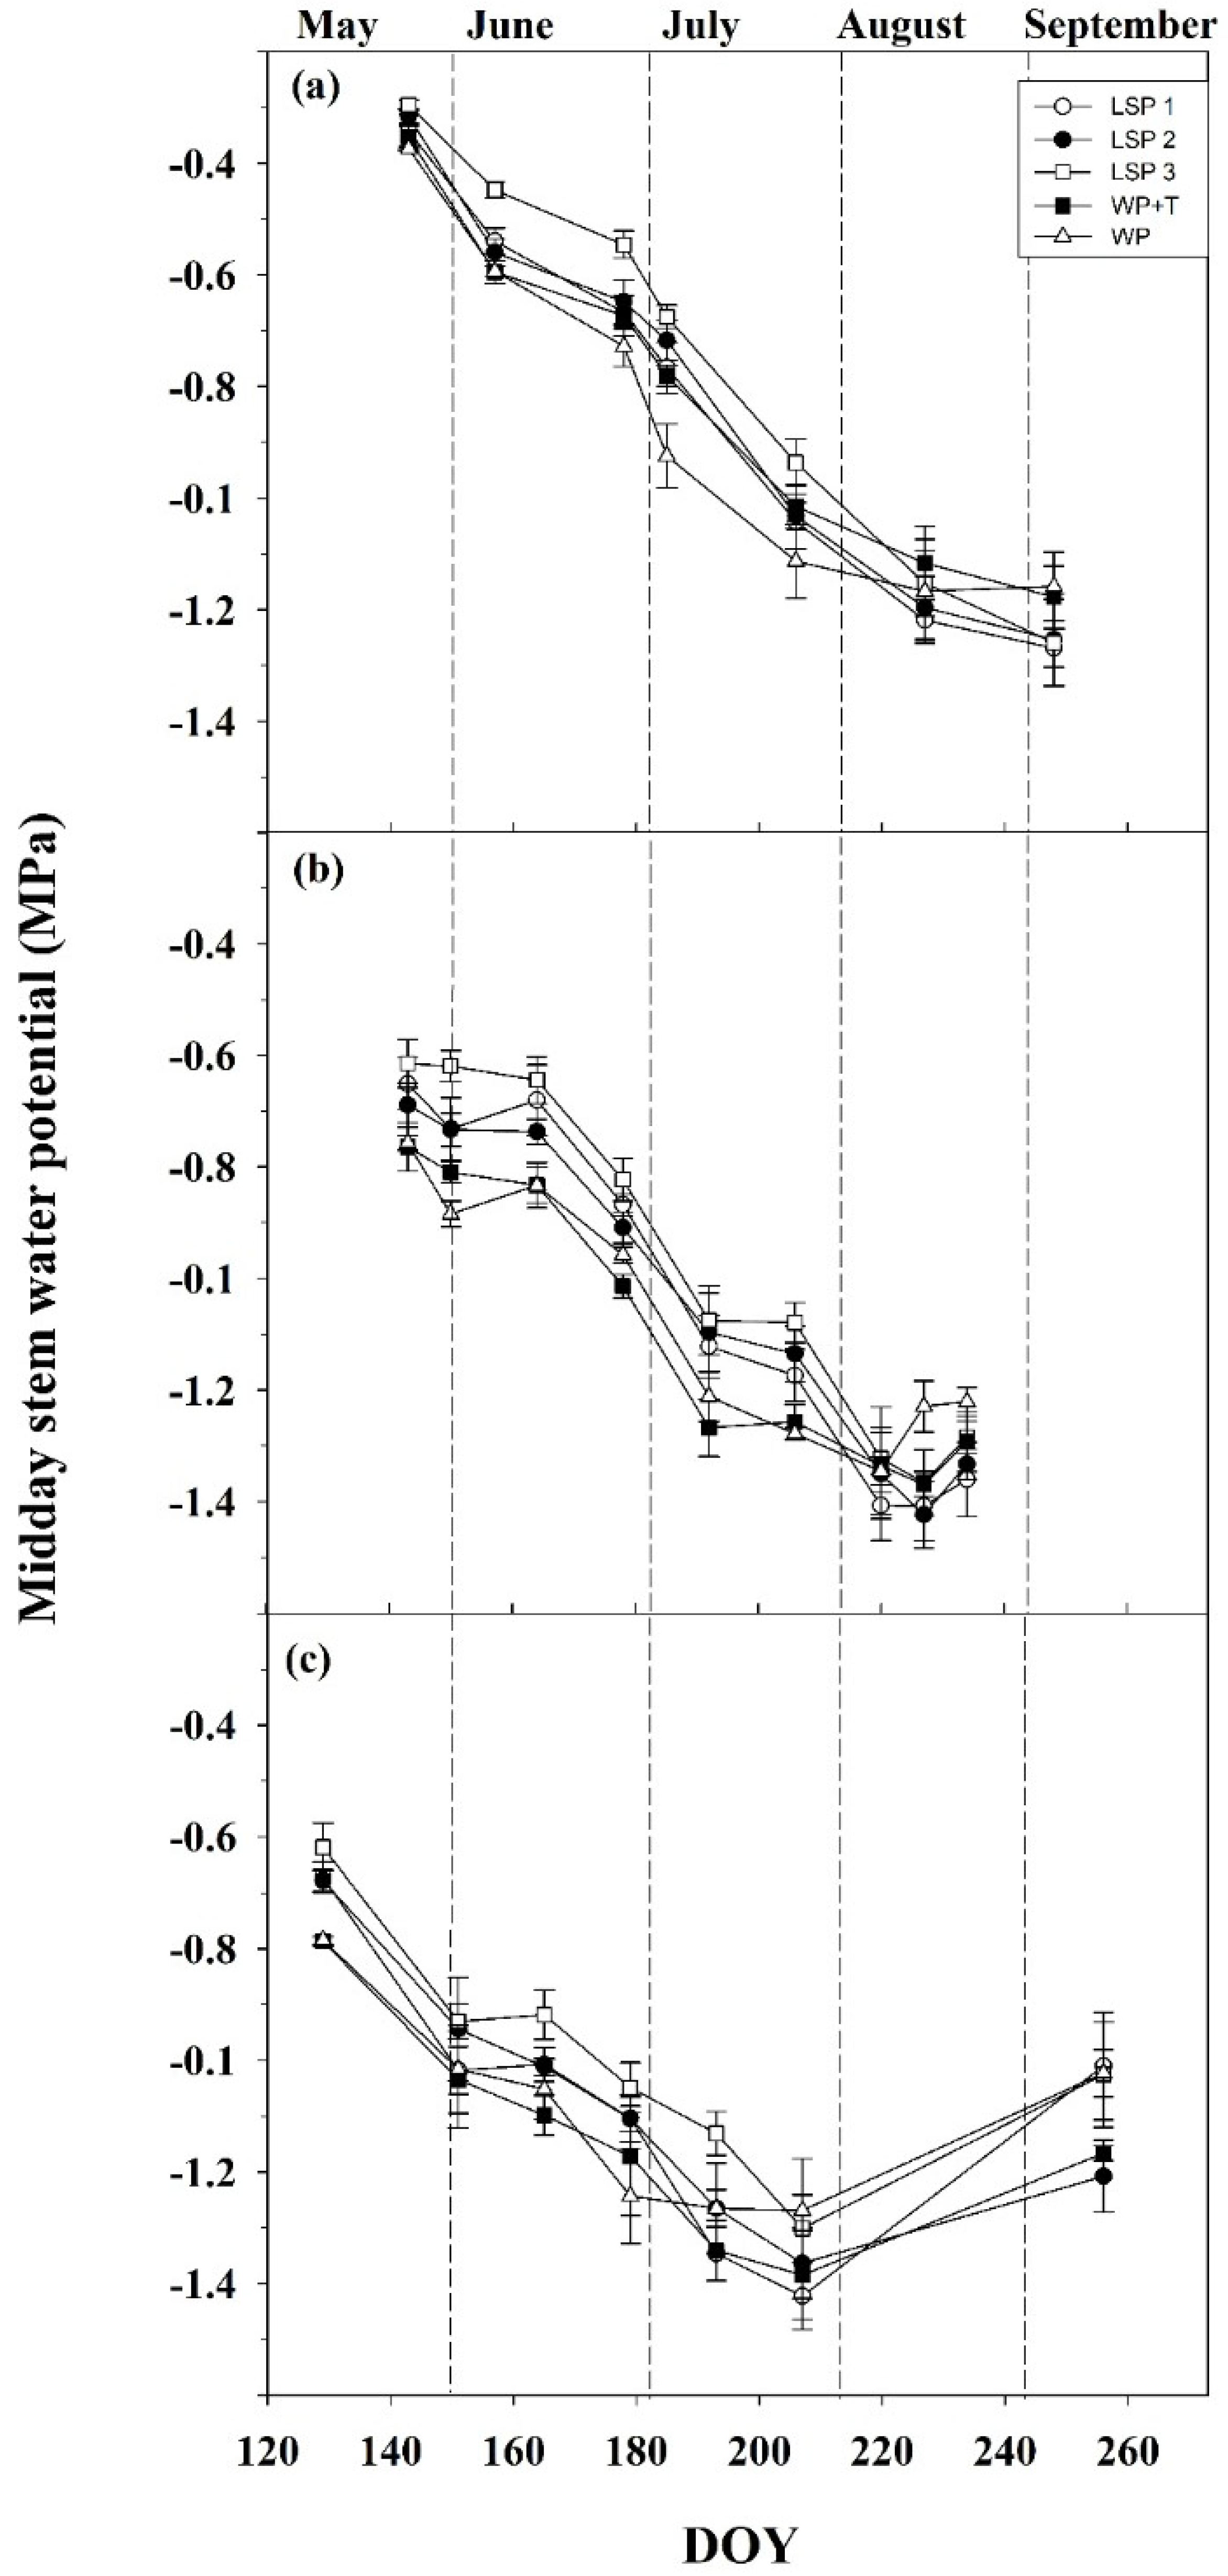
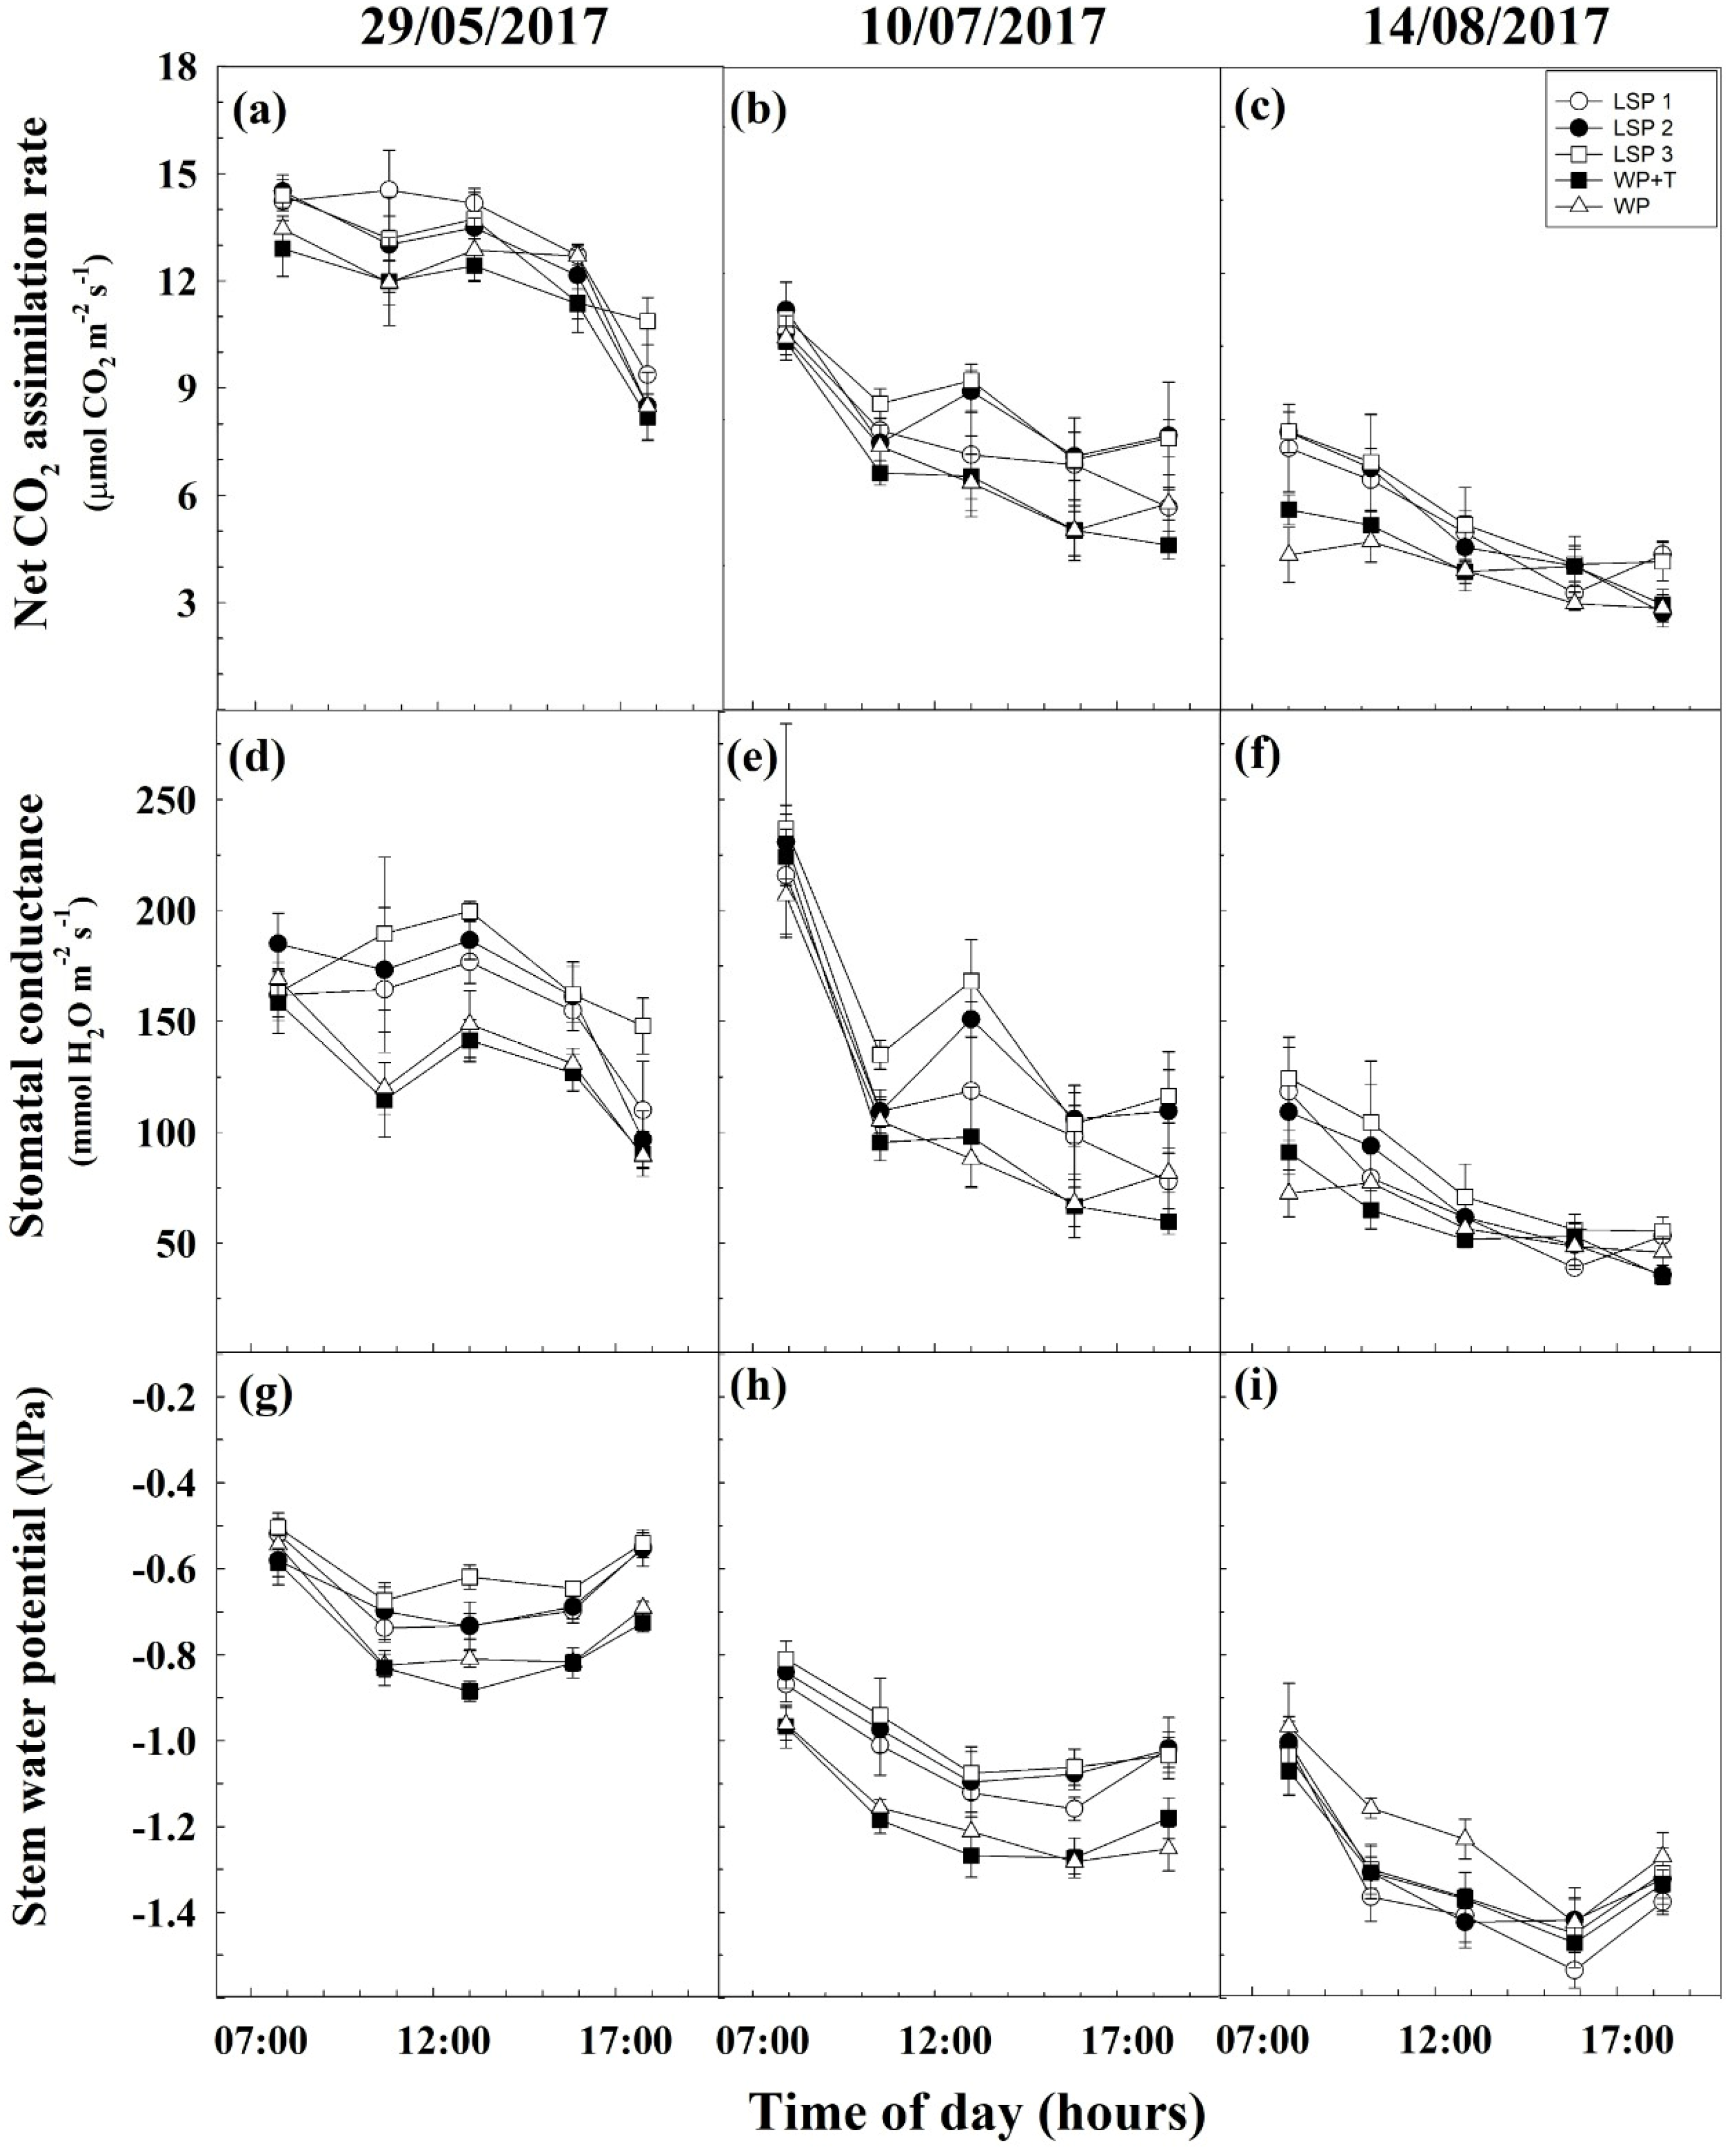
3.3. Water Relations and Plant Physiology

The results show a typical seasonal trend of deficit irrigated wine grapes: a decrease in the values of midday stem water potential (SWP) with the advancement of the phenological development towards harvest (Figure 4). In 2016, the treatment with the most improved water status was LSP3. This treatment began its vegetative and phenological development later in the growing season due to late pruning—3 weeks after bud break of the control treatments. The most negative values of SWP were measured in the WT treatment. In 2017, the WP and WP + T treatments had the lowest values of SWP until mid-August, when an improvement in the SWP values was evident. During most of the 2017 season, no discernible difference between WP and WP + T treatments was noticed (Figure 4b). Nevertheless, at the last two measurements in August, all treatments showed a rise in SWP, with a statistically significant increase in the SWP values of the WP treatment. It is important to mention that during 2017, a dramatic and unequivocal dehydration of the leaves took place in the WP treatment, as nearly half of the leaves on the vines were damaged by dehydration (Table S1). In the remaining four treatments, the percentage of damaged leaves did not exceed six%. During 2018, we also observed an improvement in SWP values (less negative) from the beginning of July in all treatments but especially in the WP treatment (Figure 4c).
Net CO2 assimilation rate: As with SWP, the values of the CO2 assimilation rate decreased with the progression of the season (Figure 5a–c). During the first measurement date (29 May 2017), most of the treatments displayed similar trends of high rates from 8:00 am to 13:00 pm (Figure 5a) (8:00 am rates ranged between 13 and 15 µmol CO2 m−2 s−1), with slightly higher rates of the LSP treatments compared to the WP controls. Thereafter, the rate decreased sharply in all the treatments (rates ranging from 5 to 8 µmol CO2 m−2 s−1). During the second measuring day on 10 July, all the treatments started with almost similar CO2 assimilation rates of around 11 µmol CO2 m−2 s−1 (Figure 5b). Then, the rates in the WP treatments decreased steadily, reaching 5–6 µmol CO2 m−2 s−1. The rates of LSP2 and LSP3 treatments decreased more gradually, with both reaching 8 µmol CO2 m−2 s−1 at the end of the day. The rate of LSP1 decreased at an intermediate pattern compared to the two control treatments. During the last date of measurements (14 August), the early morning rates of the LSP treatments were higher than those of the WP treatments (8 vs. 5–6 µmol CO2 m−2 s−1, respectively; Figure 5c), but those differences disappeared by the end of the day (4–5 µmol CO2 m−2 s−1).
Stomatal conductance: The curves describing the diurnal trends of stomatal conductance (Figure 5d–f) closely resembled those of the net assimilation rates. On the two early dates, the WP treatments had the lowest values of stomatal conductance during most of the day, with small differences between them (Figure 5d,e). During the last measurement date (Figure 5f), only at 8:00 am was there a noticeable difference among the WP treatments and the LSP treatments; the former expressing the lowest values. Later measurements showed a gradual decrease in stomatal conductance, with little difference among the treatments. On all three dates, the LSP3 treatment had the highest values throughout the day, followed by LSP2 and LSP1. On July 7, the rates of stomatal conductance at 8:00 am for all treatments were almost uniform (ranging between 210 and 240 µmol H2O m−2 s−1) and were higher than the range of the 8:00 am measurement on May 29 (160–190 µmol H2O m−2 s−1) (Figure 5d,e).
Stem water potential: At the end of May, the diurnal SWP curves of all the treatments followed the pattern by which values were highest in early morning, lowest between 11:00 and 16:00 and somewhat increased again between 17:00 and 19:00 (Figure 5g). The measurements of July 10 show that SWP was also highest early in the morning (Figure 5h), decreasing steadily to the lowest point between 13:00–16:00, with a slight recovery in the late afternoon. During the last date (August 14), the SWP of all treatments decreased more steeply from early morning to its lowest value at 17:00 (Figure 5i), then increased by about 0.2 MPa at the last daily measurement. During the last date (Figure 5i), the curves of all treatments displayed a similar pattern and values, except for the WP treatment, which had higher SWP values until noon and then decreased to the level of all other treatments. At the early measurement date, the lowest SWP was −0.9 MPa (Figure 5g), while in the next two dates, the lowest SWP values were −1.3 and −1.5 MPa, respectively (Figure 5h,i).

3.4. Crop Yield and Its Components

In 2016, the crop yield of the WP control treatment (14.4 kg per vine) was significantly higher (p < 0.0001) compared to the other treatments (Table 2). The LSP treatments showed a clear trend of crop reduction as the time of pruning was delayed. The crop yield corresponded well with the number of clusters per vine, while there was no significant difference in cluster mass among the treatments (Table 2). In the LSP3 treatment, which had the lowest number of clusters and thus lower yield, we observed the lowest number of berries per cluster, with slight compensation in higher berry mass. In 2017, we observed a reduction in the yield of WP treatment, but it still had the highest yield with no significant difference between WP and WP-T treatments (Table 2). The LSP3 and LSP2 treatments had significantly lower yields (p values ranged between 0.013 and 0.0004) compared to the WP treatments. WP had the highest number of clusters compared to all the other treatments. In 2018, a trend of yield reduction in the WP treatment was observed. In the other treatments, similar levels as in 2017 were recorded.

3.5. Must Composition

At harvest in 2016, LSP3 had the highest must sugar level, 24.02 oBrix, and WP had the lowest level, 22.43 oBrix, with no significant differences among the various treatments (Table 3). The must of WP had the highest pH, 3.72, followed by WP + T with 3.68 and LSP3 (no significant differences). LSP2 had the lowest pH, 3.49, significantly lower than LSP3, WT and WP + T. The TA of WP was the lowest, followed by WP + T, both significantly lower than the TA of all other treatments. The LSP3 treatment had the highest grapes anthocyanin content (518 nm), 28.5, followed by LSP2 and LSP1, with 25.4 and 23.3, respectively, and LSP3 differing significantly from LSP1. The two control treatments had significantly lower anthocyanin content levels compared to the three LSP treatments: 17.35 and 17.03 for WP and WP + T, respectively.
In 2017, the first replicates harvested were from LSP2 and WP + T (Table 3). Although WP was harvested last, the TSS level of the must was the lowest (no significant difference from the other treatments). There was also no significant difference in pH levels among the treatments.
In 2018, all LSP treatments finished harvest before the WP treatments (Table 3), while those treatments had the highest must sugar levels (LSP 2 and LSP3 had significantly higher levels compared to WP treatment). There were no significant differences among treatment in the pH of the must.
Sensorial evaluation of the wine quality:
In 2016, we could not statistically analyze the differences between treatments because only one wine per treatment was produced from grapes bulked across all four replicates (Table 4). Nevertheless, a dramatic effect of the treatments was observed with a 6 to 7.5 points increase in the total score for the wines produced from LSP grapes compared to the WP grapes. The WP + T wine received a higher score than the WP wine, but a lower score than all LSP wines.
For the 2017 and 2018 harvests, wine was fermented separately for each replicate, which enabled statistical analysis. In 2017, there was a significant difference between the three LSP treatments and the WP (Table 4), with the WP wines receiving significantly lower scores compared to those of the LSP treatments (p-value ranged between 0.005 and 0.04). In 2018, similar trends were observed, but with one exception, WP and LSP2 wines did not differ significantly (Table 4).

3.6. Wine Color and Polyphenolics Analysis

The micro-vinificated wines were analyzed by a spectrometer to determine their coloration levels. For all three years (Table 5), the coloration levels for the LPS treatments were higher than those of the WP treatment and similar to or higher than those of the WP+T treatment. The total phenolics levels were higher for the LSP treatments in both 2016 and 2017, but not significantly different from the WP treatments in 2018. Color hue parameters were all in acceptable ranges.

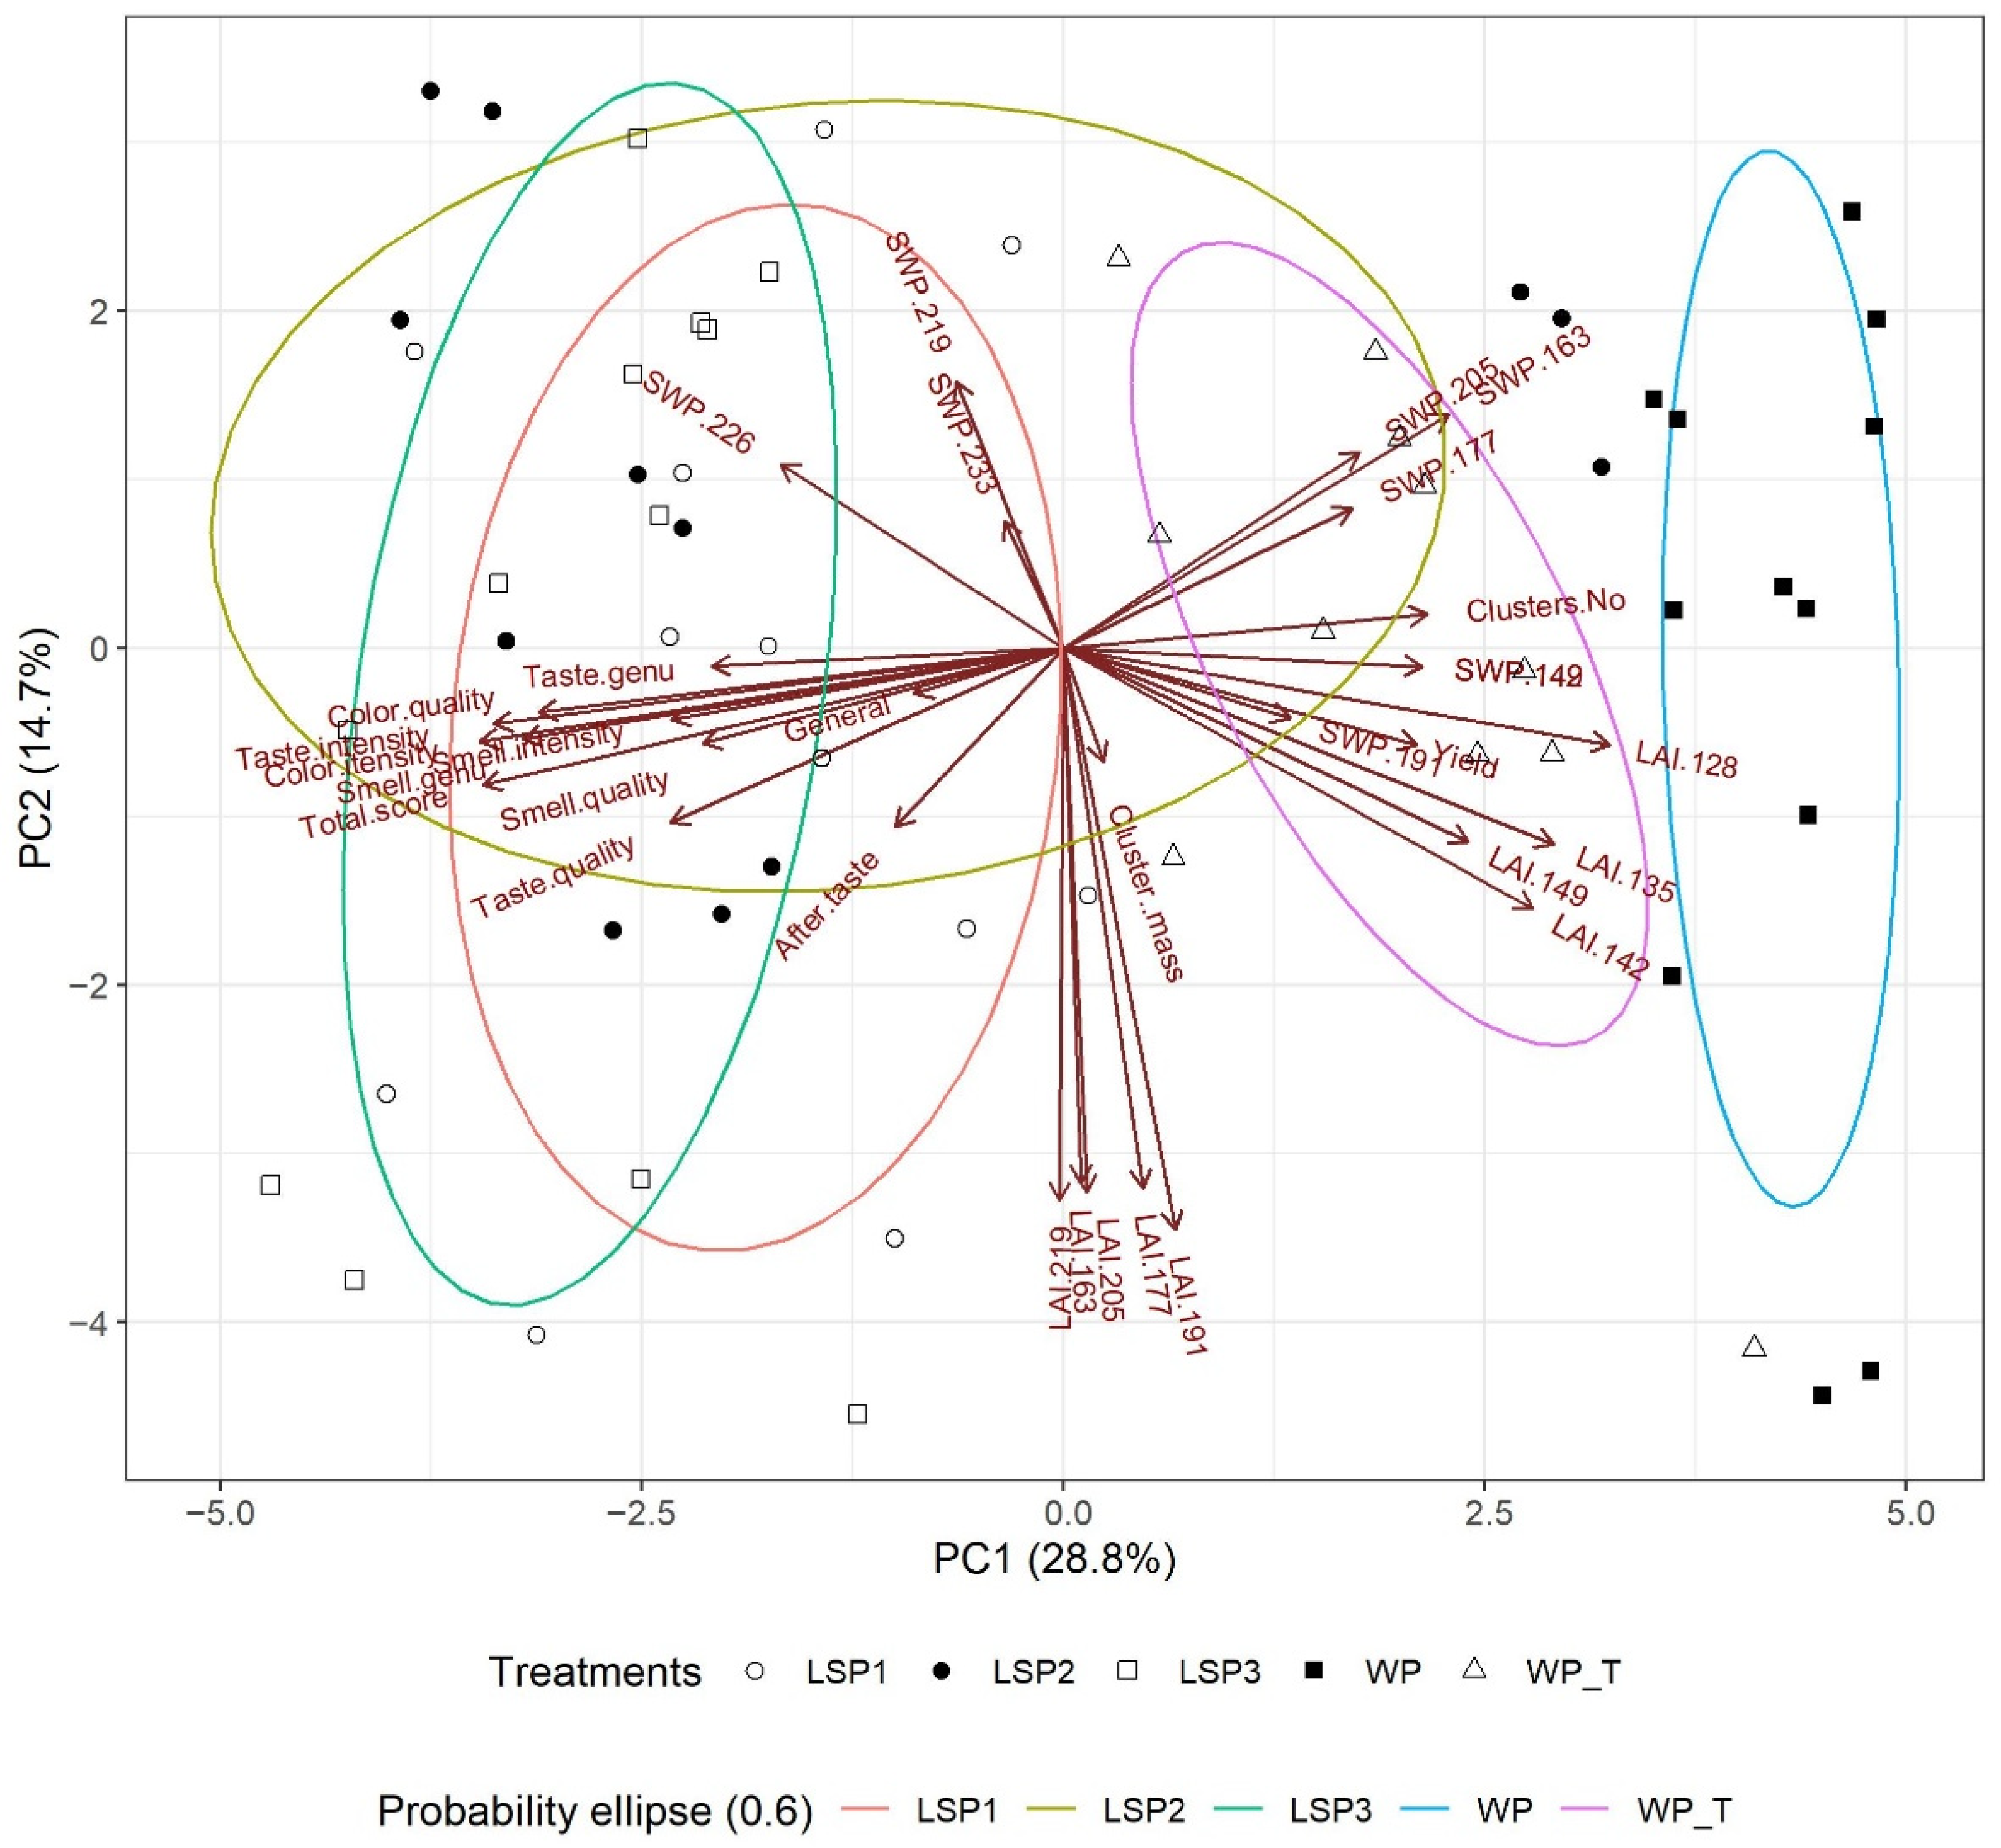
3.7. Statistical Analyses—PCA

The PCA analysis for the results from the 2017 growing season (physiology, vegetative, yield components and wine quality characteristics) uncovered a number of patterns within the data. PC1 and PC2 were able to explain 43.5% of variance of the data, while PC3 provided an additional 12.1%. The scores of the different treatments were plotted on the biplot (Figure 6) along with their probability ellipses (0.6). The scores of the treatments WP and WP + T showed the most clustered patterns. The clustering arrangements of treatments LSP1 and LSP3 were similar and overlapping and LSP2 was characterized by a high variability of the scores. The treatment scores of LSP3 and WP showed the highest dissimilarity and were completely distinct.
The 32 variables (Figure S1) that were analyzed showed varied relationships and influences on the PCs (Figure 6). The most influential variables with regard to PC1 were negatively correlated and related to wine quality, specifically color intensity and taste intensity, followed by smell genuineness. The first LAI measurement (LAI 128-meaning LAI measurements conducted at DOY 128) was also found to be highly contributing and positively correlated to PC1. The variables that were most correlated to PC2 were the vegetative variables for the second half of the growing season (LAI 163–219). The interrelations between variables may be interpreted using the direction of the vectors. Vectors that are close, thus forming a small angle between them, are positively correlated, and the bar plots in Figure S1 specifically demonstrate this pattern for the following variables: most of the wine quality variables (aside from the after-taste variable); the four LAI variables for the second half of the season; the first four LAI variables of the season and SWP 191, SWP 142 and SWP 149 with cluster number; the midseason SWP (163–205) measurements; and the three final SWP measurements of the season (219–233). Vectors that form a 90° angle between them show no correlation, and this is demonstrated in Figure 6, among others, by the LAI variables for the second half of the season showing low correlations to the wine quality parameters. When the angle between the vectors approaches 180°, the vectors are negatively correlated. In the current dataset, this was the case for: SWP 226 and the LAI variables for the first half of the 2017 growing season as well as yield and SWP 191; a negative correlation between most of the wine quality variables and SWP 142, 149 and cluster number; and the LAI variables for the last half of the season vs. SWP of the last half of the season.

4. Discussion

Global warming poses great challenges to viticulture. In the northern hemisphere, under a Mediterranean climate, the last phase of grape ripening (Stage III) mostly occurs during the hottest months of July and August. One of the approaches to deal with the high temperatures is to delay the onset of bud break, assuming that postponing the starting point (bud break) will result in a delay of maturation at the end of the growing season. Previous studies that applied the late shoot pruning (LSP) technique to vineyards revealed significant changes to the phenological development of the vine [37,38,40,48,49,50,51]. In the current research, LSP caused a temporary delay of the phenological development, mainly from bud break until veraison (Figure 2).
In cooler regions, this practice was used to reduce the risk of spring frosts [52,53], as the distal buds inhibit the development of the basal (target) buds. With spring frost, the upper distal shoots become damaged, while the target buds are protected under the scales. After removing most of the cane and all the shoots arising from the distal buds, the target buds are ‘released’ and the ‘desired’ bud break occurs. In Barossa Valley, Australia (Winkler index 4), the LSP of Shiraz vines at the time when two to three leaves emerged led to a delay of bud break by 2–4 weeks, which diminished to 1–2 weeks during veraison [37].
TSS accumulation in the berries was delayed by 1–2 weeks. In our study the delay of the vegetative and phenological development of the LSP treatments faded close to veraison (Figure 2 and Figure 3). Thus, the treatments were not effective in delaying the harvest date to cooler conditions (Table 3). However, LSP led to an improved water status of the vines (Figure 4 and Figure 5), which may be explained by delayed canopy development (Figure 3), and lower utilization of available soil water. Vine water consumption was shown to increase linearly with LAI in a Cabernet Sauvignon vineyard in Israel [54]. When examining the relative effects of meteorological variables and LAI, it was recently shown that LAI contributed between 62 and 86% to crop evapotranspiration [55]. A unique phenomenon was observed in the WP treatment during the middle-end of the 2017 season, less pronouncedly during 2016 and 2018. The unexpected improvement in midday stem water potential values of WP around harvest (Figure 4 and Figure 5c) can be explained by the severe dehydration of the leaves of this treatment (Table S1). The reduction in the number of transpiring leaves was not obvious from the seasonal LAI curve (Figure 3b) due to the fact that dehydrated leaves still ‘contributed’ to LAI values, even though they were no longer transpiring. We assume that leaf dehydration in this treatment was associated with its high crop load.
The diurnal CO2 assimilation rate of the LSP treatments was higher than the rate of the WP treatments (Figure 5d–f), especially in the first two measurement days. This could be explained by the enhanced physiological performance of the younger leaves of the LSP vines (up to three weeks younger in the LSP3 vines), as was also found by others [56,57], and to the improved plant water status of those treatments (Figure 3).
The fruit yield of the WP treatment in 2017 and 2018 was 55–50% lower than in 2016 (Table 2). This can be attributed to the severe leaf dehydration that occurred in this treatment during 2017 (Table S1), which resulted in prolonged damage to the vines and a legacy effect in 2018. As stated above, reduction in the number of transpiring leaves was most likely associated with the high crop load, which manifested itself in high cluster mass, but with no change in the number of clusters. In all other treatments, fruit yield was rather consistent, with little difference in yield between the years. Generally, yield decreased from LSP1 to LSP3, and LSP1 had similar yields to WP + T. A decrease in yield of LSP-treated vines was reported by Parkin (1980) in Australia, while Friend and Trought (2007) reported an increase in the yield following LSP treatments of Merlot vines in New Zealand. It was postulated that the late pruning delayed flowering and fruit set to more favorable environmental conditions in this temperate area, resulting in a larger percentage of large seeded berries. In Shiraz vines in Australia, fruit yield did not differ between late pruning (at three apparent leaves) and winter pruning during three out of four seasons [37]. In our study, the yield decreased with the delay of pruning (Table 2), which was mainly derived by the reduction in the number of clusters, as also recorded in the LSP of Shiraz vines in Australia [9]. Two possible explanations can be provided for this phenomenon. One is related to the fact that the later the vines are pruned, the fewer buds are left (Materials and Methods, Figure 1) and fewer cluster-bearing shoots are developed. The second explanation is related to the fact that basal buds are usually less fruitful than distal buds [58]. Probably a combination of both explanations led to the end result—fewer clusters in the LSP treatments. Similarly, research conducted on ‘Chardonnay’, ‘French Colombard’ and ‘Carignan’ grown in the same vineyard as the ‘Malbec’ in the current study concluded that late pruning in the middle of spring resulted in significantly lower yield compared to pruning during winter and early spring [35].
As far as we know, this is the first study to address not only the grapevine and yield performance but also several parameters of wine quality obtained as a result of LSP. In our view, the main implication of this method is the ability to significantly improve the quality of the wine, at least in warm climatic conditions. These findings are important in light of climate change and the multiplicity of heatwaves. In addition, there is also a positive impact concerning labor. The natural cluster dilution resulting from the LSP treatment saves manpower and working hours. However, further studies are needed to verify the findings of this study for other cultivars.
The LSP treatments delayed the onset and progress of sugar accumulation (detailed data not shown) and of the decrease in total acidity in grapes. This effect was enhanced by the delay in pruning time and was most pronounced in the LSP3 treatment. Similar trends were also reported by Moran et al. (2017). Maturation occurred earliest in the WP + T control and latest in the WP control, the latter of which also ended with lower sugar content as a result of the high crop yield compared to all the other treatments (Table 3). In the 2017 season, a number of unique phenomena related to the WP treatment were recorded. Midday SWP exceeded the value of −1.6 MPa along with relatively high yield accompanied by severe leaf dehydration (Table S1). This undesirable combination led to an inhibited pattern of sugar accumulation combined with an accelerated increase in pH (data not presented). We suspect that the cause is a harsh competition between yield and vegetative development, or to be more precise, a more limited hydraulic system. Further research needs to be conducted in order to confirm or reject this hypothesis.
The anthocyanin content in the must at harvest was significantly higher in the LSP treatments compared to the WP and WP + T in 2016 and higher than WP in 2017 (Table 3). The coloration scores of the finished wines showed similar trends, with the best CI levels for LSP3, LSP2 and LSP3 for the years 2016, 2017 and 2018, respectively (Table 5). Similar results were also demonstrated by others [25,26]. The high content of anthocyanins as well as higher total phenolics in the LSP treatments could have been a result of the lower number of clusters per vine in those treatments, leading to the allocation of more assimilates to each cluster, and/or the better exposure of the clusters to sunlight due to the more compact canopy, which may lead to Myb-mediated higher accumulation of flavonols and anthocyanins [59]. In addition, slightly improved CO2 assimilation rates of the younger canopy of the LSP-treated vines can also contribute to better overall performance, leading to a higher accumulation of secondary metabolites.
The higher phenolic content of the musts and wines of the LSP treatments, and possibly other secondary metabolites affecting wine quality, was expressed by the total phenolic scores of the finished wines and as improved organoleptic scores of the wines (Table 5). In 2017, the score of the wine produced from LSP1 vines was significantly higher than that of WP + T, although the vines of those two treatments had similar crop yields. Thus, it can be concluded that the LSP treatment contributed to the quality of the wine not only by its yield thinning effect.
The interrelations among the different attributes, as reflected in the PCA, display a clear separation among the LSP treatments and the control groups. The variability of the quality characteristics was strongly associated with the LSP treatments rather than with the WP treatments. The variability of LAI at the beginning of the season was highly explained by the WP and WP + T treatments, as during these phases, the LSP treatments showed great changes in the canopy area due to the pruning application of the treatments. As the season progressed, the LAI values of all treatments became similar. The PCA biplot (Figure 6) shows that for these dates (mid- and late-season), there was no specific association between LAI values and individual treatments, as all treatments displayed a similar state of canopy area. As with LAI patterns, SWP during the early season was more associated with WP and WP + T controls, while late-season SWP levels were related to the LSP treatments. In general, the LAI measurements were able to describe the largest portion of variability of the dataset (Figure S1, PC2), followed by the factors that compose wine quality (Figure S1, PC1), specifically color intensity, taste intensity and the total score.

5. Conclusions

Late shoot pruning is an easy-to-practice, agro-technical procedure that enables vine growers to cope with hot and dry conditions or with frost in cooler growing regions. This study suggests that the practice has positive effects on vine physiology and the quality of the wine compared to standard winter pruning treatments (with and without cluster thinning) in ‘Malbec’ grapevine. LSP affected the phenological development, canopy area, gas exchange parameters and stem water potential in a manner that positively impacted the quality of the must and wine produced from these vines.

Supplementary Materials

The following supporting information can be downloaded at: https://www.mdpi.com/article/10.3390/agriculture12050605/s1, Figure S1: The barplots show the extent of variability explained by each attribute in the first three components (PCs 1-3); Table S1: Percent of dehydrated leaves at 2017 (n = 4). The evaluation was performed a week before harvest. The different letters indicate statistically significant differences (α = 0.05) among the treatments for each variable, based on one-way ANOVA followed by post-hoc TukeyHSD test.

Author Contributions

Conceptualization, Y.N., G.H. and A.F.; methodology, Y.N., G.H., J.M.G. and G.N.; software, N.O.-L.; validation, Y.N.; formal analysis, N.O.-L.; investigation, Y.N., Y.S., M.H., D.F.-M., E.D., M.S. and A.F.; resources, Y.N.; data curation, N.O.-L. and S.M.; writing—original draft preparation, Y.N., G.N., Y.S. and M.H.; writing—review and editing, all the authors; visualization, Y.S., S.M. and N.O.-L.; supervision, Y.N.; project administration, Y.N.; funding acquisition, Y.N. All authors have read and agreed to the published version of the manuscript.

Funding

This research was funded by Ministry of Agriculture, Israel grant number: 31-01-0017.

Institutional Review Board Statement

Not applicable for studies not involving humans or animals.

Informed Consent Statement

Not applicable.

Acknowledgments

A special thanks to Oren Shleif for the initial support and drive of this research. We thank Avner Yonatcha and Meir Aqua for allowing us to perform this research in their vineyard and Nir Chen for wine preparations and quality analysis. Our deep appreciation goes to Tom Dotan, Guy Aharon, Alon Katz, Shachak Nesharim, Yael Sewid, Roni Michaelovsky, Yossi Shteren, Matan Golomb, Itamar Netzer, and Shilo Netzer for assisting in the field measurements.

Conflicts of Interest

The authors declare no conflict of interest.

References

  1. Winkler, A.J.; Cook, J.A.; Kliewer, W.M.; Lider, L.A. General Viticulture, 2nd ed.; University of California Press: Berkeley, CA, USA, 1974. [Google Scholar]
  2. Palliotti, A.; Gatti, M.; Lanari, V.; Silvestroni, O.; Tombesi, S.; Poni, S.; Silvestroni, O.; Lanari, V.; Gatti, M.; Poni, S. Changes in vineyard establishment and canopy management urged by earlier climate-related grape ripening: A review. Sci. Hortic. 2014, 178, 43–54. [Google Scholar] [CrossRef]
  3. Frioni, T.; Pirez, F.J.; Diti, I.; Ronney, L.; Poni, S.; Gatti, M. Post-budbreak pruning changes intra-spur phenology dynamics, vine productivity and berry ripening parameters in Vitis vinifera L. cv. ‘Pinot Noir’. Sci. Hortic. 2019, 256, 108584. [Google Scholar] [CrossRef]
  4. Bonada, M.; Sadras, V.; Moran, M.; Fuentes, S. Elevated temperature and water stress accelerate mesocarp cell death and shrivelling, and decouple sensory traits in Shiraz berries. Irrig. Sci. 2013, 31, 1317–1331. [Google Scholar] [CrossRef]
  5. Jones, G.; Davis, R. Climate influences on grapevine phenology, grape composition, and wine production and quality for Bordeaux, France. Am. J. Enol. Vitic. 2000, 51, 249–261. [Google Scholar] [CrossRef]
  6. Kizildeniz, T.; Mekni, I.; Santesteban, H.; Pascual, I.; Morales, F.; Irigoyen, J.J. Effects of climate change including elevated CO2 concentration, temperature and water deficit on growth, water status, and yield quality of grapevine (Vitis vinifera L.) cultivars. Agric. Water Manag. 2015, 159, 155–164. [Google Scholar] [CrossRef] [Green Version]
  7. Martínez-Lüscher, J.; Kizildeniz, T.; Vucetic, V.; Dai, Z.; Luedeling, E.; van Leeuwen, C.; Gomès, E.; Pascual, I.; Irigoyen, J.J.; Morales, F.; et al. Sensitivity of grapevine phenology to water availability, temperature and CO2 concentration. Front. Environ. Sci. 2016, 4, 48. [Google Scholar] [CrossRef]
  8. Parra, C.S.; Aguirreolea, J.; Sánchez-Díaz, M.; Irigoyen, J.J.; Morales, F. Effects of climate change scenarios on Tempranillo grapevine (Vitis vinifera L.) ripening: Response to a combination of elevated CO2 and temperature, and moderate drought. Plant Soil 2010, 337, 179–191. [Google Scholar] [CrossRef]
  9. Petrie, P.R.; Brooke, S.J.; Moran, M.A.; Sadras, V.O. Pruning after budburst to delay and spread grape maturity. Aust. J. Grape Wine Res. 2017, 23, 378–389. [Google Scholar] [CrossRef]
  10. Martínez-Moreno, A.; Sanz, F.; Yeves, A.; Gil-Muñoz, R.; Martínez, V.; Intrigliolo, D.S.; Buesa, I. Forcing bud growth by double-pruning as a technique to improve grape composition of Vitis vinifera L. cv. Tempranillo in a semi-arid Mediterranean climate. Sci. Hortic. 2019, 256, 108614. [Google Scholar] [CrossRef]
  11. Cus, F.; Korosec Koruza, Z.; Koruza, B.; Lavrencic, P. Influence of crop load and cultivar’s dependent canopy management on grape must quality of “sipon”, “zametovka”, and “rebula”. Acta Hortic. 2004, 652, 141–146. [Google Scholar] [CrossRef]
  12. Senthilkumar, S.; Vijayakumar, R.; Soorianathasundaram, K.; Durga Devi, D. Effect of Pruning Severity on V egetative, Physiological, Yield and Quality Attributes in Grape (Vitis vinifera L.): A Review. Curr. Agric. Res. J. 2015, 3, 42–54. [Google Scholar] [CrossRef]
  13. Bravdo, B.; Hepner, Y.; Loinger, C.; Cohen, S.; Tabacman, H. Effect of Crop Level and Crop Load on Growth, Yield, Must and Wine Composition, and Quality of Cabernet Sauvignon. Am. J. Enol. Vitic. 1985, 36, 125–131. [Google Scholar]
  14. Dai, Z.W.; Vivin, P.; Robert, T.; Milin, S.; Li, S.H.; Ǵnard, M. Model-based analysis of sugar accumulation in response to sourcesink ratio and water supply in grape (Vitis vinifera) berries. Funct. Plant Biol. 2009, 36, 527–540. [Google Scholar] [CrossRef]
  15. Munitz, S.; Netzer, Y.; Schwartz, A. Sustained and regulated deficit irrigation of field grown Merlot grapevines. Aust. J. Grape Wine Res. 2017, 23, 87–94. [Google Scholar] [CrossRef]
  16. Netzer, Y.; Munitz, S.; Shtein, I.; Schwartz, A. Structural memory in grapevines: Early season water availability affects late season drought stress severity. Eur. J. Agron. 2019, 105, 96–103. [Google Scholar] [CrossRef]
  17. Shtein, I.; Hayat, Y.; Munitz, S.; Harcavi, E.; Akerman, M.; Drori, E.; Schwartz, A.; Netzer, Y. From structural constraints to hydraulic function in three Vitis rootstocks. Trees Struct. Funct. 2017, 31, 851–861. [Google Scholar] [CrossRef]
  18. Gerzon, E.; Biton, I.; Yaniv, Y.; Zemach, H.; Netzer, Y.; Schwartz, A.; Fait, A.; Ben-Ari, G. Grapevine anatomy as a possible determinant of isohydric or anisohydric behavior. Am. J. Enol. Vitic. 2015, 66, 340–347. [Google Scholar] [CrossRef]
  19. Van Leeuwen, C.; Tregoat, O.; Chone, X.; Bois, B.; Pernet, D.; Gaudillere, J.P. Vine water status is a key factor in grape ripening and vintage quality for red bordeaux wine. How can it be assessed for vineyard management purposes? J. Int. Des. Sci. La Vigne Du Vin 2009, 43, 121–134. [Google Scholar] [CrossRef]
  20. Drori, E.; Rahimi, O.; Henig, Y.; Lorenzi, S.; Brauner, H.; Marrano, A.; Amar, Z.; Netzer, Y.; Failla, O.; Grando, M.S.S. Ampelographic and genetic characterization of an initial Israeli grapevine germplasm collection. Vitis J. Grapevine Res. 2015, 54, 107–110. [Google Scholar]
  21. Cavagnaro, J.B.; Ponce, M.T.; Guzmán, J.; Cirrincione, M.A. Argentinean cultivars of Vitis vinifera grow better than European ones when cultured in vitro under salinity. Biocell 2006, 30, 1–7. [Google Scholar] [CrossRef]
  22. Vivier, M.A.; Pretorius, I.S. Genetically tailored grapevines for the wine industry. Trends Biotechnol. 2002, 20, 472–478. [Google Scholar] [CrossRef]
  23. Keller, M.; Mills, L.J.; Wample, R.L.; Spayd, S.E. Cluster Thinning Effects on Three Deficit-Irrigated Vitis vinifera Cultivars. Am. J. Enol. Vitic. 2005, 2, 91–103. [Google Scholar]
  24. Naor, A.; Gal, Y.; Bravdo, B. Crop load affects assimilation rate, stomatal conductance, stem water potential and water relations of field-grown Sauvignon blanc grapevines. J. Exp. Bot. 1997, 48, 1675–1680. [Google Scholar] [CrossRef] [Green Version]
  25. Guidoni, S.; Allara, P.; Schubert, A. Effect of cluster thinning on berry skin anthocyanin composition of Vitis vinifera cv. Nebbiolo. Am. J. Enol. Vitic. 2002, 53, 224–226. [Google Scholar]
  26. Petrie, P.R.; Clingeleffer, P.R. Crop thinning (hand versus mechanical), grape maturity and anthocyanin concentration: Outcomes from irrigated Cabernet Sauvignon (Vitis vinifera L.) in a warm climate. Aust. J. Grape Wine Res. 2006, 12, 21–29. [Google Scholar] [CrossRef]
  27. Xi, X.J.; Zha, Q.; Jiang, A.L.; Tian, Y.H. Stimulatory effect of bunch thinning on sugar accumulation and anthocyanin biosynthesis in Shenhua grape berry (Vitis vinifera × V. labrusca). Aust. J. Grape Wine Res. 2018, 24, 158–165. [Google Scholar] [CrossRef]
  28. Kliewer, W.M.; Dokoozlian, N.K. Leaf Area/Crop Weight Ratios of Grapevines: Influence on Fruit Composition and Wine Quality. Am. J. Enol. Vitic. 2005, 2, 170–181. [Google Scholar]
  29. Jackson, D.I.; Lombard, P.B.; Kabinett, L.Q. Environmental and management practices affecting grape composition and wine quality—A review. Am. J. Enol. Vitic. 1993, 44, 409–430. [Google Scholar]
  30. Reynolds, A.G.; Edwards, C.G.; Wardle, D.A.; Webster, D.; Dever, M. Shoot density affects “Riesling” grapevines. II.Wine composition and sensory response. J. Am. Soc. Hortic. Sci. 1994, 119, 881–892. [Google Scholar] [CrossRef] [Green Version]
  31. Sinton, T.H.; Ough, C.S.; Kissler, J.J.; Kasimatis, A.N. Grape Juice Indicators for Prediction of Potential Wine Quality. I. Relationship Between Crop Level, Juice and Wine Composition, and Wine Sensory Ratings and Scores. Am. J. Enol. Vitic. 1978, 29, 267–271. [Google Scholar]
  32. Bravdo, B.; Hepner, Y.; Cohen, S.; Tabacman, H. Effect of crop level on growth, yield and wine quality of a high yielding Carignane vineyard. Am. J. Enol. Vitic. 1984, 35, 247–252. [Google Scholar]
  33. Bindon, K.A.; Dry, P.R.; Loveys, B.R.; Osmond, G.; Campus, W.; Unit, H.; Rooyen, V. The Interactive Effect of Pruning Level and Irrigation Strategy on Water Use Efficiency of. Development 2008, 29, 59–70. [Google Scholar]
  34. Holt, H.E.; Francis, I.L.; Field, J.; Herderich, M.J.; Iland, P.G. Relationships between berry size, berry phenolic composition and wine quality scores for Cabernet Sauvignon (Vitis vinifera L.) from different pruning treatments and different vintages. Aust. J. Grape Wine Res. 2008, 14, 191–202. [Google Scholar] [CrossRef]
  35. Nir, G. The effects of pruning date on bud break and yield of 4 wine grape varieties in 4 seasons at the Southern inner plain of Israel. Alon Hanotea 2019, 6, 50–56. [Google Scholar]
  36. Svoray, T.; Hassid, I.; Atkinson, P.M.; Moebius-Clune, B.N.; van Es, H.M. Mapping Soil Health over Large Agriculturally Important Areas. Soil Sci. Soc. Am. J. 2015, 79, 1420. [Google Scholar] [CrossRef]
  37. Moran, M.A.; Sadras, V.O.; Petrie, P.R. Late pruning and carry-over effects on phenology, yield components and berry traits in Shiraz. Aust. J. Grape Wine Res. 2017, 23, 390–398. [Google Scholar] [CrossRef]
  38. Frioni, T.; Tombesi, S.; Silvestroni, O.; Lanari, V.; Bellincontro, A.; Sabbatini, P.; Gatti, M.; Poni, S.; Palliotti, A. Postbudburst spur pruning reduces yield and delays fruit sugar accumulation in sangiovese in central Italy. Am. J. Enol. Vitic. 2016, 67, 419–425. [Google Scholar] [CrossRef]
  39. Parkin, R. Late pruning improves wine quality. Agric. Gaz. N. South Wales 1980, 91, 36–37. [Google Scholar]
  40. Friend, A.P.; Trought, M.C.T. Delayed winter spur-pruning in New Zealand can alter yield components of Merlot grapevines. Aust. J. Grape Wine Res. 2007, 13, 157–164. [Google Scholar] [CrossRef]
  41. van Es, H.M.; Gomes, C.P.; Sellmann, M.; van Es, C.L. Spatially-Balanced Complete Block designs for field experiments. Geoderma 2007, 140, 346–352. [Google Scholar] [CrossRef]
  42. Lorenz, D.H.; Eichorn, K.W.; Bleiholder, H.; Klose, R.; Meir, U.; Weber, E. Growth Stages of the Grapevine: Phenological growth stages of the grapevine (Vitis vinifera L. ssp. vinifera)—Codes and descriptions according to the extended BBCH scale. Aust. J. Grape Wine Res. 1995, 1, 100–103. [Google Scholar] [CrossRef]
  43. Munitz, S.; Schwartz, A.; Netzer, Y. The effect of irrigation initiation timing on vegetative growth, physiology and yield parameters in “Cabernet Sauvignon” grapevines. Aust. J. Grape Wine Res. 2020, 26, 220–232. [Google Scholar] [CrossRef]
  44. International Organisation of Vine and Wine; Organisation, I. OIV Standard for International Wine Competitions and Spiritous Beverages of Vitivinicultural Origin (OIV-Concours 332A-2009). Available online: https://www.oiv.int/public/medias/7895/oiv-patronage-competition-norme-ed-2021.pdf (accessed on 13 February 2022).
  45. Hotelling, H. Analysis of a complex of statistical variables into principal components. J. Educ. Psychol. 1933, 24, 417–441. [Google Scholar] [CrossRef]
  46. Jolliffe, I. Principal Component Analysis. In International Encyclopedia of Statistical Science; Springer: Berlin/Heidelberg, Germany, 2011; pp. 1094–1096. [Google Scholar]
  47. Gabriel, K.R. The biplot graphic display of matrices with application to principal component analysis. Biometrika 1971, 58, 453–467. [Google Scholar] [CrossRef]
  48. Silvestroni, O.; Lanari, V.; Lattanzi, T.; Palliotti, A. Delaying winter pruning, after pre-pruning, alters budburst, leaf area, photosynthesis, yield and berry composition in Sangiovese (Vitis vinifera L.). Aust. J. Grape Wine Res. 2018, 24, 478–486. [Google Scholar] [CrossRef]
  49. Gatti, M.; Pirez, F.J.; Chiari, G.; Tombesi, S.; Palliotti, A.; Merli, M.C.; Poni, S. Phenology, Canopy Aging and Seasonal Carbon Balance as Related to Delayed Winter Pruning of Vitis vinifera L. cv. Sangiovese Grapevines. Front. Plant Sci. 2016, 7, 659. [Google Scholar] [CrossRef] [Green Version]
  50. Zheng, W.; García, J.; Balda, P.; De Toda, F.M. Effects of late winter pruning at different phenological stages on vine yield components and berry composition in la Rioja, north-central Spain. J. Int. Des. Sci. La Vigne Du Vin 2017, 51, 363–372. [Google Scholar] [CrossRef]
  51. Gatti, M.; Pirez, F.J.; Frioni, T.; Squeri, C.; Poni, S. Calibrated, delayed-cane winter pruning controls yield and significantly postpones berry ripening parameters in Vitis vinifera L. cv. Pinot Noir. Aust. J. Grape Wine Res. 2018, 24, 305–316. [Google Scholar] [CrossRef]
  52. Friend, A.P.; Trought, M.C.T.; Stushnoff, C.; Wells, G.H. Effect of delaying budburst on shoot development and yield of Vitis vinifera L. Chardonnay “Mendoza” after a spring freeze event. Aust. J. Grape Wine Res. 2011, 17, 378–382. [Google Scholar] [CrossRef]
  53. Howell, G.S.; Wolpert, J.A. Nodes per cane, primary bud phenology, and spring freeze damage to concord grapevines: A preliminary note. Am. J. Enol. Vitic. 1978, 29, 229–232. [Google Scholar]
  54. Munitz, S.; Schwartz, A.; Netzer, Y. Water consumption, crop coefficient and leaf area relations of a Vitis vinifera cv. “Cabernet Sauvignon” vineyard. Agric. Water Manag. 2019, 219, 86–94. [Google Scholar] [CrossRef]
  55. Ohana-Levi, N.; Munitz, S.; Ben-Gal, A.; Schwartz, A.; Peeters, A.; Netzer, Y. Multiseasonal grapevine water consumption—Drivers and forecasting. Agric. For. Meteorol. 2020, 280, 107796. [Google Scholar] [CrossRef]
  56. Poni, S.; Intrieri, C.; Silvestroni, O. Interactions of LeafAge, Fruiting, and Exogenous Cytokinins in Sangiovese Grapevines Under Non-Irrigated Conditions. I. Gas Exchange. Am. J. Enol. Vitic. 1994, 45, 71–78. [Google Scholar]
  57. Kriedemann, P.; Kliewer, W.; Harris, J. Leaf age and photosynthesis in Vitis vinifera L. Vitis 1970, 104, 97–104. [Google Scholar]
  58. Khanduja, S.D.; Balasubrahmanyam, V.R. Fruitfulness of grape vine buds. Econ. Bot. 1972, 26, 280–294. [Google Scholar] [CrossRef]
  59. Matus, J.T.; Loyola, R.; Vega, A.; Peña-Neira, A.; Bordeu, E.; Arce-Johnson, P.; Alcalde, J.A. Post-veraison sunlight exposure induces MYB-mediated transcriptional regulation of anthocyanin and flavonol synthesis in berry skins of Vitis vinifera. J. Exp. Bot. 2009, 60, 853–867. [Google Scholar] [CrossRef] [Green Version]
Figure 1. Late shoot pruning method applied to ‘Malbec’ grapevines, adjustments of different pruning according to bud development: (a) similar to winter pruning—retaining two dormant buds per spur; (b) pruning below bud number 2; (c) pruning below bud number 1.
Agriculture 12 00605 g001
Figure 2. Seasonal pattern of phenological development of Malbec vines exposed to different pruning treatments in 2016 (a), 2017 (b) and 2018 (c) growing seasons. The lower horizontal dotted line represents phenological stage 19, the beginning of flowering. The upper horizontal dotted line represents phenological stage 35, veraison. The late shoot pruning treatments (LSP) 1, 2 and 3 were pruned 1, 2 and 3 weeks after bud break, respectively. WP and WP + T are the winter pruning (WP) and WP plus cluster thinning controls, respectively.
Agriculture 12 00605 g002
Figure 3. Seasonal pattern of leaf area index (LAI) of ‘Malbec’ vines exposed to different pruning treatments during 2016 (a), 2017 (b) and 2018 (c) growing seasons. Each point is the mean of four replicates ± SE. The value of each replicate was the average of the measurements of three representative sampled vines per plot.
Agriculture 12 00605 g003
Figure 4. Seasonal pattern of midday stem water potential (SWP) of ‘Malbec’ vines exposed to different pruning treatments during 2016 (a), 2017 (b) and 2018 (c) growing seasons. Each point is the mean of four replicates ± SE. The value of each replicate was the average of the measurements of three sampled vines per plot.
Agriculture 12 00605 g004
Figure 5. Diurnal pattern of net assimilation rate (ac), stomatal conductance (df) and stem water potential of ‘Malbec’ vines exposed to different pruning treatments in 2017. Measurements were taken on the day before irrigation was applied on May 29 (a,d,g), July 10 (b,e,h) and August 14 (c,f,i). Each point is the mean of four replicates ± SE. The value of each replicate was the average of the measurements of three vines per plot.
Agriculture 12 00605 g005
Figure 6. A biplot showing the principal component analysis results of the first two components (PC1 and PC2) for the 2017 growing season attributes of ‘Malbec’ grapevine. The ellipses indicate a level of 0.6 probability of the different treatments.
Agriculture 12 00605 g006
Table 1. Pruning treatments, abbreviations and dates of treatment performance (and Julian day of year). Vitis vinifera cv. Malbec, Ayalon valley, Israel, 2016–2018.
TreatmentsAbbreviationDate of Pruning 2016 (DOY)Date of Pruning 2017 (DOY)Date of Pruning 2018 (DOY)
Late shoot pruning 1
(one week after bud break)
LSP127 March 2016 (86)4 April 2017 (95)15 March 2018 (74)
Late shoot pruning 2
(two weeks after bud break)
LSP23 April 2016 (93)10 April 2017 (101)22 March 2018 (81)
Late shoot pruning 3
(three weeks after bud break)
LSP310 April 2016 (100)17 April 2017 (108)29 March 2018 (88)
Standard winter pruning and shoot and cluster thinningWP + T17 February 2016 (48)19 February 2017 (50)20 February 2018 (51)
Standard winter pruningWP17 February 2016 (48)19 February 2017 (50)20 February 2018 (51)
Table 2. Crop yield and its components, of ‘Malbec’ vine, 2016–2018. Different letters indicate statistically significant differences (α = 0.05) among the treatments for each variable, based on one-way ANOVA followed by post-hoc Tukey HSD test, while each season was analyzed separately.
TreatmentsYield
(kg per Vine)
Clusters
(No per Vine)
Cluster Mass
(g)
Berry Mass
(g)
Berries
(Per Cluster)
2016
LSP17.7 b46.5 b168.2 a1.37 a123.0 ab
LSP25.4 bc36.7 bc144.2 a1.27 ab114.8 ab
LSP34.2 c30.5 c139.2 a1.40 a100.7 b
WP + T7.5 b51.0 b148.2 a1.22 ab123.1 ab
WP14.4 a87.7 a164.2 a1.17 b140.8 a
2017
LSP17.43 ab62.5 b120.1 b1.46 a82.5 b
LSP25.07 b46.5 bc108.6 b1.44 a75.5 b
LSP35.10 b49.3 bc104.2 b1.29 a81.0 b
WP + T7.88 a44.1 c182.1 a1.66 a109.0 a
WP9.26 a84.2 a109.9 b1.51 a75.0 b
2018
LSP17.53 a63 ab120.2 b1.43 ab84 ab
LSP26.28 ab55 bc116 b1.5 ab77 b
LSP34.73 b38 c123.2 b1.57 a79 b
WP + T7.76 a55 bc142.2 a1.34 ab110 a
WP7.23 ab76 a94.6 b1.26 b76 b
Table 3. Date and Day of Year (DOY) of first and last harvest of each replicate. ‘Malbec’ grape must components at the harvest date of each treatment (2016) and average of replicates (2017, 2018). The different letters indicate statistically significant differences (α = 0.05) among the treatments for each variable, based on one-way ANOVA followed by post-hoc Tukey HSD test.
TreatmentsDate of First HarvestDate of Last HarvestTSS (°Brix)pHTitratable Acidity (g L−1)Absorbance Units (518 nm)
2016
LSP125 August (238)-23.2 a3.51 bc5.6 a23.30 b
LSP225 August (238)-22.7 a3.49 c5.8 a25.40 ab
LSP31 September (245)-24.0 a3.65 ab5.5 a28.50 a
WP + T18 August (231)-23.6 a3.68 a4.0 b17.35 c
WP1 September (245)-22.4 a3.72 a3.8 b17.03 c
2017
LSP131 August (243)26 September (269)22.5 a3.45 b5.4 cb12.79 ab
LSP224 August (236)31 August (243)23.4 a3.50 b5.9 b15.12 a
LSP3-26 September (269)20.3 b3.40 b6.9 a14.42 ab
WP + T24 August (236)26 September (269)23.4 a3.7 a4.1 d13.91 ab
WP-26 September (269)19.0 b3.46 a4.8 c9.24 b
2018
LSP122 August (234)29 August (241)23.14 ab3.54 a--
LSP215 August (227)29 August (241)23.54 a3.54 a--
LSP315 August (227)29 August (241)24.08 a3.60 a--
WP + T22 August (234)5 September (248)22.94 ab3.58 a--
WP22 August (234)5 September (248)21.50 b3.57 a--
Table 4. Sensorial evaluation of total wine score (modified OIV score sheet for dry red wines) of the 2016 (one sample per treatment) and 2017, 2018 (n = 4) ‘Malbec’ wines produced by using micro-vinification protocol. The different letters indicate statistically significant differences (α = 0.05) among the treatments for each variable based on one-way ANOVA followed by post-hoc Tukey HSD test.
Treatment201620172018
LSP187.386.5 a86.5 a
LSP287.584.8 ab85.3 ab
LSP386.085.8 ab87.0 a
WP + T84.284.0 bc85.2 ab
WP80.081.7 c84.3 b
Table 5. Wine color and polyphenols parameters of 2016 (n = 1), 2017, 2018 (n = 4) ‘Malbec’ wines produced using a micro-vinification protocol. Yellow, red and blue colorations were measured by spectrometer at 420, 520 and 620 nm, respectively. Color intensity (CI) was calculated as the sum of all 3 wavelengths. Color hue (CH) is the ratio of 420:520 nm absorptions. Total phenolics were measured by spectrometer at 280 nm. The different letters indicate statistically significant differences (α = 0.05) among the treatments for each variable based on one-way ANOVA followed by post-hoc Tukey HSD test.
TreatmentYellow, AURed, AUBlue, AUCI, AUCHTotal Phenolics, (as mg Gallic Acid/L)
2016
LSP15.828.962.4117.90.651618
LSP27.1011.513.1621.770.621749
LSP37.7112.713.5423.960.611657
WP + T4.506.411.8412.750.70973
WP4.326.821.7112.840.63938
2017
LSP12.58 ab3.67 ab0.83 bc7.08 bc0.70 a 1265 ab
LSP23.47 a4.95 a1.58 a10.01 a0.71 a 1419 ab
LSP32.87 a3.95 ab0.97 b7.78 ab0.72 a 1536 a
WP + T2.88 a4.43 a1.01 b8.33 ab0.65 a 1109 bc
WP1.84 b2.67 b0.48 c4.99 c0.69 a 797 c
2018
LSP13.79 a6.46 a1.46 ab11.72 ab0.59 a 1290 a
LSP24.07 a7.04 a1.62 ab12.73 ab0.71 a 1362 a
LSP34.31 a7.19 a1.80 a13.3 a0.72 a 1436 a
WP + T3.61 a6.17 a1.41 ab11.19 ab0.65 a 1321 a
WP3.32 b5.37 a1.19 b9.9 b0.69 a 1249 a
Publisher’s Note: MDPI stays neutral with regard to jurisdictional claims in published maps and institutional affiliations.

