Article

Soil Moisture Outweighs Climatic Factors in Critical Periods for Rainfed Cereal Yields: An Analysis in Spain

by
Jaime Gaona
*,
Pilar Benito-Verdugo
,
José Martínez-Fernández
,
Ángel González-Zamora
,
Laura Almendra-Martín
and
Carlos Miguel Herrero-Jiménez
Instituto de Investigación en Agrobiotecnología (CIALE), Universidad de Salamanca, 37185 Villamayor, Spain
*
Author to whom correspondence should be addressed.
Agriculture 2022, 12(4), 533; https://doi.org/10.3390/agriculture12040533
Submission received: 11 March 2022 / Revised: 4 April 2022 / Accepted: 8 April 2022 / Published: 9 April 2022
(This article belongs to the Section Ecosystem, Environment and Climate Change in Agriculture)

Abstract

:
Cereals are keystone crops for achieving food security and socioeconomic equilibrium, but rainfed cropland is highly sensitive to environmental anomalies that impact yields. The impact of soil moisture on cereal yield is particularly overlooked. This study evaluates the impact of root-zone soil moisture on yield compared to nine common climatic variables: maximum and minimum temperature, diurnal temperature range, growing degree days, accumulated rainfall, radiation, photothermal quotient, relative humidity of the air, and vapor pressure deficit. This study used the climatic database E-OBSv23 and the soil moisture databases ERA5-Land and LISFLOOD, focused on wheat and barley over the main cereal areas of Spain. Correlation analysis between annual yield and daily soil moisture and climatic data provided indicated the prevalence and concurrence of the impact factors on phenological stages of the Zadoks scale. Critical periods of impact on wheat and barley yields primarily concentrate during the growth and reproductive phases of spring. Soil moisture exceeds all other factors in magnitude and duration of influence, and our results suggest a complex interplay of factors during the critical spring period. This study highlights the preeminent role of soil moisture over climatic factors on the variability of rainfed cereal yields in water-limited areas.

1. Introduction

Cereals, as core crops that feed the world, play a fundamental part in food security [1]. Cereals are predominantly cultivated in rainfed agricultural areas comprising three-quarters of global cropland [2]. The evaluation of the variability of rainfed cereal yields due to natural hazards such as drought has been a permanent source of concern across the globe [3], but the worrisome forecasts of the impact of climate change on yields recommend intensifying their assessment [4,5]. Within the natural variability of the climate, climatic anomalies triggering droughts are particularly harmful to crops [6], especially in water-limited regions such as the Mediterranean, which are prone to recurrent droughts [7].
Water-limited environments are very exposed to fast-developing droughts [8]. These particularly impactful hazards to rainfed crops exemplify the need to evaluate short-term anomalies (below the monthly scale) of climatic variables beyond rainfall, such as temperature or radiation [9]. Hot, dry, or windy events, regardless of their eventual effect on drought evolution, often notably impact the development of crops, with negative consequences for yields. Multiple studies, both from the physiological and agricultural scope, have extensively used climatic variables to evaluate the climate impact on crop yields [10,11,12,13]. In some cases, authors support the use of variables integrating compound effects of climatic influence on plants such as the diurnal temperature range (DTR) [14] or the vapor pressure deficit (VPD) [15] while calculating growing degree days (GDD) [16] and the photothermal quotient (PTQ) [17] assist our understanding of crops’ developmental dependencies. However, very few studies have additionally considered soil moisture [18], particularly in studies of agricultural scope at regional or national scales [19,20]. The traditional focus on the impact of climatic variables on crop yield has largely overlooked the relevant role of soil moisture.
Due to the increasing availability of soil moisture data from remote-sensing missions, such as SMOS and SMAP [21,22], and modeled soil moisture products, such as LISFLOOD [23], distributed near-real-time monitoring of soil moisture is possible [24]. Multiple applications of these soil moisture datasets together with reanalysis products partly built on them have been explored not only for global validation and modeling of the hydrological cycle but also for determining the relevance of soil moisture in the monitoring of agriculture and forests [24,25]. Indeed, soil moisture data are of special value to evaluating vegetation status, as demonstrated by their inclusion in the European Drought Indicator [26]. However, among the studies focusing on the evaluation of crops, few have assessed soil moisture together with other factors [26,27,28], especially at temporal scales below a month [29] that would be suitable for the identification of critical periods of impact for the development of crops. Therefore, the influence of soil moisture on the cycle of crops and natural vegetation remains largely unexplored.
Similarly to soil moisture, but more often, multiple climatic databases have become available in recent years, enabling the analysis of the climatic impact on agriculture. Many studies have taken advantage of climatic databases to improve our understanding of the impact of climatic factors on crop yield exposed to climate variability and climate change [12,30,31,32]. However, descriptions of the impact of climatic variables on the cycle of crops are predominantly the focus of crop physiological studies [6,10,33], primarily focused on finding traits to improve crop resilience to abiotic stresses [34]. Studies analyzing the impact of soil moisture on the stages of the crop cycle have also underlined its physiological relevance [35]. Such process-based studies have defined the basis of plant dependencies on environmental factors but have a difficult application to crop monitoring considering the limited representation of controlled conditions beyond the laboratory or the plot scale. Nonetheless, remote-sensing development has successfully integrated some principles of physiological observations into plant monitoring at a large scale, such as monitoring plants using reflectance, surface temperature, and fluorescence [36]. Soil moisture is increasingly remotely sensed [21,22], and has potential for natural vegetation and crop monitoring at a large scale, transcending the barrier of applying current knowledge about soil moisture impact on crops.
This study aims to evaluate the relationship between daily soil moisture and climatic variables with the annual yields of cereals. Anticipating the potential of this type of analysis for yield monitoring, the scale of interest of the study is at a regional-to-national scale. Castilla y León (CYL) and Castilla-La Mancha (CLM) regions of Spain, due to their area (Figure 1) and production levels [37], fulfill this requirement. This study uses climatic data from the observational database E-OBSv23 [38] to evaluate nine energy- and water-related variables of potential relevance to the phenological cycle of cereals: maximum and minimum temperature, diurnal temperature range, growing degree days, radiation and photothermal quotient as energy-related variables; and accumulated rainfall, relative humidity of the air and vapor pressure deficit as water-related variables. The study assumes that the depth of plant water uptake varies during the growing season [39], and subsequently refers to the root-zone soil moisture at any time soil moisture is mentioned. The (root zone) soil moisture data are obtained from both the reanalysis database ERA5-Land [40] and the database from the distributed hydrological model LISFLOOD [23]. The Yearbook of Statistics of the Spanish Ministry of Agriculture [41] provides the annual wheat and barley yields at province and regional scales. The results provide daily time series of the R correlation coefficient and p-values between soil moisture, climatic variables, and annual cereal yields for the period 1981–2018. The analysis evaluates the environmental dependencies of crops from a phenological perspective, in reference to the phenological stages of the Zadoks [42] scale, to determine the critical period of impact of each factor and to define the relevant crop stages for yield monitoring.

2. Materials and Methods
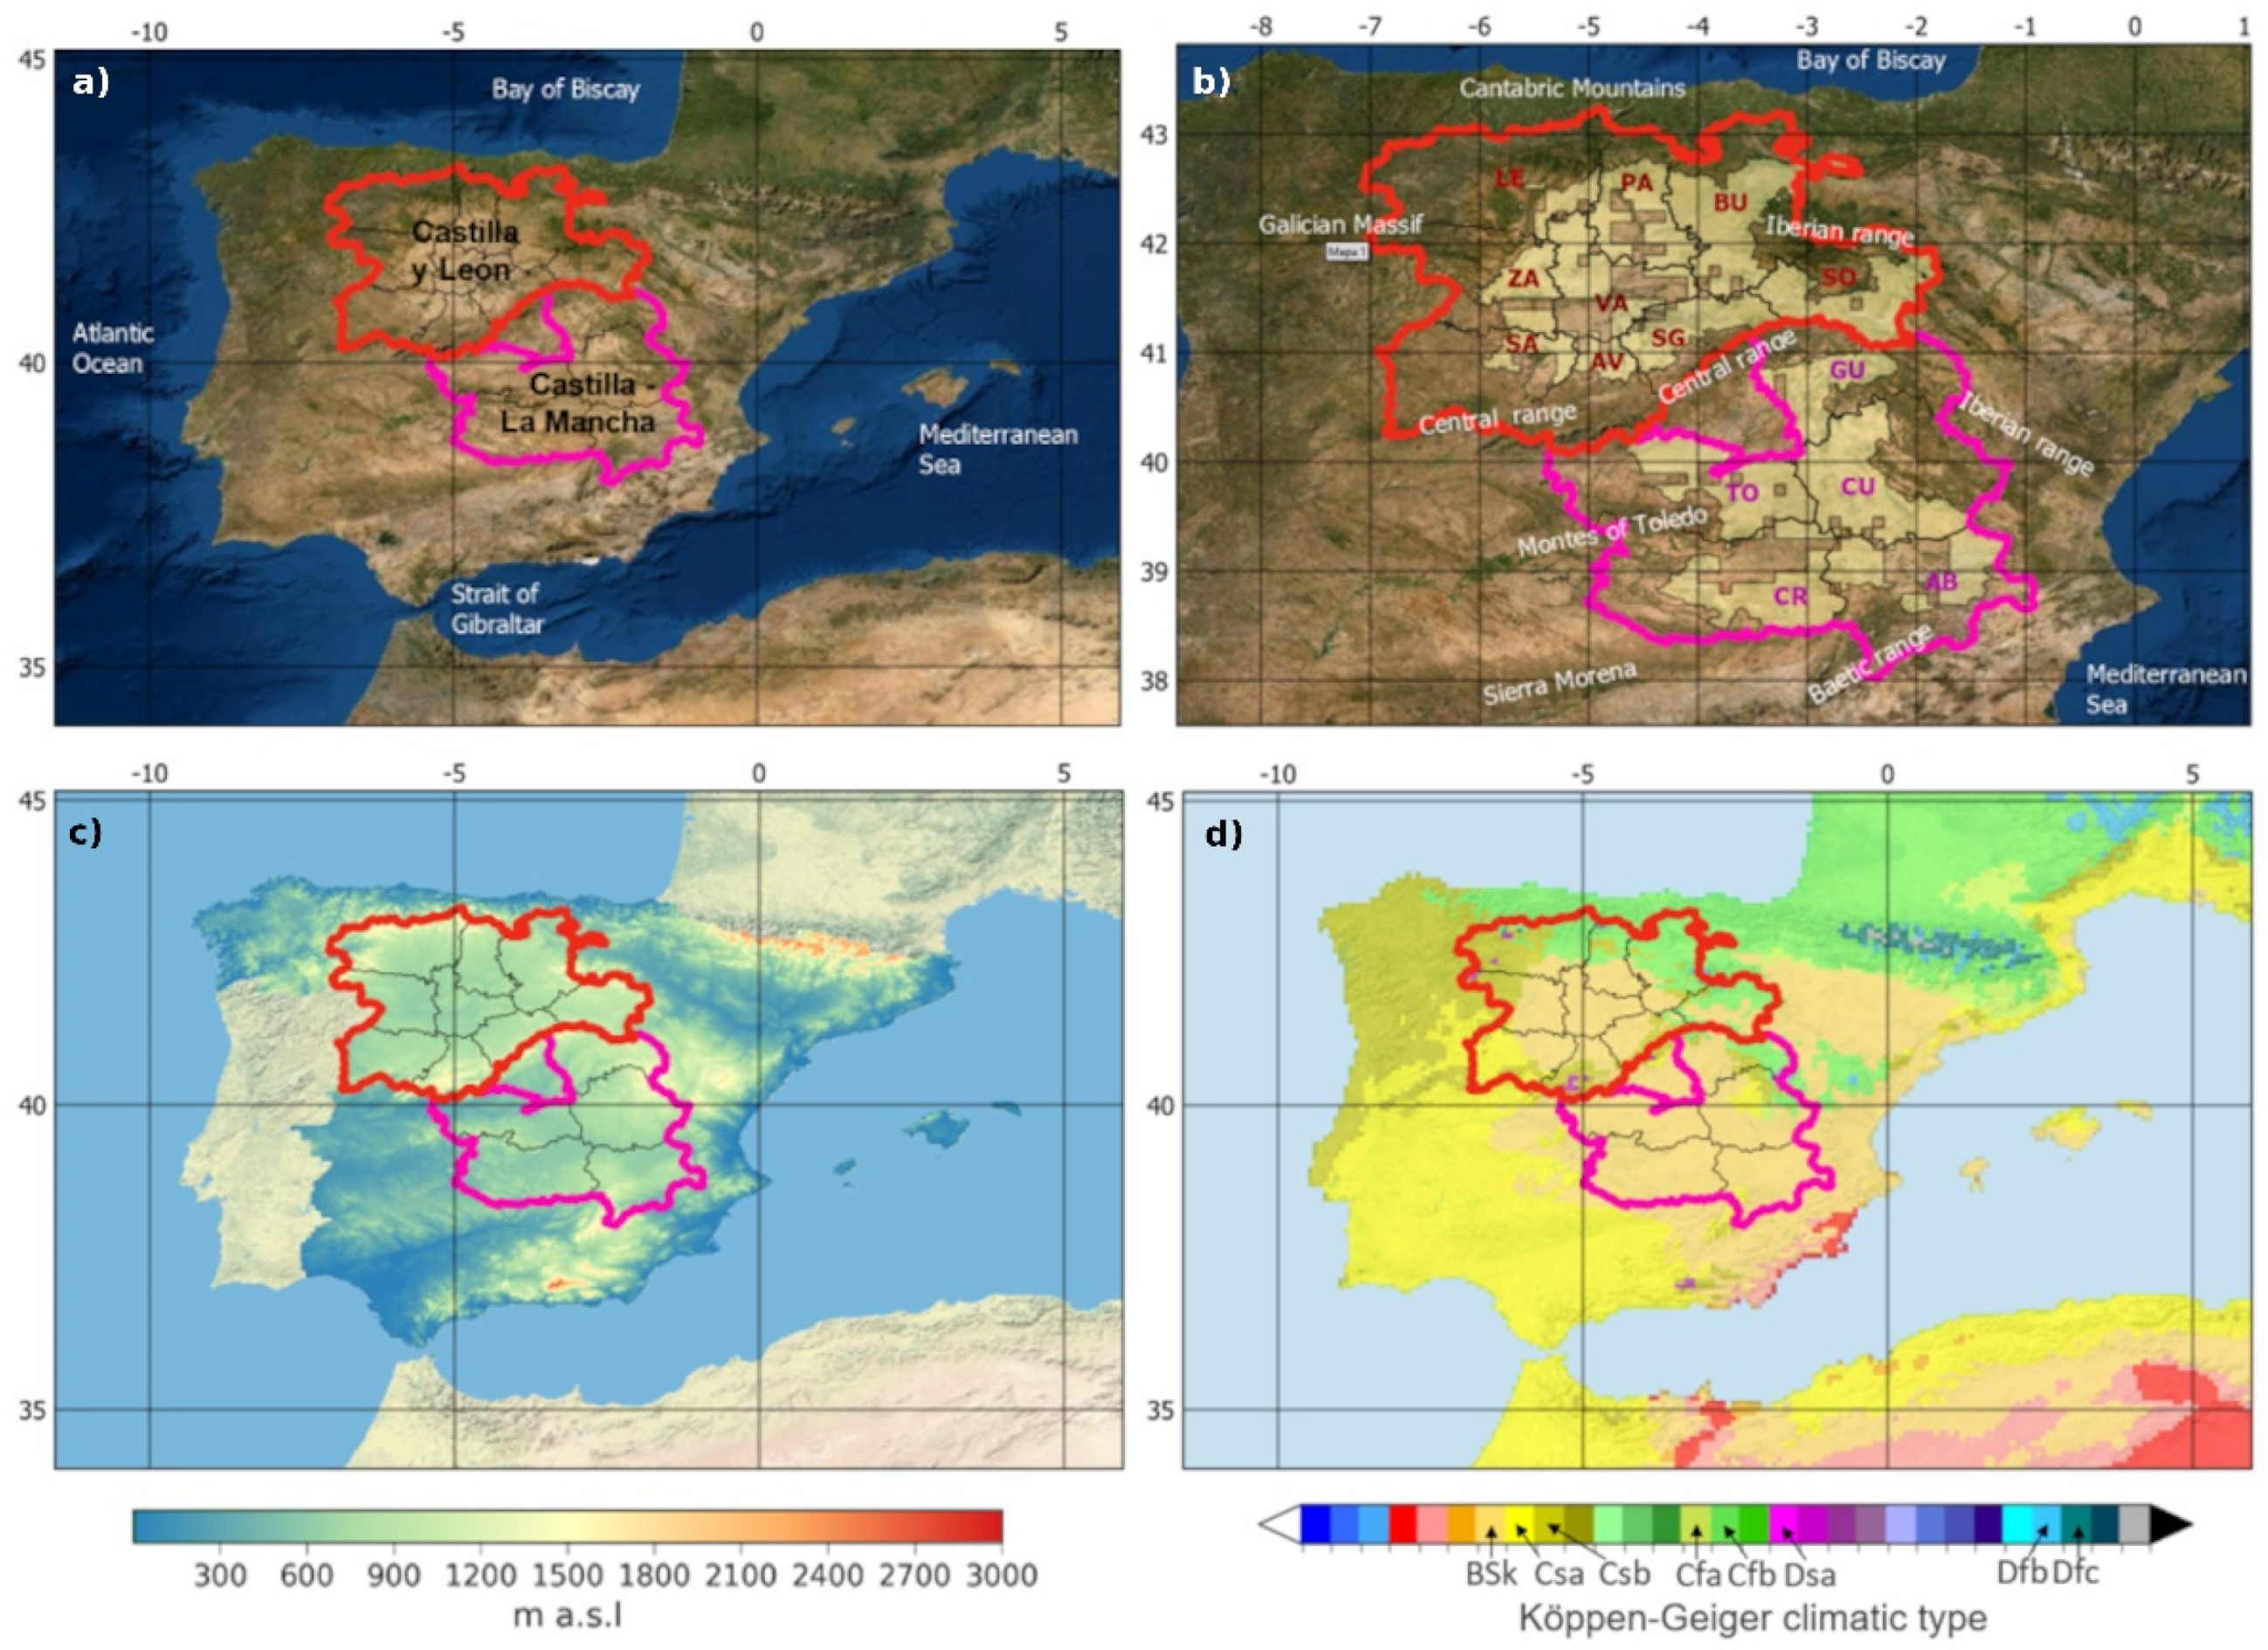
2.1. Study Area

The study area comprises the Spanish regions of CYL and CLM, with areas of 94,226 km2 and 79,463 km2, respectively (Figure 1a). Surrounded by mountains (Figure 1c), CYL is isolated from Atlantic influence, which configures a temperate climate of dry summer of Köpen–Geiger classifications from Csb and Csa to the cold-steppe BSk climate of the center of the region [43] (Figure 1d). CLM has a lower average altitude and is more open to Atlantic and Mediterranean influences (Figure 1c), but is generally drier than the CYL region (Figure 1d). Rainfed cropland comprises 84% and 83% of the total cultivated area of CYL and CLM, respectively [44], primarily dominated by cereals. The dominance of rainfed cropland in both basins can be easily noticed in the visible RGB composition in Figure 1a,b. The mask applied in the study to select rainfed cereal areas (Figure 1b) is based on crop statistics from the Spanish Ministry of Agriculture [42]. The mask reaches 43% and 47% of the area of CYL and CLM. The combination of semiarid climatic conditions (Figure 1d) and limitations due to soil characteristics, such as the shallow soil depth, coarse texture, or low organic matter content [45,46], determines the high impact of climatic variability on rainfed cereal yields. Despite these natural constraints, CYL and CLM represent the breadbaskets of Spain and important contributors to European cereal production, averaging 2.6 and 0.6 Mt of winter wheat and 2.85 and 2.39 Mt of barley production, respectively, in the period 2013–2021 [37].

2.2. Climatic Data: E-OBSv23

The E-OBS database is part of the European Climate and Assessment Dataset of the Copernicus Climate Change Service (C3S) [38]. E-OBS data originate from the European daily climatic database of temperature and precipitation, which interpolates the series of observations from the stations of the national weather services. The dataset used, version 23.1, is gridded at 0.1° × 0.1° from 1 January 1950 to 31 December 2020. The database provides a series of daily data for five variables used in the present study: maximum temperature (Tmax), minimum temperature (Tmin), accumulated precipitation (RR), relative humidity (RH), and global radiation (RAD). Additionally, these five variables combine to define four other variables of agronomic interest: growing degree days (GDD), diurnal temperature range (DTR), photothermal quotient (PTQ), and vapor pressure deficit (VPD). The diurnal temperature range (DTR) was calculated by simply subtracting the accumulated values or subtracting the minimum from the maximum temperatures of each day. The GDD at a certain point of time t (Equation (1)) was calculated based on the accumulation of GDD when the mean temperature (Tmax − Tmin/2) exceeds that of the reference base temperature Tbase. Following the indications of [47] about the variable base temperature with the phenological stage and the comparatively higher temperature base of Mediterranean wheat compared to North American wheat, the adopted Tbase is 4.5 °C.
GDD t = 1 t Tmax - Tmin 2 - Tbase
PTQ was obtained following the methodology of [48] expressed in (Equation (2)), where T is the daily mean temperature calculated with [(Tmax + Tmin)/2], RAD is the daily global radiation, and PTQ is expressed as MJ m−2 day−1 °C−1.
if   T > 10 , PTQday 1 = RAD / ( T 4.5 ) ;
if   4.5 < T 10 , PTQday 1 = RAD [ ( T 4.5 ) / 5.5 ] / 5.5 ;
if   T 4.5 , PTQday 1 = 0 ;
The VPD (kPa) is the difference between saturated vapor pressure ( e s ) and actual vapor pressure ( e a ) (Equation (3)), using daily Tmax and Tmin and daily maximum and minimum RH (Equations (4) and (5)). VPD is obtained in this case using the mean RH instead of the extremes, according to Equation (6) of [49]:
VPD = e s e a ,
e s = e o ( max ) + e o ( Tmin ) 2 ,
e o ( T i ) = 0.6108 exp ( 17.27 T i T i + 237.3 ) ,
e a = RH mean 100 ( e o ( Tmax ) + e o ( Tmin ) 2 ) ,

2.3. Soil Moisture Data

2.3.1. ERA5-Land

ERA5-Land [40] updates the ERA-Interim reanalysis climatic database provided by the European Centre for Medium-Range Weather Forecasts (ECMWF). This fifth generation of reanalysis datasets of the ECMWF combines physical modeling data of the Integrated Forecasting System (IFS) with the assimilation of observational data to generate a dataset of multiple variables of the land–atmospheric system, including soil moisture. The available period of hourly data spans from 1981 to a few months before the present. The hourly soil moisture dataset of ERA5-Land has a spatial resolution of 0.1° × 0.1°. The daily soil moisture data were calculated by averaging values at 12 a.m. and 12 p.m., covering a study period from 1981 to 2018. Soil moisture data were provided via the use of the pointwise simplified extended Kalman filter (SEKF) of [50] in four layers of topsoil. The upper three layers cover the 0–100 cm depth of the root-zone soil moisture used in the present study.

2.3.2. LISFLOOD Model

The distributed hydrological rainfall–runoff model LISFLOOD developed by the Joint Research Center (JCR) of the European Commission to monitor trans-national river catchments [23] provides soil moisture estimates every six hours, averaged at 12 a.m. and 12 p.m., with a spatial resolution of 5 km × 5 km from 1991 to the present. The partially physically based model was developed to study floods, evaluate river regulation and water efficiency measures, and assess the impact of land-use changes and climate change. LISFLOOD feeds on daily meteorological observations across Europe obtained by processing JCR data with the processing tools of the European Centre for Medium-Range Weather Forecasts (ECMWF). The model estimates soil moisture in three layers, but only the average of the first two layers was used (0–100 cm). This soil moisture database has been used in many applications [51,52], including in the definition of drought indices such as the Combined Drought Indicator of the European Drought Observatory [26].

2.4. Wheat and Barley Crop Data: Yield, Characterization of Agricultural Districts and Phenology

2.4.1. Statistics and Characterization of Agricultural Districts

The dataset of agricultural yields from the Spanish Ministry of Agriculture is provided in the Annual Yearbook of Statistics [41], whose data are available for the 1904–2019 period. The series of the yearbook used in this study were the provincial-scale data of wheat and barley yields from 1978 to 2018 for CYL and CLM. Cereal yield data were previously detrended using a method proposed by [53]. The method eliminates the increasing crop performance due to technical factors such as new management practices and technologies, while filtering the effect of non-climatic variables.
The Ministry of Agriculture additionally provides statistics characterizing the agricultural districts of each province according to their proportion of rainfed and irrigated cropland. These statistics detail the areas where wheat and barley crops prevail over other crops. A mask of rainfed wheat and barley districts from the agricultural characterization of the Spanish Ministry of Agriculture (Figure 1b) was applied to the soil moisture and climatic variable databases to subset all variable data over only the areas of rainfed cropland. Rainfed wheat and barley districts were selected if they surpassed two of the three thresholds of 25% of barley and wheat rainfed cropland in respect to rainfed cropland, 15% percentage of wheat and barley cropland share in total cropland, and the threshold of cropland over total district area of 35%.
Additionally, a filter of irrigated areas of both regions was applied to the mask described above using the Digital Global Map of Irrigation Areas from the Food and Agriculture Organization (FAO) [54]. This map with a spatial resolution of 5 arc min was resampled into the ERA5-Land and LISFLOOD grids and obtained for the areas with over 15% irrigated land. Then, the irrigation areas were subtracted from the mask of rainfed wheat and barley districts described earlier.

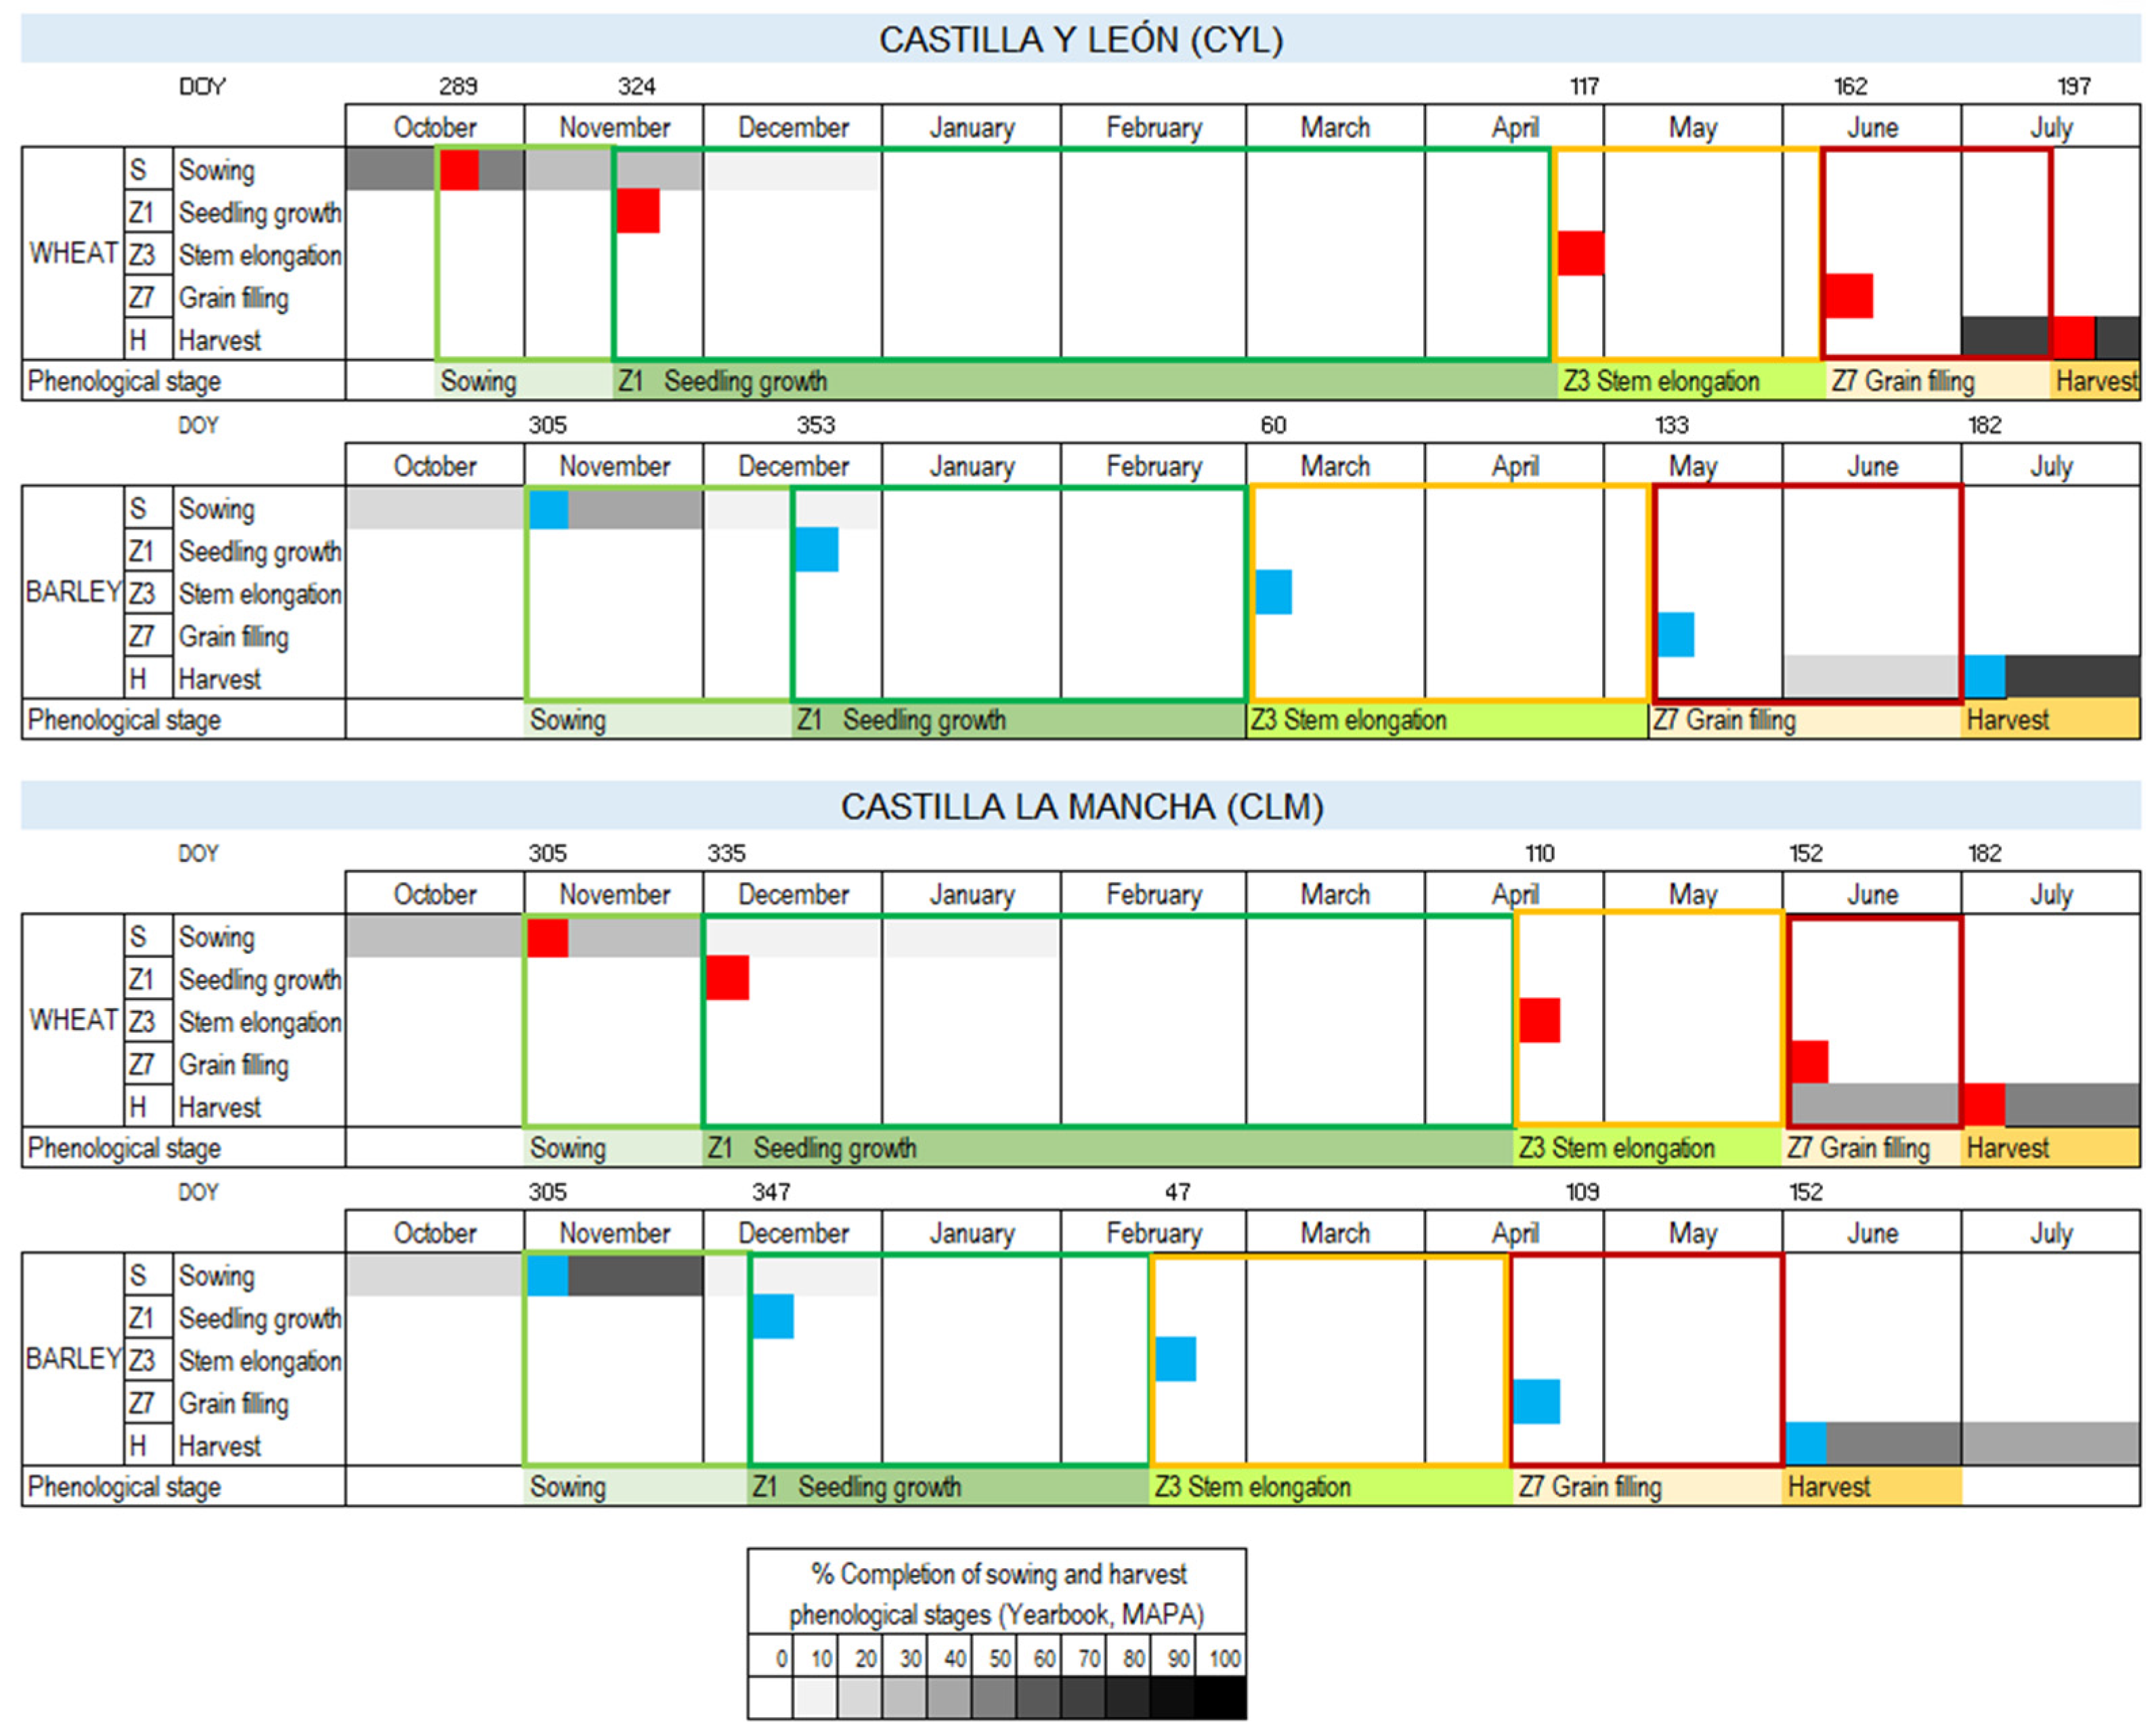
2.4.2. Phenological Phases

The sowing and harvesting dates of wheat and barley crops for each province and region were established using information extracted from the sowing, harvesting, and marketing calendar [55]. Only semihard and soft winter wheat and malting barley (two-row) data were considered because they are the predominant varieties in the study area. The document specified percentages of completion of sowing and harvesting during certain months of the year (Figure 2). These dates were selected using the month with the highest percentage of each activity. If the selected month initiated the active period for that activity with a percentage of completion above 50%, the starting time of the action was moved to the middle of the month to keep its representativity to the actual development of sowing and harvesting activities (e.g., if sowing of wheat was predominantly conducted in October, as the first month of the activity, then 15 October was a more representative date of the percentage of activity achieved during the month than 1 October).
The start of the intermediate phenological stages was determined based on the guideline for computing water requirements developed by FAO [56], which considers four main stages of crop development: sowing, seedling growth, stem elongation and grain filling. The starting dates of these main stages (Figure 2 and Figures 4–7) are labeled with the Zadoks phase initiating the stage (e.g., “Z7: grain filling phase” refers to all secondary phenological phases from grain filling to harvest comprising from soft dough formation to maturation). The duration of each stage of wheat was defined based on the sowing period (winter) and climatic region (Mediterranean). Barley growth stages were defined based on a sowing date of November. Afterwards, the duration of each phase was homogeneously adjusted to the sowing and harvest dates of the areas of study. Finally, the Zadoks decimal scale [42], which describes only the external morphological stages of the crop, was used to identify the phase of the crop at each growth stage. As a result, five dates were obtained (for each crop and region), associated with the following crop phases: sowing (abbreviated in figures as S), seedling growth (Z1), stem elongation (Z3), milk development of grain filling (Z7), and harvest (H). The dates of the main phenological stages of wheat and barley for CYL and CLM are indicated in Figure 2.

2.5. Methods

2.5.1. Moving Average Filtering Data

Soil moisture and climatic variables are subjected to substantial daily variability that transmits to correlation results, penalizing its interpretation. The focus of this study on determining the mean annual cycles of correlations of soil moisture and climatic variables with cereal yield required applying a filter to smooth the patterns of correlation and facilitate the identification of critical periods, whose durations are comparable to that of phenophases. The use of a 30-day moving average proved to be the best option to distinguish significant periods of correlation [25]. This filter provides enough continuity of the positive and negative correlation periods without a noticeable impact on correlations. All results shown are based on the 30-day moving average of the daily correlations between soil moisture/climatic variables and yields.

2.5.2. Correlation Analysis

The daily soil moisture (SM in Figures) and climatic variables from 1981 to 2018 were correlated with the annual wheat and barley yields (Pearson correlation analysis) to obtain daily correlations during the growing season from 1 September to 31 July. The diagram in Figure 3 describes the workflow of the study. It adopts a provincial scale for the analysis. Pearson correlation analysis was used to characterize the magnitude, timing, and duration of the correlation between the values of each climatic variable on each day of the growing season (values spanning from 1981 to 2018) and the annual yield. The significance of correlations was identified with p values at a 95% confidence level.

3. Results and Discussion

3.1. Soil Moisture Influence on Wheat and Barley Yields

In both the CYL and CLM regions (Figure 4), the correlations of soil moisture with annual yield show a clear and significant pattern (p-value ≤ 0.05) of R values above 0.5, peaking over 0.8, generally from late March to late June, during the phenological stages of stem elongation, spikelet formation, and grain filling. These results indicate the high demand and sensitivity of cereal crops to soil moisture during the spring months. Although no studies focused on soil moisture influence on yield are available in the area, studies have reported that the region is prone to drought during the late stages of the crop cycle [57,58], affecting crucial vegetative and reproductive stages. Additionally, springtime is susceptible to even greater drought prevalence [52], complicating rainfed agricultural viability in the area. Hence, the period of high correlations between soil moisture and yield from Z3 to harvest (Figure 4) likely affects the quick succession of physiological stages in which the organ growing the most is the most affected by stress (e.g., spikelets, and grains) [18].
Both wheat and barley correlation peaks occur approximately around the anthesis stage (Figure 4) in the transition between stem elongation and grain-filling stages. Barley shows a relative concentration of high R values from the start of Stage Z7 onward, during the grain-filling phase, while the peak of R values of wheat occurs slightly earlier, indicating more impact during the booting and anthesis phases before Z7 (Figure 4(a2,a4,b2,b4) vs. Figure 4(a1,a3,b1,b3). These results are consistent with studies reporting that most crops are more sensitive to drought during reproductive than in vegetative phases. Conversely, the timing and values of correlation of the peaks of wheat and barley are primarily identical.
The delay of the peak of correlation of barley compared to the case of wheat, while barley phenology is earlier than wheat, may suggest that precocity favors greater barley yields than wheat yields [59]. In this and related studies, authors indicated that early leaf area development under water stress reduces soil evaporation and benefits water use efficiency. The relatively delayed peak of barley in CLM compared to CYL may indicate that the early varieties used in this region suffer less shortening of the grain-filling period due to water stress in this crucial stage for grain weight (dough formation) [60]. Peaks occurring toward the last part of grain filling are consistent with studies indicating that the grain-filling phase is crucial in Mediterranean regions [17]. Furthermore, the long period of declining soil moisture having an influence on yield, extending until harvest, may indicate that plants in water-limited regions take advantage of deep soil moisture, which even at late phenophases, contributes to grain yield [39]. The results display significant correlations, increasing toward the peak before Z7. This is the time during the preanthesis when stem elongation, booting, and heading occur. Among these three, the heading period impacts yield the most due to its effect on the number of grains per ear or the number of spikelets per spike [33]. More than for the stem-elongation period, significant correlation values are still shown for the booting phase. These results suggest that the studied areas suffer less stress during the stem-elongation period, in line with studies indicating the low sensitivity of this stage compared to tillering when moisture stress causes a decline in the number of spikes per plant [18].
A secondary period of significance of correlations spans between the Z1 and Z3 stages of crop initiation during January, in a few provinces in both regions. Nonetheless, R, in this case, barely surpasses 0.4. This secondary correlation period affects wheat slightly more than barley (Figure 4(a1,a3,b1,b3) vs. Figure 4(a2,a4,b2,b4)). These results may suggest a decline in yield in the provinces affected during tillering due to the delayed development and lower yield of secondary tillers [61]. Secondary periods of the impact of water deficit on yield were also reported in Spain [58], both during winter and autumn. In a few provinces in both regions, secondary correlations extend to autumn, around land preparation and sowing time, especially given ERA5-Land results (Figure 4(a1–a4)). Correlation values remain low, like those during wintertime. These results agree with studies reporting the importance of water-related variables for the establishment period of the crop, such as [14], which showed a precipitation deficit affecting wheat growth during S, followed by DTR. Nonetheless, the magnitude and timing of the periods of significant correlations using LISFLOOD and ERA5-Land are very similar (Figure 4) during the critical development stages of rapid vegetative growth and reproduction from Z3 to harvest, but not during secondary periods. The concurrence of both data sources regarding high correlations during spring highlights the relevance of this period, which affects all provinces, compared to the minor role of secondary periods affecting only a few provinces.
Concerning geographic differences, the results of rainfed wheat and barley in CLM, representing almost the southern edge of rainfed cereals in Europe, have identical soil moisture critical periods compared to CYL. Although the latitudinal difference between CYL and CLM suggests the possible existence of differentiated patterns of the impact of soil moisture on yield, hardly any difference in the duration of the critical periods is identified between both regions.

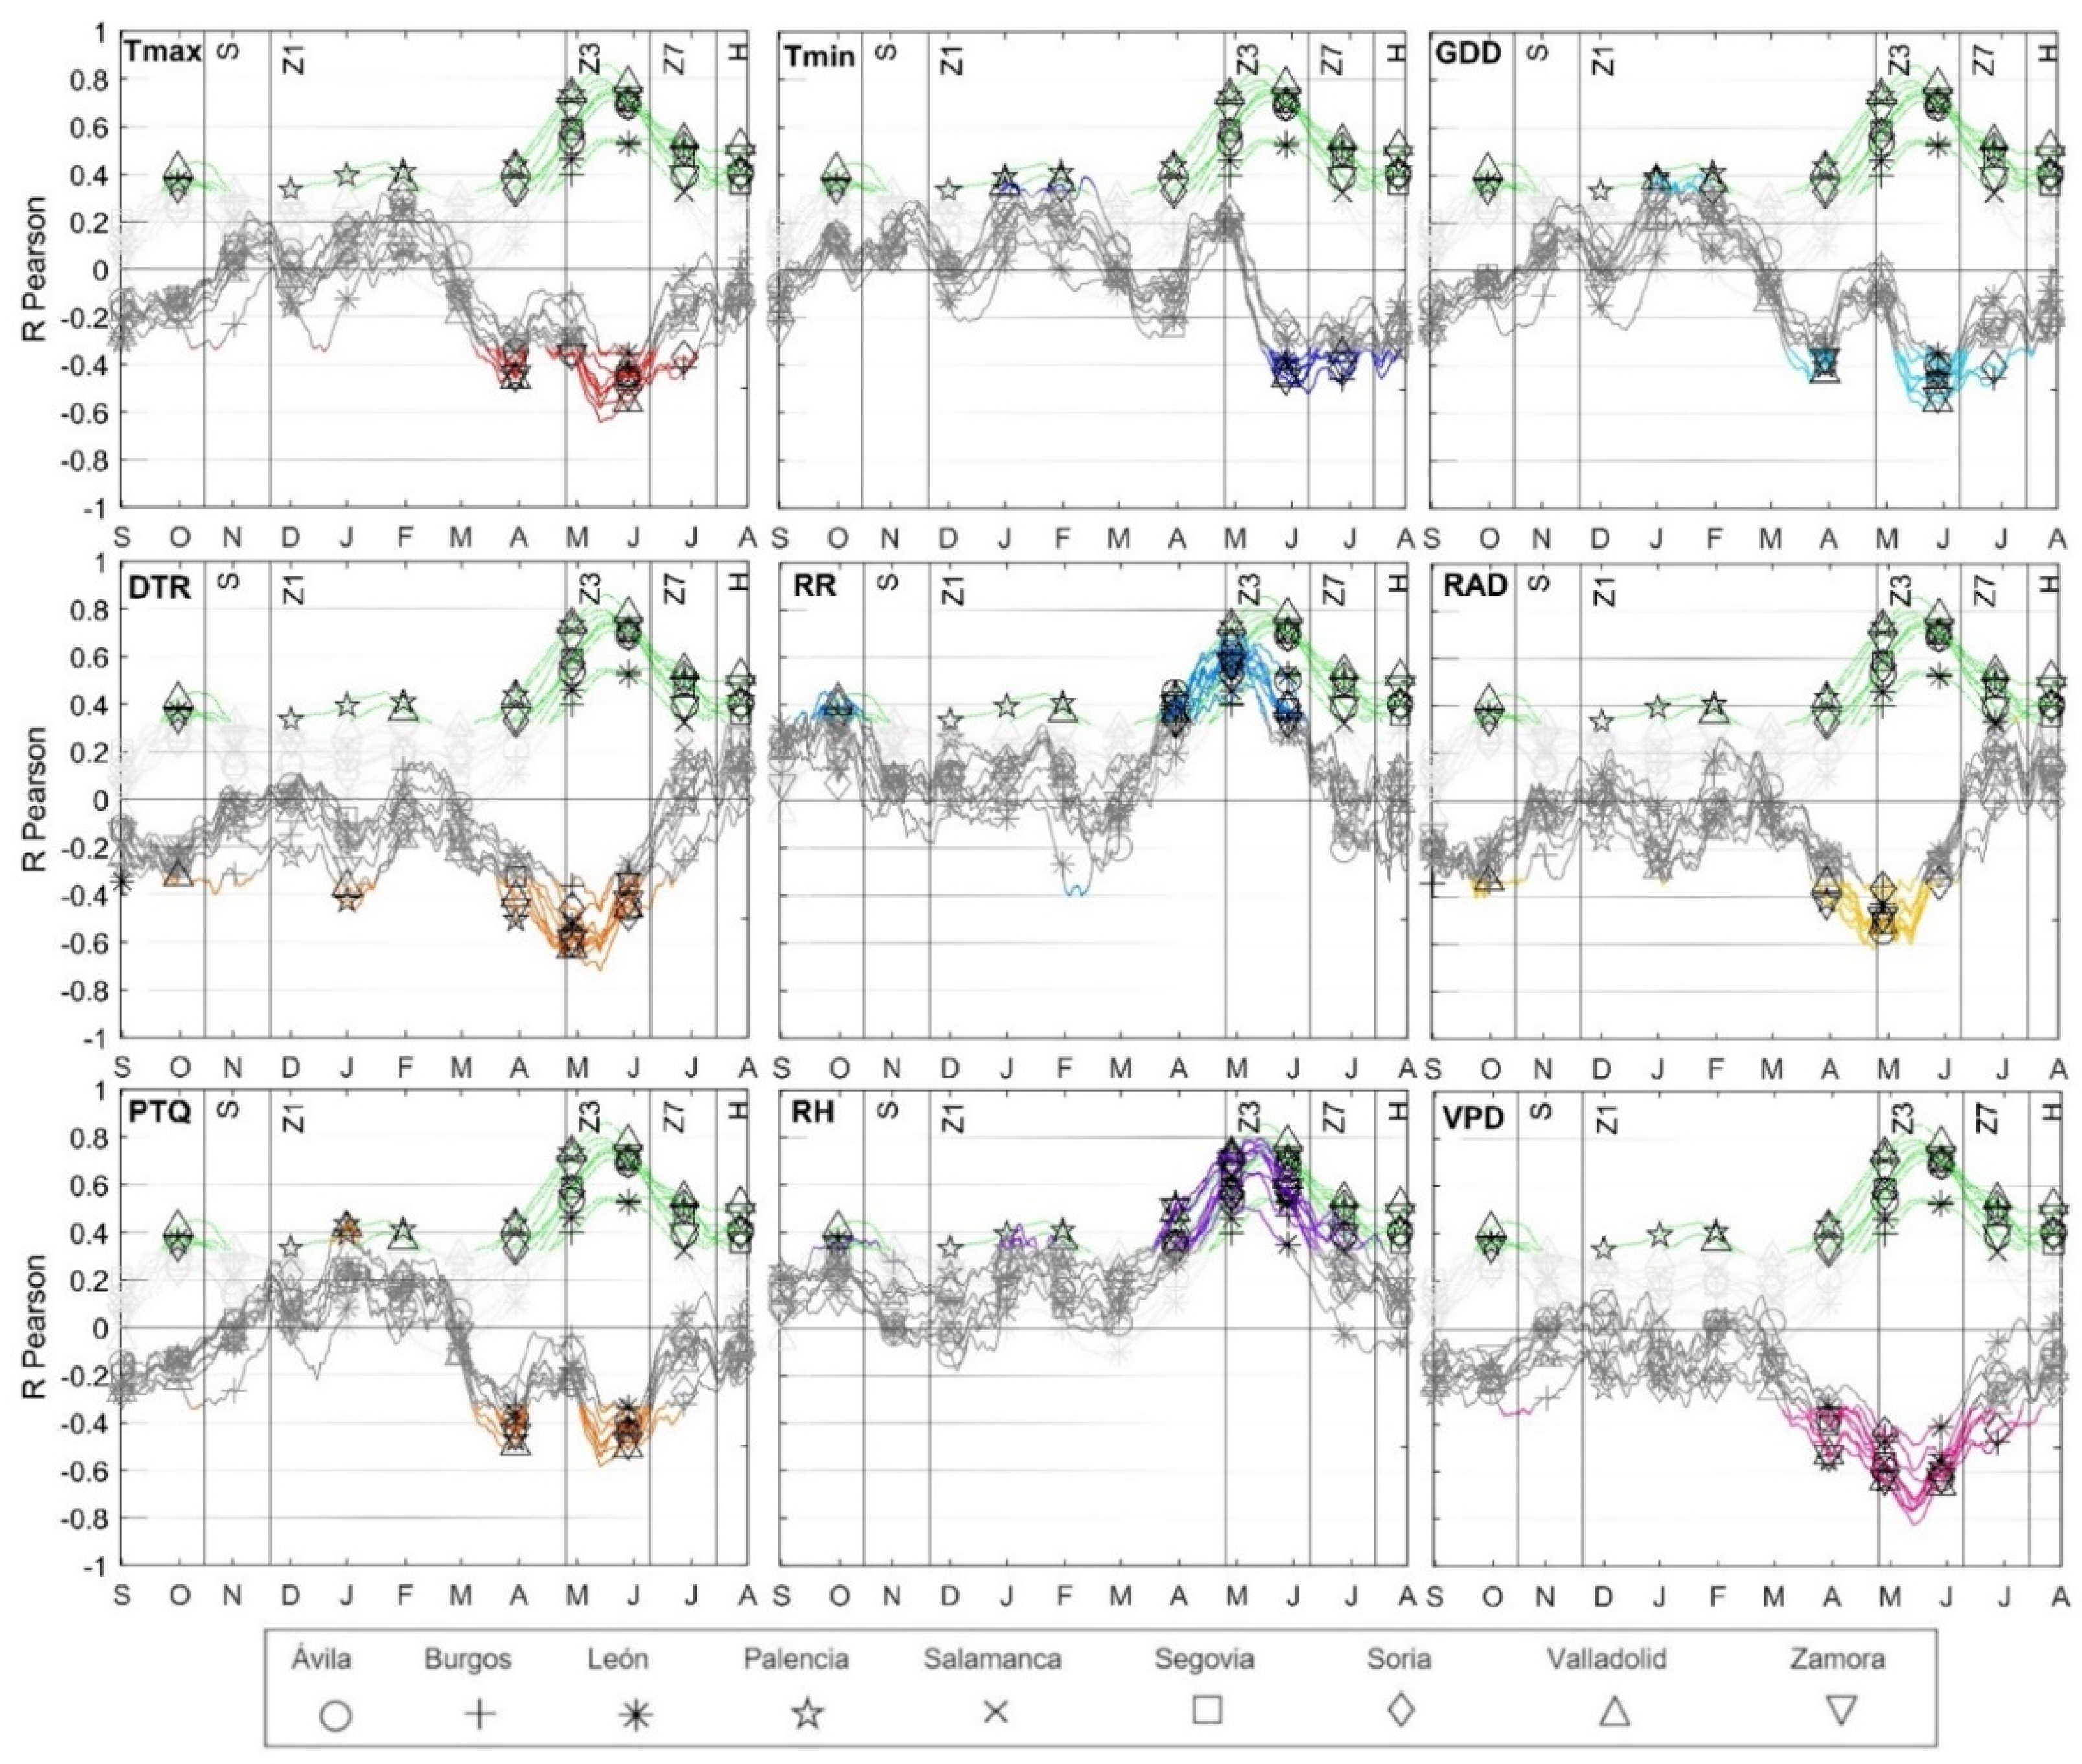
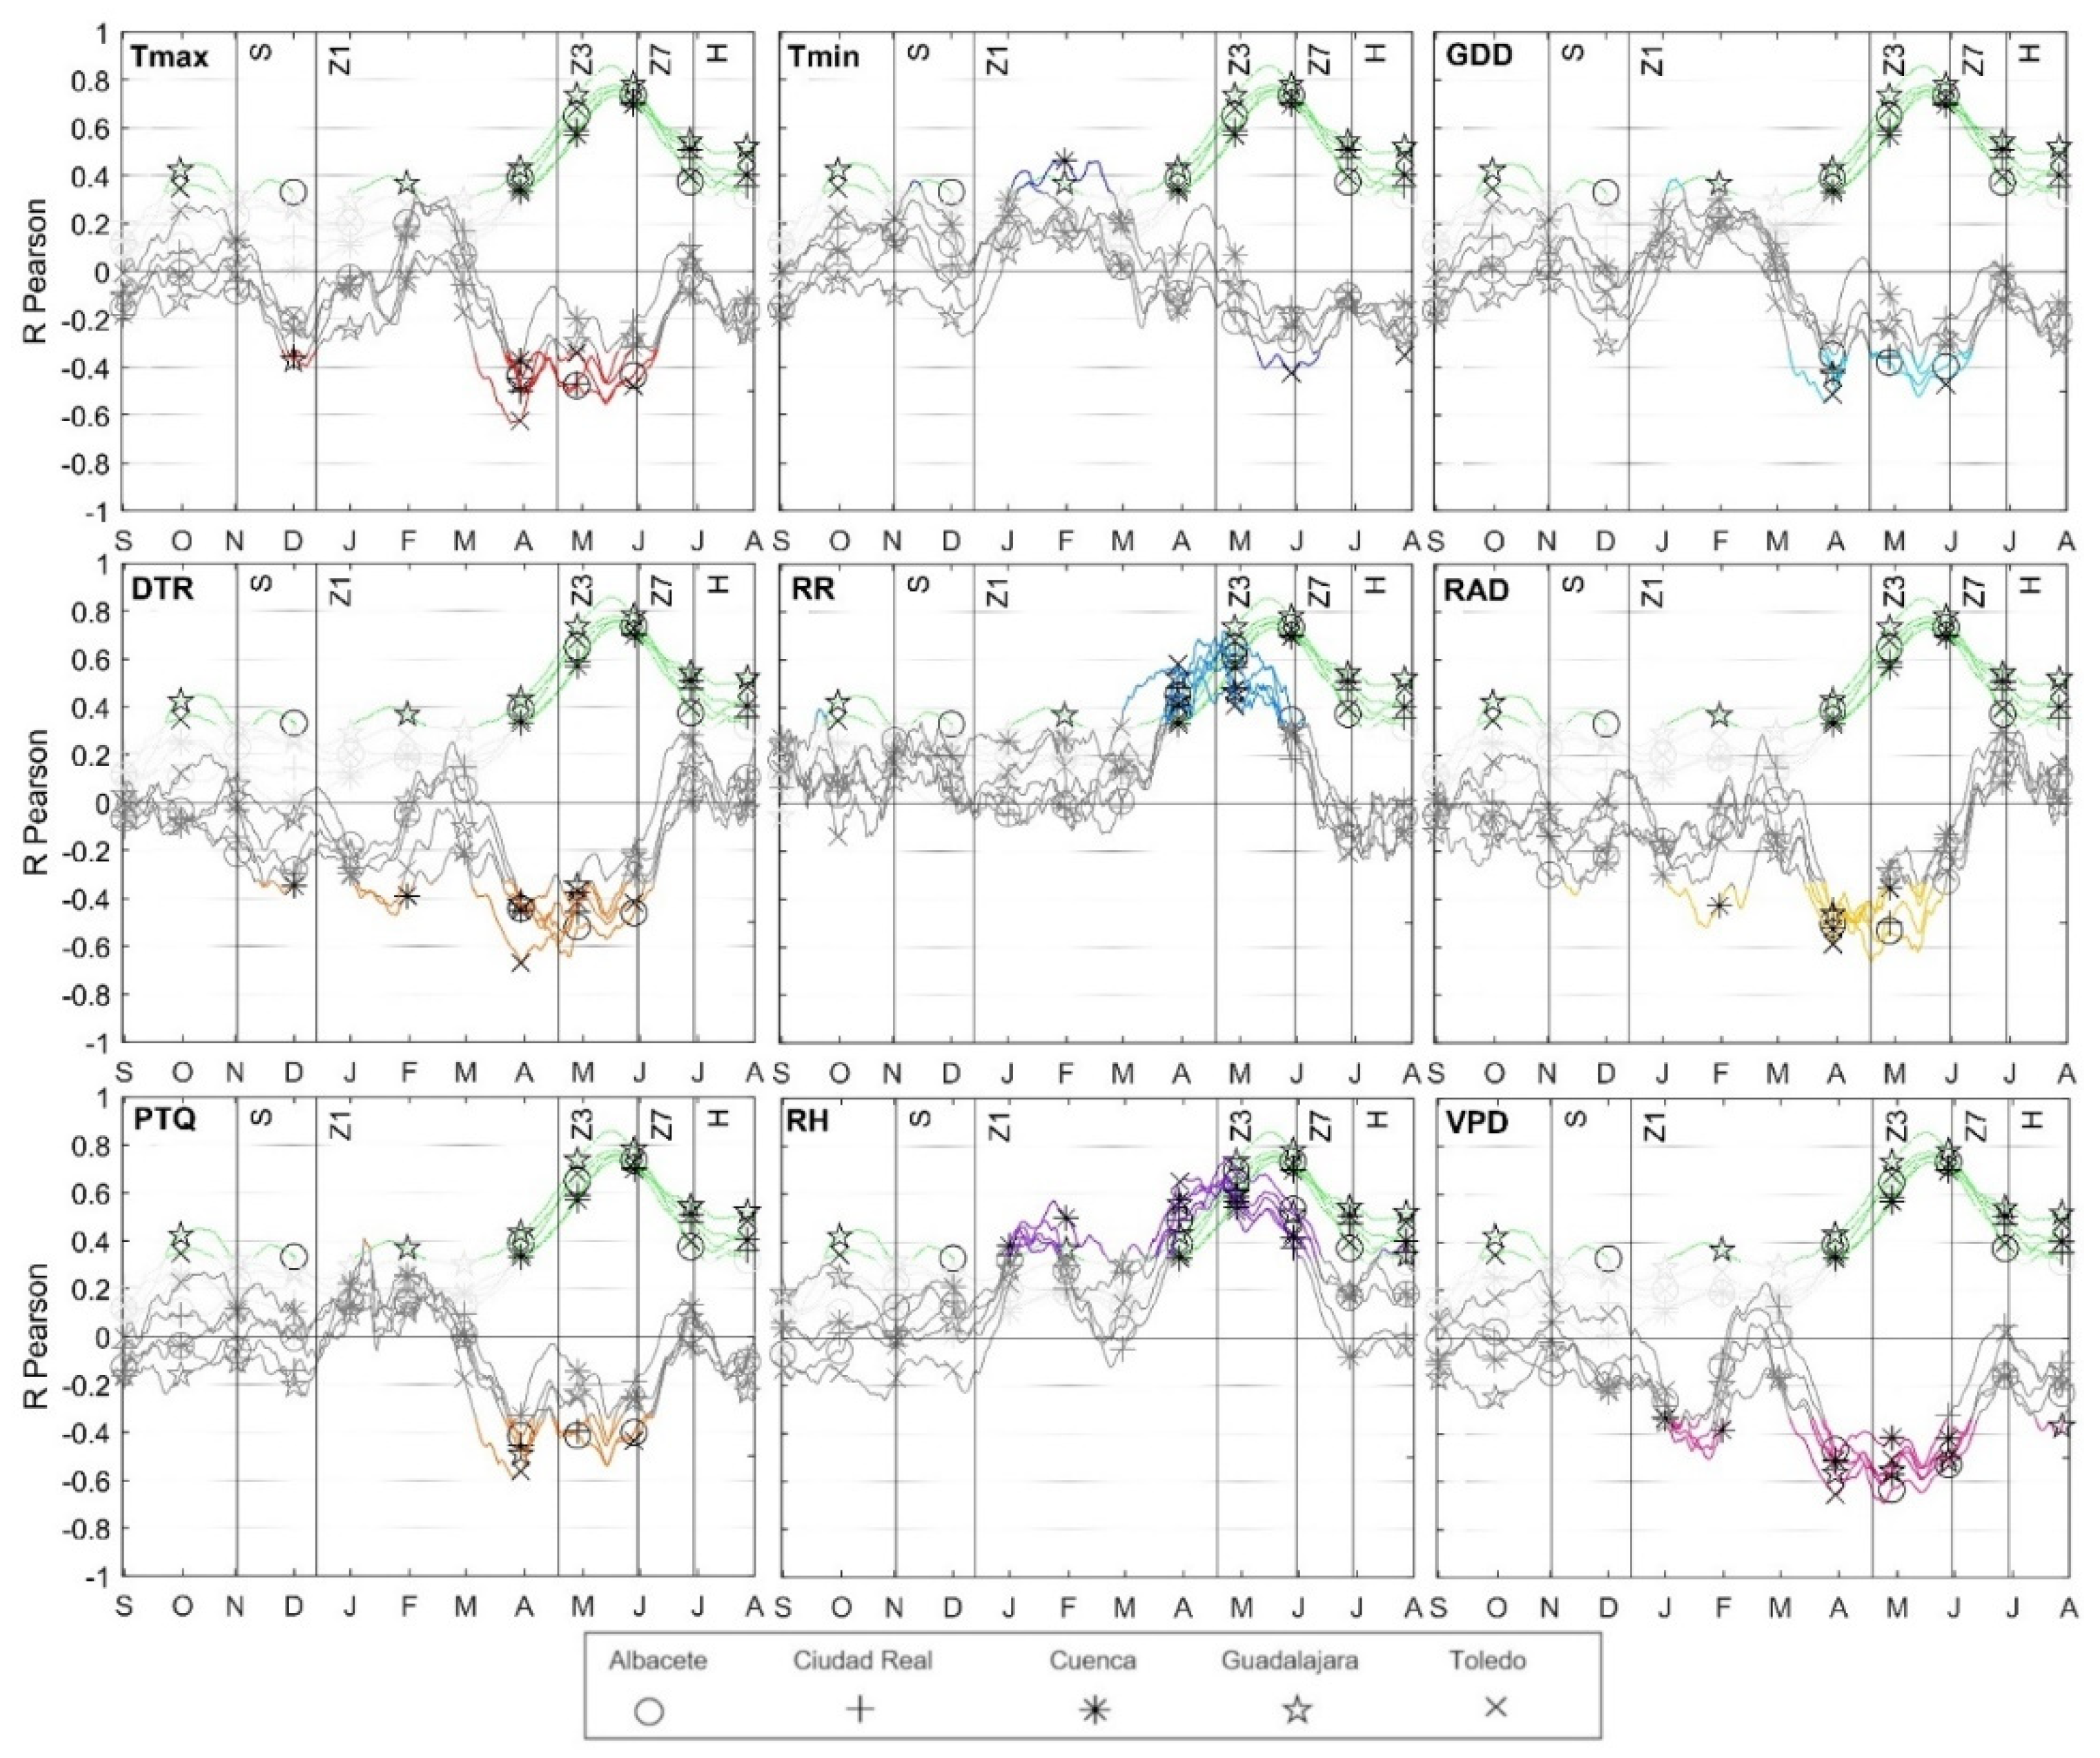
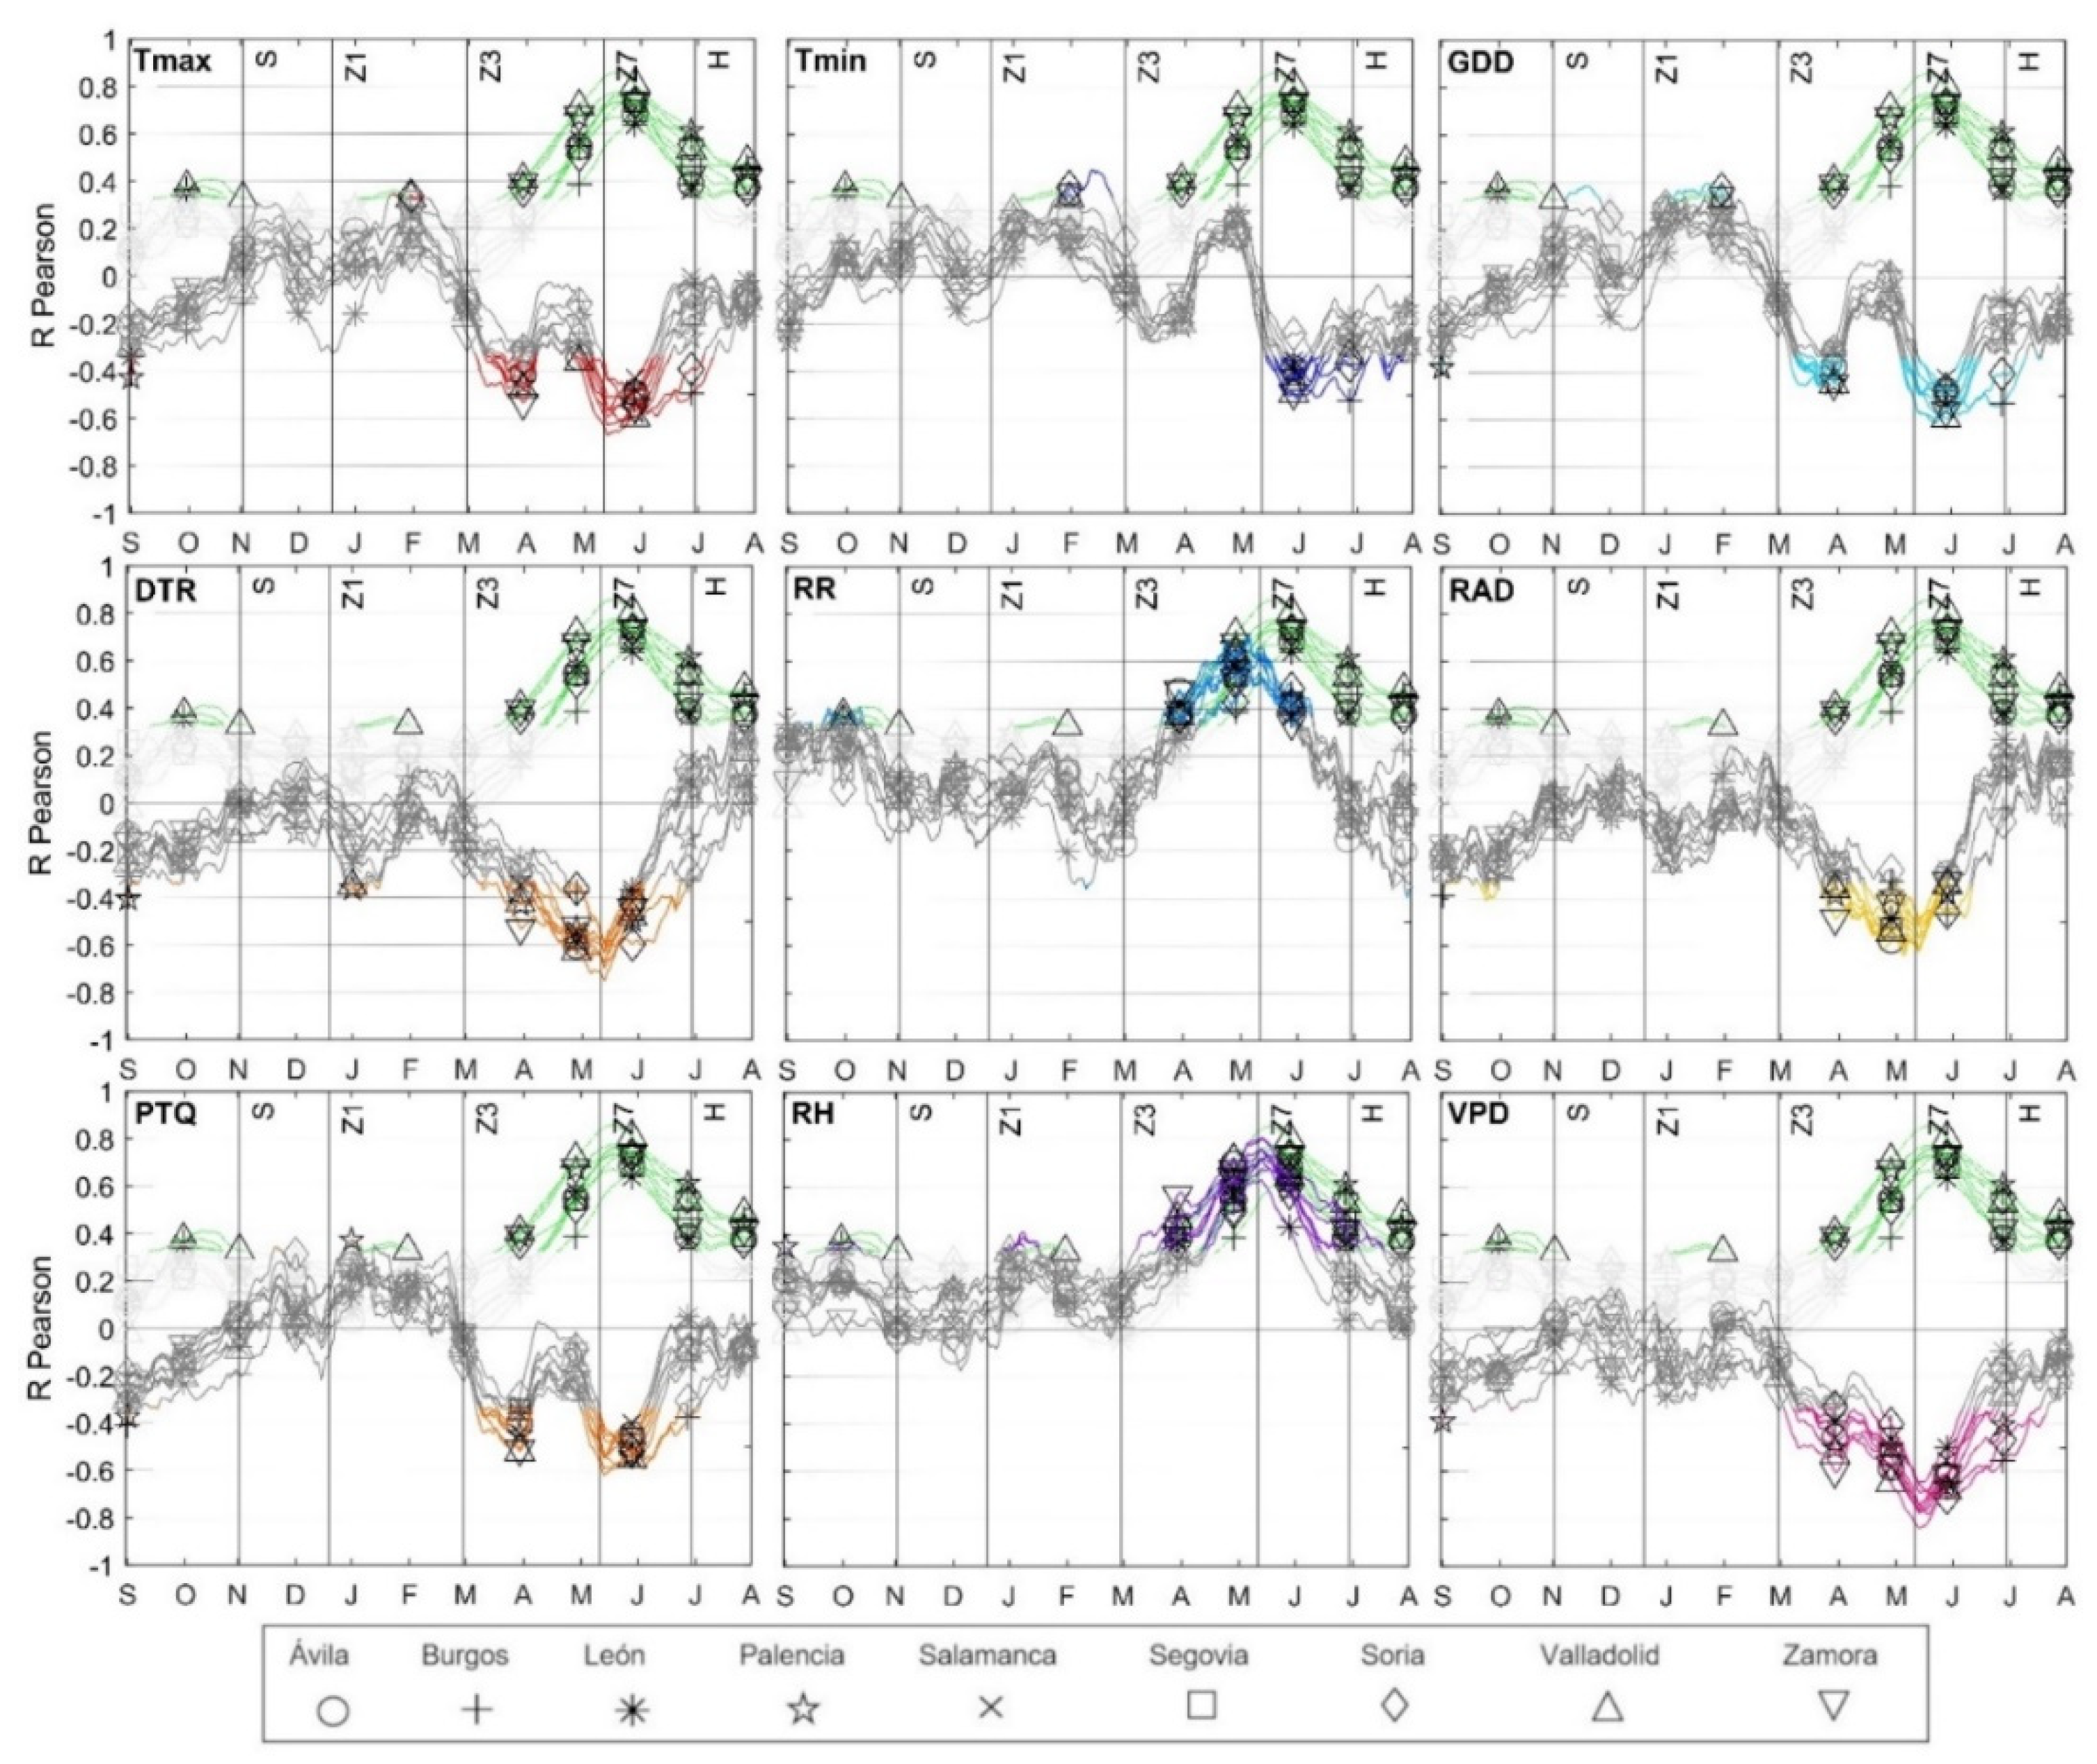
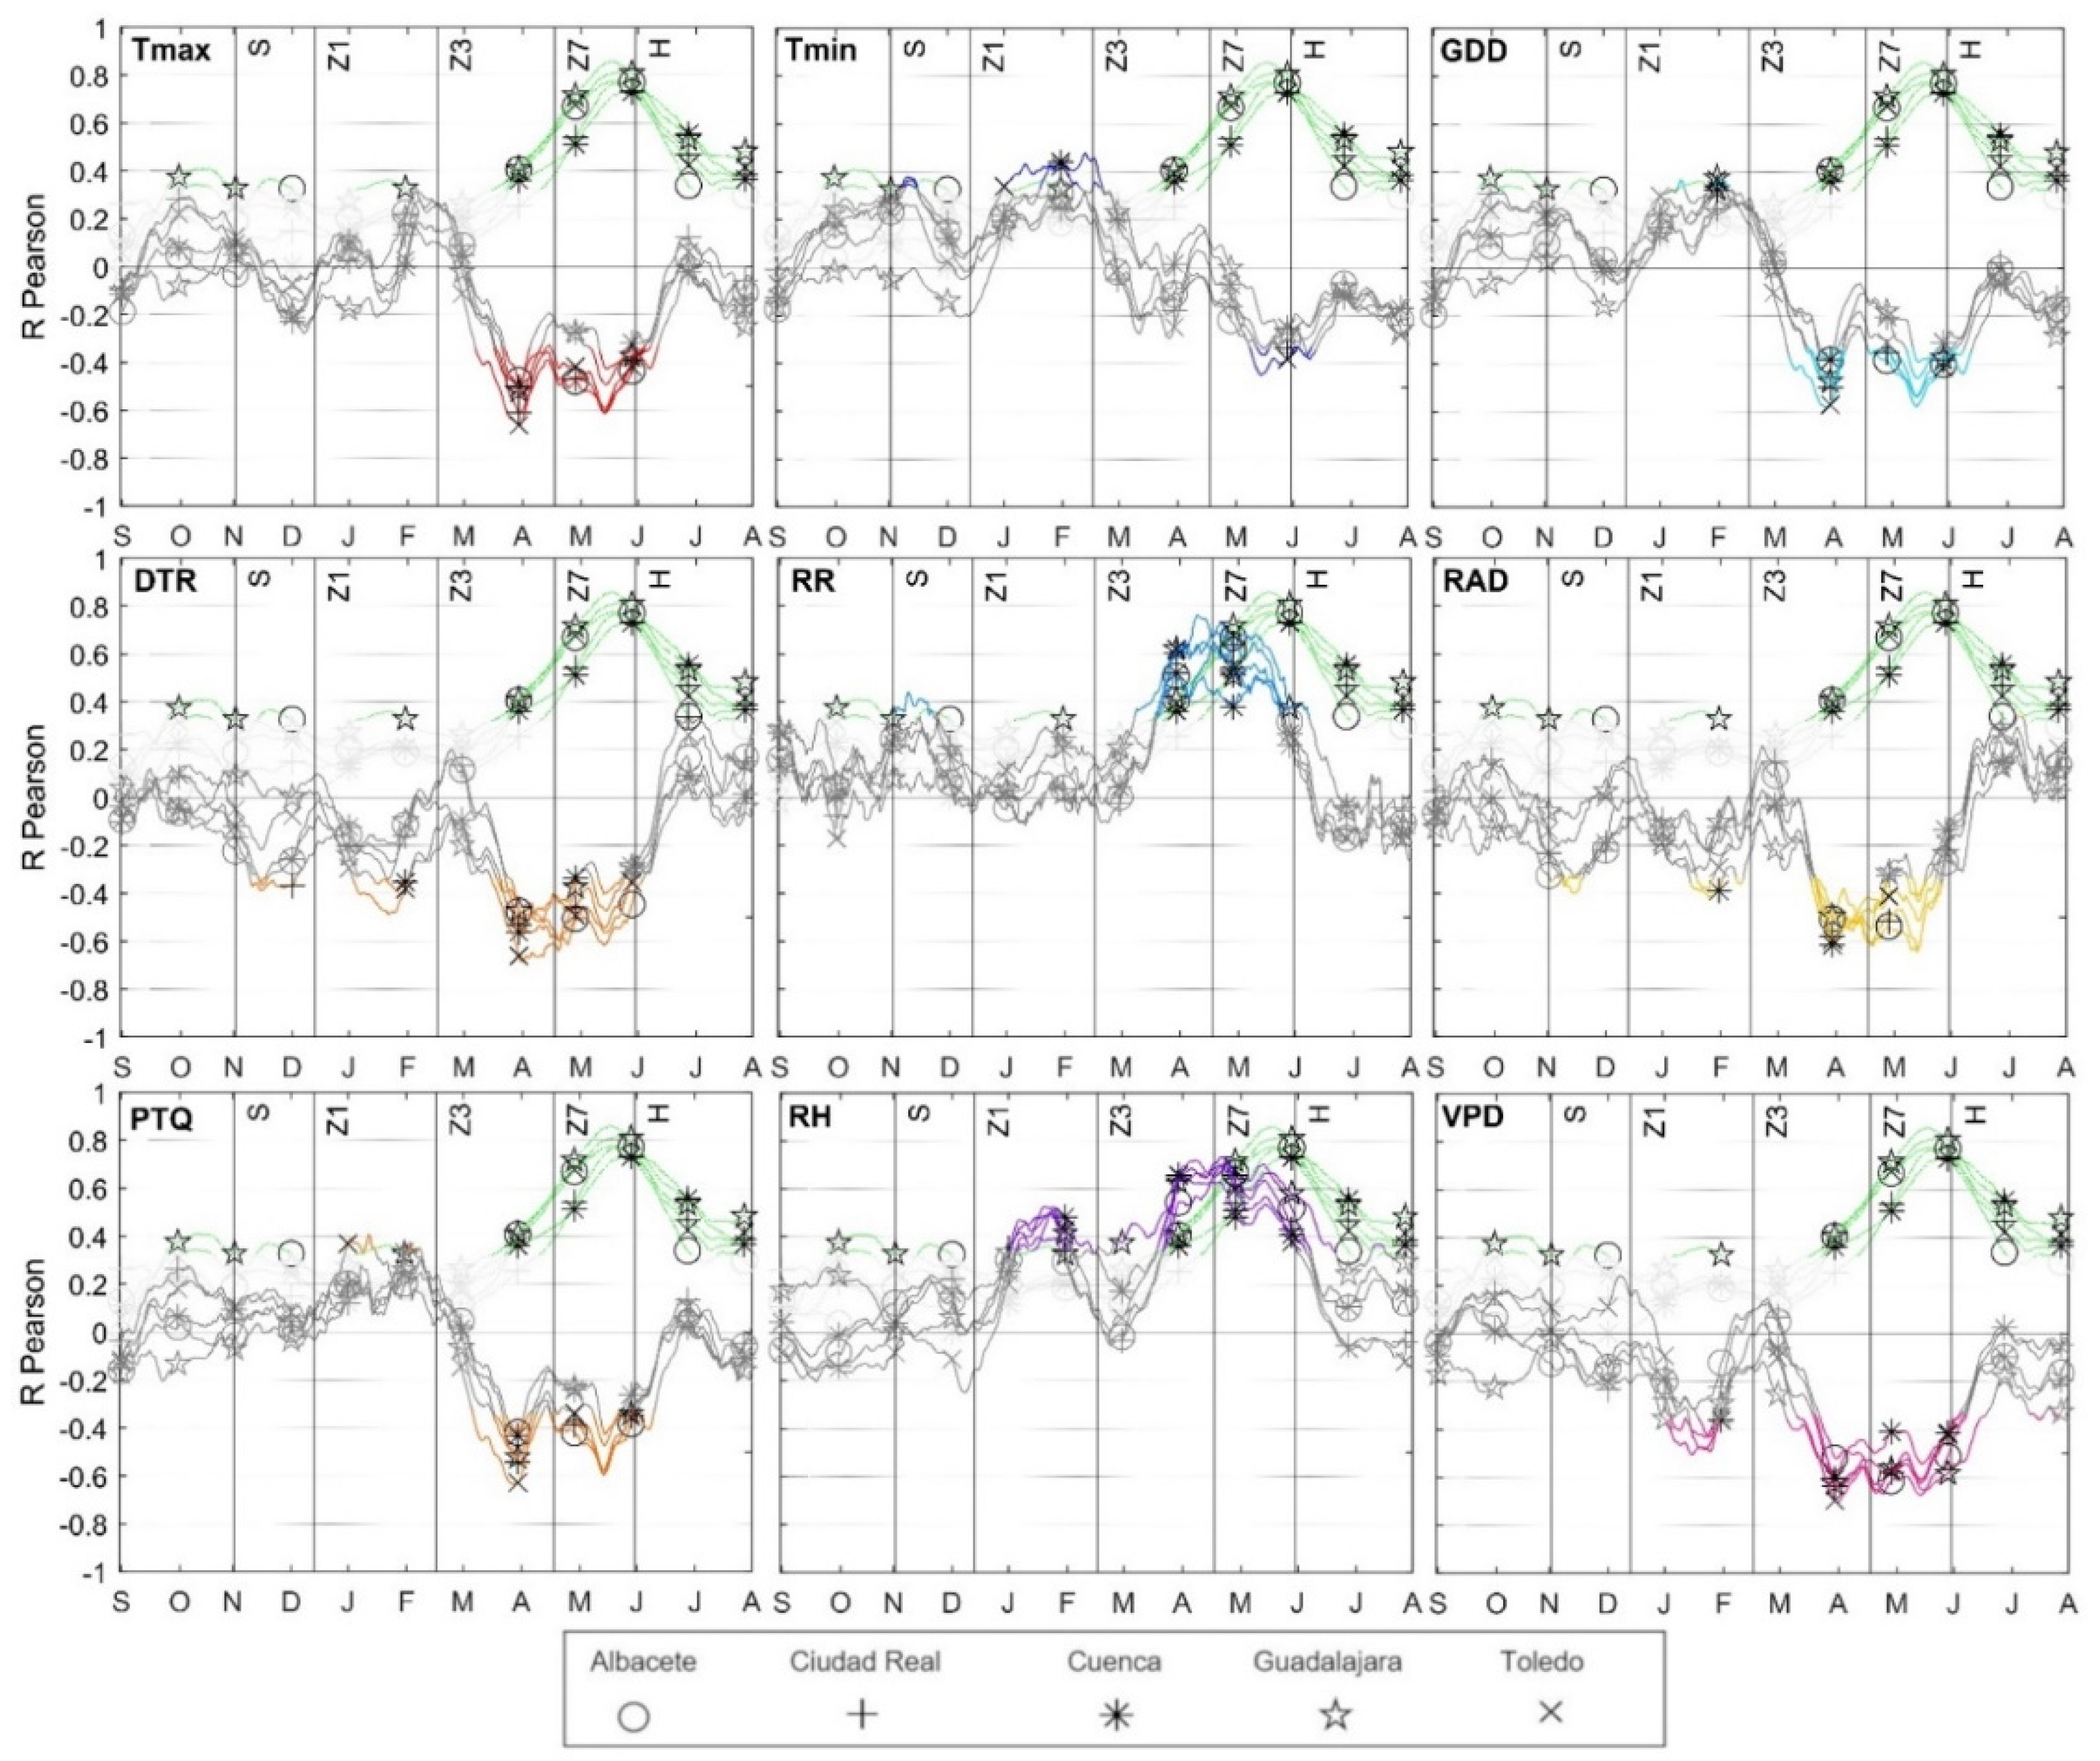
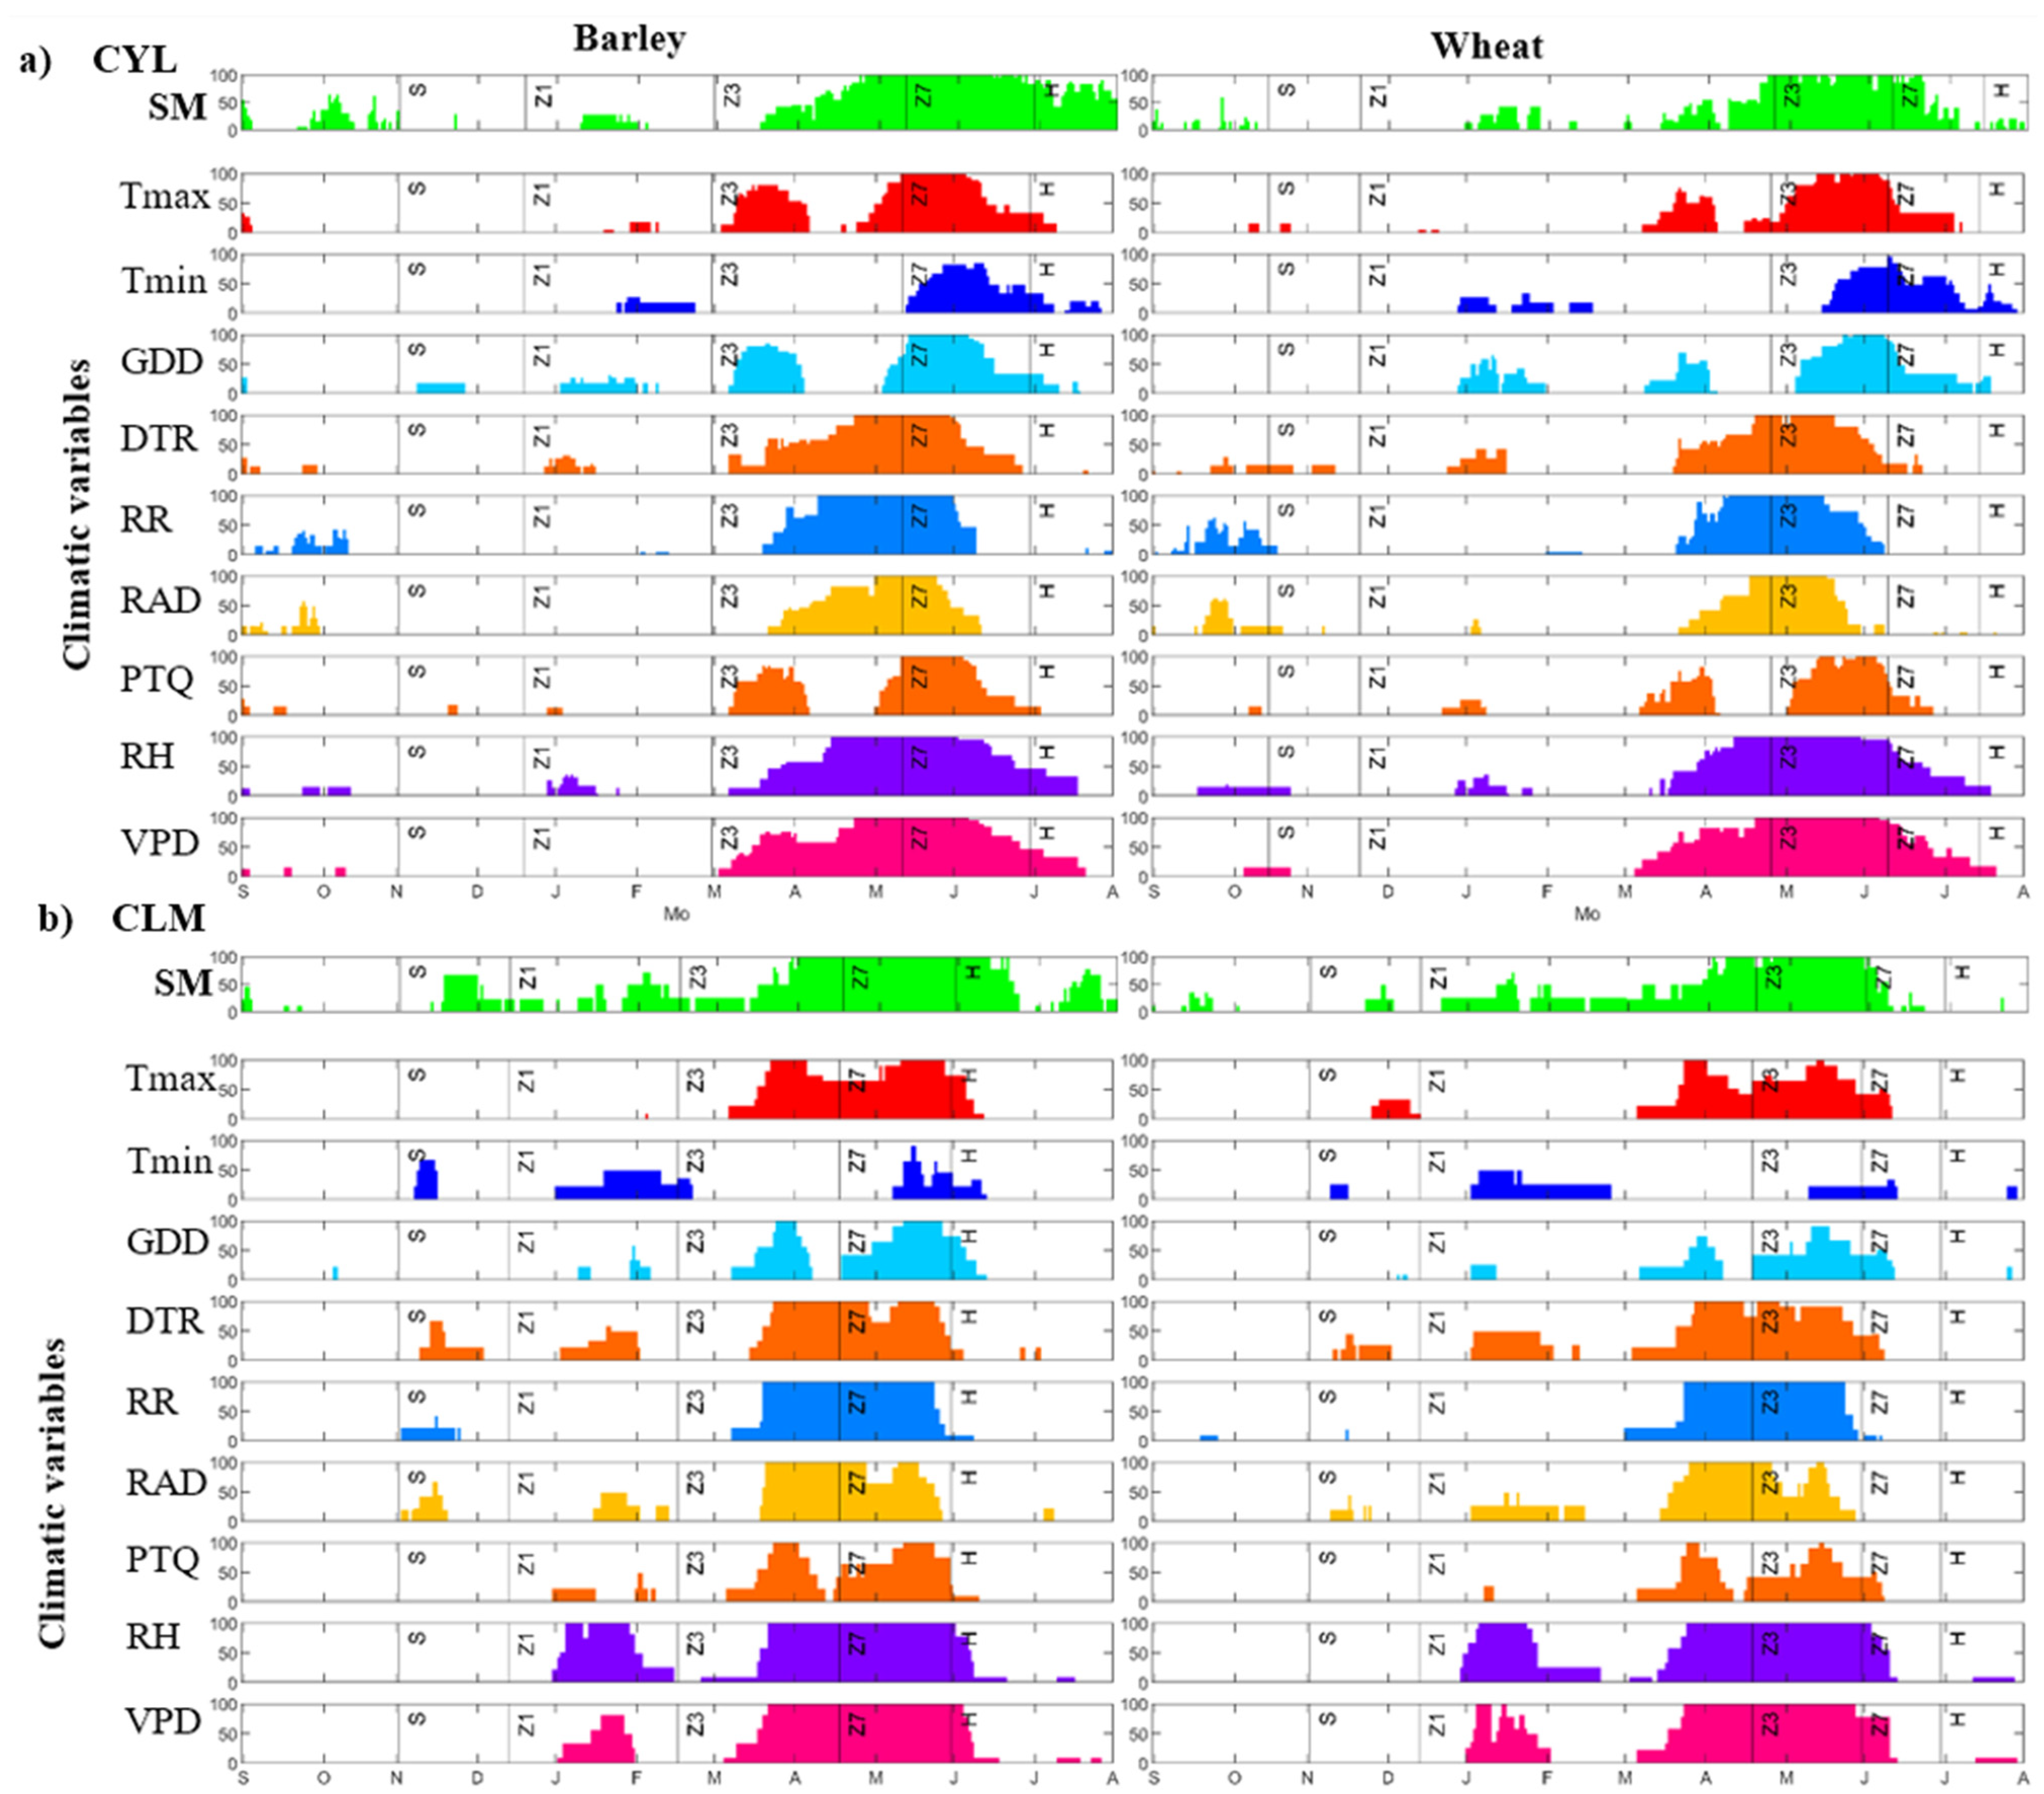
3.2. Periods of Impact of Climatic Variables on Wheat and Barley Yields

The results of the correlation of the different climatic variables with annual yield differ in magnitude, timing, duration, and sign of the significant period of correlation. Several climatic variables show multiple periods of correlation throughout the year, but while there are differences in these secondary periods of correlations, all of them concur on having the most significant period in spring alongside soil moisture in the three months before harvesting [62] (Figure 5, Figure 6, Figure A1 and Figure A2). This concentration of impacts during spring is consistent with studies at regional and continental scales [63].
Correlations between climatic variables and yield are analyzed in comparison to those of soil moisture. Since both LISFLOOD and ERA5-Land soil moisture data show very similar results, only ERA5-Land results are shown (lines in green in Figure 5, Figure 6, Figure A1 and Figure A2). The correlation values of the significant periods are generally over 0.4 and barely peak over 0.6. Consequently, they are comparatively lower than the R values of soil moisture, whose values easily surpass values of 0.6, peaking at 0.8. The most influential climatic variables on yield, from higher to lower correlation magnitudes, were RH and its derivative, VPD, followed by DTR and Tmax. Then comes PTQ, which integrates radiation and temperature data, such as the definition of GDD that depends on Tmax over Tmin. Finally, Tmin remains the least impacting climatic variable on cereal yields.
Most climatic variables show distinct signs of the correlation coefficient. Some even show a counterintuitive relationship between the climatic variable and yield, such as the negative relationship of RAD or GDD with yield. Those such as Tmin, showing alternating signs, may indicate that different crop development processes become affected at various times during the growing season. The variables with positive (direct relation) significance on yield are mainly RR and RH. The variables with prevailingly negative relationships (inverse relationships) with cereal yields include temperature and radiation variables, along with VPD. Magnitude, duration, timing, and the sign of the correlation of the climatic variables with barley yields resemble those of wheat to a great extent. Since barley is the dominant rainfed cereal crop in both CYL and CLM [37], barley results are shown in Figure 5 and Figure 6, while the wheat results are displayed in Figure A1 and Figure A2 in Appendix A.
Tmin and Tmax (Figure 5 and Figure 6) show a prevailing period of negative correlations with yield in spring with moderate R values between 0.35 and 0.6. The influence of Tmax on yield surpasses that of Tmin during early spring, March to early May, while Tmin remains more significant than Tmax in yield during late spring, late May to June. Tmax differs from Tmin in having a double peak of negative correlations instead of a single peak within springtime (Figure 5 and Figure 6). The peak of Tmax in March seems to agree with the sensitivity of the start of strong vegetative growth [64], which corresponds well to a report from France in April for the same phenophase [13]. This Tmax peak, together with the peak in May, is consistent with the reported impact of high temperatures, both at pre- and post-anthesis periods [65]. The relatively high impact of Tmax compared to other variables agrees with multiple studies showing that increased Tmax promotes severe reductions in yield due to the shortening of phenological stages caused by leaf senescence, inhibition of kernel formation, and alteration of nutrition [66,67,68], particularly during heat waves [69]. Despite the increase in grain-filling rates due to Tmax [70], yield reductions can be expected [67]. Therefore, the impact of this variable, which is overly considered unfavorable during the early and late stages of rainfed cereals [71], is consistent with the results. The concurrence of anomalous Tmax with soil moisture deficits was also reported to be particularly harmful to Spanish yields [72].
Regarding other values of much lower correlation, a slight positive correlation occurs during late December and January in some provinces, and is more apparent in wheat (Figure A1 and Figure A2). Negative correlations were expected to arise during the wintertime, given the importance of vernalization [73]. However, our results do not show negative, but positive correlations, especially in the last part of the vernalization period (February-March), in line with reports showing the adaptability of Spanish cereal races to mild conditions [74]. Instead, these results may indicate some benefits of mild Tmin temperatures during late winter. An explanation for this may arise from nighttime temperatures when Tmin occurs. A positive effect of mild winter nighttime temperatures on postanthesis stages (i.e., grain-filling stage) by an increase in the nutrient source capacity of plants during winter that materializes during grain filling has been also indicated [75]. Outcomes from a few provinces may support this phenomenon, albeit more analysis would be welcomed.
Similarly, the most delayed significant period of correlation among the studied climatic variables is the late peak of negative correlations of Tmin from Z7 to harvest, which is also the period of the most significant impact of Tmin. This period of Tmin is less significant in CLM than in CYL. The sign of this correlation implies that the lower the Tmin in this stage, the better the cereal yields. This pattern of negative correlation might simply be realizing the information provided by the Tmax, that heat penalizes yields in the late stages of crops. However, as discussed above, nighttime temperatures may also influence yields. The negative impact of high nighttime temperatures on yields has been more widely explored in cereals other than wheat. However, there is evidence that cool nights, suitable for restoring the water and nutrient balance of plants, seem particularly helpful in the last stages of wheat when delayed senescence is preferable [76]. Consequently, the observations of this study may match the reported benefit of cool nights in the late stages of the crops before harvest.
Variables derived from Tmax and Tmin, such as GDD, tend to inherit the bimodal pattern of correlation of early and late springtime of Tmax, while DTR maintains the unimodal pattern of Tmin, especially during late April and early May, when Tmax and Tmin differ notably (Figure 5, Figure 6, Figure A1 and Figure A2). The influence of GDD on yields in winter is positive, indicating a direct relationship with yields, and indicating that the anticipation of the early growth (establishment) of crops is beneficial to yields. Several studies have been described to mediate the increase in yields due to early vigor [77], such as root development and early flowering. The positive correlation between Z1 and Z3 may indicate the benefits of enhanced rooting and tillering. The negative correlation at Z3, indicating an early start of the quick crop-development stages, suggests the contrary.
Similarly, the second peak of negative correlations during May expands on the idea that shortening key stages due to the early accumulation of GDD, such as stem elongation and grain filling, is overly damaging to yield [67]. Regardless, the bimodal pattern of negative correlation in March and May denotes that there are limits to the pace of crop development during these months. Such narrow margins for the transition from vegetative to reproductive phenophases correspond well to the ranges in GDD published for wheat and barley [78]. Overall, GDD seems to inherit the alternating sign of Tmin, thus suggesting that crops appreciate rapid development in the establishing stage and slow development in the growth and reproductive stages.
Spring displays the primary cluster of negative correlations of DTR with yield, indicating that high thermal amplitude reduces yields. Our results, showing an important period of impact of DTR on yields during spring, are consistent with studies describing the damaging effect of high DTR throughout the year, especially during the critical phenological stages of autumn and spring [71]. A possible cause of this impact could be the alteration of protein production due to DTR, which causes a decline in grain filling and premature leaf senescence [79]. The present study results are not in line with the intriguing neutral effect of DTR on wheat yields reported in France by [30], but support the relevant role of DTR in postanthesis crop development [31]. DTR also shows more significant patterns in autumn and winter around the sowing and emergence stages, respectively, compared to Tmax. Increases in DTR have been reported to reduce wheat yields during the establishment of crops [14].
RAD shows a distinct unimodal period of significant negative correlation with yields during April and May, similar to that of DTR in the duration and time of peak but with smaller R values. The inverse relationship determined by the negative correlation challenges the assumption that radiation is always beneficial for crops, but this was already described in southern Europe [13,14]. The results may agree with studies reporting that high radiation worsens yields. There is increasing evidence that the UV-B spectrum of light [80], as well as photoinhibition, damages wheat and barley crops during the critical phenophases, especially during underwater stress [81]. RAD prevailingly peaks in late April (CYL) or March (CLM), which agrees with the particularly relevant impact of radiation around anthesis [33,82]. Conversely, PTQ results convey a troublesome interpretation. PTQ has been widely reported to directly influence the grain number of major cereal species during the period of heading, anthesis, and the start of grain filling [17]. However, since the definition of PTQ assumed in this study depends on RAD, Tmax and Tmin and all three variables show negative correlations during March and May, and PTQ hardly displays positive correlations. In this line, the relationship between PTQ and yield is proportional when all other resources are optimally available [83], which is not the case for soil moisture and other water-related variables in our results. In view of the results, it may be interpreted that PTQ is particularly sensitive to interactions with temperature/radiation and water-related variables.
The climatic variables related to the water balance, such as RH, VPD, and RR, generally show high correlations during the growing season, particularly during the springtime peak. The R values of RH and VPD (Figure 5, Figure 6, Figure A1 and Figure A2) reach values between 0.5 and 0.8 from late March to late June, the main critical period impacting yield. The magnitude of the correlation of these variables with yields is lower but of a comparable temporal pattern to that of SM. However, while RH and RR show a positive sign of correlation similar to SM, VPD has a negative sign. Precipitation reportedly dominates the climatic influences on yields, especially during the critical springtime period [13,66]. Both physiological and climatic studies have highlighted the relevance of precipitation as a major driver explaining crop yield, but the use of drought indices, mainly focused on precipitation [7], may have initially neglected the role of other water-related variables. Setting aside that soil moisture can be the critical factor in this respect, as shown in the previous section, variables informing about water status in the atmosphere deserve attention. Evapotranspiration has become a basic part of many studies evaluating its impact on crop yield, usually integrated into drought indices [58].
Nonetheless, since yield (i.e., accumulated biomass) is related to the transpiration coefficient, which depends on RH and temperature or VPD [84], both variables represent a process-based, easy-to-obtain, and less uncertain alternative to evapotranspiration. The high correlation values of RH and VPD in this study show the potential of these two variables as indicators of yield during the critical springtime period, as both climatic and physiological studies have shown before [84,85]. Moreover, they agree with studies reporting the relationship of transpiration anomalies to yield during the final stages of the crop cycle [86].
Analyzing the temporal patterns of the correlations comparing the results of RR, RH, and SM, a lag between water variables is noticeable (Figure 5 and Figure 6). RR correlations with yield peak the earliest, and they last for the shortest time in spring regardless of the region, consistent with results from other Mediterranean areas [11,13]. The delay sequence of the correlations of RR, RH, and VPD with yield compared to soil moisture is consistent with studies indicating that the consumption of available water in upper soil layers anticipates stress in the following phenological stages [39]. After all, SM remains delayed among all water-related variables following its water-storing nature. Secondary periods of correlation in autumn and winter are less apparent in the cases of RH, RR, and, especially, VPD than in the case of SM.
In most cases, R values are below 0.4. RR correlations in autumn show positive effects of rainfall anomalies on yield in the initial crop-establishment period, which is relevant considering the increasingly negative soil moisture trend observed at the start of the crop cycle [52]. Winter correlations appear in the case of RH but not in the case of RR, contrary to the case in France, which is wetter than Spain, where winter rainfall can negatively affect crops due to waterlogging [13].
Regarding the geographic differences, the correlation results for all variables tend to be delayed in CYL compared to CLM in the order of two to six weeks (Figure 5 and Figure A1 vs. Figure 6 and Figure A2). The timing differences between regions are remarkable when considering the peak of correlations. The peak of correlations of climatic variables in CLM tends to be toward the beginning of the significant period of correlations. In contrast, the peak of CYL appears mainly around the midpoint of the period. In the view that soil moisture peaks between regions do not differ noticeably, the offset between the peak of influence of climatic variables and soil moisture in CLM is much greater than in CYL. The offset of more than a month in CLM compared to a few weeks in CYL may be a source of great stress for crops in this region, which is consistent with the low absolute cereal yields in CLM compared to those in CYL.
While attributing changes in yield demands further evaluation of the interactions between factors [31], the information provided by the individual analysis of the factors is worth special attention. The individual analysis is of great value because the temporal impact of soil moisture and climatic factors has rarely been assessed from a crop-monitoring focus. The synchrony between the factors is essential to identifying their impact on the temporal development of crops, especially in the late stages [87]. The easiest way to summarize the correlations of the variables described above is by obtaining plots, such as Figure 7, displaying the timing of the significant impact of each climatic variable and soil moisture on yield during the growing season.
The plot describes the percentage of the area of each region where significant correlations of each variable occur on the same day. This metric can also work as an indicator of the spatial heterogeneity of the influence of climatic variables on yield. At first glance, a remarkable prevalence of the significance of the impact of climatic variables in spring can be identified during the period from early March to early June in CLM and from March to July in CYL, when the plants experience the stages of solid growth and reproduction [62,63]. Most secondary periods of correlation, which Figure 5 and Figure 6 describe by low R values, show periods of lesser areal influence in Figure 7. Most of these secondary periods of correlation affect less than 100% of the area of the region, and many of them barely reach half of the CLM or CYL area. This comparison of areal influence unveils the relatively low relevance of the secondary periods compared to the critical springtime period, spanning mainly the vegetative and reproductive stages of the crops from Z3 to H.
Within the critical period, water-related variables such as HR, VPD, and especially SM, but not RR, span most of the time. The soil moisture significance generally extends for longer into summer than any other climatic variable, and more so in the northernmost region than the southernmost region. The extended duration agrees with the long-reported strong and slowly decreasing dependence of cereals on water availability during the last stages of the growing season [19,88]. RR does not follow this pattern, since rainfall is not directly a variable of interaction with plants, whose water uptake depends on soil water content and atmospheric evaporative demand. Overall, water-related correlations tend to affect each region entirely (reaching 100% of the area experiencing significant correlations on the same day) during the critical period from March to June.
In contrast, temperature and radiation-related variables determine earlier, more fragmented, and shorter periods of influence on yield than RH, VPD, or SM, still of great relevance due to the important sensitivity around the heading period for grain parameters [89]. All other temperature- and radiation-related variables do not show their influence over that region. The differing synchrony between the solid, long-lasting period of influence of water-related variables compared to the short, early periods of energy-related variables implies that the climatic sensitivity of cereals in water-limited areas is ruled by water stress throughout essential phenophases, albeit very vulnerable to energy for short periods. This shifting sensitivity throughout the growing season is consistent with the particularities of water-limited environments, where climatic anomalies frequently determine a fragile equilibrium of the interplay between water and energy factors [90].
Regarding spatial differences, the timing of the influence of climatic variables on yield described above is very similar between the CYL and CLM regions. The higher latitude and altitude of CYL compared to CLM (Figure 1) explain the delay of CYL significant periods compared to CLM periods. The more prolonged 100% areal impact of water-related variables in CLM than in CYL seems reasonable, given the latitudinal and altitudinal differences between the regions. Thus, given the general agreement in the temporal correlation patterns of climatic variables with yields between these two rainfed agricultural regions, geographic differences seem less critical than soil moisture, climate, and phenology in terms of the drivers and controls of crop yield.
Among all studied variables, soil moisture correlations show a higher magnitude than climatic correlations, suggesting that soil moisture is the primary driver of wheat and barley yields. Long ago, studies at the physiological level [91] pointed to soil moisture as the best estimator of crop yields, followed by minimum and maximum temperatures. In less arid areas, rainfall may also outcompete soil moisture as the best indicator [20], but the results of the present study support work reporting the dominant impact of water variability over temperature in water-limited areas, in contrast to the rest of temperate western Europe [32].

4. Conclusions

The analysis of correlations of soil moisture and climatic variables with yield during the phenological cycle of wheat and barley in water-limited environments provides insights into the relative impact of the relevant variables of influence, and the timing and signs of the critical periods of correlation.
Soil moisture is the dominant driver of the variability of rainfed wheat and barley yields, both in magnitude and duration. Significant correlations of soil moisture with annual yield extend from March to June, with a slight timing difference for wheat and barley. Soil moisture persistently has more impact than any other variable during the main phases of growth and reproduction in the cycle of crops, specifically, the phenological stages of crop establishment, stem elongation and booting, heading, grain filling and even maturation. Only water-related variables such as air relative humidity, vapor pressure deficit, and to a lesser extent, accumulated rainfall, reach comparable correlations, and mostly for shorter periods.
Synchrony between soil moisture and climatic factors determines a critical period of impact on yield during the quick succession of phenological stages of springtime. Spring also determines a notable concurrence of the impact of soil moisture and climatic variables on yields, prevailingly of water-related variables over energy-related ones. Water-related variables show a unimodal correlation pattern during spring compared to the several periods of correlation shown by temperatures or radiation, likely related to specific demands of crop physiology.
The share of soil moisture and climatic factors impacting yield at each phenological stage determines two main regimes of sensitivity of yield to environmental factors. The prevailing regime is dominated by limiting factors: soil moisture, RR, RH, and Tmin in crop establishment stages. The second case is dominated by factors causing overexposure, such as Tmax and Tmin, GDD shortening the phenology, DTR, RAD and PTQ, and VPD in spring. The balance between these two types of factors determines the risk of yield decline due to limiting or overexposing conditions.
Characterization of the impact of environmental variables on cereal yields demands special attention to soil moisture as the dominant environmental factor throughout the crop cycle. The temporal description is crucial since the evolving sensitivity of crops to limiting or overexposing conditions in each phenological stage determines specific critical periods of impact. The temporal information is relevant not only for the understanding of the processes but also for applications such as crop monitoring and forecasting, since the fluctuations in yield of major rainfed crops have increasingly important economic and social consequences.

Author Contributions

Conceptualization, J.M.-F.; methodology, data processing, J.G., P.B.-V.; Á.G.-Z., L.A.-M., J.M.-F.; formal analysis and writing J.G., P.B.-V.; Á.G.-Z., L.A.-M., C.M.H.-J., J.M.-F. All authors have read and agreed to the published version of the manuscript.

Funding

This study was supported by the Spanish Ministry of Science and Innovation (projects ESP2017-89463-C3-3-R and PID2020-114623RB-C33), the Castilla y León Government (projects SA112P20 and CLU-2018-04), and the European Regional Development Fund (ERDF).

Institutional Review Board Statement

Not applicable.

Informed Consent Statement

Not applicable.

Data Availability Statement

Databases used are freely available online on their respective webpages of EOBSv23 (https://surfobs.climate.copernicus.eu/dataaccess/access_eobs.php accessed on 4 April 2022), ERA5-Land (https://cds.climate.copernicus.eu/cdsapp#!/dataset/reanalysis-era5-land?tab=overview accessed on 4 April 2022) and Copernicus-Joint Research Center of the European Commission for LISFLOOD https://cds.climate.copernicus.eu/cdsapp#!/dataset/efas-historical?tab=form accessed on 4 April 2022, while yield and phenology datasets are available upon request from the Spanish Ministry of Agriculture (MAPA).

Conflicts of Interest

The authors declare no conflict of interest. The funders had no role in the design of the study; in the collection, analyses, or interpretation of data; in the writing of the manuscript, or in the decision to publish the results.

Appendix A

Figure A1. Daily correlations (line plots indicating the R coefficient values) and periods of significance (colored segments of the lines) of the most relevant climatic variables with annual yields of wheat during the growing season in each province of CYL (see symbols). Vertical lines indicate phenological stages (Zi) of the Zadoks scale for wheat in CYL. Periods of significant correlation of ERA5-Land soil moisture with annual wheat yields (Figure 4(a2)) are shown in green and nonsignificant periods are in light gray for reference. Months are indicated on the primary x-axis and Zadok’s stages over the vertical lines from the secondary x-axis.
Agriculture 12 00533 g0a1
Figure A2. Daily correlations (line plots indicating the R coefficient values) and periods of significance (colored segments of the lines) of the most relevant climatic variables with annual yields of wheat during the growing season in each province of CLM (see symbols). Vertical lines indicate phenological stages (Zi) of the Zadoks scale for wheat in CLM. Periods of significant correlation of ERA5-Land soil moisture with annual wheat yields (Figure 4(a4)) are shown in green and nonsignificant periods are in light gray for reference. Months are indicated on the primary x-axis and Zadok’s stages over the vertical lines from the secondary x-axis.
Agriculture 12 00533 g0a2

References

  1. López-Bermúdez, F.; García-Gómez, J. Desertification in the arid and semiarid Mediterranean regions. A food security issue. In Desertification in the Mediterranean Region. A Security Issue; Springer: Dordrecht, The Netherlands, 2006; pp. 401–428. [Google Scholar]
  2. Bradford, J.B.; Schlaepfer, D.R.; Lauenroth, W.K.; Yackulic, C.B.; Duniway, M.; Hall, S.; Tietjen, B. Future soil moisture and temperature extremes imply expanding suitability for rainfed agriculture in temperate drylands. Sci. Rep. 2017, 7, 12923. [Google Scholar] [CrossRef] [PubMed] [Green Version]
  3. Rosegrant, M.W.; Cai, X.; Cline, S.A.; Nakagawa, N. The Role of Rainfed Agriculture in the Future of Global Food Production; No. 581-2016-39482; International Food Policy Research Institute: Washington, DC, USA, 2002. [Google Scholar]
  4. Lobell, D.B.; Schlenker, W.; Costa-Roberts, J. Climate trends and global crop production since 1980. Science 2011, 333, 616–620. [Google Scholar] [CrossRef] [PubMed] [Green Version]
  5. Iizumi, T.; Ramankutty, N. Changes in yield variability of major crops for 1981–2010 explained by climate change. Environ. Res. Lett. 2016, 11, 034003. [Google Scholar] [CrossRef]
  6. Porter, J.R.; Semenov, M.A. Crop responses to climatic variation. Philos. Trans. R. Soc. B 2005, 360, 2021–2035. [Google Scholar] [CrossRef] [PubMed]
  7. Vicente-Serrano, S.M.; Cuadrat-Prats, J.M.; Romo, A. Early prediction of crop production using drought indices at different time scales and remote sensing data: Application in the Ebro Valley (north-east Spain). Int. J. Remote Sens. 2006, 27, 511–518. [Google Scholar] [CrossRef]
  8. Illston, B.G.; Basara, J.B. Analysis of short-term droughts in Oklahoma. Eos Trans. Am. Geophys. Union 2003, 84, 157–161. [Google Scholar] [CrossRef]
  9. Saini, H.S.; Westgate, M.E. Reproductive development in grain crops during drought. Adv. Agron. 1999, 68, 59–96. [Google Scholar]
  10. Slafer, G.; Rawson, H. Sensitivity of Wheat Phasic Development to Major Environmental Factors: A Re-Examination of Some Assumptions Made by Physiologists and Modellers. Aust. J. Plant Physiol. 1994, 21, 393. [Google Scholar] [CrossRef]
  11. Dalezios, N.R.; Loukas, A.; Bampzelis, D. The role of agrometeorological and agrohydrological indices in phenology of wheat in central Greece. Phys. Chem. Earth Parts A/B/C 2002, 27, 1019–1023. [Google Scholar] [CrossRef]
  12. Cantelaube, P.; Terres, J.M.; Doblas-Reyes, F.J. Influence of climate variability on European agriculture—Analysis of winter wheat production. Clim. Res. 2004, 27, 135–144. [Google Scholar] [CrossRef]
  13. Ceglar, A.; Toreti, A.; Lecerf, R.; Van der Velde, M.; Dentener, F. Impact of meteorological drivers on regional inter-annual crop yield variability in France. Agric. For. Meteorol. 2016, 216, 58–67. [Google Scholar] [CrossRef]
  14. Hernández-Barrera, S.; Rodriguez-Puebla, C.; Challinor, A.J. Effects of diurnal temperature range and drought on wheat yield in Spain. Theor. Appl. Climatol. 2017, 129, 503–519. [Google Scholar] [CrossRef]
  15. Sinclair, T.R.; Devi, J.; Shekoofa, A.; Choudhary, S.; Sadok, W.; Vadez, V.; Rufty, T. Limited-transpiration response to high vapor pressure deficit in crop species. Plant Sci. 2017, 260, 109–118. [Google Scholar] [CrossRef] [PubMed]
  16. Franch, B.; Vermote, E.F.; Becker-Reshef, I.; Claverie, M.; Huang, J.; Zhang, J.; Sobrino, J.A. Improving the timeliness of winter wheat production forecast in the United States of America, Ukraine and China using MODIS data and NCAR Growing Degree Day information. Remote Sens. Environ. 2015, 161, 131–148. [Google Scholar] [CrossRef]
  17. Cossani, C.M.; Slafer, G.A.; Savin, R. Yield and biomass in wheat and barley under a range of conditions in a Mediterranean site. Field Crops Res. 2009, 112, 205–213. [Google Scholar] [CrossRef]
  18. Aspinall, D.; Nicholls, P.B.; May, L.H. The effects of soil moisture stress on the growth of barley. I. Vegetative development and grain yield. Aust. J. Agric. Res. 1964, 15, 729. [Google Scholar] [CrossRef]
  19. Nairizi, S.; Rydzewski, J.R. Effects of Dated Soil Moisture Stress on Crop Yields. Exp. Agric. 1977, 13, 51. [Google Scholar] [CrossRef]
  20. Rossato, L.; Alvalá, R.C.; Marengo, J.A.; Zeri, M.; Cunha, A.P.; Pires, L.; Barbosa, H.A. Impact of soil moisture on crop yields over Brazilian semiarid. Front. Environ. Sci. Eng. 2017, 5, 73. [Google Scholar] [CrossRef] [Green Version]
  21. Kerr, Y.H.; Waldteufel, P.; Wigneron, J.P.; Delwart, S.; Cabot, F.; Boutin, J.; Mecklenburg, S. The SMOS mission: New tool for monitoring key elements of the global water cycle. Proc. IEEE 2010, 98, 666–687. [Google Scholar] [CrossRef] [Green Version]
  22. Entekhabi, D.; Njoku, E.G.; O’Neill, P.E.; Kellogg, K.H.; Crow, W.T.; Edelstein, W.N.; Van Zyl, J. The soil moisture active passive (SMAP) mission. Proc. IEEE 2010, 98, 704–716. [Google Scholar] [CrossRef]
  23. Van Der Knijff, J.M.; Younis, J.; De Roo, A.P.J. LISFLOOD: A GIS-based distributed model for river basin scale water balance and flood simulation. Int. J. Geogr. Inf. Syst. 2010, 24, 189–212. [Google Scholar] [CrossRef]
  24. Martínez-Fernández, J.; González-Zamora, A.; Sánchez, N.; Gumuzzio, A.; Herrero-Jiménez, C.M. Satellite soil moisture for agricultural drought monitoring: Assessment of the SMOS derived Soil Water Deficit Index. Remote Sens. Environ. 2016, 177, 277–286. [Google Scholar] [CrossRef]
  25. González-Zamora, A.; Almendra-Martín, L.; de Luis, M.; Martínez-Fernández, J. Influence of soil moisture versus climatic factors in Pinus halepensis growth variability in Spain: A study with remote sensing and modeled data. Remote Sens. 2021, 13, 757. [Google Scholar] [CrossRef]
  26. Sepulcre-Canto, G.; Horion, S.M.A.F.; Singleton, A.; Carrao, H.; Vogt, J. Development of a Combined Drought Indicator to detect agricultural drought. Nat. Hazards Earth Syst. Sci. 2012, 12, 3519–3531. [Google Scholar] [CrossRef] [Green Version]
  27. Scaini, A.; Sánchez, N.; Vicente-Serrano, S.M.; Martínez-Fernández, J. SMOS-derived soil moisture anomalies and drought indices: A comparative analysis using in situ measurements. Hydrol. Process. 2015, 29, 373–383. [Google Scholar] [CrossRef]
  28. Ribeiro, A.F.; Russo, A.; Gouveia, C.M.; Páscoa, P. Modelling drought-related yield losses in Iberia using remote sensing and multiscalar indices. Theor. Appl. Climatol. 2019, 136, 203–220. [Google Scholar] [CrossRef]
  29. Pablos, M.; Martínez-Fernández, J.; Sánchez, N.; González-Zamora, Á. Temporal and spatial comparison of agricultural drought indices from moderate resolution satellite soil moisture data over Northwest Spain. Remote Sens. 2017, 9, 1168. [Google Scholar] [CrossRef] [Green Version]
  30. Lobell, D.B.; Field, C.B. Global scale climate–crop yield relationships and the impacts of recent warming. Environ. Res. Lett. 2007, 2, 014002. [Google Scholar] [CrossRef]
  31. Asseng, S.; Ewert, F.; Martre, P.; Rötter, R.P.; Lobell, D.B.; Cammarano, D.; Zhu, Y. Rising temperatures reduce global wheat production. Nat. Clim. Chang. 2015, 5, 143–147. [Google Scholar] [CrossRef]
  32. Ray, D.; Gerber, J.; MacDonald, G. Climate variation explains a third of global crop yield variability. Nat. Commun. 2015, 6, 5989. [Google Scholar] [CrossRef] [Green Version]
  33. Fischer, R.A. Number of kernels in wheat crops and the influence of solar radiation and temperature. J. Agric. Res. 1985, 105, 447–461. [Google Scholar] [CrossRef]
  34. Reynolds, M.; Foulkes, M.J.; Slafer, G.A.; Berry, P.; Parry, M.A.; Snape, J.W.; Angus, W.J. Raising yield potential in wheat. J. Exp. Bot. 2009, 60, 1899–1918. [Google Scholar] [CrossRef] [PubMed] [Green Version]
  35. Christen, O.; Sieling, K.; Richter-Harder, H.; Hanus, H. Effects of temporary water stress before anthesis on growth, development and grain yield of spring wheat. Eur. J. Agron. 1995, 4, 27–36. [Google Scholar] [CrossRef]
  36. Chown, S.L.; Gaston, K.J.; Robinson, D. Macrophysiology: Large-scale patterns in physiological traits and their ecological implications. Funct. Ecol. 2004, 18, 159–167. [Google Scholar] [CrossRef]
  37. EUROSTAT: Regional Statistics: Reference Guide; Statistical Office of the European Communities: Luxembourg, 2021.
  38. Cornes, R.C.; van der Schrier, G.; van den Besselaar, E.J.; Jones, P.D. An ensemble version of the E-OBS temperature and precipitation data sets. J. Geophys. Res. Atmos. 2018, 123, 9391–9409. [Google Scholar] [CrossRef] [Green Version]
  39. Kirkegaard, J.A.; Lilley, J.M.; Howe, G.N.; Graham, J.M. Impact of subsoil water use on wheat yield. Aust. J. Agric. Res. 2007, 58, 303–315. [Google Scholar] [CrossRef]
  40. Muñoz-Sabater, J.; Dutra, E.; Agustí-Panareda, A.; Albergel, C.; Arduini, G.; Balsamo, G.; Thépaut, J.N. ERA5-Land: A state-of-the-art global reanalysis dataset for land applications. Earth Syst. Sci. Data 2021, 13, 4349–4383. [Google Scholar] [CrossRef]
  41. MAPA. Anuario de Estadística; Ministerio de Agricultura Pesca y Alimentación (MAPA): Madrid, Spain, 2021. [Google Scholar]
  42. Zadoks, J.C.; Chang, T.T.; Konzak, C.F. A decimal code for the growth stages of cereals. Weed Sci. 1974, 14, 415–421. [Google Scholar] [CrossRef]
  43. Beck, H.E.; Zimmermann, N.E.; McVicar, T.R.; Vergopolan, N.; Berg, A.; Wood, E.F. Present and future Köppen-Geiger climate classification maps at 1-km resolution. Sci. Data 2018, 5, 180214. [Google Scholar] [CrossRef] [Green Version]
  44. MAPA. Caracterización de Comarcas Agrarias; Ministerio de Agricultura, Pesca y Alimentación (MAPA): Madrid, Spain, 2012. [Google Scholar]
  45. Martínez-Fernández, J.; González-Zamora, A.; Almendra-Martín, L. Soil moisture memory and soil properties: An analysis with the stored precipitation fraction. J. Hydrol. 2021, 593, 125622. [Google Scholar] [CrossRef]
  46. Ceballos, A.; Martinez-Fernandez, J.; Santos, F.; Alonso, P. Soil-water behaviour of sandy soils under semi-arid conditions in the Duero Basin (Spain). J. Arid. Environ. 2002, 51, 501–519. [Google Scholar] [CrossRef]
  47. Slafer, G.A.; Savin, R. Developmental Base Temperature in Different Phenological Phases of Wheat (Triticum aestivum). J. Exp. Bot. 1991, 42, 1077–1082. [Google Scholar] [CrossRef]
  48. Ortiz-Monasterio, R.; Dhillon, S.S.; Fischer, R.A. Date of sowing effects on grain yield and yield components of irrigated spring wheat cultivars and relationships with radiation and temperature in Ludhiana, India. Field Crops Res. 1994, 37, 169–184. [Google Scholar] [CrossRef]
  49. Yoder, R.E.; Odhiambo, L.O.; Wright, W.C. Effects of vapor-pressure deficit and net-irradiance calculation methods on accuracy of standardized Penman-Monteith equation in a humid climate. J. Irrig. Drain. Eng. 2005, 131, 228–237. [Google Scholar] [CrossRef]
  50. De Rosnay, P.; Drusch, M.; Vasiljevic, D.; Balsamo, G.; Albergel, C.; Isaksen, L. A simplified extended Kalman filter for the global operational soil moisture analysis at ECMWF. Q. J. R. Meteorol. Soc. 2013, 139, 1199–1213. [Google Scholar] [CrossRef]
  51. Martínez-Fernández, J.; Almendra-Martín, L.; De Luis, M.; González-Zamora, A.; Herrero-Jiménez, C. Tracking tree growth through satellite soil moisture monitoring: A case study of Pinus halepensis in Spain. Remote Sens. Environ. 2019, 235, 111422. [Google Scholar] [CrossRef]
  52. Almendra-Martín, L.; Martínez-Fernández, J.; González-Zamora, Á.; Benito-Verdugo, P.; Herrero-Jiménez, C.M. Agricultural drought trends on the Iberian Peninsula: An analysis using modeled and reanalysis soil moisture products. Atmosphere 2021, 12, 236. [Google Scholar] [CrossRef]
  53. Lobell, D.B.; Asner, G.P. Climate and management contributions to recent trends in U. S. agricultural yields. Science 2003, 299, 1032. [Google Scholar] [CrossRef]
  54. Siebert, S.; Döll, P.; Hoogeveen, J.; Faures, J.M.; Frenken, K.; Feick, S. Development and validation of the global map of irrigation areas. Hydrol. Earth Syst. Sci. 2005, 9, 535–547. [Google Scholar] [CrossRef]
  55. MAPA. Calendario de Siembra, Recolección y Comercialización; NIPO: 003211182; Ministerio de Agricultura, Pesca y Alimentación (MAPA): Madrid, Spain, 2021. [Google Scholar]
  56. Allen, R.G.; Pereira, L.S.; Raes, D.; Smith, M. Evapotranspiración del Cultivo: Guías para la Determinación de los Requerimientos de Agua de los Cultivos; FAO Serie de Riego y Drenaje 56; FAO: Rome, Italy, 2006; p. 298. [Google Scholar]
  57. González, A.; Martín, I.; Ayerbe, L. Response of barley genotypes to terminal soil moisture stress: Phenology, growth, and yield. Aust. J. Agric. Resour. Econ. 2007, 58, 29. [Google Scholar] [CrossRef]
  58. Peña-Gallardo, M.; Vicente-Serrano, S.M.; Quiring, S.; Svoboda, M.; Hannaford, J.; Tomas-Burguera, M.; El Kenawy, A. Response of crop yield to different timescales of drought in the United States: Spatio-temporal patterns and climatic and environmental drivers. Agric. For. Meteorol. 2019, 264, 40–55. [Google Scholar] [CrossRef] [Green Version]
  59. López-Castañeda, C.; Richards, R.A. Variation in temperate cereals in rainfed environments I. Grain yield, biomass and agronomic characteristics. Field Crop. Res. 1994, 37, 51–62. [Google Scholar] [CrossRef]
  60. Samarah, N.H. Effects of drought stress on growth and yield of barley. Agron. Sustain. Dev. 2005, 25, 145–149. [Google Scholar] [CrossRef] [Green Version]
  61. Mogensen, V.O.; Jensen, H.E.; Rab, M.A. Grain yield, yield components, drought sensitivity and water use efficiency of spring wheat subjected to water stress at various growth stages. Irrig. Sci. 1985, 6, 131–140. [Google Scholar] [CrossRef]
  62. Lobell, D.B.; Tebaldi, C. Getting caught with our plants down: The risks of a global crop yield slowdown from climate trends in the next two decades. Environ. Res. Lett. 2014, 9, 074003. [Google Scholar] [CrossRef]
  63. Zampieri, M.; Ceglar, A.; Dentener, F.; Toreti, A. Wheat yield loss attributable to heatwaves, drought and water excess at the global, national and subnational scales. Environ. Res. Lett. 2017, 12, 064008. [Google Scholar] [CrossRef]
  64. Varga, B.; Vida, G.; Varga-László, E.; Bencze, S.; Veisz, O. Effect of simulating drought in various phenophases on the water use efficiency of winter wheat. J. Agron. Crop. Sci. 2015, 201, 1–9. [Google Scholar] [CrossRef] [Green Version]
  65. Savin, R.; Calderini, D.F.; Slafer, G.A.; Abeledo, L.G. Final grain weight in wheat as affected by short periods of high temperature during pre-and post-anthesis under field conditions. Funct. Plant Biol. 1999, 26, 453–458. [Google Scholar] [CrossRef]
  66. Wardlaw, I.F.; Wrigley, C.W. Heat tolerance in temperate cereals: An overview. Funct. Plant Biol. 1994, 21, 695–703. [Google Scholar] [CrossRef]
  67. Dias, A.S.; Lidon, F.C. Evaluation of grain filling rate and duration in bread and durum wheat, under heat stress after anthesis. J. Agron. Crop. Sci. 2009, 195, 137–147. [Google Scholar] [CrossRef]
  68. Asseng, S.; Foster, I.A.N.; Turner, N.C. The impact of temperature variability on wheat yields. Glob. Chang. Biol. 2011, 17, 997–1012. [Google Scholar] [CrossRef]
  69. Van Der Velde, M.; Tubiello, F.N.; Vrieling, A.; Bouraoui, F. Impacts of extreme weather on wheat and maize in France: Evaluating regional crop simulations against observed data. Clim. Chang. 2012, 113, 751–765. [Google Scholar] [CrossRef] [Green Version]
  70. Asseng, S.; Milroy, S.P. Simulation of environmental and genetic effects on grain protein concentration in wheat. Eur. J. Agron. 2006, 25, 119–128. [Google Scholar] [CrossRef]
  71. Nouri, M.; Homaee, M.; Bannayan, M. Climate variability impacts on rainfed cereal yields in west and northwest Iran. Int. J. Biometeorol. 2017, 61, 1571–1583. [Google Scholar] [CrossRef]
  72. Webber, H.; Ewert, F.; Olesen, J.E.; Müller, C.; Fronzek, S.; Ruane, A.C.; Wallach, D. Diverging importance of drought stress for maize and winter wheat in Europe. Nat. Commun. 2018, 9, 4249. [Google Scholar] [CrossRef] [Green Version]
  73. Deng, W.; Casao, M.C.; Wang, P.; Sato, K.; Hayes, P.M.; Finnegan, E.J.; Trevaskis, B. Direct links between the vernalization response and other key traits of cereal crops. Nat. Commun. 2015, 6, 5882. [Google Scholar] [CrossRef]
  74. Casao, M.C.; Karsai, I.; Igartua, E.; Gracia, M.P.; Veisz, O.; Casas, A.M. Adaptation of barley to mild winters: A role for PPDH2. BMC Plant Biol. 2011, 11, 164. [Google Scholar] [CrossRef] [Green Version]
  75. Fan, Y.; Tian, Z.; Yan, Y.; Hu, C.; Abid, M.; Jiang, D.; Dai, T. Winter night-warming improves post-anthesis physiological activities and sink strength in relation to grain filling in winter wheat (Triticum aestivum L.). Front. Plant Sci. 2017, 8, 992. [Google Scholar] [CrossRef] [Green Version]
  76. Prasad, P.V.; Pisipati, S.R.; Ristic, Z.; Bukovnik, U.R.S.K.A.; Fritz, A.K. Impact of nighttime temperature on physiology and growth of spring wheat. Crop Sci. 2008, 48, 2372–2380. [Google Scholar] [CrossRef]
  77. Ludwig, F.; Asseng, S. Potential benefits of early vigor and changes in phenology in wheat to adapt to warmer and drier climates. Agric. Syst. 2010, 103, 127–136. [Google Scholar] [CrossRef]
  78. Miller, P.; Lanier, W.; Brandt, S. Using Growing Degree Days to Predict Plant Stages; Ag/Extension Communications Coordinator, Communications Services, Montana State University: Bozeman, MO, USA, 2001; pp. 994–2721. [Google Scholar]
  79. Zhao, H.; Dai, T.; Jing, Q.; Jiang, D.; Cao, W. Leaf senescence and grain filling affected by post-anthesis high temperatures in two different wheat cultivars. Plant Growth Regul. 2007, 51, 149–158. [Google Scholar] [CrossRef]
  80. Teramura, A.H.; Sullivan, J.H.; Ziska, L.H. Interaction of elevated ultraviolet-B radiation and CO2 on productivity and photosynthetic characteristics in wheat, rice, and soybean. Plant Physiol. 1990, 94, 470–475. [Google Scholar] [CrossRef] [PubMed] [Green Version]
  81. Feng, H.; Li, S.; Xue, L.; An, L.; Wang, X. The interactive effects of enhanced UV-B radiation and soil drought on spring wheat. S. Afr. J. Bot. 2007, 73, 429–434. [Google Scholar] [CrossRef]
  82. Savin, R.; Slafer, G.A. Shading effects on the yield of an Argentinian wheat cultivar. J. Agric. Sci. 1991, 16, 1–7. [Google Scholar] [CrossRef] [Green Version]
  83. Ahmed, M.; Hassan, F.U.; Razzaq, A.; Akram, M.N.; Aslam, M.; Ahmad, S.; Zia-ul-Haq, M. Is photothermal quotient a determinant factor for spring wheat yield. Pak. J. Bot. 2011, 43, 1621–1622. [Google Scholar]
  84. Schelling, K.; Born, K.; Weissteiner, C.; Kuhbauch, W. Relationships between Yield and Quality Parameters of Malting Barley (Hordeum vulgare L.) and Phenological and Meteorological Data. J. Agron. Crop. Sci. 2003, 189, 113–122. [Google Scholar] [CrossRef]
  85. Gourdji, S.M.; Mathews, K.L.; Reynolds, M.; Crossa, J.; Lobell, D.B. An assessment of wheat yield sensitivity and breeding gains in hot environments. Proc. R. Soc. B Biol. Sci. 2013, 280, 20122190. [Google Scholar] [CrossRef]
  86. Saeidi, M.; Abdoli, M. Effect of drought stress during grain filling on yield and its components, gas exchange variables, and some physiological traits of wheat cultivars. J. Agric. Sci. Technol. 2015, 17, 885–898. [Google Scholar]
  87. Hay, R.K.M.; Kirby, E.J.M. Convergence and synchrony-a review of the coordination of development in wheat. Aust. J. Agric. Res. 1991, 42, 661. [Google Scholar] [CrossRef]
  88. Fischer, R.A.; Kohn, G.D. The relationship of grain yield to vegetative growth and post-flowering leaf area in the wheat crop under conditions of limited soil moisture. Aust. J. Agric. Res. 1966, 17, 281. [Google Scholar] [CrossRef]
  89. Miralles, D.J.; Abeledo, L.G.; Alvarez Prado, S.; Chenu, K.; Serrago, R.A.; Savin, R. Chapter 4—Barley. In Crop Physiology Case Histories for Major Crops; Sadras, V.O., Calderini, D.F., Eds.; Academic Press: Cambridge, MA, USA, 2021; pp. 164–195. [Google Scholar]
  90. Porporato, A.; Laio, F.; Ridolfi, L.; Rodriguez-Iturbe, I. Plants in water-controlled ecosystems: Active role in hydrologic processes and response to water stress: III. Vegetation water stress. Adv. Water. Resour. 2001, 24, 725–744. [Google Scholar] [CrossRef]
  91. Baier, W.; Robertson, G.W. The performance of soil moisture estimates as compared with the direct use of climatological data for estimating crop yields. Agric. Meteorol. 1968, 5, 17–31. [Google Scholar] [CrossRef]
Figure 1. (a) Location of the study areas in the Castilla y León (CYL) and Castilla-La Mancha (CLM) regions (© ESRI satellite online maps, World Imagery, 2022). (b) Mask of rainfed agriculture (highlighted yellow areas) in CYL (red) and CLM (pink) based on reports of the Spanish Ministry of Agriculture and the Digital Global Map of Irrigation Areas from FAO (© ESRI satellite online maps, World Imagery, 2022). Initials indicate the province of the areas selected by the mask of rainfed agricultural districts. (c) Altitudinal map of the National Geographical Institute of Spain (IGN-CNIG over © ESRI physical online maps, World Imagery, 2022). (d) Köppen–Geiger climatic classification Ref. [43] over the study areas. Latitude and longitude in the WGS84 coordinate reference system (from data of Beck et al. (2018)).
Agriculture 12 00533 g001
Figure 2. Weekly calendar of the growing season indicating the estimated starting dates (red for wheat, blue for barley) of the major phenological stages in the CYL and CLM regions. The average sowing and harvest dates of each region are based on the sowing, harvesting, and marketing calendar of MAPA Ref. [55]. The dates of intermediate phenological stages are estimated on the crop guide of FAO. Sowing and harvesting dates are displayed as graduated grays, depending on the % of completion of these activities conducted in the month.
Agriculture 12 00533 g002
Figure 3. Workflow of the study depicts the tasks conducted to select data, process the temporal correlations, and identify the impact of each variable on the evolution of wheat and barley during the growing season.
Agriculture 12 00533 g003
Figure 4. Daily correlations (line plots indicating the Pearson coefficient values) and periods of significance (colored line segments) of soil moisture data from ERA5-Land (a1a4) and LISFLOOD (b1b4) with the annual yield of barley (a1,a3,b1,b3) and wheat (a2,a4,b2,b4) during the growing season in the provinces of CYL (a1,a2,b1,b2) and CLM (a3,a4,b3,b4). The differentiated evolution of the lines along the year secondarily illustrates the spread of correlations among provinces. Shape symbols overlapping the lines label the line of each province. Months are indicated on the primary x-axis and Zadok’s stages over the vertical lines from the secondary x-axis.
Agriculture 12 00533 g004
Figure 5. Daily correlations (line plots indicating the R coefficient values) and periods of significance (colored line segments) of the most relevant climatic variables with the annual yield of barley during the growing season in each province of CYL (see symbols). Vertical lines indicate phenological stages (Zi) of the Zadoks scale for barley in CYL. Periods of significant correlation of ERA5-Land soil moisture with annual barley yield (Figure 4(a1)) are shown in green and nonsignificant periods are in light gray for reference. Months are indicated on the primary x-axis and Zadok’s stages over the vertical lines from the secondary x-axis.
Agriculture 12 00533 g005
Figure 6. Daily correlations (line plots indicating the R coefficient values) and periods of significance (colored line segments) of the most relevant climatic variables with the annual yield of barley during the growing season in each province of CLM (see symbols). Vertical lines indicate phenological stages (Zi) of the Zadoks scale for barley in CLM. Periods of significant correlation of ERA5-Land soil moisture with annual barley yield (Figure 4(a3)) are shown in green and nonsignificant periods are in light gray for reference. Months are indicated on the primary x-axis and Zadok’s stages over the vertical lines from the secondary x-axis.
Agriculture 12 00533 g006
Figure 7. Synchrony of the influence of soil moisture (ERA5-Land) and climatic variables during the crop cycle. Y-axes indicate the percentage of rainfed cropland in CYL (a) and CLM (b) daily, affected by significant (absolute value) correlations of soil moisture and climatic variables on wheat (left column) and barley (right column). Months are indicated on the primary x-axis and Zadok’s stages over the vertical lines from the secondary x-axis.
Agriculture 12 00533 g007
Publisher’s Note: MDPI stays neutral with regard to jurisdictional claims in published maps and institutional affiliations.

