

Design and Implementation of a Malfunction Detection System for Livestock Ventilation Devices in Smart Poultry Farms


Abstract
1. Introduction
2. Review of Literature
3. Designing a Smart System for Detecting Malfunctions in Ventilation in Poultry Farms
3.1. Ventilation Devices in a Smart Poultry Farm
3.2. Structural Design of the System
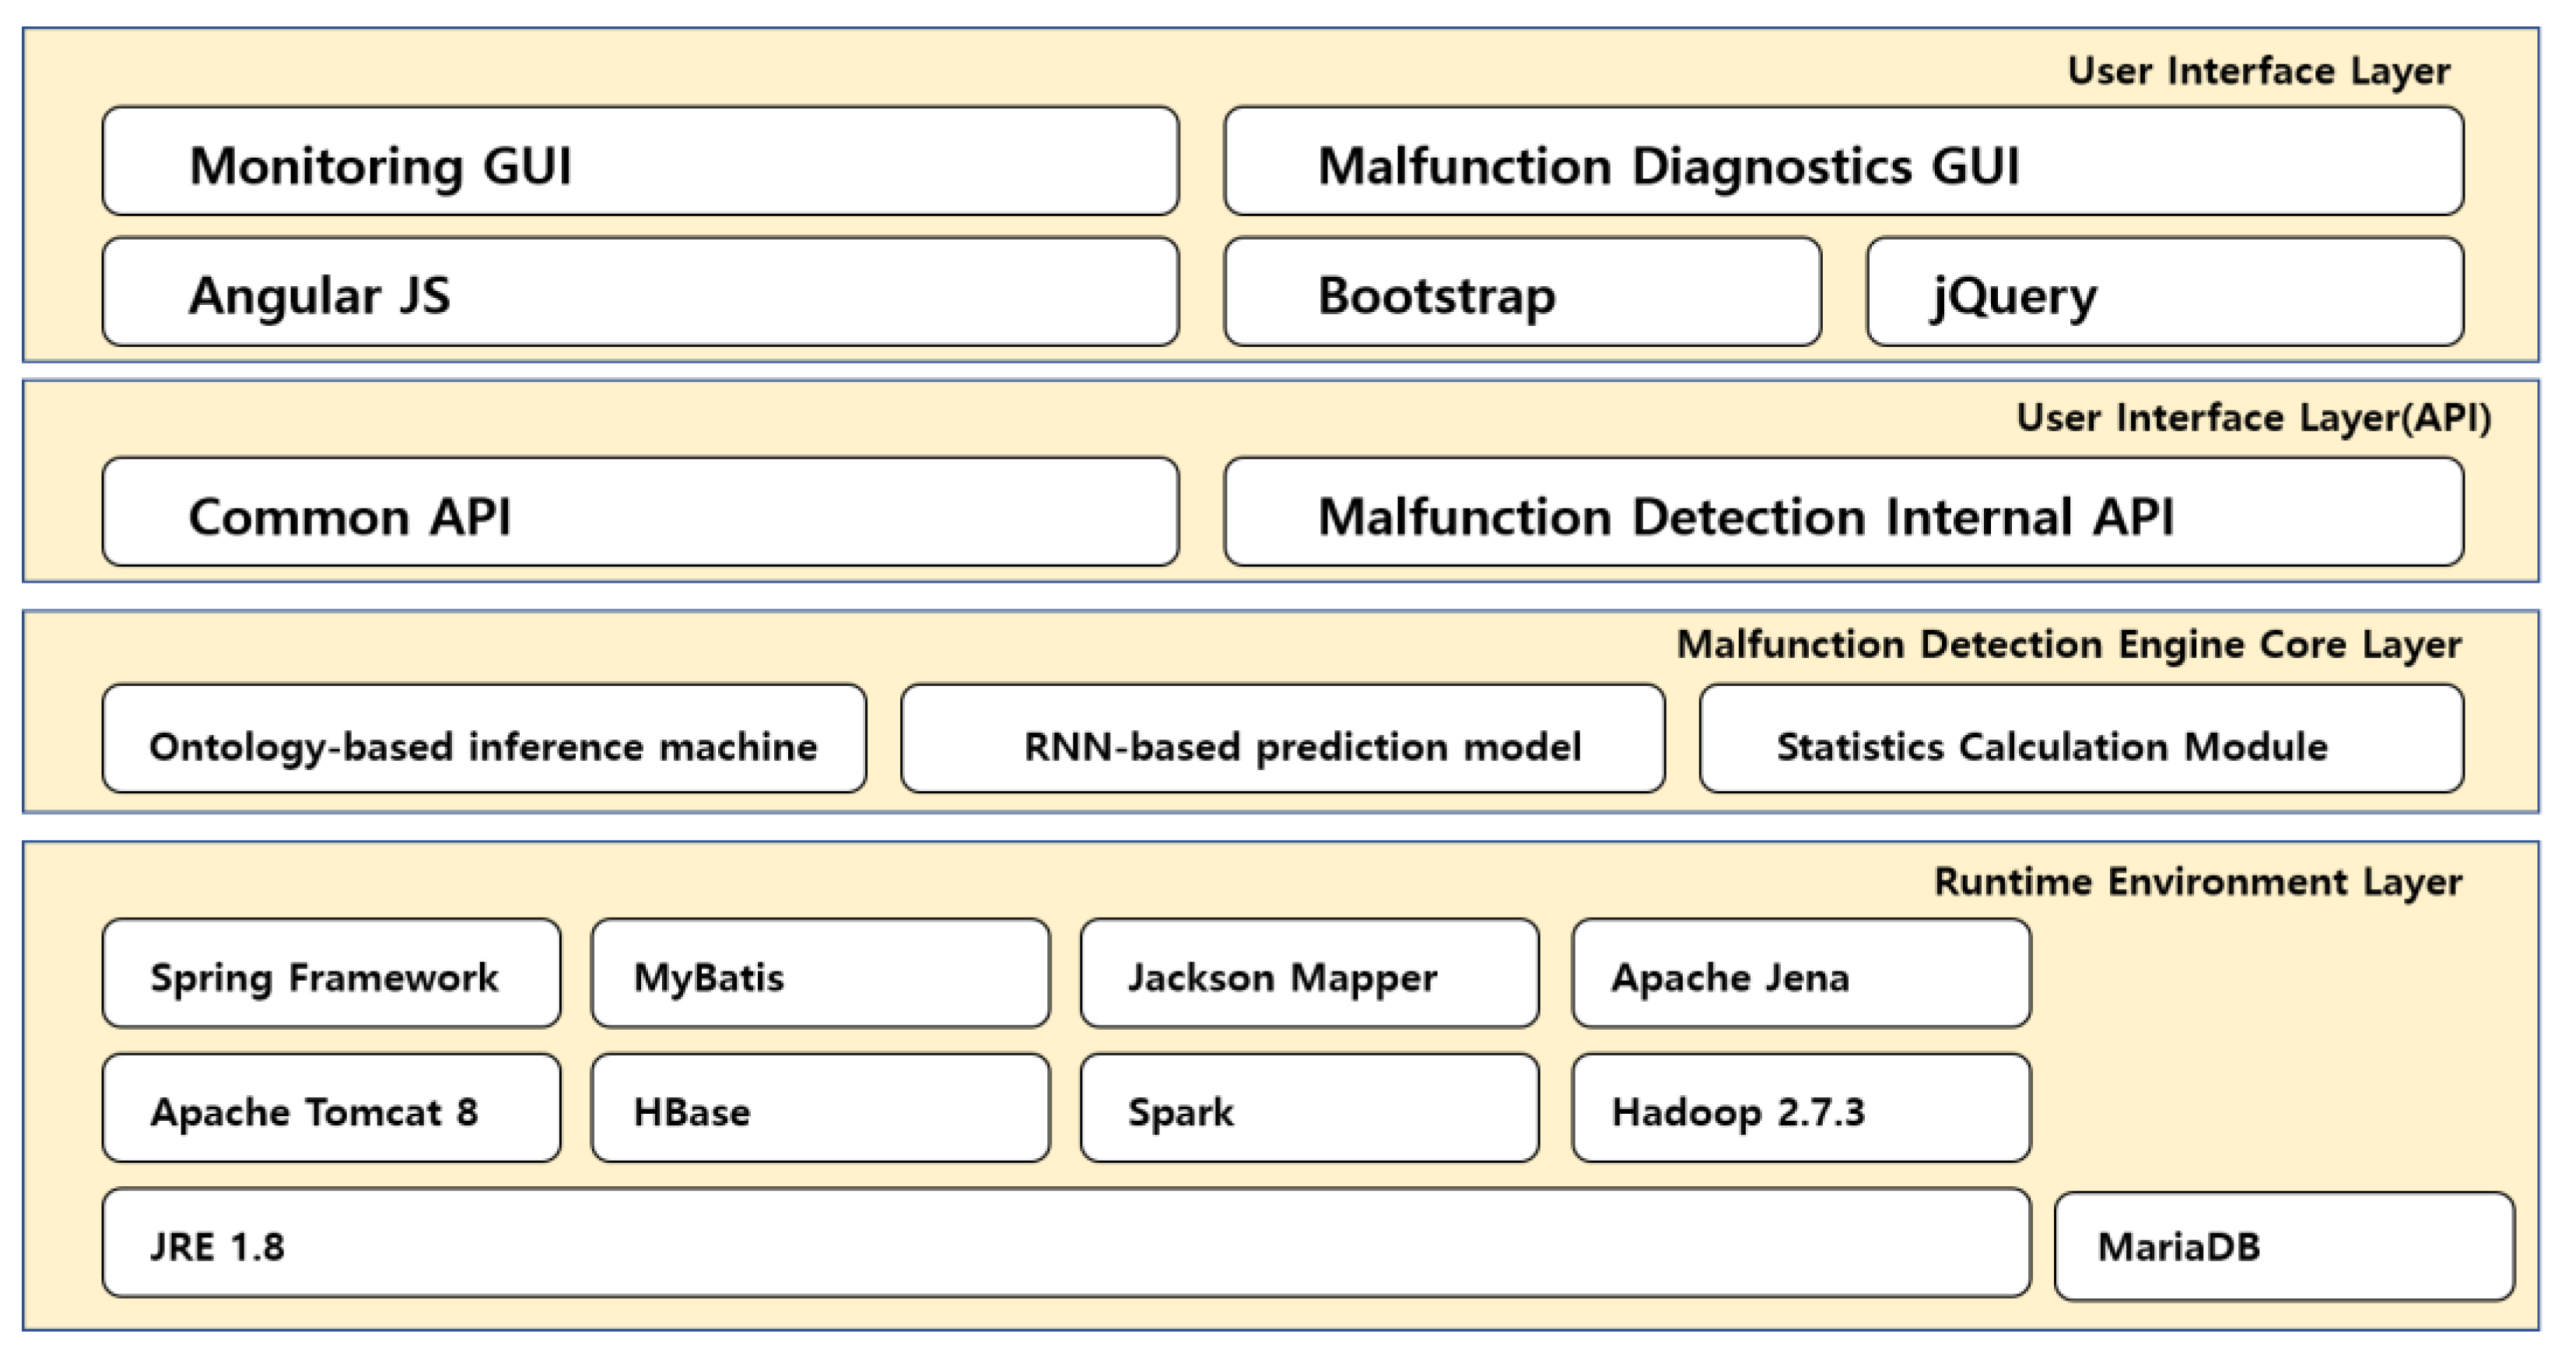
3.2.1. Software Architecture
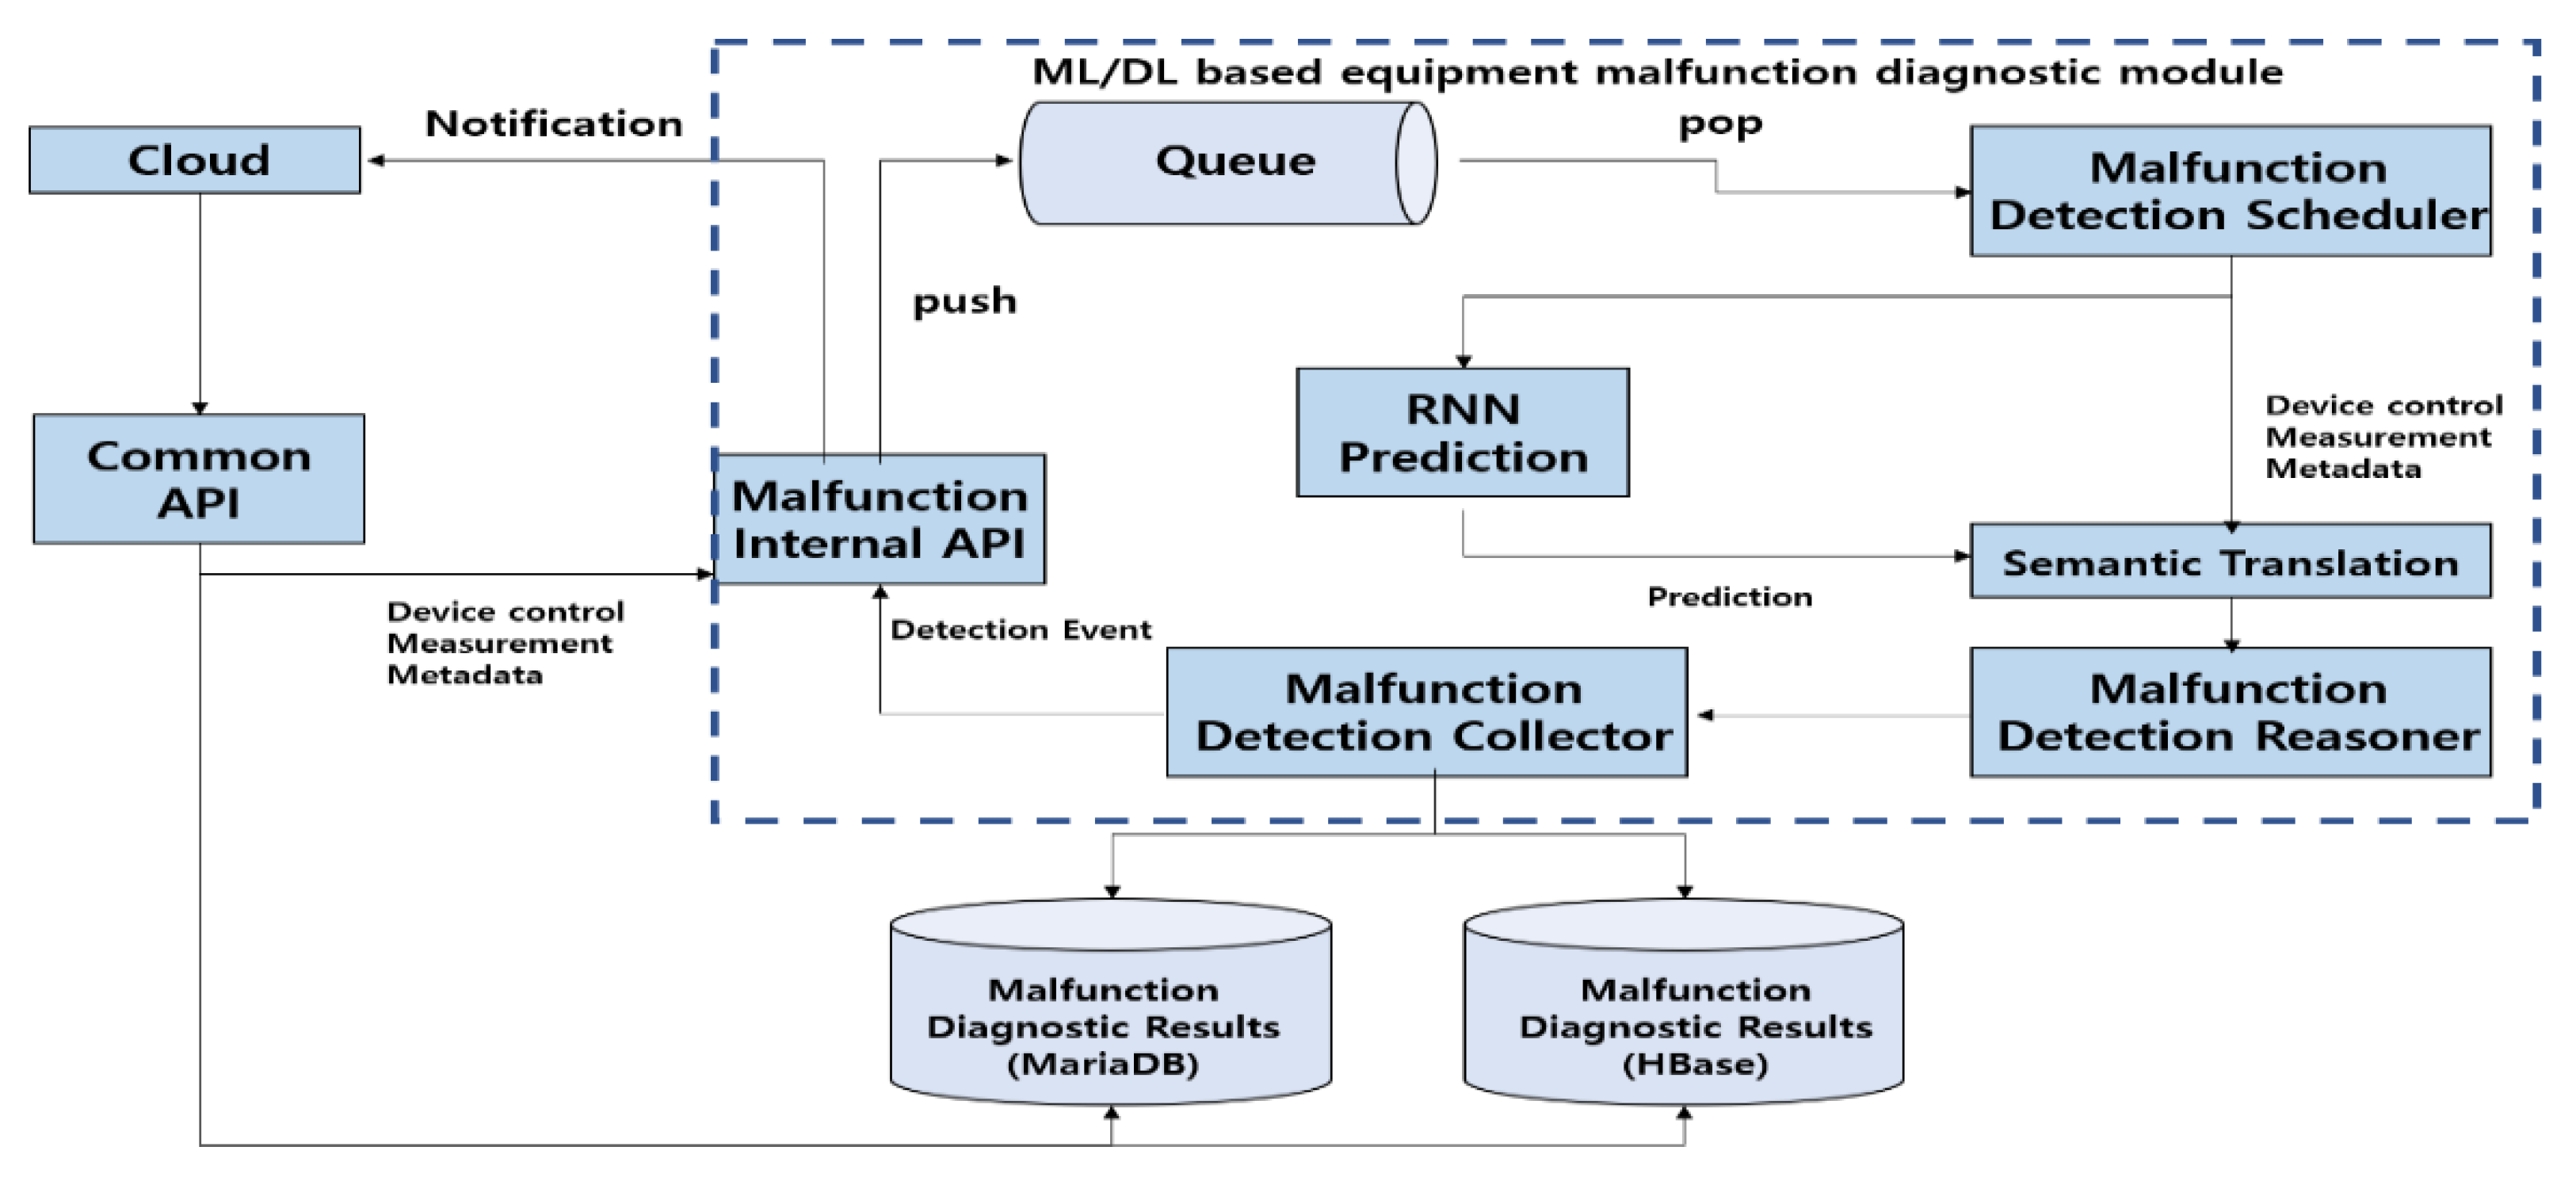
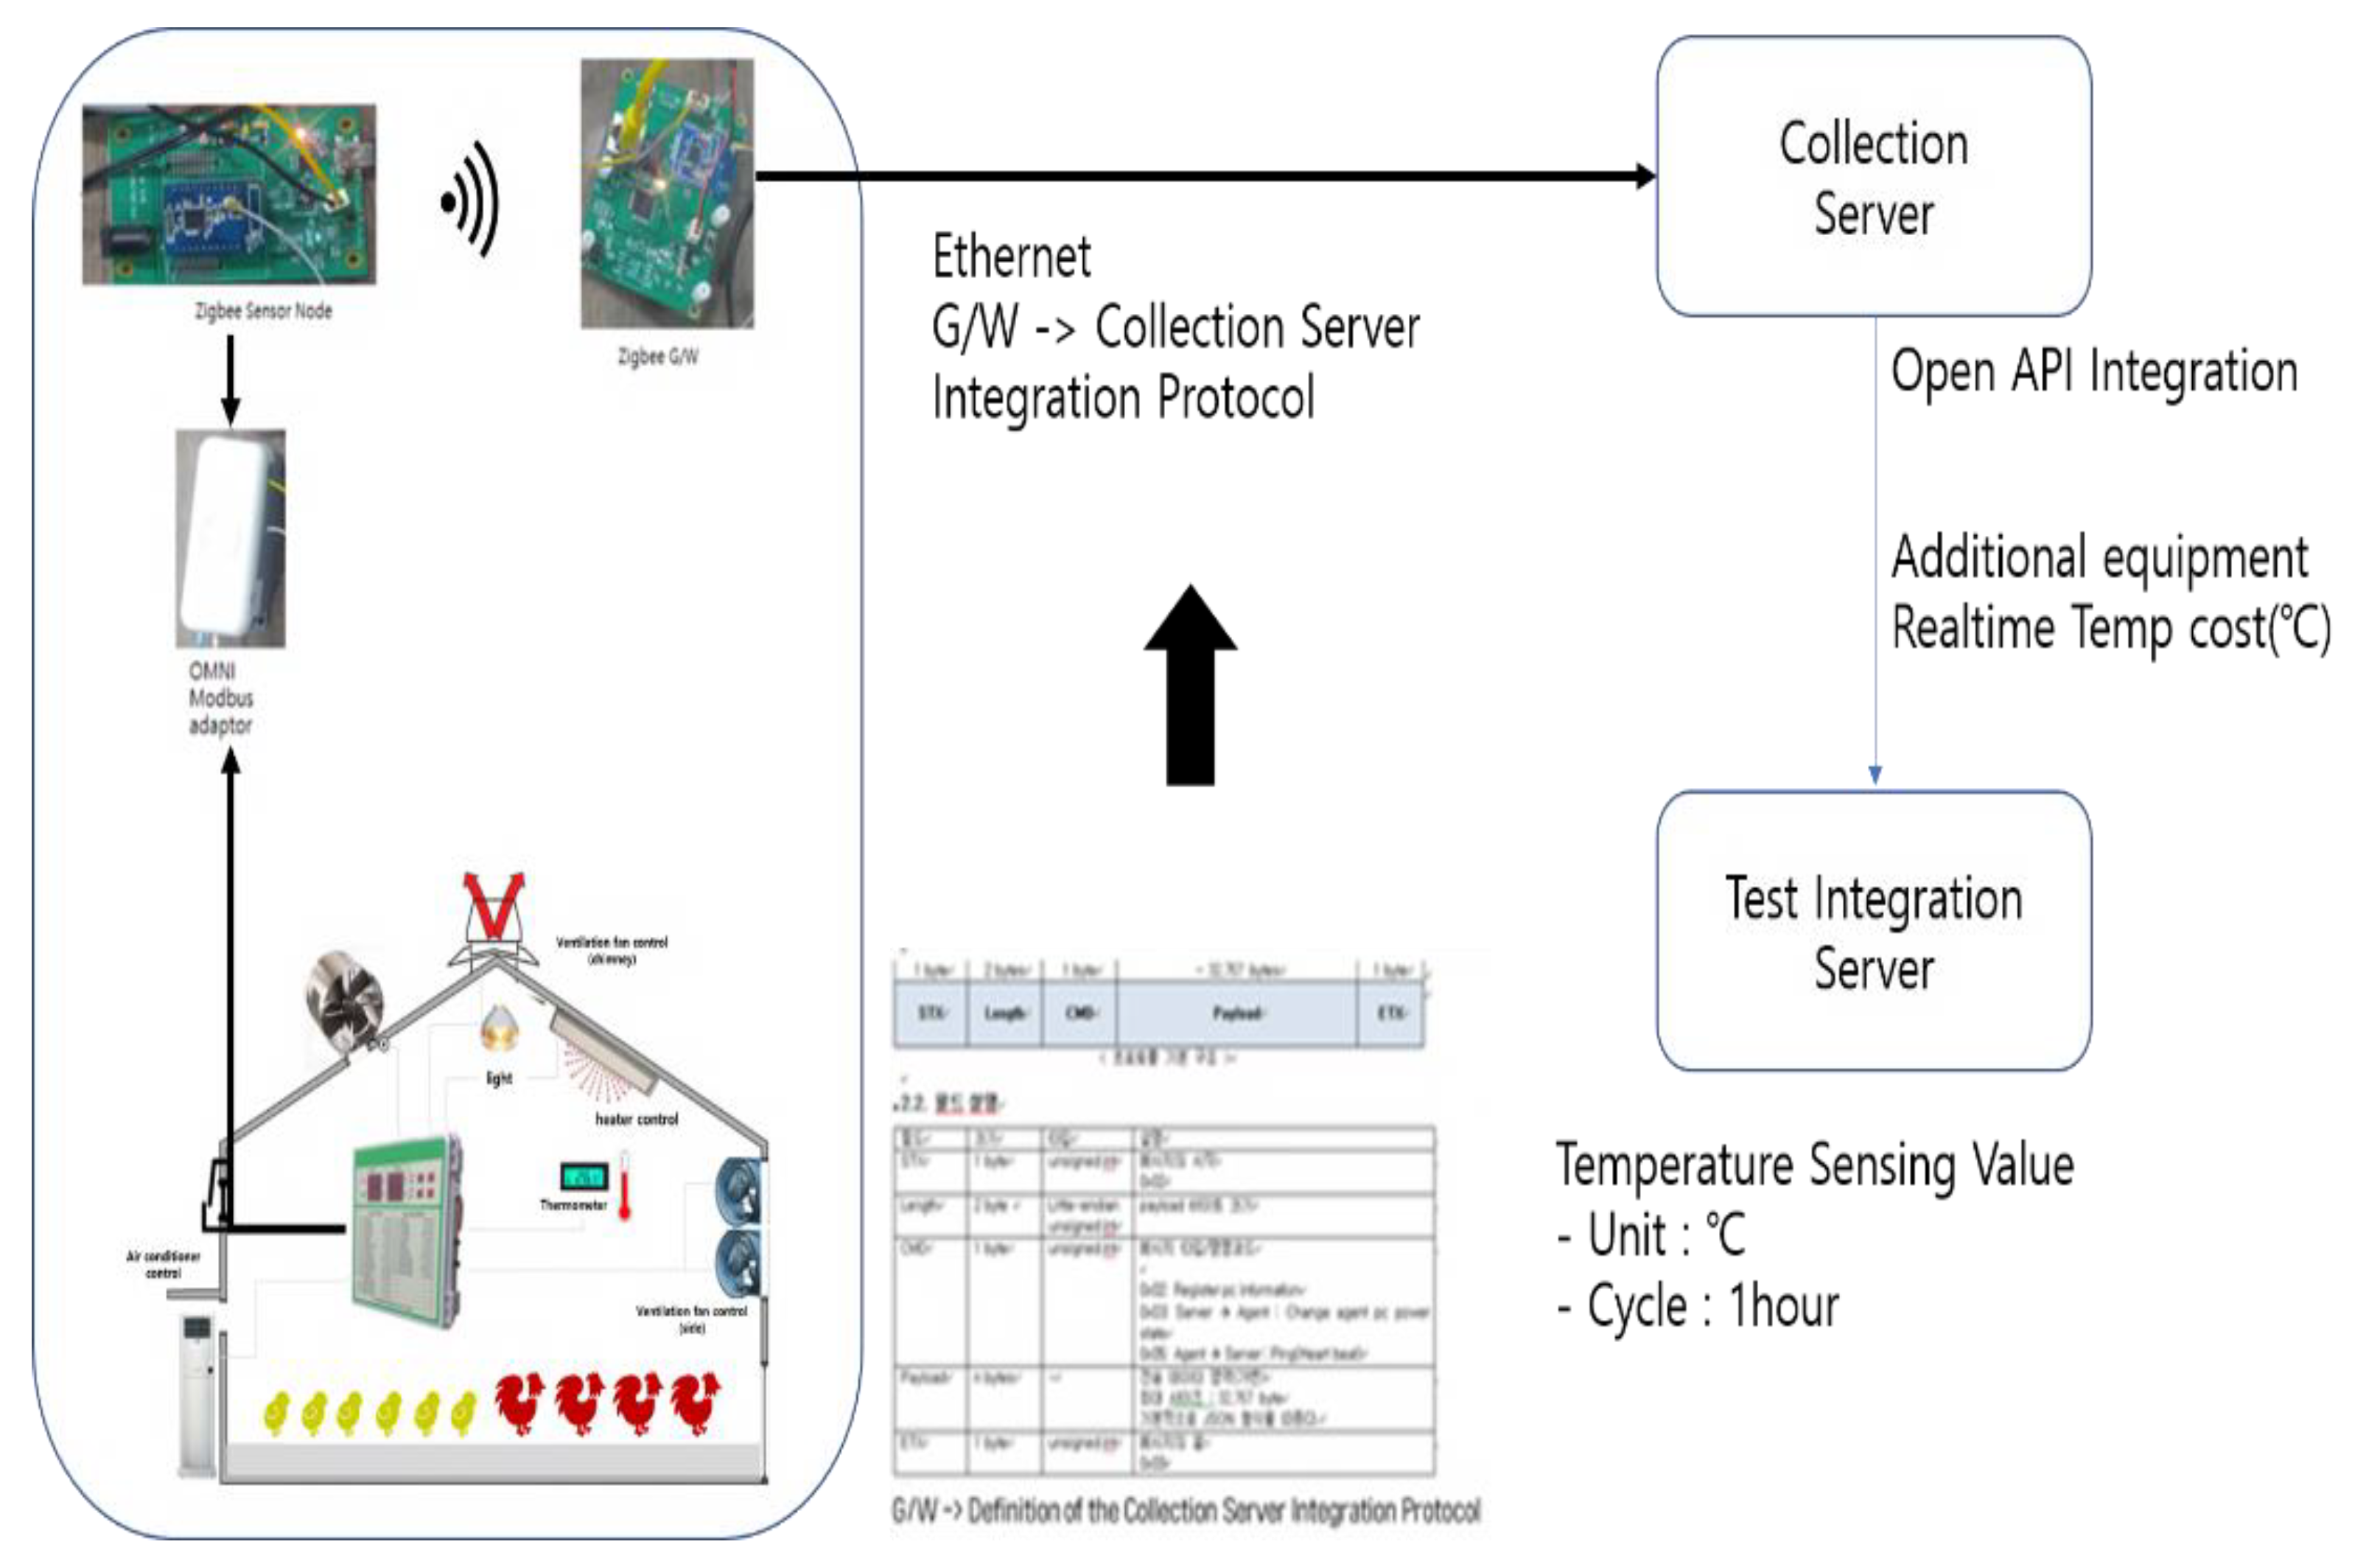
3.2.2. Integration Architecture for Internal Systems
3.3. Detailed Design of the System
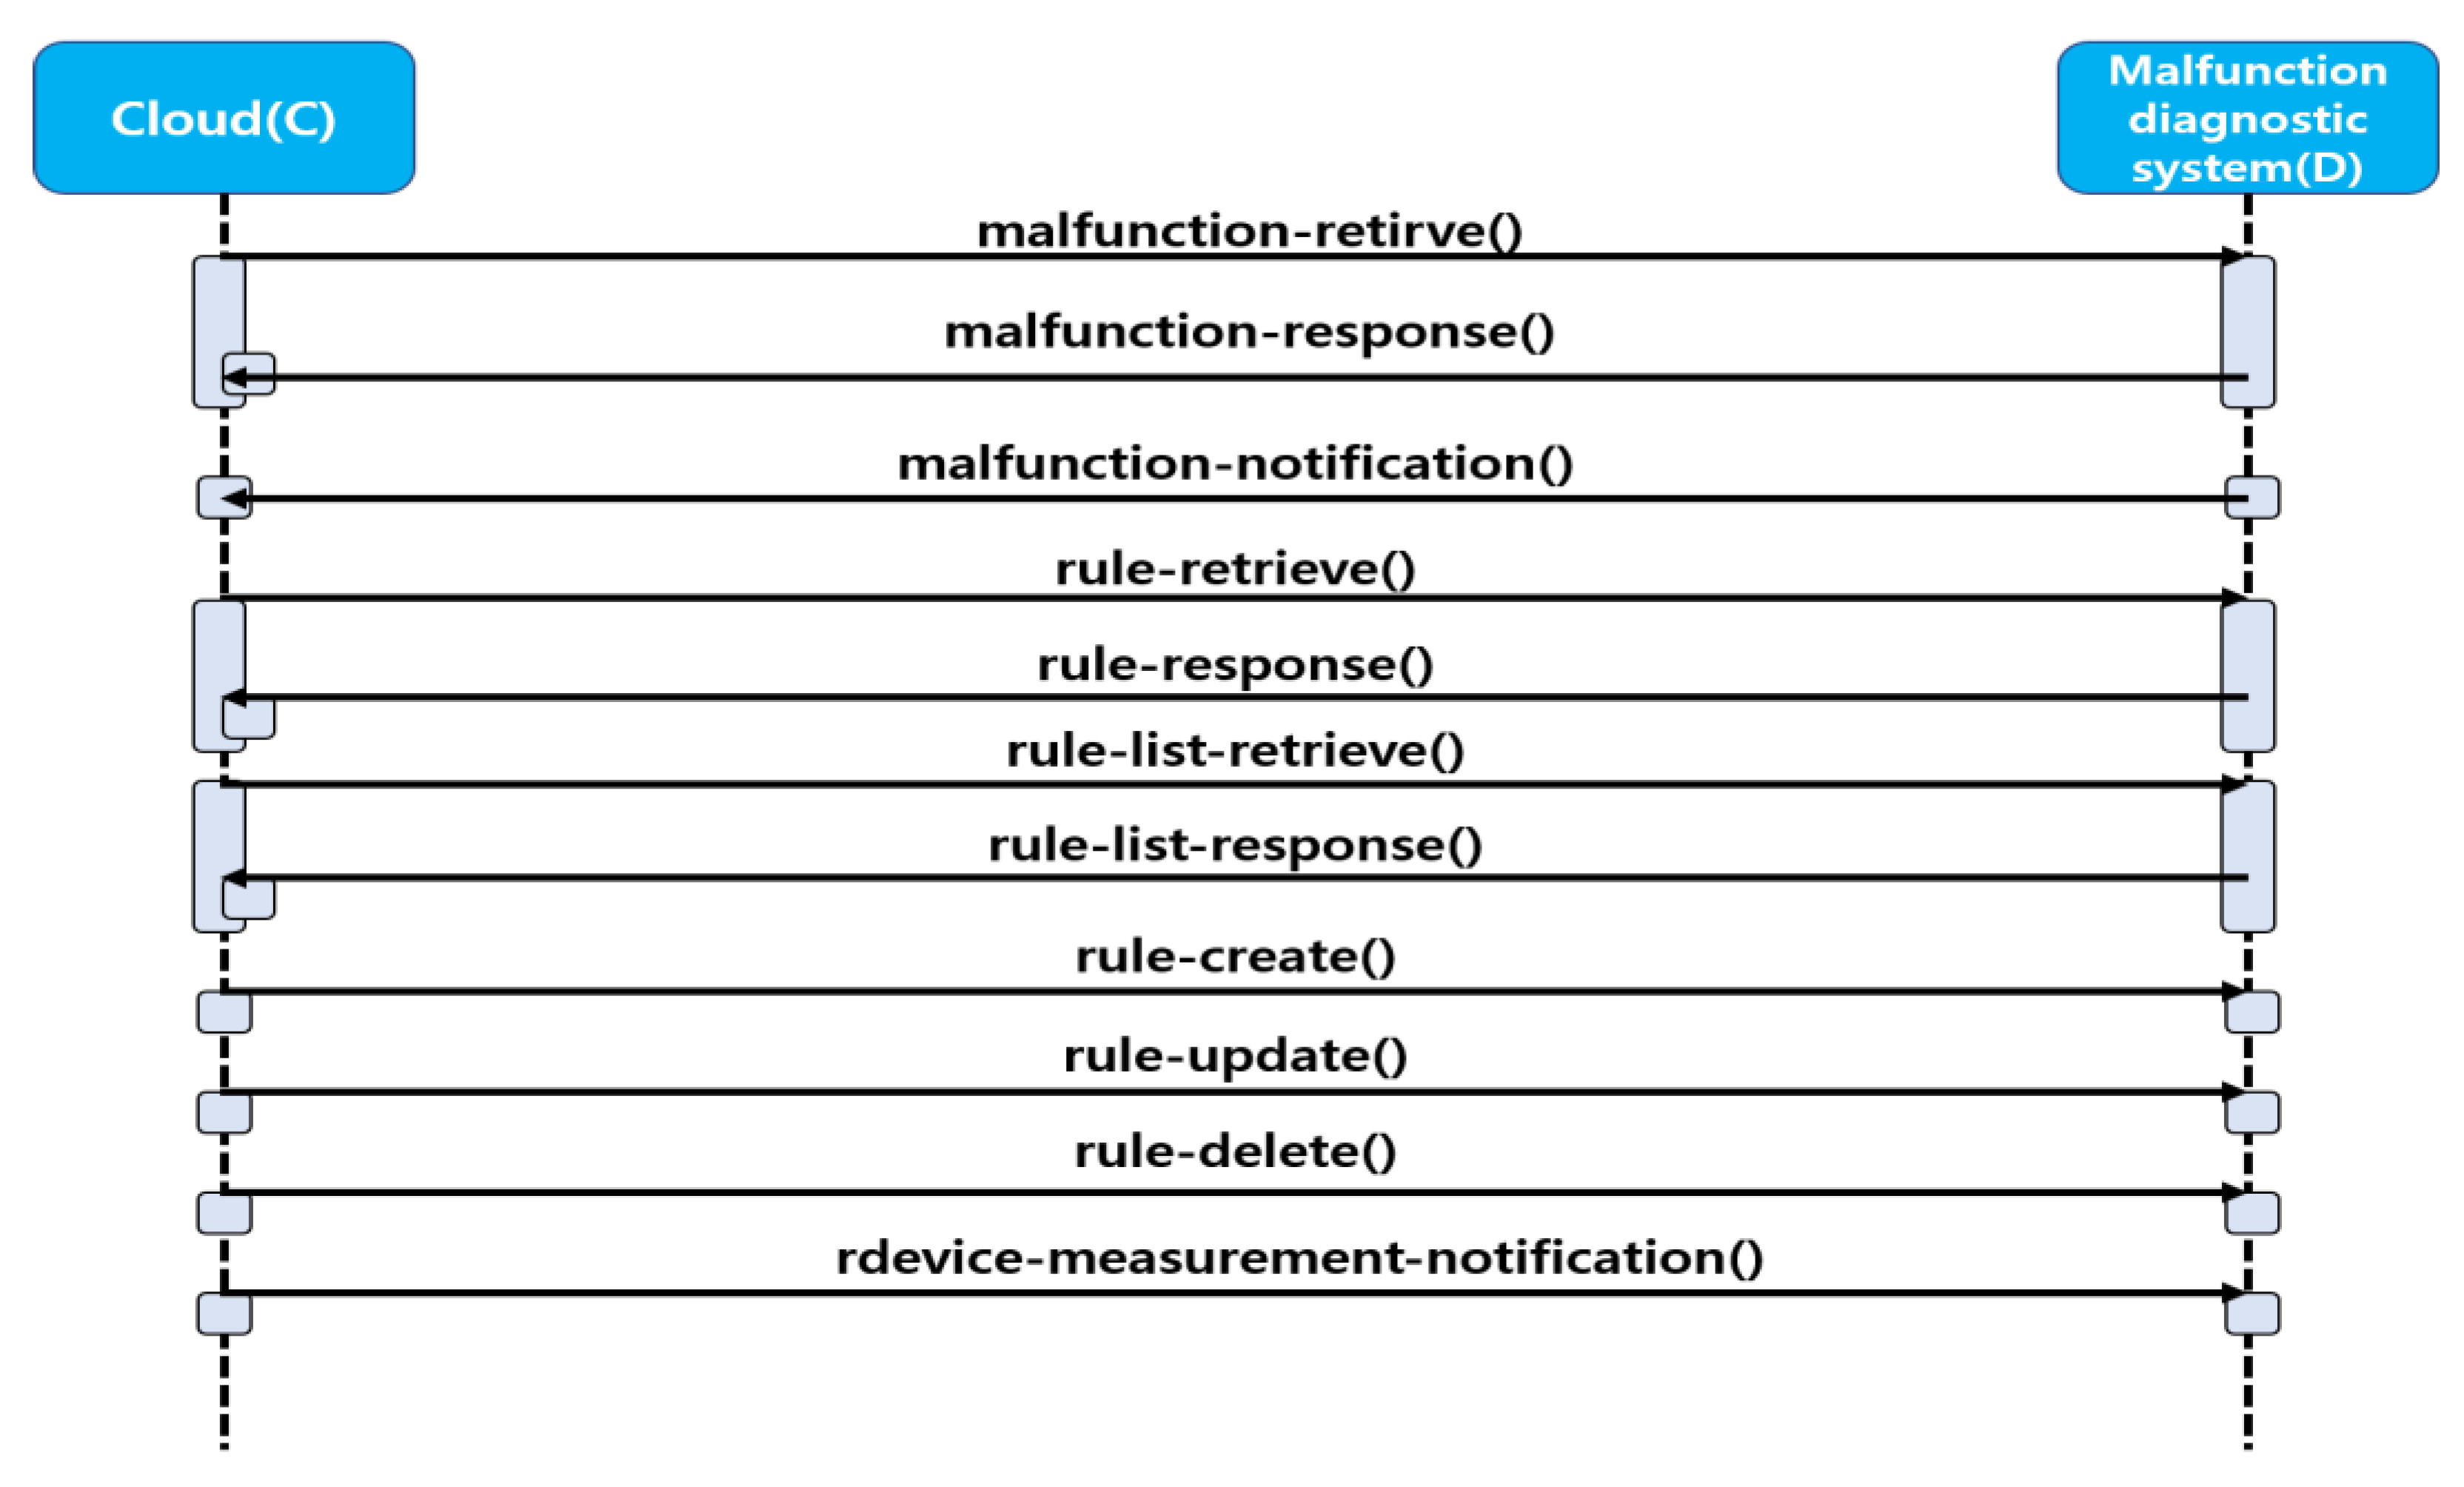
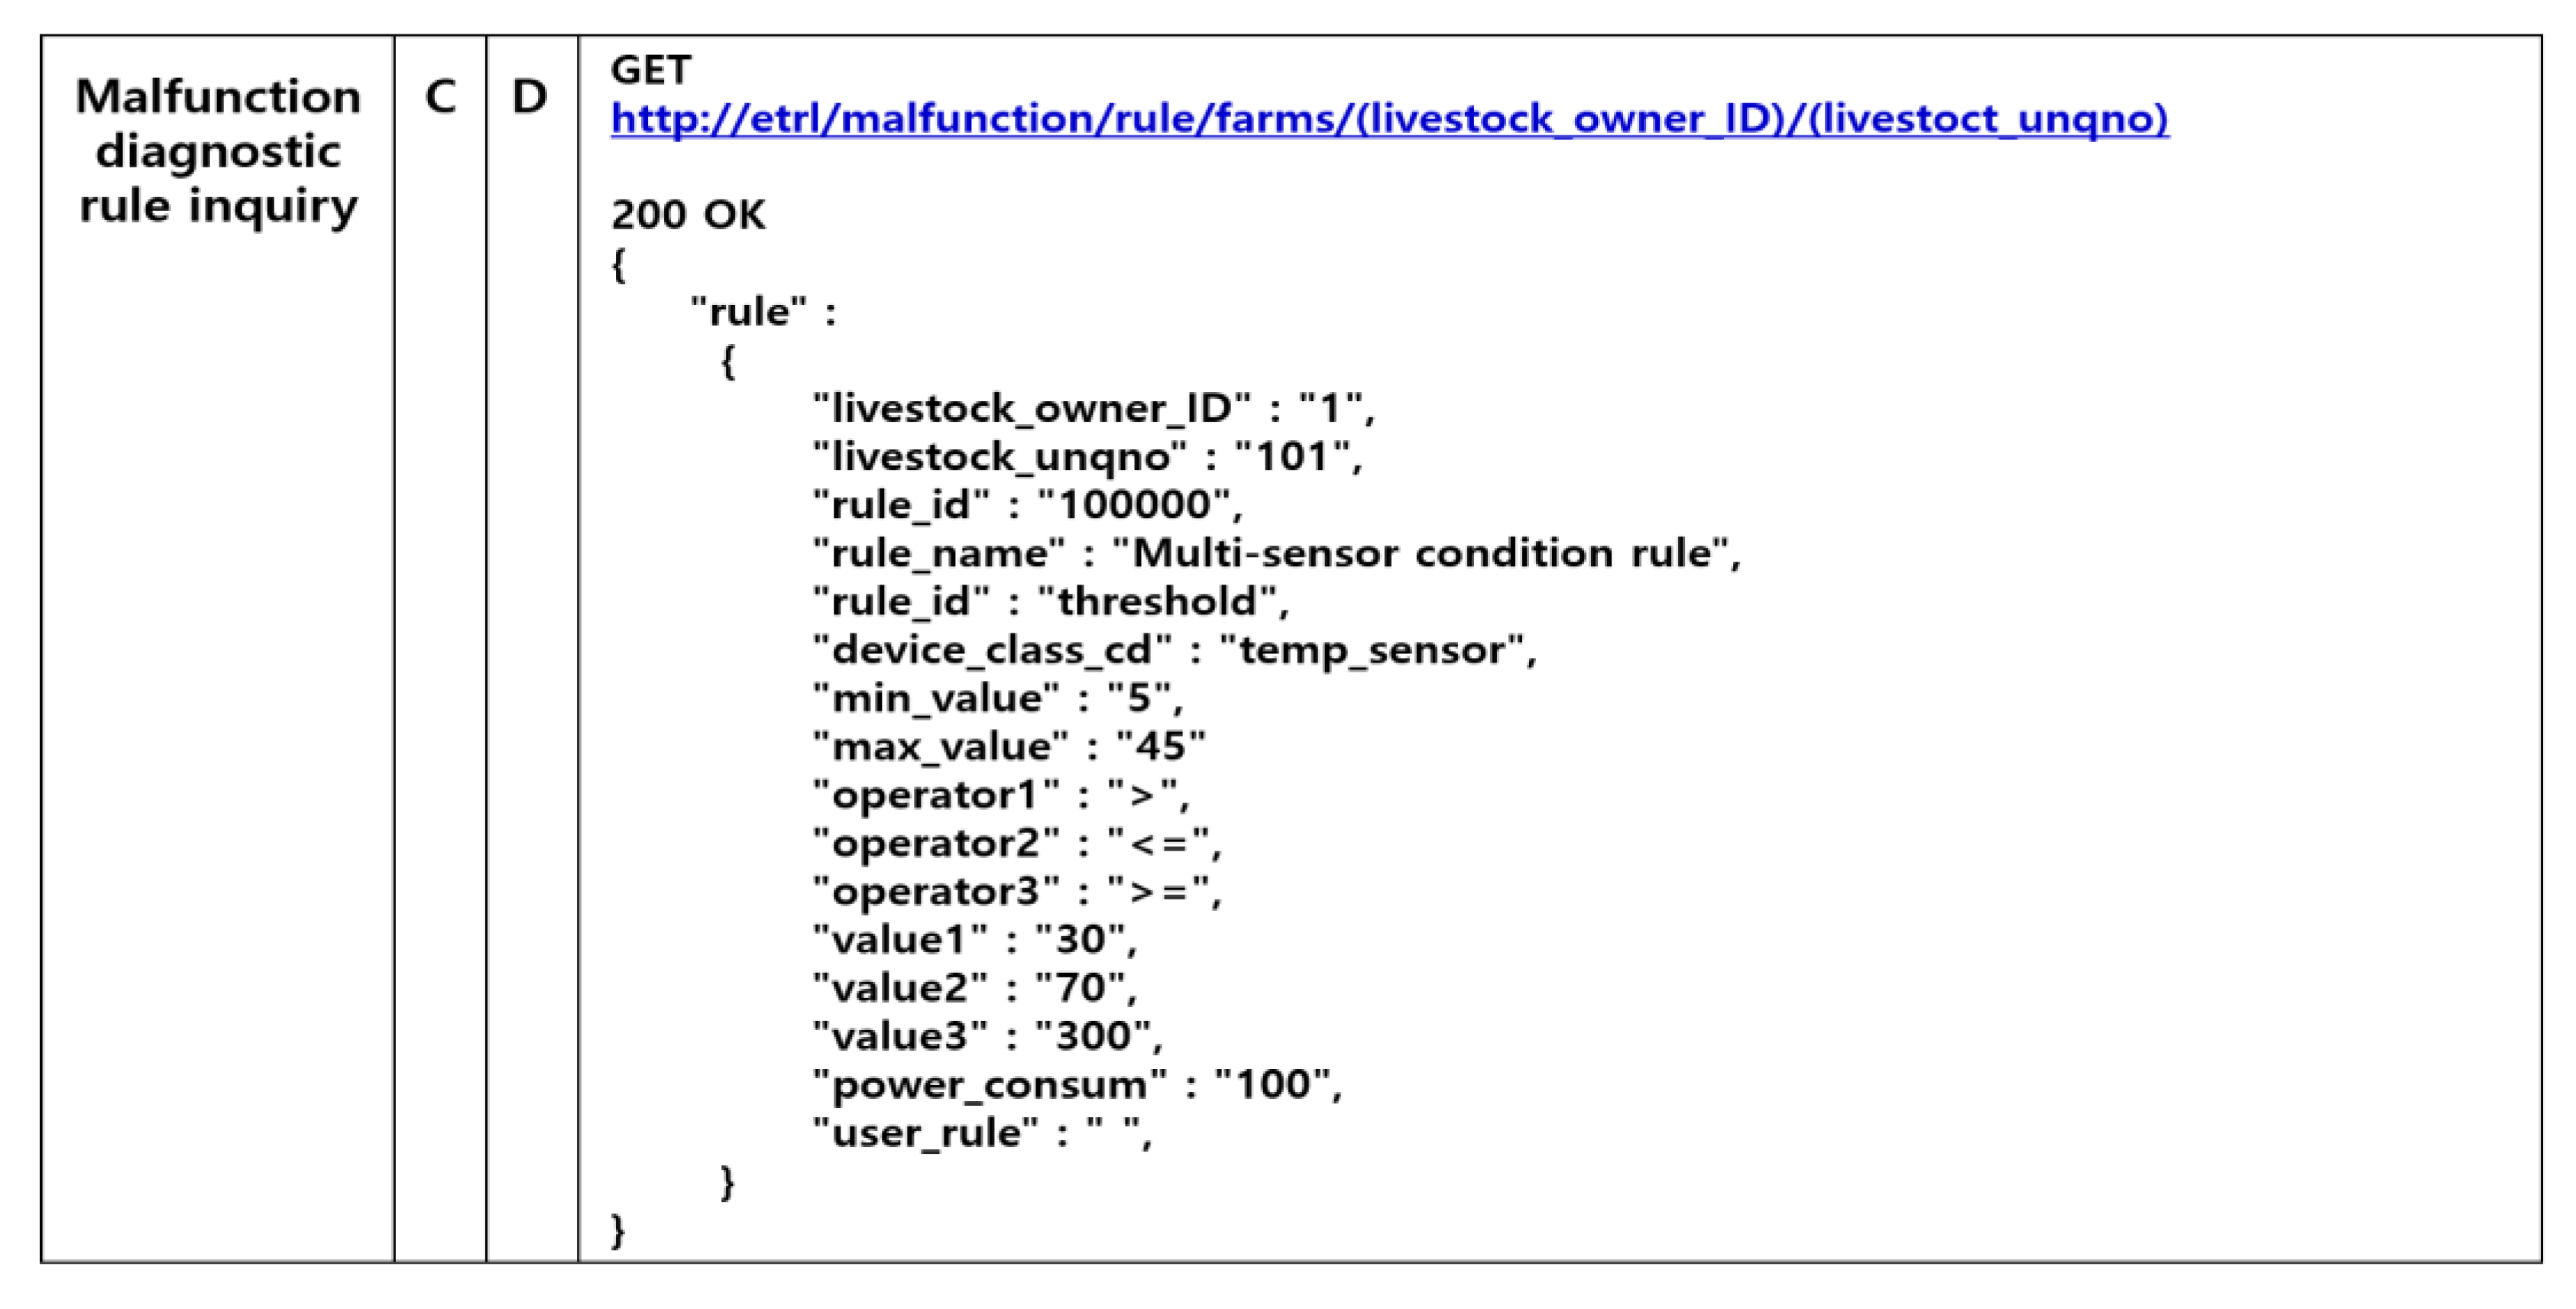
3.3.1. Interface Design
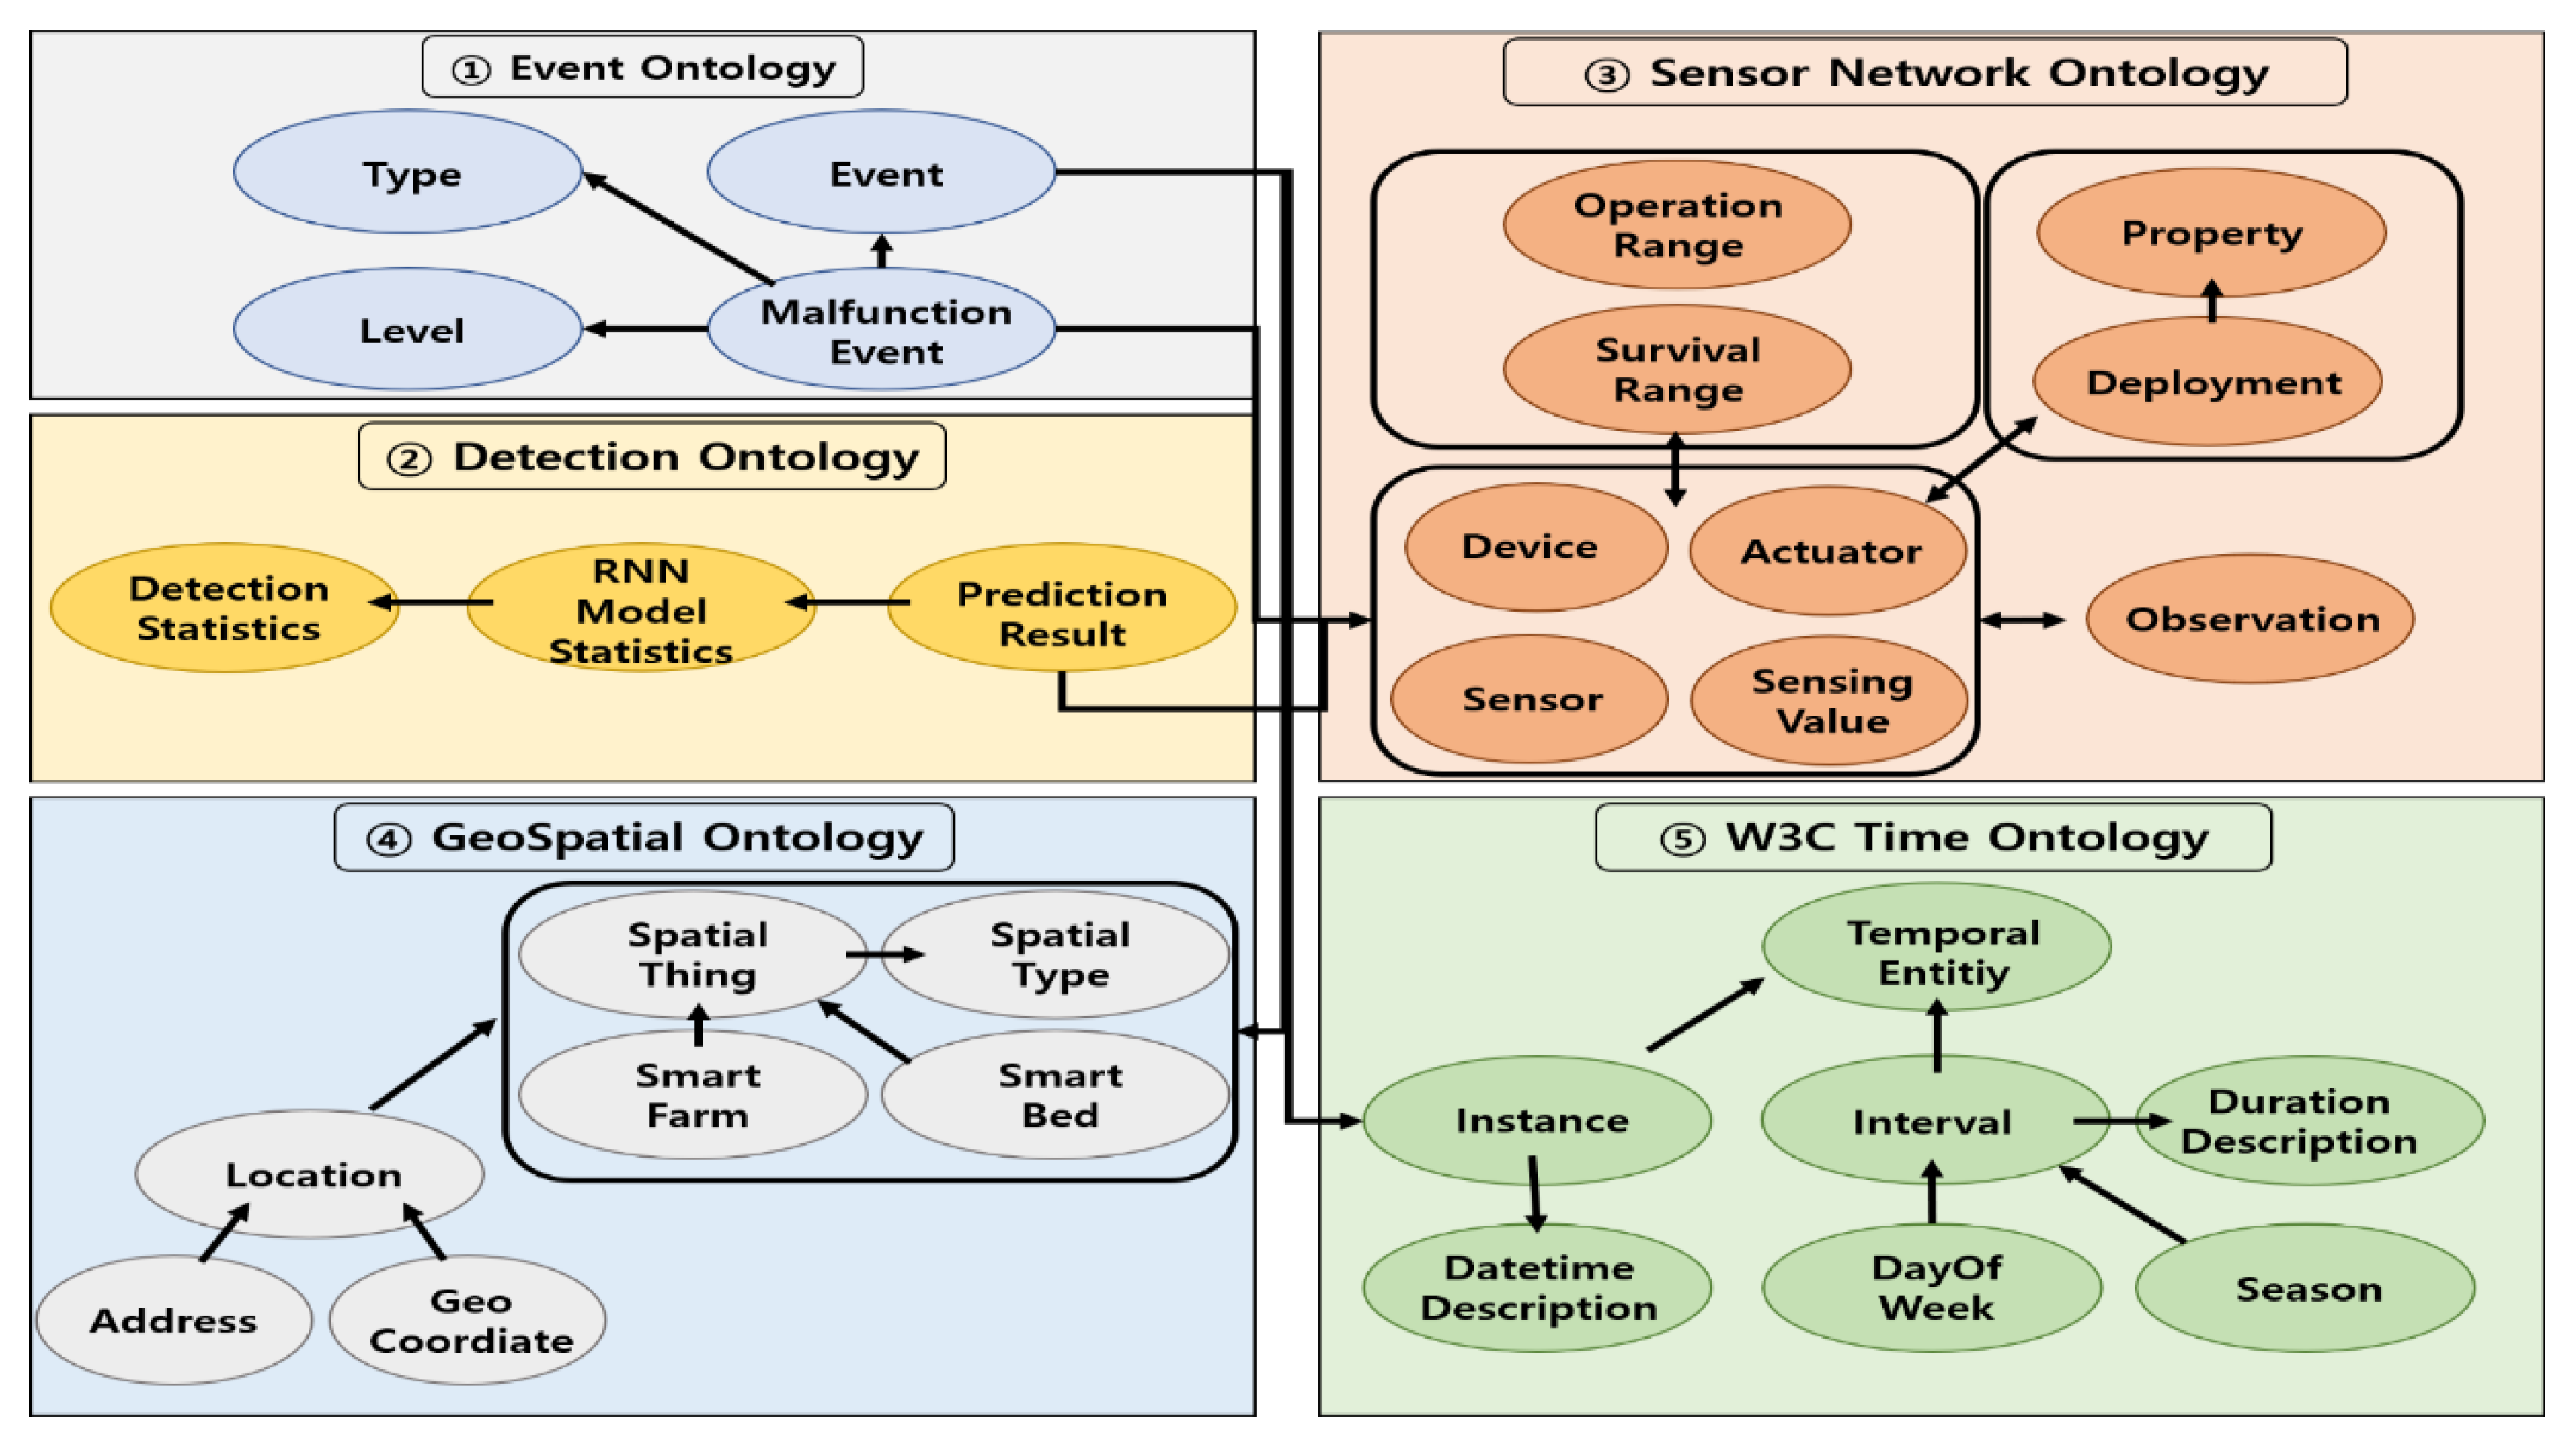
3.3.2. Ontology Design
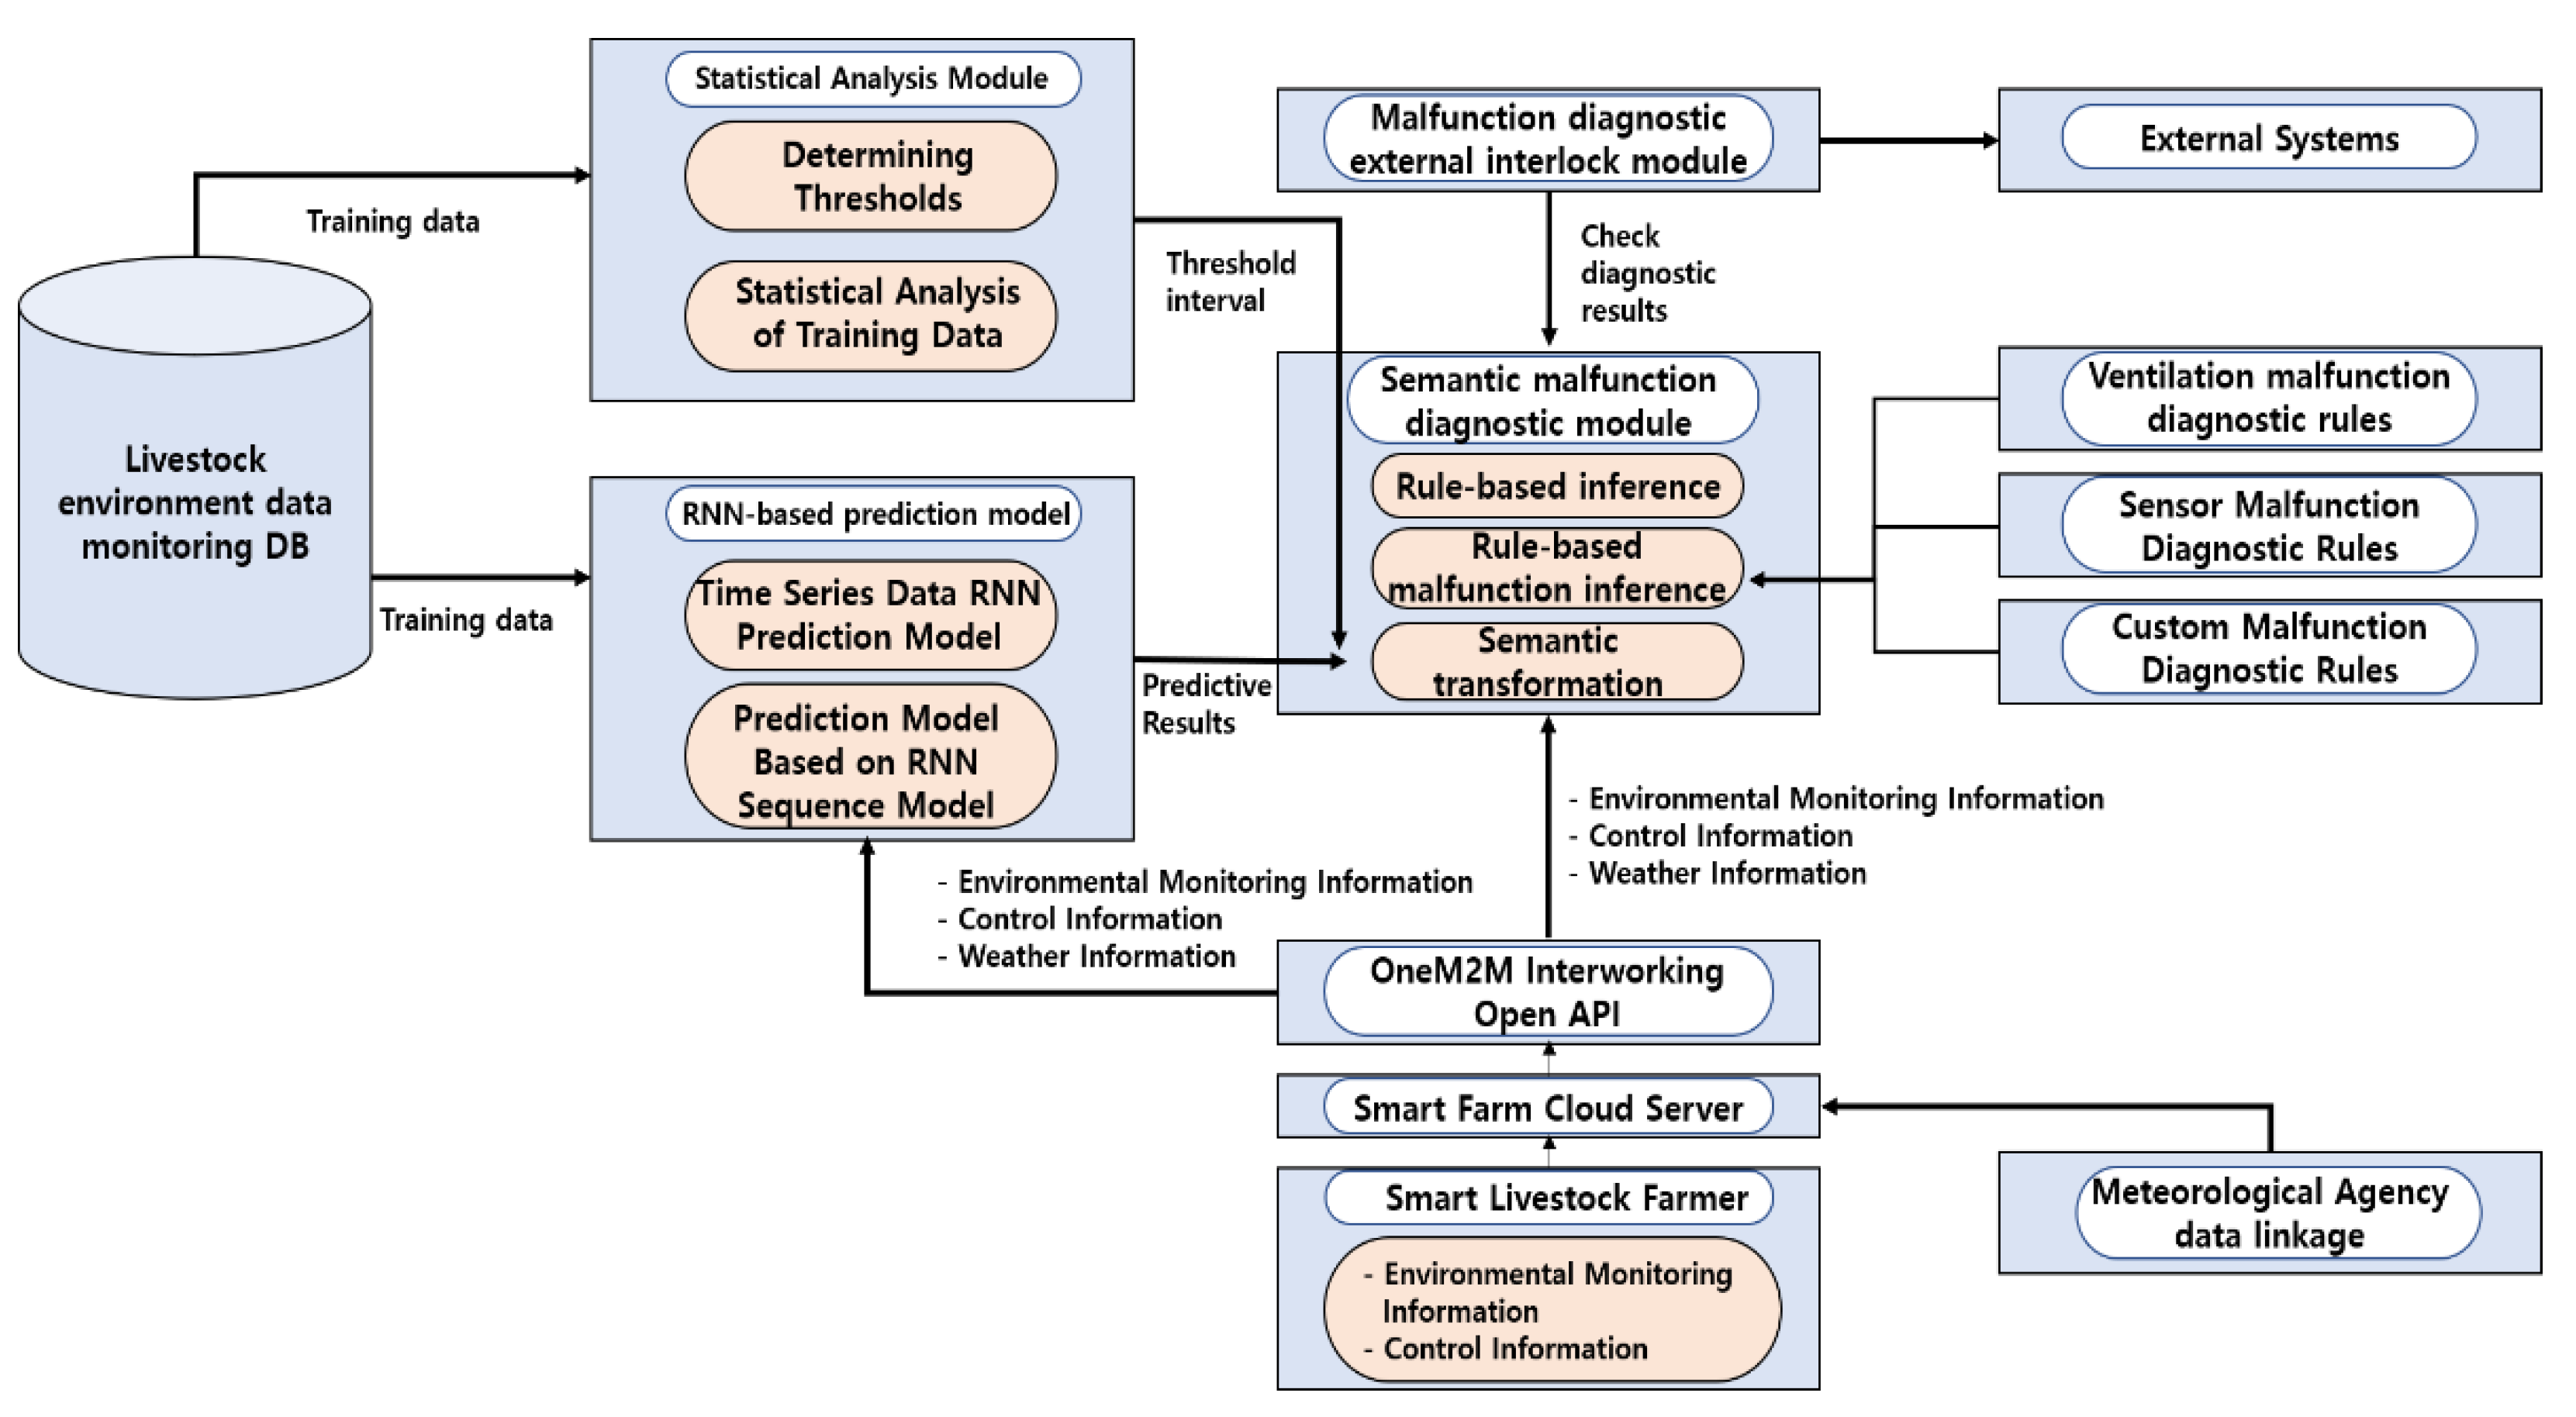
- The event ontology defines major events indicating the outcomes of malfunction detection. Information related to device configuration and actual measurement values are interpreted through rule-based inferences, based on rules provided by the user. Following semantic translation, the results are saved in the form of RDF Triples [33].
- The detection ontology indicates the malfunction threshold for each device. The time series of sensor data are used to train an RNN model, and the results are used to predict sensor values. Various concepts are defined to indicate the predicted values, which are needed to identify device malfunctions. When certain thresholds are exceeded, a device malfunction is indicated based on the discrepancy between predicted values and actual sensor measurements.
- The sensor network ontology consists of concepts that represent various devices installed throughout the smart barn and their measurements. The measurements obtained from these devices (such as sensors and actuators) are utilized as basic patterns with reference to the semantic sensor network ontology.
- The GeoSpatial ontology utilizes the concept of space and structural relationships to define the space (such as an animal barn) where the devices (such as sensors and actuators) are installed.
- The OWL-2 DL ontology defines temporal concepts and is used to describe the temporal characteristics of resources [34]. It also provides the lexicon for describing information related to duration, the relationships between the temporal locations—including date and time—of each moment, the intervals between moments, and their temporal order.
3.3.3. Database Design
4. Implementation and Outcomes of a Malfunction Prediction System for Smart Livestock Farming
4.1. Implementation of an RNN-Based Prediction Model for Malfunction Detection
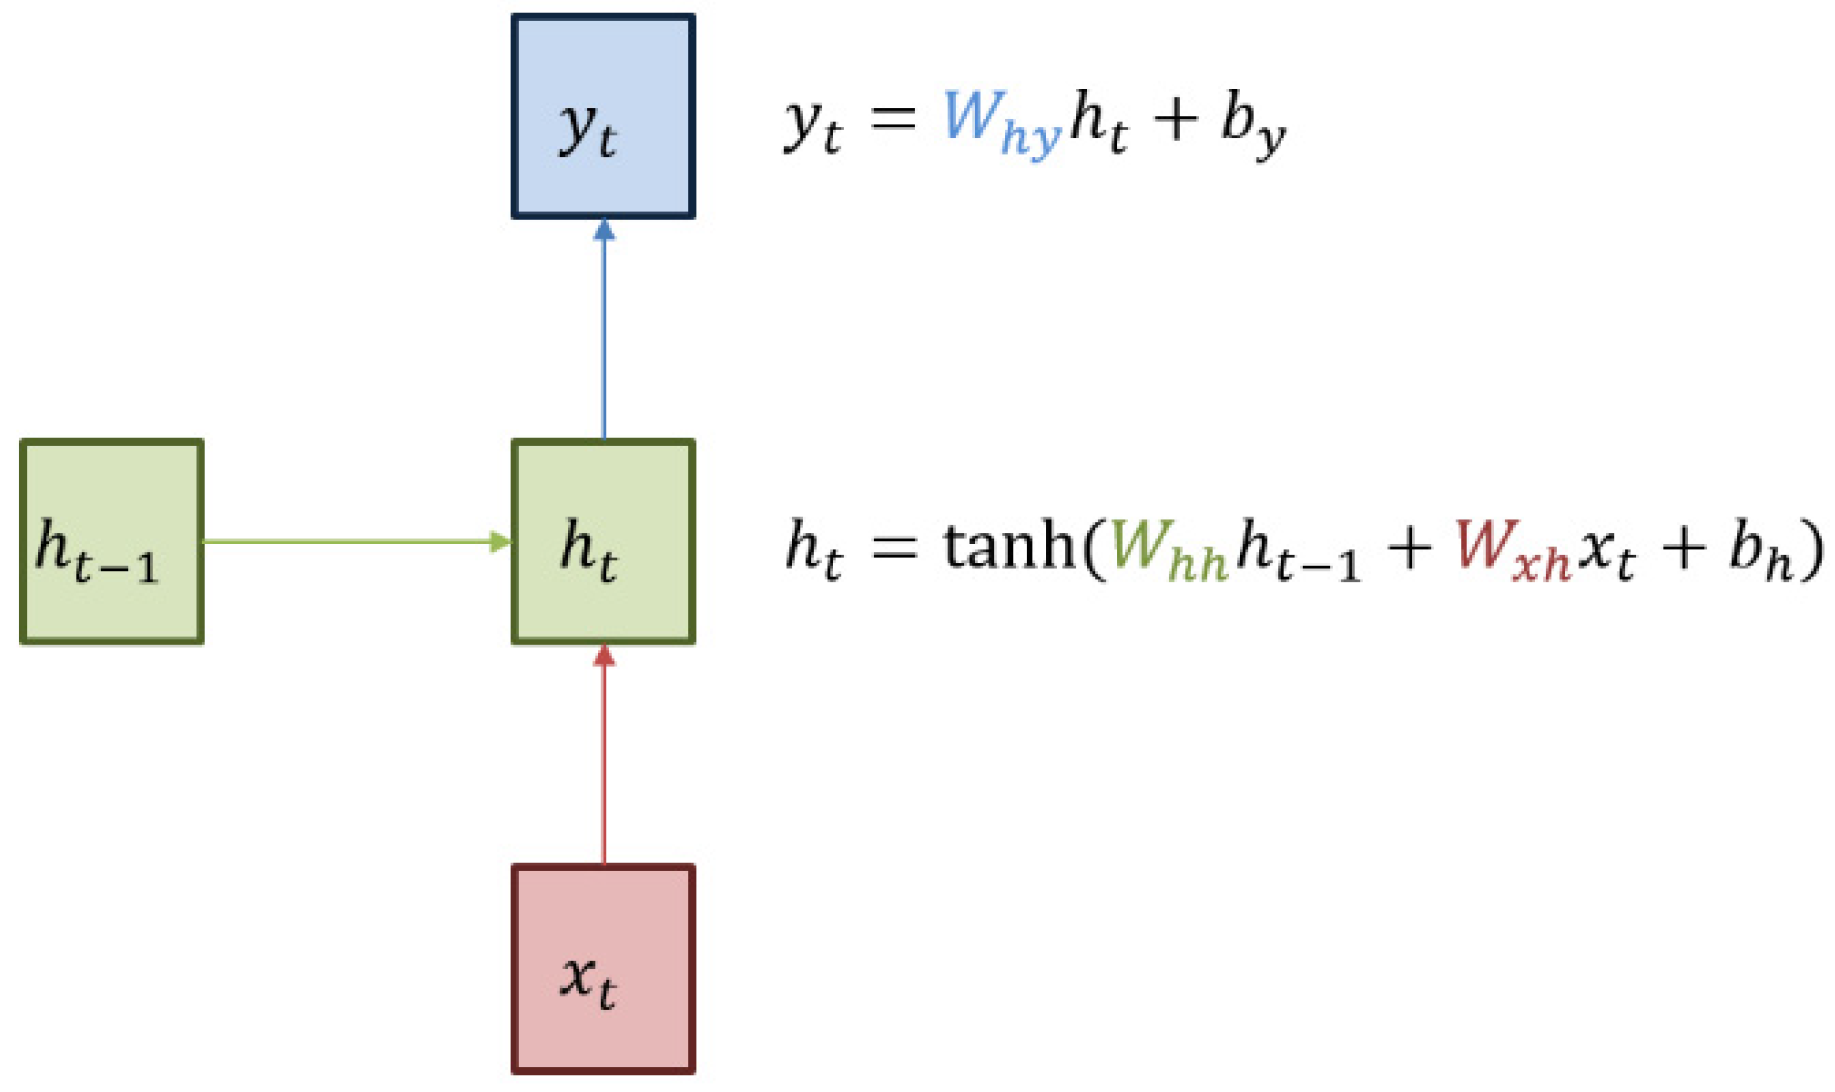
Structure of the RNN Prediction Model
4.2. System Activation Test
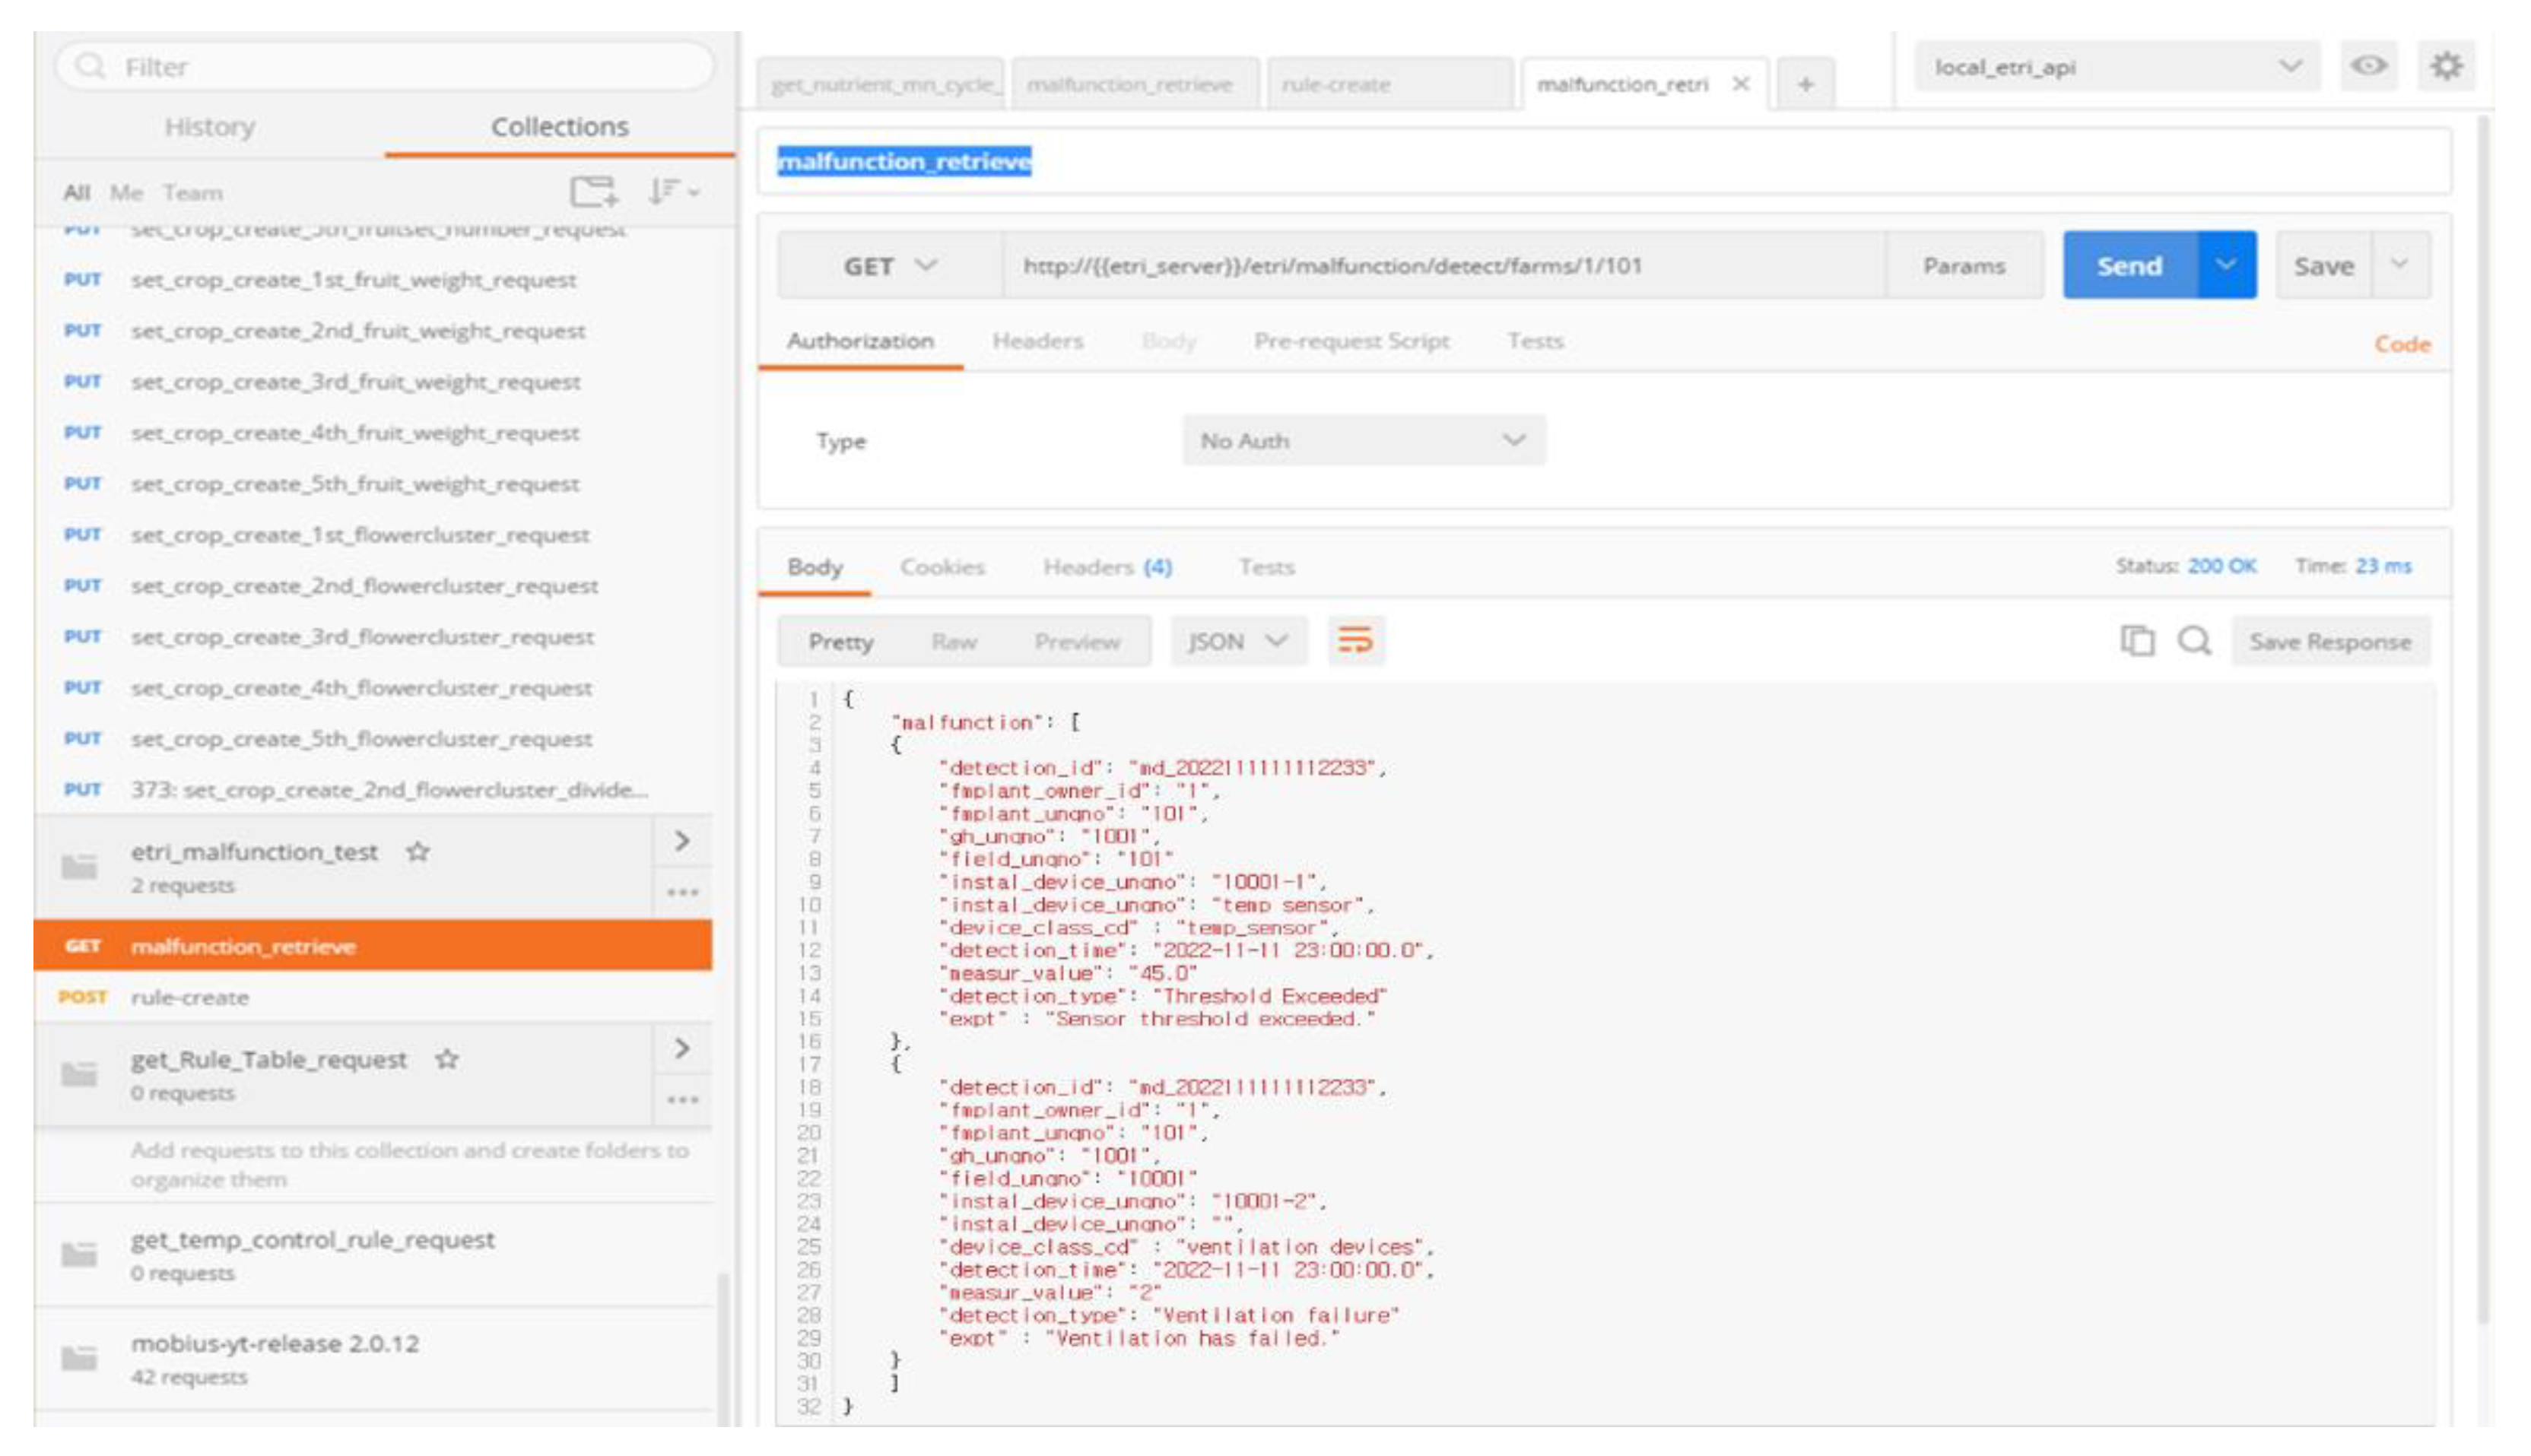
API Test for Interoperability in Malfunction Detection
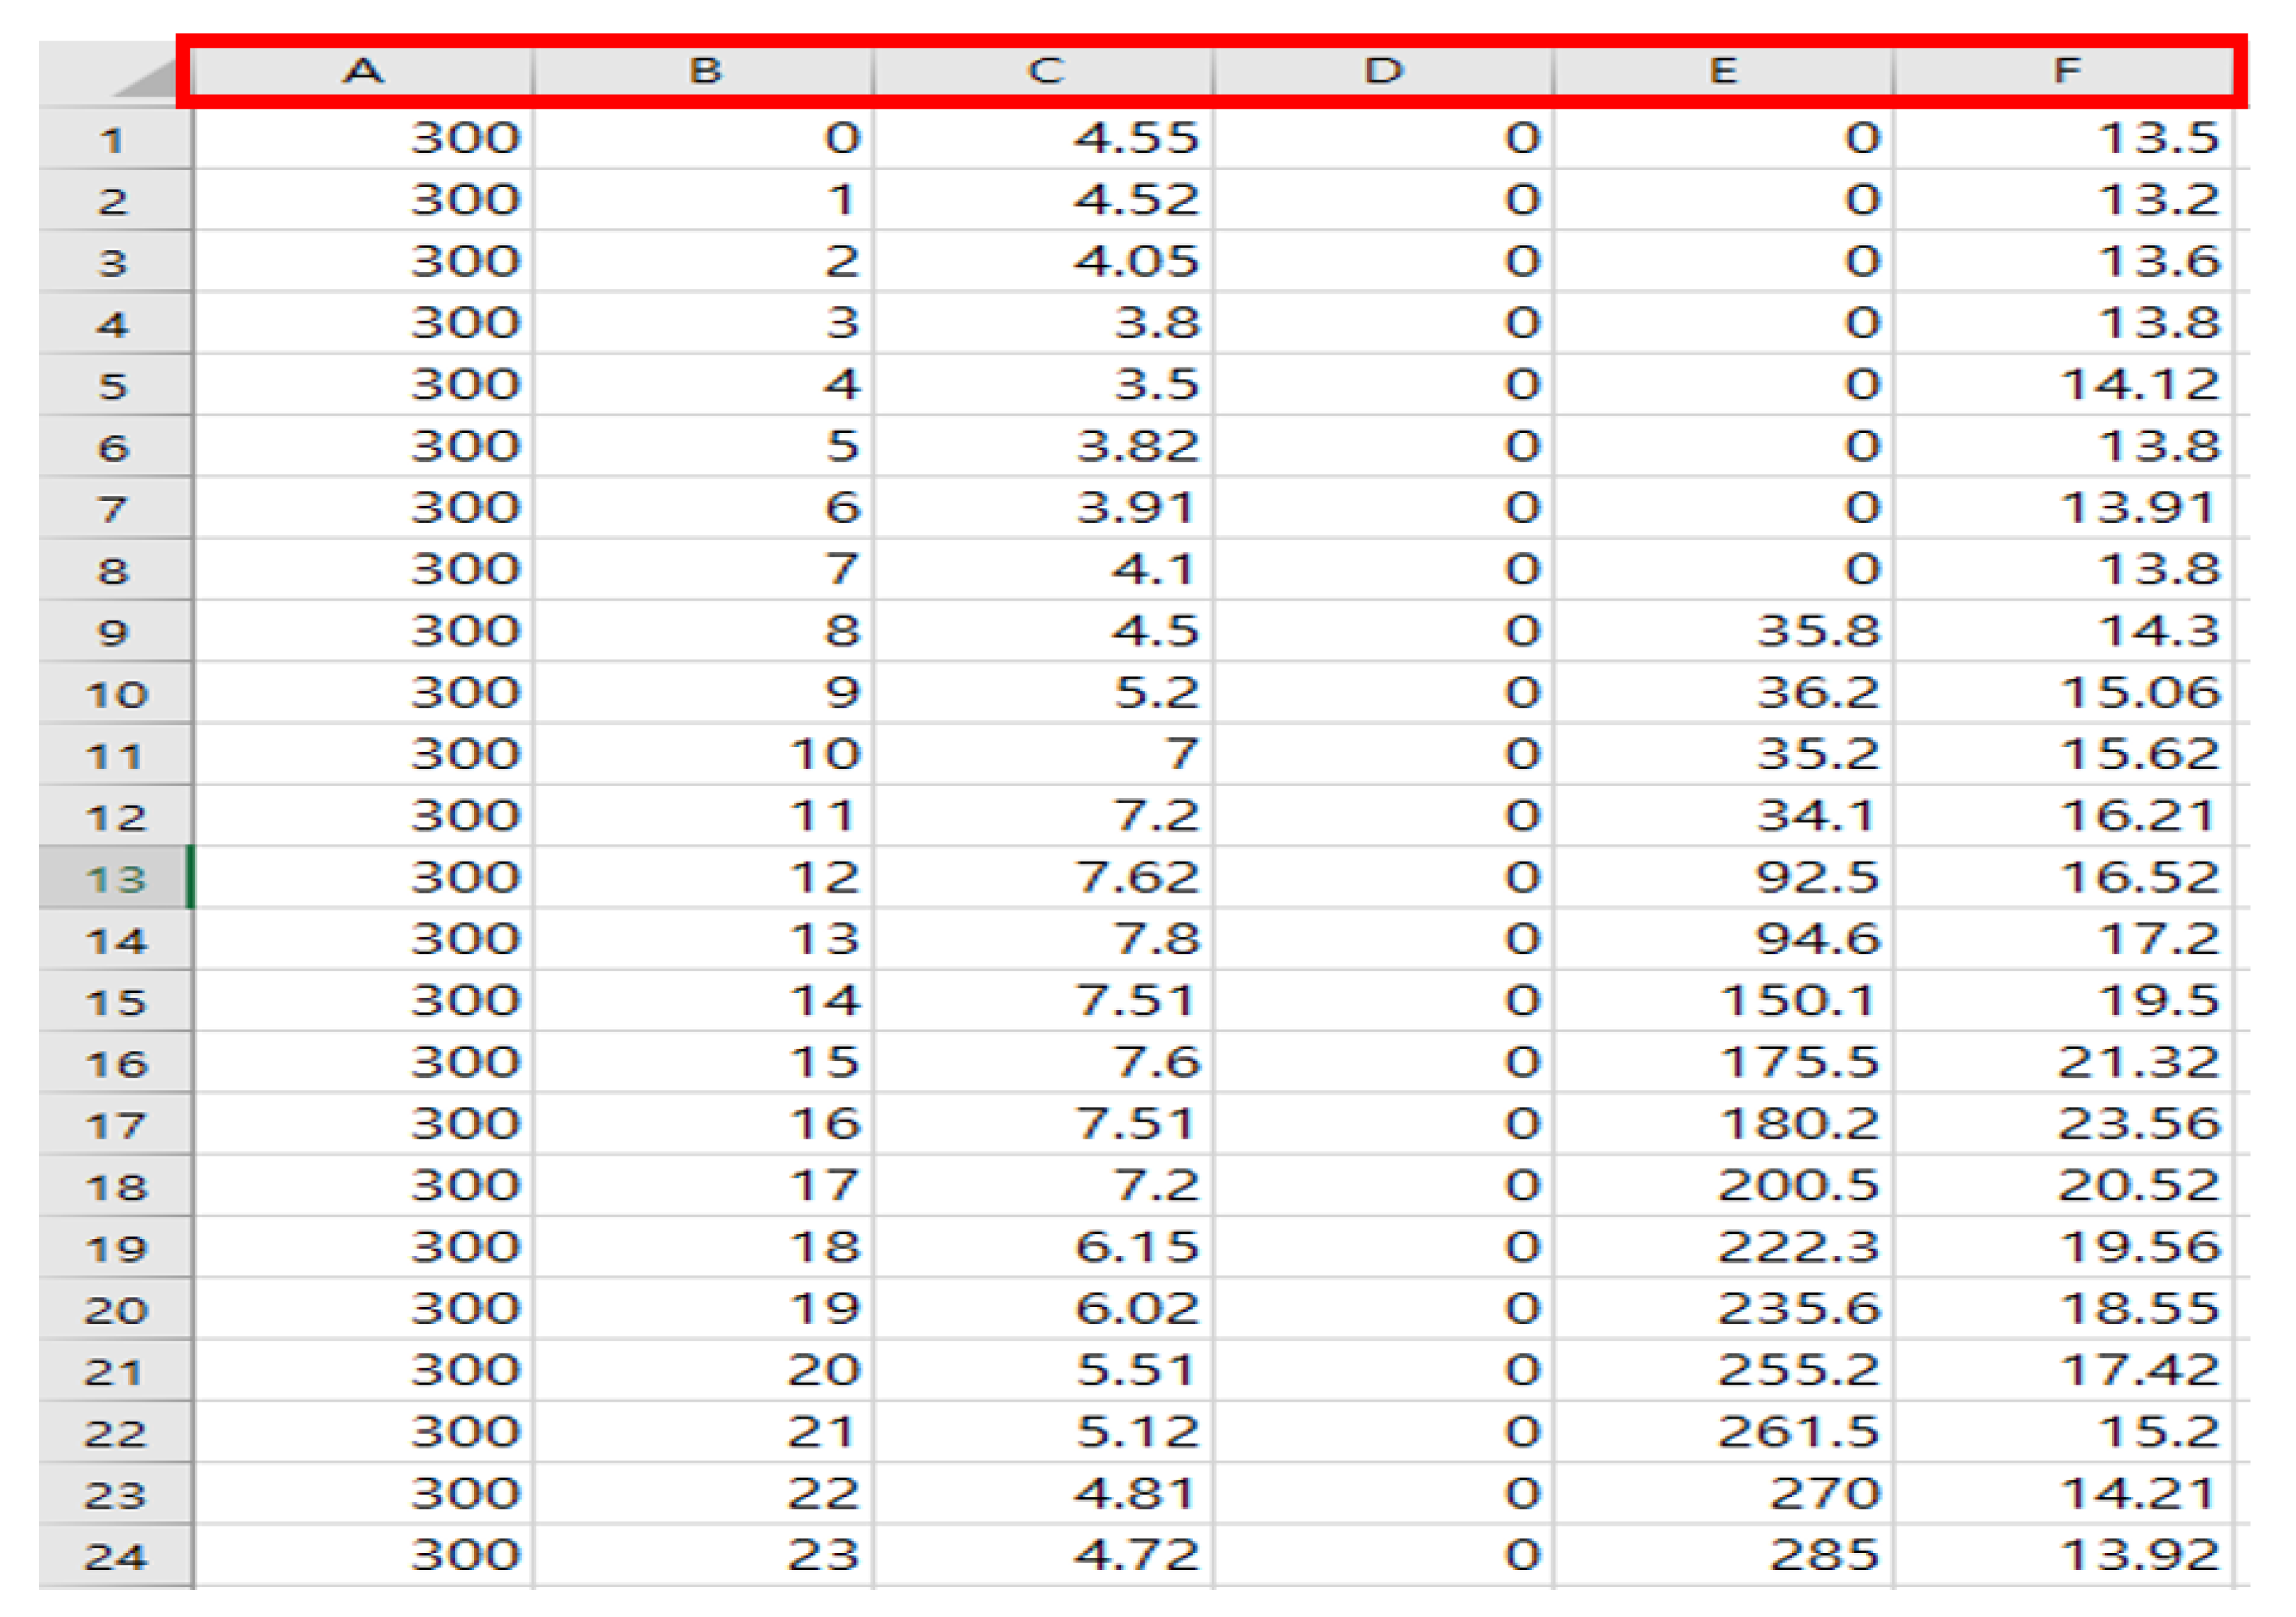
4.3. Training and Validation of the RNN Model
5. Conclusions
Author Contributions
Funding
Institutional Review Board Statement
Data Availability Statement
Conflicts of Interest
References
- Ku, H.; Lee, R.; Park, Y. Development of a U-IT Based Monitoring System for the Feeding and Environmental Management of Livestock Animal Production. 2014. Available online: https://scienceon.kisti.re.kr/srch/selectPORSrchReport.do?cn=TRKO201500011294 (accessed on 19 November 2022).
- Jeong, W.; Ahn, Y.; Lee, R.; Koo, H. A Study of Ubiquitous-based Stall Management System. J. Anim. Environ. Sci. 2014, 20, 57–62. [Google Scholar] [CrossRef][Green Version]
- Kim, S.; Lee, J.; Choi, B. Design and implementation of malfunction detection of smart farm systems. In Proceedings of the Electronic Information and Communication Academic Conference (CEIC), Yeosu, Korea, 27–28 October 2017; pp. 175–178. [Google Scholar]
- Lee, J.; Kim, S.; Lee, S.; Choi, H.; Jeong, J. A study on the necessity and construction plan of IoT-based open platform for the spread of smart agriculture. J. Korea Multimed. Soc. 2014, 17, 1313–1324. [Google Scholar] [CrossRef][Green Version]
- Jung, J.; Moon, B.; Nah, D.; Kim, J.; Kim, H. Analysis optimum thermal efficiency of the heat recovery ventilators according to the height of the duct. J. Korean Soc. Agric. Mach. 2015, 20, 147–148. [Google Scholar]
- Wu, Z.; Heiseberg, P.; Stoustrup, J. Modeling and control of livestock ventilation systems and indoor environments. In Proceedings of the 26th Air Infiltration and Ventilation Center (AIVC) Conference: Ventilation in Relation to the Energy Performance of Buildings, Brussels, Belgium, 21–23 September 2005; pp. 335–340. [Google Scholar]
- Jeong, S. Monthly Korean Chicken. Korea Chick. Counc. 2009, 15, 82–85. [Google Scholar]
- Seo, S. 130,000 Chickens Died in the Heat, and the Ventilation System Was Broken. Available online: http://www.newsway.co.kr/news/view?ud=2014071019485131917(2022.07) (accessed on 20 November 2022).
- Jeffery, S.R.; Alonso, G.; Franklin, M.J.; Hong, W.; Widom, J. Declarative support for sensor data cleaning. In Proceedings of the 4th International Conference on Pervasive Computing, Dublin, Ireland, 7–10 May 2006; Volume 3968, pp. 83–100. [Google Scholar]
- Sharma, A.B.; Golubchik, L.; Govindan, R. Sensor faults: Detection methods and prevalence in real-world datasets. ACM Trans. Sens. Netw. 2010, 6, 1–39. [Google Scholar] [CrossRef]
- Mourad, M.; Bertrand-Krajewski, J.L. A method for automatic validation of long time series of data in urban hydrology. Water Sci. Technol. 2002, 45, 263–270. [Google Scholar] [CrossRef]
- Ranganathan, A.; Al-Muhtadi, J.; Campbell, R.H. Reasoning about uncertain contexts in pervasive computing environments. IEEE Pervasive Comput. 2004, 3, 62–70. [Google Scholar] [CrossRef]
- Elnahrawy, E.; Nath, B. Cleaning and querying noisy sensors. In Proceedings of the 2nd ACM International Conference on Wireless Sensor Networks and Applications, San Diego, CA, USA, 19 September 2003; pp. 78–87. [Google Scholar]
- Park, J.; Hong, J.; Kim, W. Study on interworking of intelligent IoT semantic information using IoT-lite ontology. J. Inf. Technol. 2017, 16, 111–127. [Google Scholar]
- Hong, I. A study on functional test of damage detection sheet using RS-485 embedded board. J. Knowl. Inf. Technol. Syst. 2018, 13, 211–220. [Google Scholar]
- Myung, S.; Kim, S. The design of Open IoT Platform based on one M2M Standard Protocol. J. Korea Inst. Inf. Commun. Eng. 2017, 21, 1943–1949. [Google Scholar]
- Tomicic, I.; Grd, P.; Bernik, A. Smart internet of things modular micro grow room architecture. Interdiscip. Descr. Complex Syst. INDECS 2022, 20, 469–482. [Google Scholar] [CrossRef]
- Vigneswari, T.; Vijaya, N. Smart livestock management using cloud IoT. Cloud IoT Syst. Smart Agric. Eng. 2022, 1, 55–74. [Google Scholar]
- Lambert, J.; Monahan, R.; Casey, K. Accidental choices—How JVM choice and associated build tools affect interpreter performance. Computers 2022, 11, 96. [Google Scholar] [CrossRef]
- Bawankule, K.L.; Dewang, R.K.; Singh, A.K. A classification framework for straggler mitigation and management in a heterogeneous Hadoop cluster: A state-of-art survey. J. King Saud Univ.—Comput. Inf. Sci. 2022, 9, 7621–7644. [Google Scholar] [CrossRef]
- Dean, J.; Ghemawat, S. Mapreduce: Simplified data processing on large clusters. Commun. ACM 2008, 51, 107–113. [Google Scholar] [CrossRef]
- Chen, C.T.; Hung, L.J.; Hsieh, S.Y.; Buyya, R.; Zomaya, A.Y. Heterogeneous job allocation scheduler for Hadoop MapReduce using dynamic grouping integrated neighboring search. IEEE Trans. Cloud Comput. 2017, 8, 193–206. [Google Scholar] [CrossRef]
- Michael, A.; Reynold, S.X.; Cheng, L.; Huai, Y.; Liu, D.; Bradley, J.K.; Meng, X.; Kaftan, T.; Franklin, M.J.; Ghodsi, A.; et al. Spark SQL: Relational data processing in Spark. In Proceedings of the 2015 ACM SIGMOD International Conference on Management of Data, Melbourne, Australia, 31 May–4 June 2015; pp. 1383–1394. [Google Scholar]
- Vora, M.N. Hadoop-HBase for large-scale data. In Proceedings of the 2011 International Conference on Computer Science and Network Technology, Harbin, China, 24–26 December 2011; pp. 601–605. [Google Scholar]
- Berners-Lee, T.; Hendler, J.; Lassila, O. The semantic web. Sci. Am. 2001, 284, 34–43. [Google Scholar] [CrossRef]
- Lee, J.; Lee, H. Comparison of deep learning models using protein sequence data. KIPS Trans. Softw. Data Eng. 2022, 11, 245–254. [Google Scholar]
- Ehsan, A.; Abuhaliqa, M.E.; Catal, C.; Mishra, D. RESTful API testing methodologies: Rationale, challenges, and solution directions. Appl. Sci. 2022, 12, 4369. [Google Scholar] [CrossRef]
- Lee, W.; Kim, S.; Yu, Y.; Koo, B. Development of graph based deep learning methods for enhancing the semantic integrity of spaces in BIM models. Korean J. Constr. Eng. Manag. 2022, 23, 45–55. [Google Scholar]
- Barznji, K.A. Big data processing frameworks for handling huge data efficiencies and challenges: A survey. Int. J. Data Sci. Anal. 2022, 2, 1–9. [Google Scholar]
- Park, D. A study on semantic technology in the internet of things. J. Inst. Electron. Inf. Eng. 2015, 42, 25–32. [Google Scholar]
- Janowicz, K.; Compton, M. The stimulus-sensor-observation ontology design pattern and its integration into the semantic sensor network ontology. In Proceedings of the 3rd International Workshop on Semantic Sensor Networks, Shanghai, China, 7 November 2010; Volume 668, pp. 1–15. [Google Scholar]
- Kwon, S.; Lee, J.; Kim, S.; Lee, S.; Shin, Y.; Doh, Y.; Heo, T. Design of big semantic system for factory energy management in IoE environments. J. Korean Soc. Inf. Process. 2022, 29, 37–39. [Google Scholar]
- Lee, M.; Lee, E.; Rho, J. Cataloging trends after LRM and its acceptance in KORMARC bibliographic format. Korean Biblia Soc. Libr. Inf. Sci. 2022, 33, 25–45. [Google Scholar]
- Lembo, D.; Stantarelli, V.; Savo, D.F.; Giacomo, G.D. Graphol: A graphical language for ontology modeling equivalent to OWL 2. Future Internet 2022, 14, 78. [Google Scholar] [CrossRef]
- Gwon, G. The influence and characteristics of fine dust on livestock in Korea. Mag. Korean Soc. Agric. Eng. 2020, 62, 15–23. [Google Scholar]
- Kim, J. In the Hot Summer, the Temperature and Humidity of the Barn Must Be Lowered. Enrichment Oil Communication. 2016. Available online: http://www.amnews.co.kr/news/articleView.html?idxno=18865(2022.07) (accessed on 20 November 2022).
- Abc Ei-Hack, M.E.; Alagawany, M. Managerial and nutritional trends to mitigate heat stress risks in poultry farms. Sustain. Agric. Environ. Egypt Part II 2018, 77, 325–338. [Google Scholar]
- Ahaotu, E.O.; De los Ríos, P.; Ibe, L.C.; Singh, R.R. Climate change in poultry production system—A review. Int. J. Sustain. Dev. Afr. 2019, 10, 362–370. [Google Scholar]


| Standard | Content |
|---|---|
| Rule 1 | When the device type (e.g., temperature sensor) is identical to another device installed in the same zone, and the sensor values differ from each other, a malfunction event is added. |
| Rule 2 | When a heater in another device is close to a temperature sensor, a malfunction event is added. |
| Rule 3 | When temperature and humidity sensors are installed in the same zone, and the temperature is ≤5 °C degrees and the humidity is ≤10 °C, a malfunction event is added. |
| Rule 4 | When the device has been initialized but the measurements of sensors installed in the same zone are 0, a malfunction event is added. |
| Rule 5 | When an RNN-based predicted value exists for an installed equipment, and the absolute predicted value exceeds the absolute value of the threshold for the equipment, a malfunction event is added. |
| Malfunction Detection Results | ||||||
|---|---|---|---|---|---|---|
| SYSTEM | Common Framework Based on ML/DL | SUB SYSTEM | Malfunction Detection | |||
| TABLE ID | Malfunction_ detection | TABLE NAME | Malfunction Detection Results | |||
| NO | COLUMN ID | COLUMN NAME | DATA TYPE | NULL | KEY | REMARK |
| 1 | Detection_id | Diagnostic Result Identifier | VARCHAR(20) | NOTNULL | PK | md_yymmddhhmmssSSS |
| 2 | Livestock_owner_ID | Livestock Farm ID | VARCHAR(30) | NOTNULL | PK | 1 |
| 3 | Livestock_unqno | Livestock Farm Identifier | VARCHAR(6) | NOTNULL | PK | 101 |
| 4 | Barn_unqno | Place Identifier | VARCHAR(10) | NOTNULL | PK | 1001 |
| 5 | Instal_device_unqno | Equipment unique Number | VARCHAR(6) | NOTNULL | PK | 1001-1 |
| 6 | Instal_device_nm | Installation Equipment Name | VARCHAR(50) | NOTNULL | Internal temperature | |
| 7 | Device_class_cd | Equipment classification code | VARCHAR(6) | NOTNULL | Temp_sensor | |
| 8 | Detection_time | Detection time | TIMESTAMP | NOTNULL | 2000-00-00-00:00:00 | |
| 9 | Mesur_value | Mesur value | DECIMAL(10,2) | NOTNULL | 50 | |
| 10 | Detection_type | Detection type | VARCHAR(64) | NOTNULL | Over threshold | |
| 11 | expt | exception | VARCHAR(1024) | NOTNULL | Temperature sensor threshold exceeded. | |
| Malfunction Detection Rules | ||||||
|---|---|---|---|---|---|---|
| SYSTEM | Common Framework Based on ML/DL | SUB SYSTEM | Malfunction Detection | |||
| TABLE ID | Malfunction_ detection | TABLE NAME | Malfunction Detection Results | |||
| NO | COLUMN ID | COLUMN NAME | DATA TYPE | NULL | KEY | REMARK |
| 1 | Livestock_owner_ID | Livestock Farm ID | VARCHAR(30) | NOTNULL | PK | 1 |
| 2 | Livestock_unqno | Livestock Farm Identifier | VARCHAR(6) | NOTNULL | PK | 1 |
| 3 | Rule_id | Rule Identifier | VARCHAR(32) | NOTNULL | PK | The_rule_001 |
| 4 | Rule_name | Rule name | VARCHAR(64) | NOTNULL | Sensor threshold rule | |
| 5 | Rule_type | Rule type | VARCHAR(16) | NOTNULL | Threshold, multisensory, actuator, User_defined | |
| 6 | Device_class_cd | Equipment classification code | VARCHAR(6) | NOTNULL | Temp_sensor | |
| 7 | Min_value | Min value | DECIMAL(10,2) | 30.5 | ||
| 8 | Max_value | Max value | DECIMAL(10,2) | 50.5 | ||
| 9 | Device_calss_cd2 | Equipment classification code | VARCHAR(6) | A_sensor | ||
| 10 | Device_calss_cd3 | Equipment classification code | VARCHAR(6) | B_sensor | ||
| 11 | Operator1 | Equipment 1 Comparison Operator | VARCHAR(3) | >, <, >=, <=, ==, != | ||
| 12 | Operator2 | Equipment 2 Comparison Operator | VARCHAR(3) | >, <, >=, <=, ==, != | ||
| 13 | Operator3 | Equipment 3 Comparison Operator | VARCHAR(3) | >, <, >=, <=, ==, != | ||
| 14 | Value1 | Equipment 1 Comparison Value | DECIMAL(10,2) | 50.5 | ||
| 15 | Value2 | Equipment 2 Comparison Value | DECIMAL(10,2) | 50.5 | ||
| 16 | Value3 | Equipment 3 Comparison Value | DECIMAL(10,2) | 50.5 | ||
| 17 | Power_consum | Power consumption | DECIMAL(10,2) | Power Consumption Comparison | ||
| 18 | Power_consumption | Actuator Power consumption | DECIMAL(10,2) | 390.0 (Wh) | ||
| 19 | User_rule | Custom Rule Sentences | VARCHAR(2048) | |||
| Directory | File | Outline |
|---|---|---|
| malfunction_rnn | malfunction_rnn_prediction_model.py | Training model source |
| malfunction_rnn_predicttion.py | Prediction model source | |
| malfunction_rnn/model | Checkpoint Malfunction_predict.pd.data-00000-of-00001 Malfunction_predict.pd.index Malfunction_predict.pd.meta | Saved training model |
| malfunction_rnn/temp | PF_01_Train.csv PF_02_Train.csv PF_03_Train.csv PF_04_Train.csv | Temperature data for each training poultry farm |
| malfunction_rnn/test | PF_01_Pridict.csv PF_02_Pridict.csv PF_03_Pridict.csv PF_04_Pridict.csv | Data for prediction tests |
| print(’size of training: ’ + str(len(tainX))) print(’size of test: ’ + str(len(inputX))) X = tf.placeholder(tf.float 32, [None, seq_length, data_dim]) Y = tf.placeholder(tf.float32, [None, 1]) cell = tf.contrib.rnn.GRUCell( num_units = hidden_dim, activation = tf.tanh) cells = tf.contrib.rnn.MultiRNNCell([cell] * NUMBER_OF_RNN_CELL_LAYERS); outputs, _states = tf.nn.dynamic_rnn(cell, X, dtype = tf.float 32) Y_pred = tf.contrib.layers.fully_connected( outputs[:, -1], output_dim, activation_fn=None) |
| loss = tf.reduce_sum(tf.square(Y_pred - Y)) tf.summary.scalar(“cost”, loss) summary = tf.summary.merge_all() optimizer = tf.tarin.AclamOptimizer(learning_rate) targets = tf.placeholder(tf.float32, [None, 1]) rmse = tf.sqrt(tf.reduce_mean(tf.square(targets - predictions))) with tf.Session() as sess: init = tf.global_variables_initializer() sess.run(init) # Create summary writer writer = tf.summary.FileWriter(TB_SUMMARY_DIR) writer.add_graph(sess.graph) global_step = 0 |
| test_predict = sess.run(Y.pred, feed_dict = {X: firstTestX}) rmse_val = sess.run(rmse, feed_dict = { targets: firstTestY, predictions: test_predict}) print(“firstTestX RMSE: {}”.format(rmse_val)) correst_prediction = test_predict - firstTestY accuracy = tf.reduce_mean(correct_prediction) plt.figure(figsize =(20, 6)) plt.plot(RevMinMaxScaler(firstTestY), ‘b-’, label = ‘Sensing’) plt.plot(RevMinMaxScaler(test_predict), ‘r-’, label = ‘Prediction’) plt.xlabel(“Time Period”) plt.Ylabel(“Temperature”) plt.legend( lod = ‘best’) plt.show() }) |
| prdict = RevMinMaxScaler(sess.run(Y_pred, feed_dict = {X: inputX})) print(“Predict: ” + str(predict)) variance = abs(predict - RevMinMaxScaler(sensingValueY)) print(“Variance: ” + str(variance)) |
| Equipment | Description |
|---|---|
| Zigbee sensor node | Supports Zigbee communication capabilities Provides protocol support for communication with Zigbee gateways Provides RS-485-based communication assistance Temperature measurement range: −40 °C to 80 °C |
| Zigbee gateway | 802.15.4 IEEE Zigbee provides RS-485-based communication capabilities Transmission of temperature measurement information using RS-485 |
| Poultry farm ventilation system | Remote ventilation control system Provides functions to set fan speed and temperature Supports RS-485 serial, Zigbee, Wi-Fi communications |
| Field | Size | Type | Description |
|---|---|---|---|
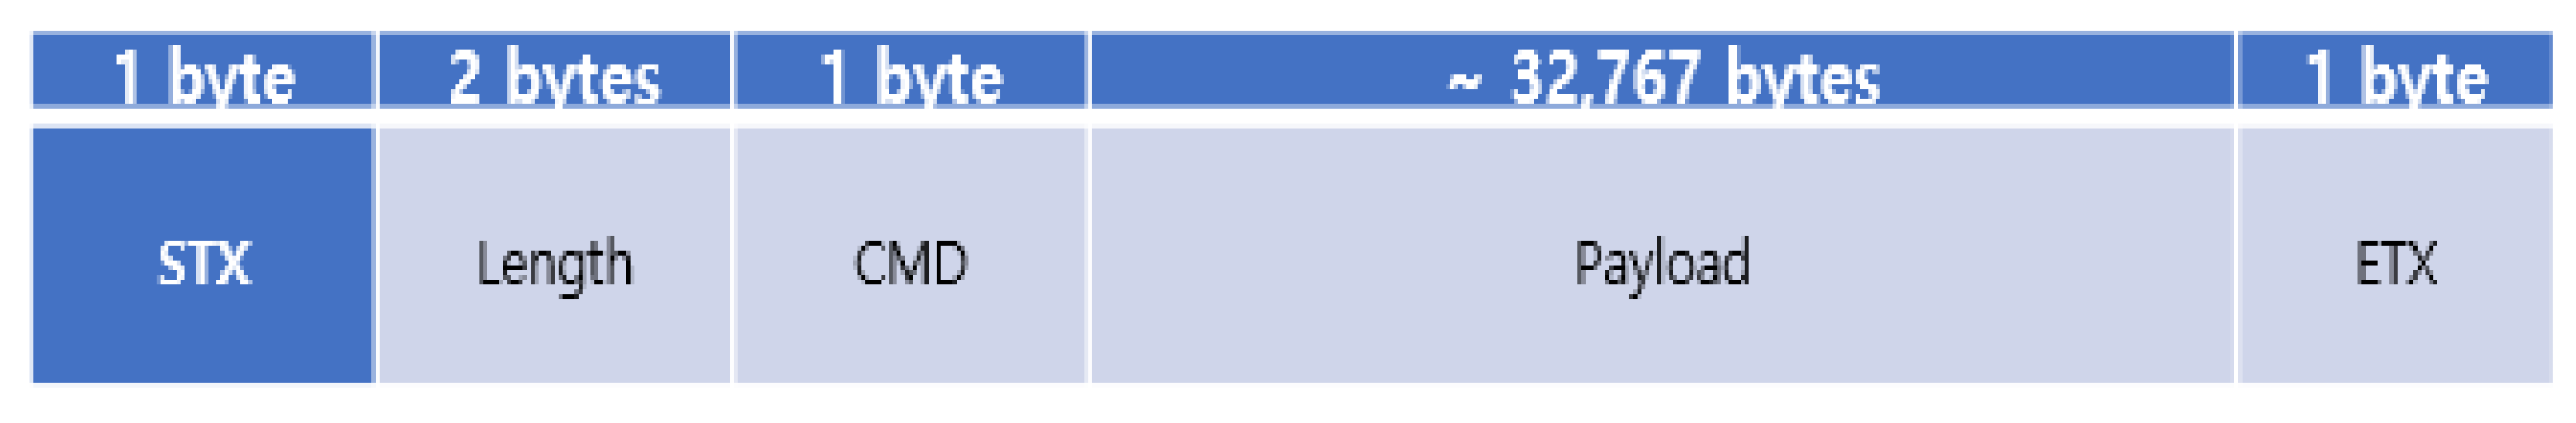
| STX | 1 byte | unsigned int | Start of message 0 × 02 |
| Length | 2 bytes | Little-endian unsigned int | payload byte size |
| CMD | 1 byte | unsigned int | Message Type/Command Code 0 × 02: Register pc information 0 × 03: Server → Agent: Change agent pc power state 0 × 05: Agent → Server: Ping (Heartbeat) |
| Payload | n bytes | - | Transmission Data Area (Variable) Maximum size: 32,767 bytes Follows the JSON format. |
| ETX | 1 byte | unsigned int | End of message 0 × 03 |
| Field | Size | Type | Description |
|---|---|---|---|
| STX | 1 | 0 × 02 | Message Start Indicator |
| Length | 2 | 0 × 01 | Payload data byte size |
| CMD | 1 | 0 × 64 | Massage type (0 × 64) |
| Payload | variable | JSON | KEY: mac: MAC address panId: PAN ID channel: channel ex) {“mac”: “E0-43-DB-0B-1F-20”, “panId”: 1, “channel”: 11} |
| ETX | 1 | 0 × 03 | Message End Indicator |
| Field | Size | Type | Description |
|---|---|---|---|
| STX | 1 | 0 × 02 | Message Start Indicator |
| Length | 2 | 0 × 01 | Payload data byte size |
| CMD | 1 | 0 × 65 | Massage type (0 × 65) |
| Payload | variable | JSON | KEY: mac: MAC address(optional) address: Equipment Identifier model: model name ex) {“mac”: “E0-43-DB-0B-1F-20”, “address”:1, “model”: “XXXX-111A”} |
| ETX | 1 | 0 × 03 | Message End Indicator |
| Field | Size | Type | Description |
|---|---|---|---|
| STX | 1 | 0 × 02 | Message Start Indicator |
| Length | 2 | 0 × 01 | Payload data byte size |
| CMD | 1 | 0 × 04 | Massage type (0 × 04) |
| Payload | variable | JSON | KEY: mac Sensor Node MAC value: Sensing Value unit: unit type: Data type(“byte”, “int”, “float”, “double”, “string”) ex) {“mac”: “E0-43-DB-0B-1F-20”, “value”: “35”, “unit”: “°C”, “type”:“int”} |
| ETX | 1 | 0 × 03 | Message End Indicator |
| Name of Device | Outline | Installation Software |
|---|---|---|
| DL API Test Server | DL Server | Hadoop 2.6.0 Hive 2.1.0 or higher Maria DB JDK 1.7 |
| Client Device | Windows 10 | POSTMAN Chrome Browser |
| Malfunction detection devices for ventilation | Gateway and Sensor Nodes | Gateway F/W Linkage of ventilation malfunction detection measurement devices and gateway communication F/W |
| Parameter Name | Value |
|---|---|
| Training Data Size | 3590 |
| Test Data Size | 1006 |
| RNN Cell | LSTM |
| Layer Stack Size | 5 |
| Data Dim | 6 |
| Hidden Dim | 10 |
| Sequence Len | 5 |
| Iteration | 500 |
| Learning rate | 0.01 |
| Optimizer | AdamOptimizer |
| RNN Cell | RSME |
|---|---|
| LSTM | 0.0689 |
| GRU | 0.0643 |
| Sequence Length | RSME |
|---|---|
| 3 | 0.0697 |
| 5 | 0.0682 |
| 7 | 0.0725 |
| 10 | 0.0716 |
| Hidden Dimension | RSME |
|---|---|
| 3 | 0.0832 |
| 10 | 0.0692 |
| Hidden Layer | RSME |
|---|---|
| 5 | 0.0692 |
| 10 | 0.0713 |
| Number of Training Iterations | RSME |
|---|---|
| 500 | 0.0755 |
| 1000 | 0.0734 |
| 5000 | 0.0725 |
| 10,000 | 0.0691 |
| 50,000 | 0.0689 |
| 100,000 | 0.0958 |
Publisher’s Note: MDPI stays neutral with regard to jurisdictional claims in published maps and institutional affiliations. |
© 2022 by the authors. Licensee MDPI, Basel, Switzerland. This article is an open access article distributed under the terms and conditions of the Creative Commons Attribution (CC BY) license (https://creativecommons.org/licenses/by/4.0/).
Share and Cite
Kim, S.J.; Lee, M.H. Design and Implementation of a Malfunction Detection System for Livestock Ventilation Devices in Smart Poultry Farms. Agriculture 2022, 12, 2150. https://doi.org/10.3390/agriculture12122150
Kim SJ, Lee MH. Design and Implementation of a Malfunction Detection System for Livestock Ventilation Devices in Smart Poultry Farms. Agriculture. 2022; 12(12):2150. https://doi.org/10.3390/agriculture12122150
Chicago/Turabian StyleKim, Seung Jae, and Meong Hun Lee. 2022. "Design and Implementation of a Malfunction Detection System for Livestock Ventilation Devices in Smart Poultry Farms" Agriculture 12, no. 12: 2150. https://doi.org/10.3390/agriculture12122150
APA StyleKim, S. J., & Lee, M. H. (2022). Design and Implementation of a Malfunction Detection System for Livestock Ventilation Devices in Smart Poultry Farms. Agriculture, 12(12), 2150. https://doi.org/10.3390/agriculture12122150