Article

Streamflow of the Betwa River under the Combined Effect of LU-LC and Climate Change

by
Amit Kumar
1,
Raghvender Pratap Singh
1,
Swatantra Kumar Dubey
2 and
Kumar Gaurav
1,*
1
Department of Earth and Environmental Sciences, Indian Institute of Science Education and Research Bhopal, Bhopal 462066, Madhya Pradesh, India
2
Department of Environmental Engineering, Seoul National University of Science and Technology, Seoul 01811, Republic of Korea
*
Author to whom correspondence should be addressed.
Agriculture 2022, 12(12), 2005; https://doi.org/10.3390/agriculture12122005
Submission received: 12 September 2022 / Revised: 12 November 2022 / Accepted: 21 November 2022 / Published: 25 November 2022
(This article belongs to the Special Issue Advances in Agrometeorology and Climatology)

Abstract

:
We estimate the combined effect of climate and landuse-landcover (LU-LC) change on the streamflow of the Betwa River; a semi-arid catchment in Central India. We have used the observed and future bias-corrected climatic datasets from 1980–2100. To assess the LU-LC change in the catchment, we have processed and classified the Landsat satellite images from 1990–2020. We have used Artificial Neural Network (ANN) based Cellular Automata (CA) model to simulate the future LU-LC. Further, we coupled the observed and projected LU-LC and climatic variables in the SWAT (Soil and water assessment tool) model to simulate the streamflow of the Betwa River. In doing so, we have setup this model for the observed (1980–2000 and 2001–2020) and projected (2023–2060 and 2061–2100) time periods by using the LU-LC of the years 1990, 2018, and 2040, 2070, respectively. We observed that the combined effect of climate and LU-LC change resulted in the reduction in the mean monsoon stream flow of the Betwa River by 16% during 2001–2020 as compared to 1982–2000. In all four CMIP6 climatic scenarios (SSP126, SSP245, SSP370, and SSP585), the mean monsoon stream flow is expected to decrease by 39–47% and 31–47% during 2023–2060 and 2061–2100, respectively as compared to the observed time period 1982–2020. Furthermore, average monsoon rainfall in the catchment will decrease by 30–35% during 2023–2060 and 23–30% during 2061–2100 with respect to 1982–2020.

1. Introduction

Water resource management is becoming more challenging under the climate change and anthropogenic stresses, especially in arid and semi-arid climatic regions [1]. Semi-arid region is characterized by the high inter-annual rainfall variability, high mean temperature, surface, and sub-surface water scarcity [2,3]. Further, the increasing frequency and intensity of extreme hydro-climatic events, such as heavy rainfall, flood, and droughts, have adversely affected the hydrological cycle. A sustainable water resource management is therefore needed to deal with climate change and environmental stress in the Anthropocene.
LU-LC and climate change are the foremost driving factors that regulate the surface and sub-surface hydrology in a river catchment [4]. Any significant change in the LU-LC can greatly alter the regional hydrological cycle by modifying the rate of surface runoff, infiltration, and evapotranspiration [5]. In addition, climate change can affect the rainfall pattern, soil moisture conditions, temperature variability in the catchment, and eventually, the different components of the hydrological cycle. Nayak [6] noticed that in Central India, open forest and vegetation cover has diminished by 0.7% and 0.3% however, agricultural land has increased by 0.5% during 1981–2006. Furthermore, the mean Indian Summer Monsoon Rainfall (ISMR) over Central India has declined by 10–20% from 1950–2015 [7,8].
Several studies have been carried out to quantify the effect of climate and LU-LC change on the streamflow [5,9,10,11,12,13]. These studies have considered the effect of individual and the combined effect of climate and LU-LC change on streamflow. Most of these studies rely on one-time LU-LC patterns to simulate the long-term hydrological processes using the climate variables [14,15,16,17,18]. Chawla and Mujumdar [10] evaluated the isolated and combined effect of climate and LU-LC change on the stream flow of the upper Ganga River under the past, present, and future climate scenarios by using the Variable Infiltration Capacity (VIC) model. They observed that the climate variables have a larger influence on the streamflow of the Ganga River as compared to LU-LC. Tian et al. [5] investigated both the climate and LU-LC change impact on runoff of the Han River basin, China using the SWAT model. They noticed that the combined effect of LU-LC and climate change is larger than considering the climate and LU-LC change alone in the model. Hung et al. [12] examined both effects on stream flow in two nested catchments using Storm Water Management Model and observed similar results. They reported that the effect of LU-LC is more in the smaller catchments than in the larger catchments. Sinha et al. [13] evaluated the stream flow of Payaswani River basin under three different scenarios and observed that the stream flow has increased by 11% due to LU-LC change in the catchment since 1980. Gosain et al. [19] have highlighted that the several river basins in India would face seasonal or annual water scarcity due to climate change.
Most of the studies discussed above use SWAT and VIC models to compute the stream flow under different environmental conditions. They have considered different future global and regional climate models as forcing for these hydrological models to project the future stream flow. To the best of our knowledge, such studies have not been conducted in a semi-arid river catchment of Central India that evaluate the future climate change impact on stream flow under CMIP6 shared socio-economic pathways (SSP) scenarios.
We have selected the Upper reach of the Betwa River to simulate the stream flow under the projected climate and LU-LC change scenarios. This catchment has experienced a decrease in the mean monsoon rainfall, an increase in the extreme rainfall events, mean temperature, and LU-LC change [7,20]. The frequency of meteorological dry events has increased after 2000 and is projected to intensify further during 2023–2060 and 2061–2100 [20].
This study evaluates the combined effect of observed and projected climate and land use change on the stream flow of the Upper Betwa River under the past, present, and future climate scenarios. We have used a semi-distributed SWAT hydrological model to simulate the stream flow. We have used time series Landsat satellite images to predict the LU-LC in the catchment using ANN based CA model and the bias-corrected GCMs of CMIP6 to project the stream flow under four different climatic scenarios (SSP126, SSP245, SSP370, and SSP585).

2. Materials and Methods
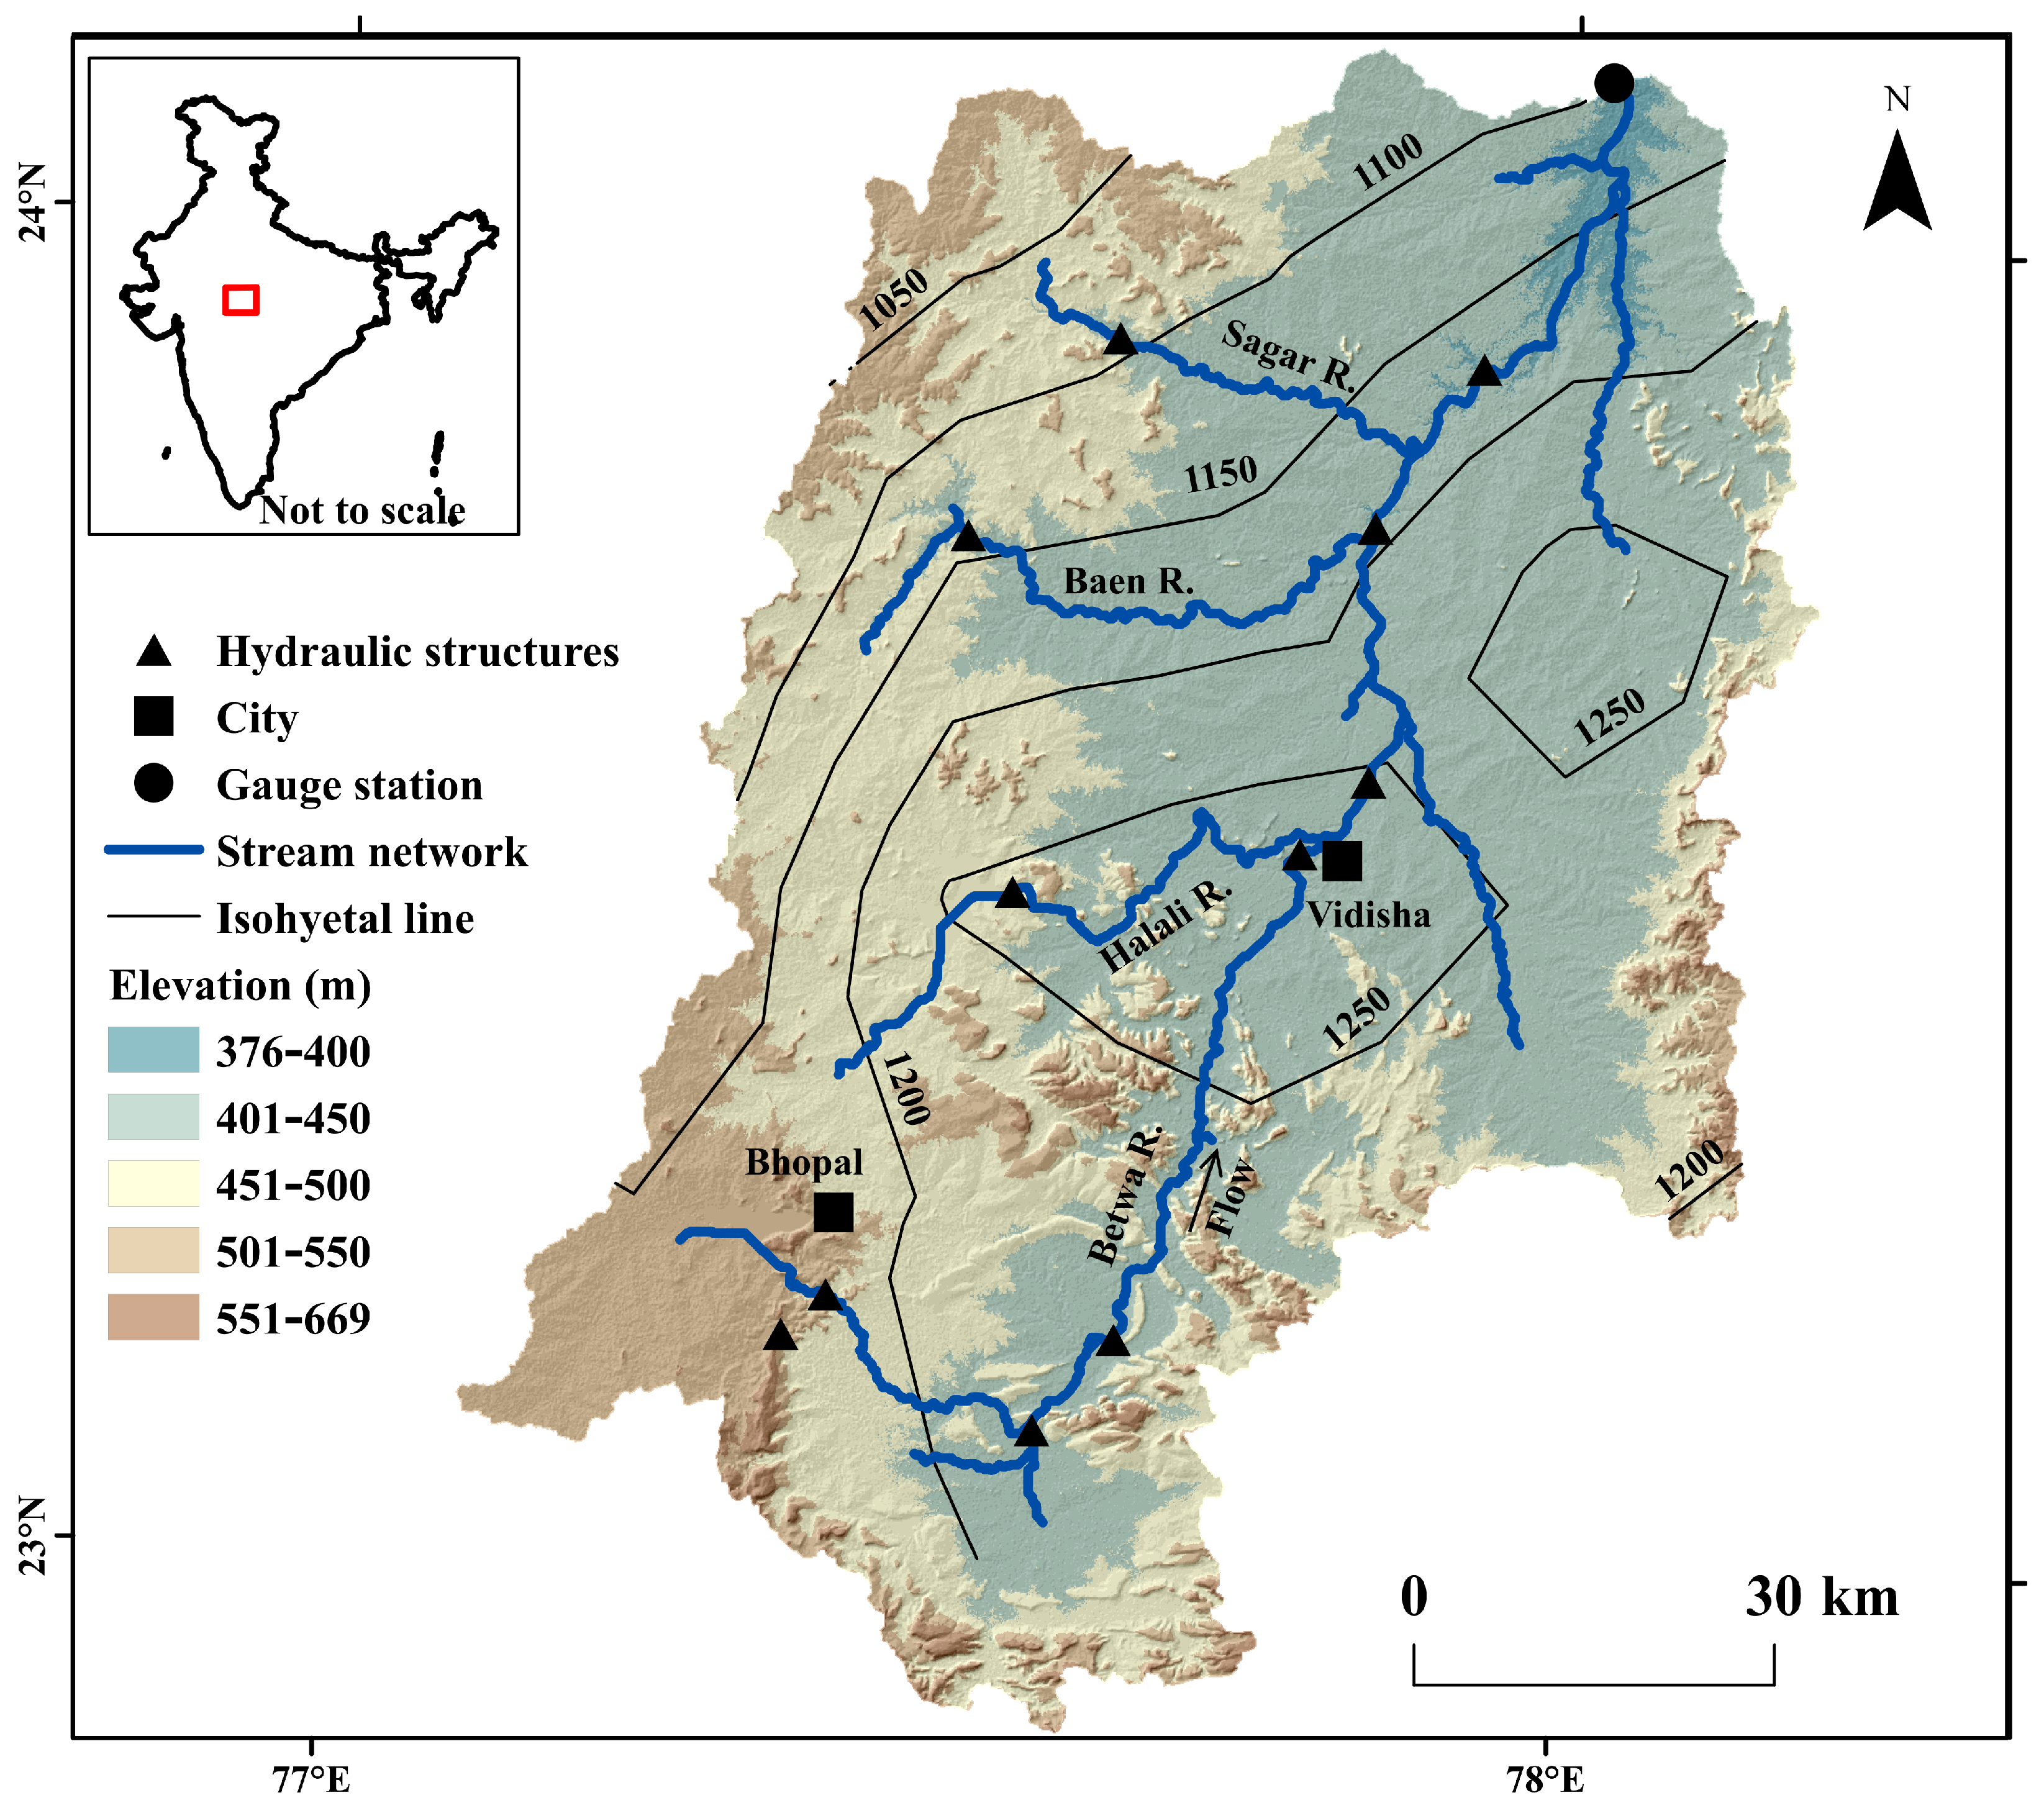
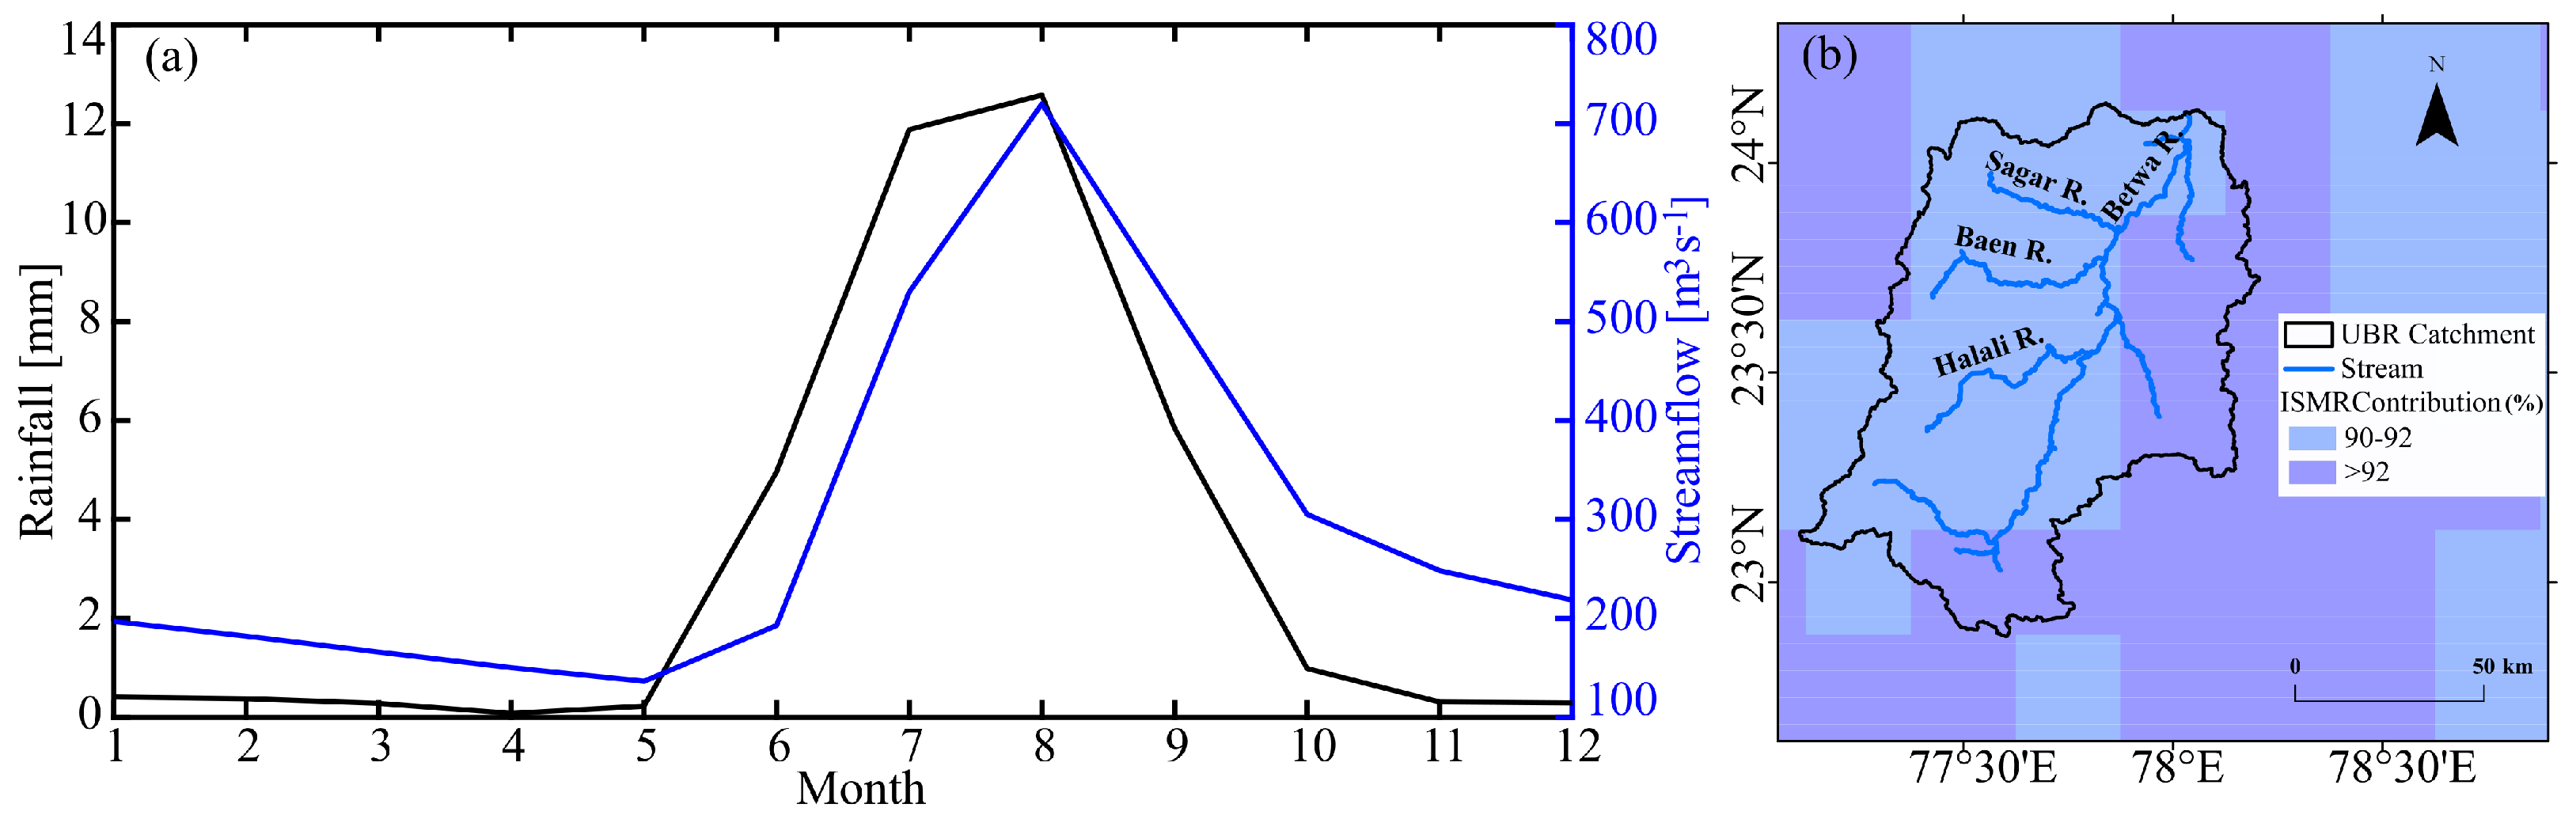
2.1. Study Area

The Betwa River originates from Raisen district of Madhya Pradesh and joins the Yamuna River in Hamirpur district of Uttar Pradesh, India. The upstream of this river is largely intermittent and becomes perennial in the downstream (85 km) before its confluence to the Yamuna River [21]. We have selected the upper reach of the Betwa River to conduct this study. The Upper Betwa flows through a single thread channel having a total length of 127 km and a catchment area of 9322 km 2 . It flows through semi-arid to dry sub-humid climatic regions in Central India [21]. It has a very dynamic temperature and rainfall pattern. The catchment receives maximum temperature (40–45 °C) in the summer season (March to May) and minimum temperature up to 2 °C in the winter (November to February). During the monsoon (June to September), the catchment receives about 92% of its total rainfall. The topography of the catchment varies from 376–669 m above mean sea level (Figure 1). The elevation is relatively high in the western part (451–669 m) of the catchment as compared to the eastern part (376–550 m).

2.2. Datasets

2.2.1. Hydrometeorological

We used five different climatic parameters (i.e., minimum-maximum temperature, rainfall, wind speed, solar radiation, and relative humidity) and flow discharge measured at the Gauge (Kurwai) station. We obtained the daily measurement of temperature, rainfall in gridded format from the Indian Meteorological Department (IMD) [22,23] and hourly reanalysed datasets of wind speed, solar radiation, and relative humidity from ERA5 [24] for the years between 1980–2020. Except temperature ( 1 × 1 ), these measurements are available at a grid resolution 0 . 25 × 0 . 25 . We downloaded the future CMIP6 GCMs (IPSL-CM6A-LR, NorESM2-MM, and MIROC 6) products (i.e.,; minimum-maximum temperature and rainfall) for the years between 1980–2100 [25,26,27,28].
We obtained the daily streamflow measurement of the Upper Betwa River (1991–2014) recorded at Kurwai gauging site from the Water Resource Department, Bhopal. Table 1 shows the detailed descriptions of the hydro-climatic datasets.

2.2.2. Satellite

We have used cloud-free Landsat-5 and Landsat-8 satellite images for the years 1990, 2000, 2010, 2018, and 2020 of the pre-monsoon (Jan–Mar) months (Table 2). To eliminate the effect of seasonality, we have taken the median of green, red, and near-infrared (NIR) bands. We have downloaded the topographic data from Advanced Spaceborne Thermal Emission and Reflection Radiometer (ASTER) at 30 m spatial resolution (https://search.earthdata.nasa.gov/search/ accessed on 22 March 2022). We have obtained the soil map of the study area at 1 km spatial resolution from FAO (http://www.waterbase.org/; accessed on 13 October 2021).

2.3. Processing

2.3.1. Climate Data

We have resampled all the climatic variables to a common grid of 0 . 25 × 0 . 25 except for the IMD rainfall and reanalysis product using bilinear interpolation. Reanalysis products of wind speed, solar radiation, and relative humidity datasets are available at hourly time scales. We convert them at a daily scale by using Climate Data Operator (CDO) platform and prepared the individual file for the input variable for each grid. They will be used as input for the hydrological model. We aggregate the daily rainfall data at each grid point to get the monthly, seasonal, and annual values of the study area. We have then identified the outliers (rare events) in the long-term accumulated and mean monsoon (JJAS) rainfall data using Iglewicz and Hoaglin’s test [29]. It recognizes the potential outlier in the time series based on a modified Z score (absolute value of z score greater equal 3.5) [30]. We observed the year 2019 as an outlier in the time series (1980–2020). We eliminated this year from the trend analysis. Finally, we applied a non-parametric test (Sen’s slope and Mann–Kendall) to identify the magnitude and significance of the trend in the dataset at 95% confidence interval [31,32,33].
To identify the hydrological and meteorological wet, dry, and normal year in the Upper Betwa River, we have computed the Standardised Precipitation Index (SPI) and Streamflow Drought Index (SDI) using monsoon rainfall and simulated streamflow. In doing so, we fitted the gamma distribution to the rainfall and streamflow, and later it is standardized to identify the various degrees of drought severity [34,35,36,37]. Based on the values of SPI and SDI, rainfall and streamflow can be categorized as wet (1 to 2), dry (−1 to −2), and normal (−0.99 to 0.99) years.
Our aim is to analyse the impact of future projected climate change on the mean monsoon streamflow of the Betwa River under different emission scenarios. In doing so, we have used the future temperature (min-max) and rainfall of CMIP6 GCMs, namely IPSL-CM6A-LR, NorESM2-MM, and MIROC6. GCMs are unable to accurately reflect the regional phenomenon due to their coarser-resolution [10]. GCMs are also sensitive to errors associated with scenarios, forcing datasets as well as computational methods and parametrization schemes etc. [20,38,39]. These errors are significantly reduced with bias correction. We applied the cumulative distribution function (CDF) matching by considering the historical observed data as a reference to perform the bias correction of future climate data [20]. Further, we have used a multi-model ensemble of these bias-corrected temperature (min-max) and rainfall datasets of CMIP6 GCMs for the future projection of mean monsoon streamflow. We have considered high, moderate, and low emission scenarios of CMIP6 SSPs such as SSP585, SSP370, SSP245, and SSP126.

2.3.2. LU-LC Classification

We created the false-color composite using the red, green, and near-infrared bands of Landsat 5 and 8 satellite images of the years 1990, 2000, 2010, and 2020. We used random forest algorithm to classify the image pixels into various LU-LC classes (urban land, cropland, forest, water, and open land). We have generated the training samples by identifying the LU-LC classes from high-resolution Google Earth images. We split the training samples into two subsets; 70% to train the classifier and the remaining (30%) samples for testing purposes. Table 3, reports Kappa statistics and the overall accuracy of the image classification.

2.4. LU-LC Change Modeling

We used the ANN based CA method to predict the future LU-LC in the study area [40]. We setup the ANN model to perform the transition potential modeling using the various independent driving factors and dependent LU-LC maps of two different periods as an input [41]. The driving factors consist of elevation, slope, and distance from road and river. We used LU-LC of 2000 and 2010 during the transition potential modeling. We customized the hyper-parameters of the multi-layer perceptron ANN as 3 × 3 neighborhood pixels, four hidden layers, small learning, and momentum rate. During the transition potential modeling, we noticed the current validation kappa is 0.87. Further, to predict the LU-LC of 2020, the learning capability gained during the transition potential modeling is transferred to CA. We validated the predicted LU-LC using the observed LU-LC of 2020. We used metrics such as % of correctness, kappa histo, and kappa location to assess prediction performance. The kappa histo and kappa location are sensitive to the respective differences in location and in the histogram shape of each LU-LC class of the two compared map [42]. We observed that the % of correctness, kappa histo, and kappa location statistics during the simulation were 87.4, 0.9, and 0.7, respectively. Once the model is calibrated, we used the LU-LC of 2010 and 2020 to predict the LU-LC of 2030 and so on by keeping the similar driving factors and the hyper-parameters.

2.5. Hydrological Model Set Up

We have used SWAT; a semi-distributed hydrological model to simulate the streamflow of the upper Betwa River at Kurwai gauging site [20]. The SWAT model parameters exhibit variable sensitivity over simulation years, indicating the need for dynamic updation of the parameter during the simulation due to changes in climatic conditions and hydrological characteristics of the catchment [43]. Therefore, we have created two setups of the SWAT model for the observed time periods, 1980–2000 and 1998–2020, using land use of 1990 and 2018, respectively, in order to simulate streamflow under the combined effect of climate and LU-LC change. The SWAT model requires the physical (elevation, soil, and LU-LC) and climate data (temperature, rainfall, solar radiation, wind speed, and relative humidity) to simulate streamflow at the outlet of a catchment. Initially, the Upper Betwa catchment is divided into sub-catchments based on the topography. These sub-catchments are further divided into smaller hydrological response units (HRU), for hydrological analysis of the entire catchment. The HRUs are created based on the unique combination of soil type, land use, and slope using the 5% threshold of each factor [44]. When the HRU is created, all the processed climate data are provided as input to set up the model. We coupled the appropriate baseline LU-LC with the climate variables for that time period in the simulation. Figure 2 illustrates the detailed methodology of the model setup. The initial two years (1980–1982, 1998–2000) of both simulation periods have been considered as a warm-up period to tune the model. Further, we execute both the model setup to generate the streamflow using the climate and LU-LC variables of the corresponding time periods. The simulated streamflow is then calibrated and validated to produce a realistic streamflow value. We used the in-situ measured streamflow of the Betwa River at Kurwai gauging site for the model calibration and validation using the SWAT Calibration Uncertainty Program (SWAT-CUP). This is done using the Sequential Uncertainty Fitting version 2 (SUFI-2) approach. The details of calibration and validation can be found in Kumar et al. [20]. Eventually, we use this calibrated and validated model to simulate the streamflow of the Betwa River under different LU-LC and climate scenarios. Further, the calibrated 1998–2020 model setup is used to project the future streamflow under changing land use and different climatic scenarios of CMIP6.

3. Results

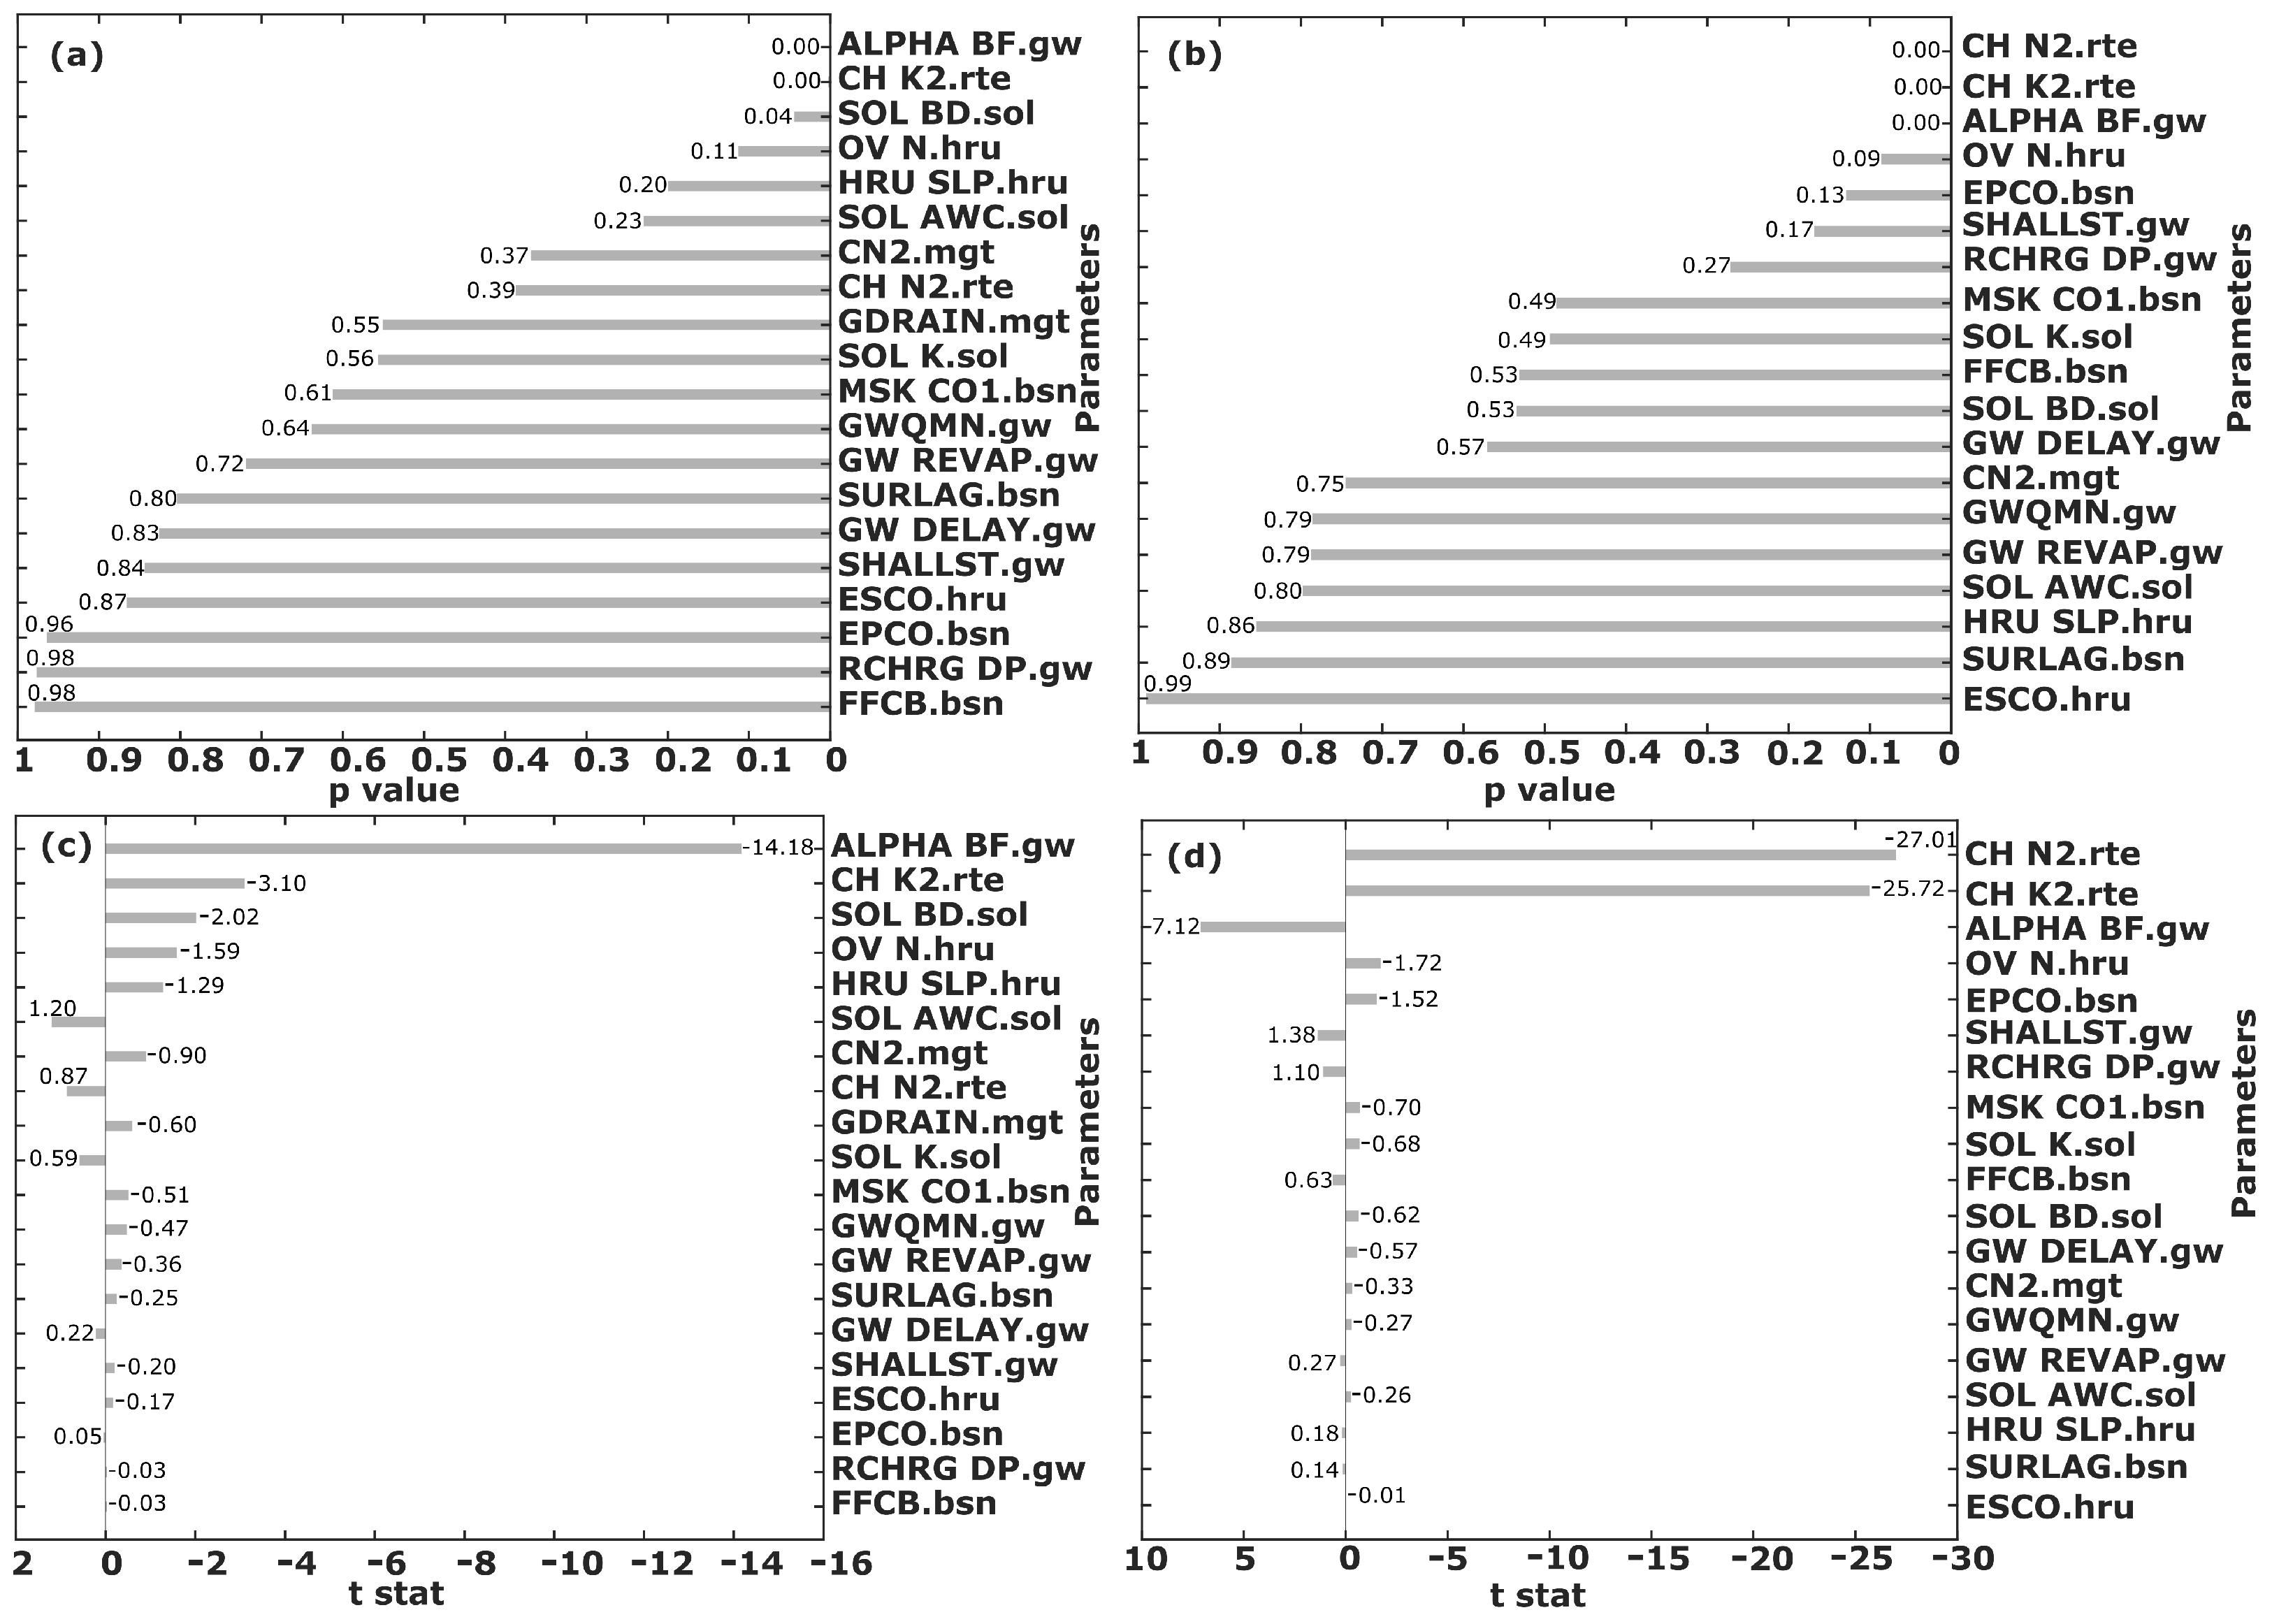
3.1. Sensitivity and Performance Analysis

We applied SUFI-2 method for the calibration, validation, and sensitivity analysis of both the SWAT model setup in SWAT-CUP [20]. Initially, we calibrate the model for the time period 1991–1994 and 2001–2007 using nineteen different sensitive parameters. We then validate the simulations for the time period 1995–1998 and 2008–2014, keeping the same sensitive parameters. The model output is susceptible to these parameters. We optimized the parameters till the performance of all the model setups was found satisfactory. During calibration, we performed global sensitivity analysis and kept the minimum and maximum range of the sensitive parameters similar for both the model setup. In global sensitivity analysis, the t-test is applied to recognize the relative most sensitive parameters. The larger absolute value of t-stat of each parameter in Student’s t distribution and the smaller p-value (less than 0.05) indicate the most sensitive parameters [45]. Figure 3 illustrates that the alpha base flow, hydraulic conductivity of the channel, and soil bulk density are the most sensitive parameters in the model setup for 1980–2000. We observed Manning’s coefficient, hydraulic conductivity, and alpha base flow are the most sensitive parameters in the model setup for 1998–2020.
The performance of model during the calibration and validation is satisfactory. We evaluated the model performance using R 2 , NSE, PBIAS, and RSR. During both calibration periods (1991–1994 and 2001–2007), R 2 , NSE, PBIAS, and RSR were 0.7, 0.69, 21.9, 0.56 and 0.63, 0.63, 5.3, 0.61 respectively. Further, during both validation periods (1995–1998 and 2008–2014), R 2 , NSE, PBIAS, and RSR were 0.67, 0.66, 13.6, 0.59 and 0.74, 0.73, 20.1, 0.52 respectively.

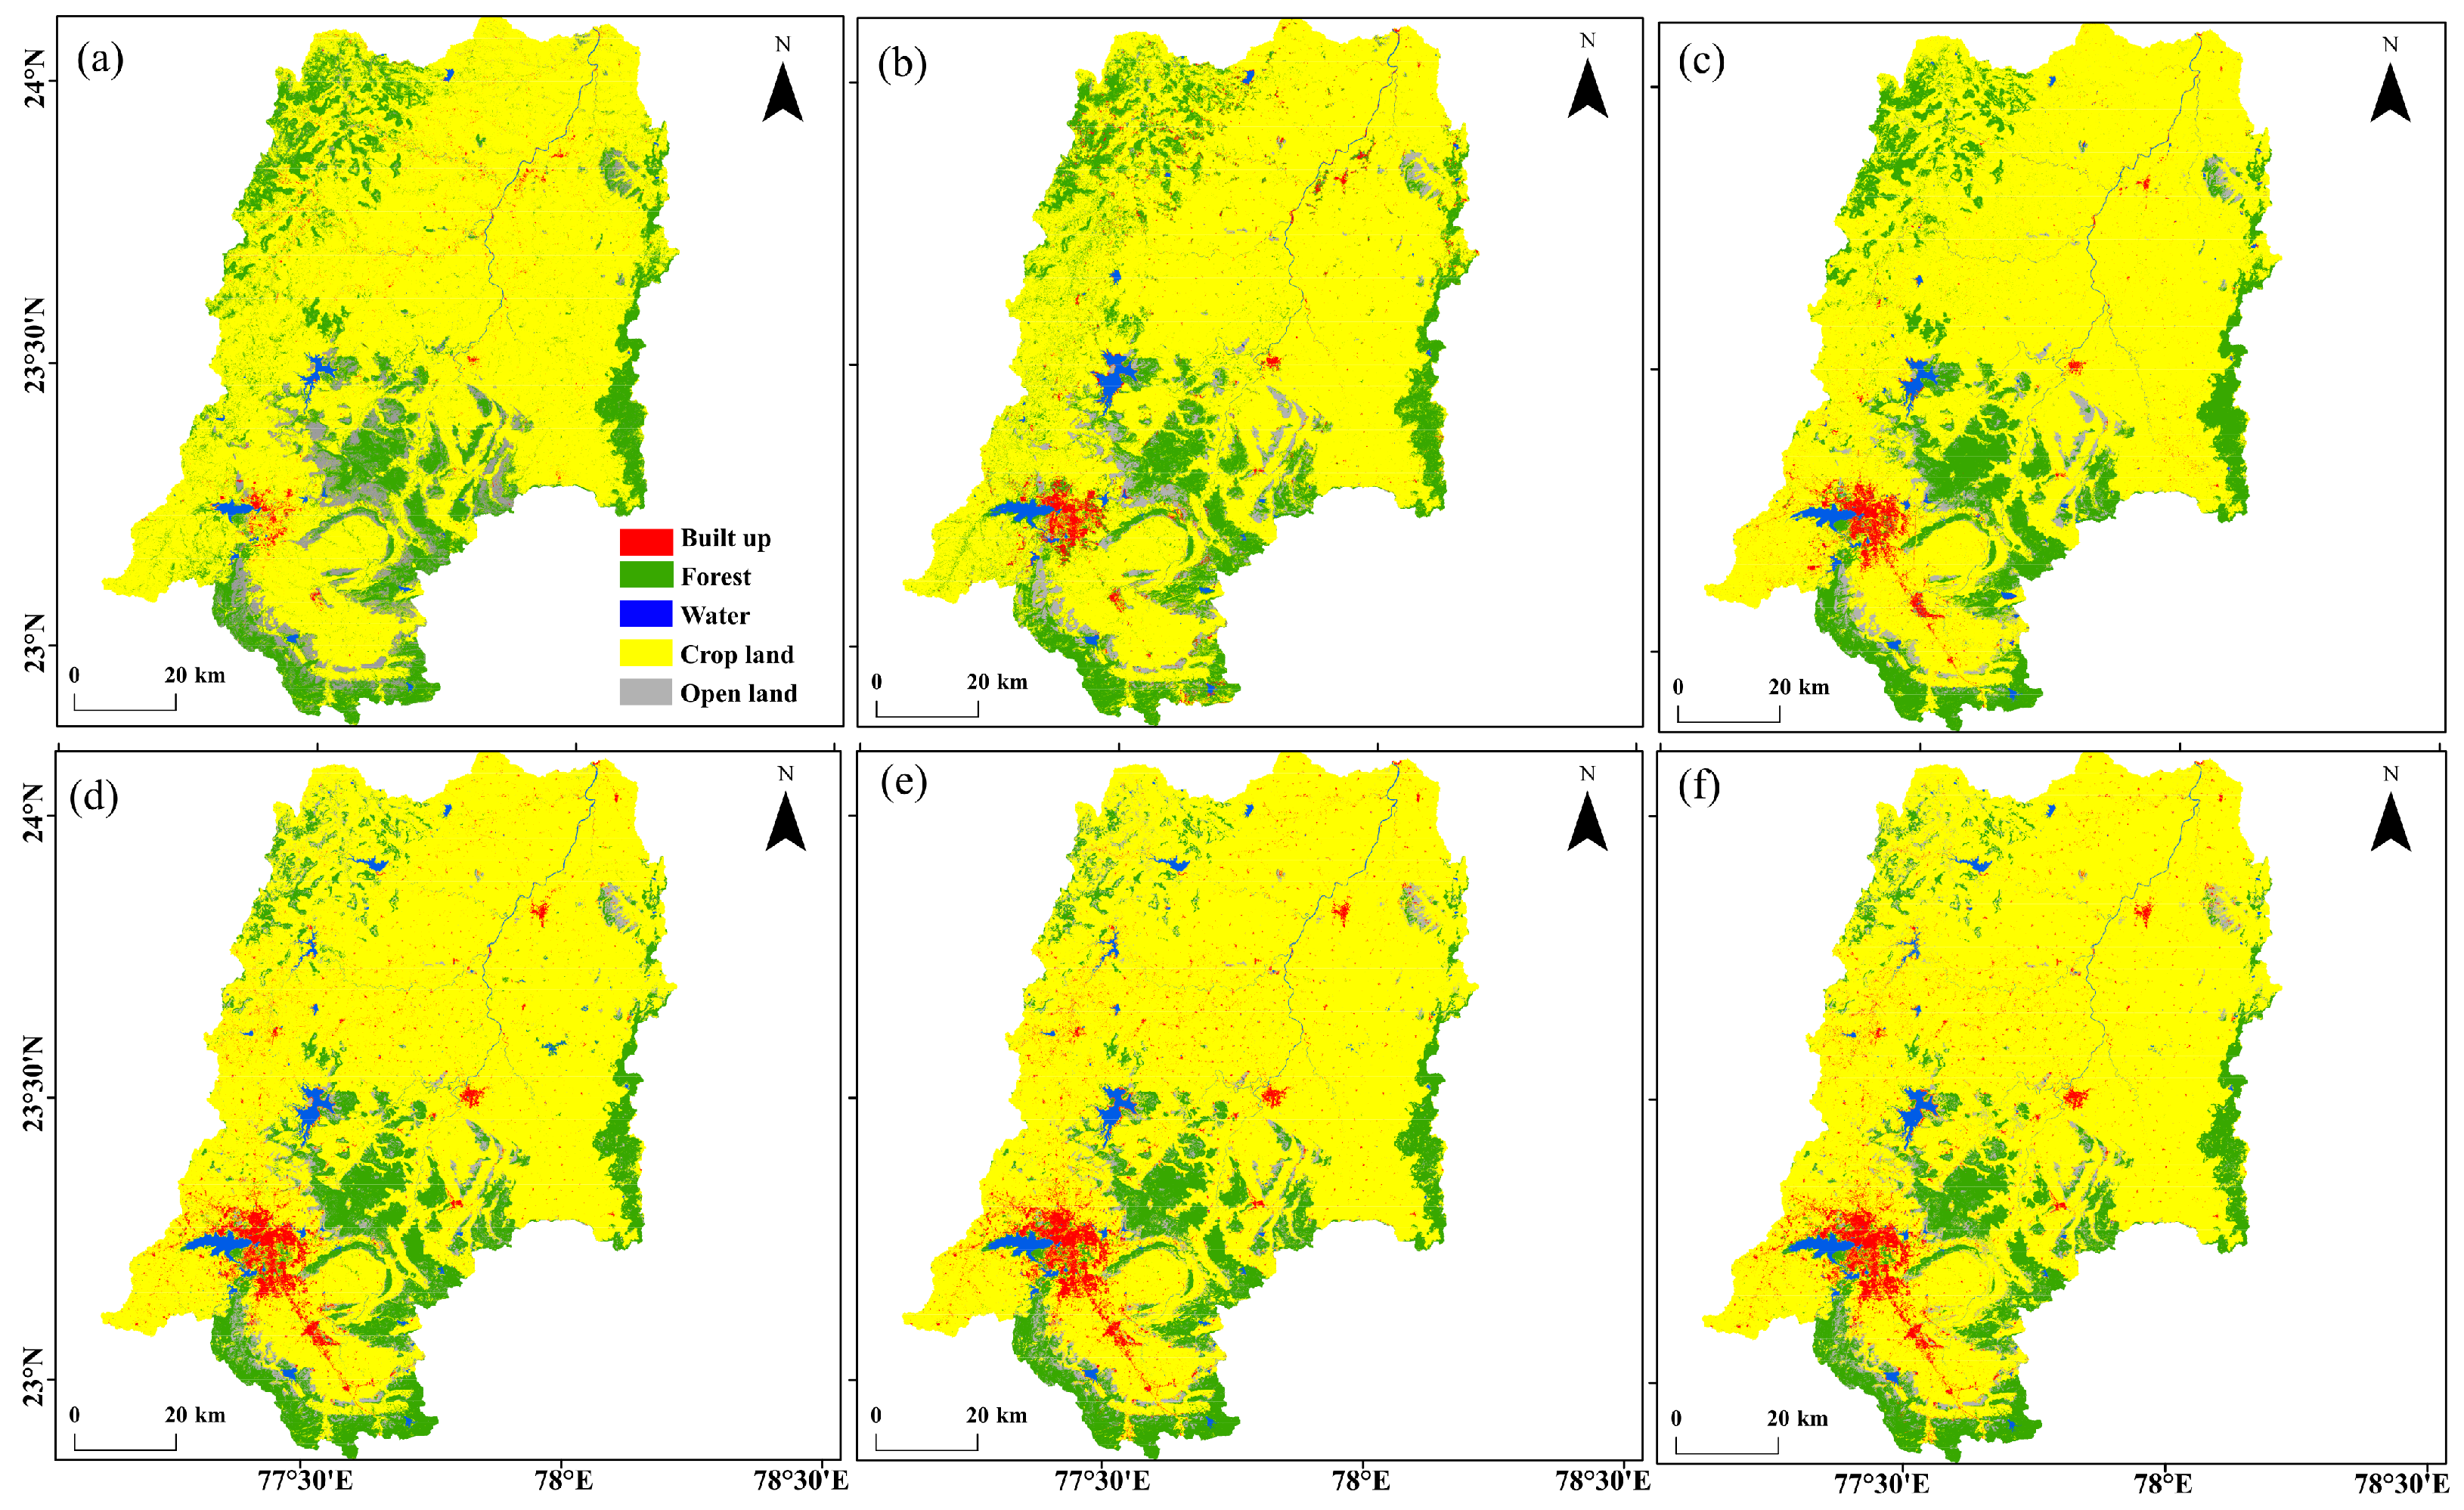
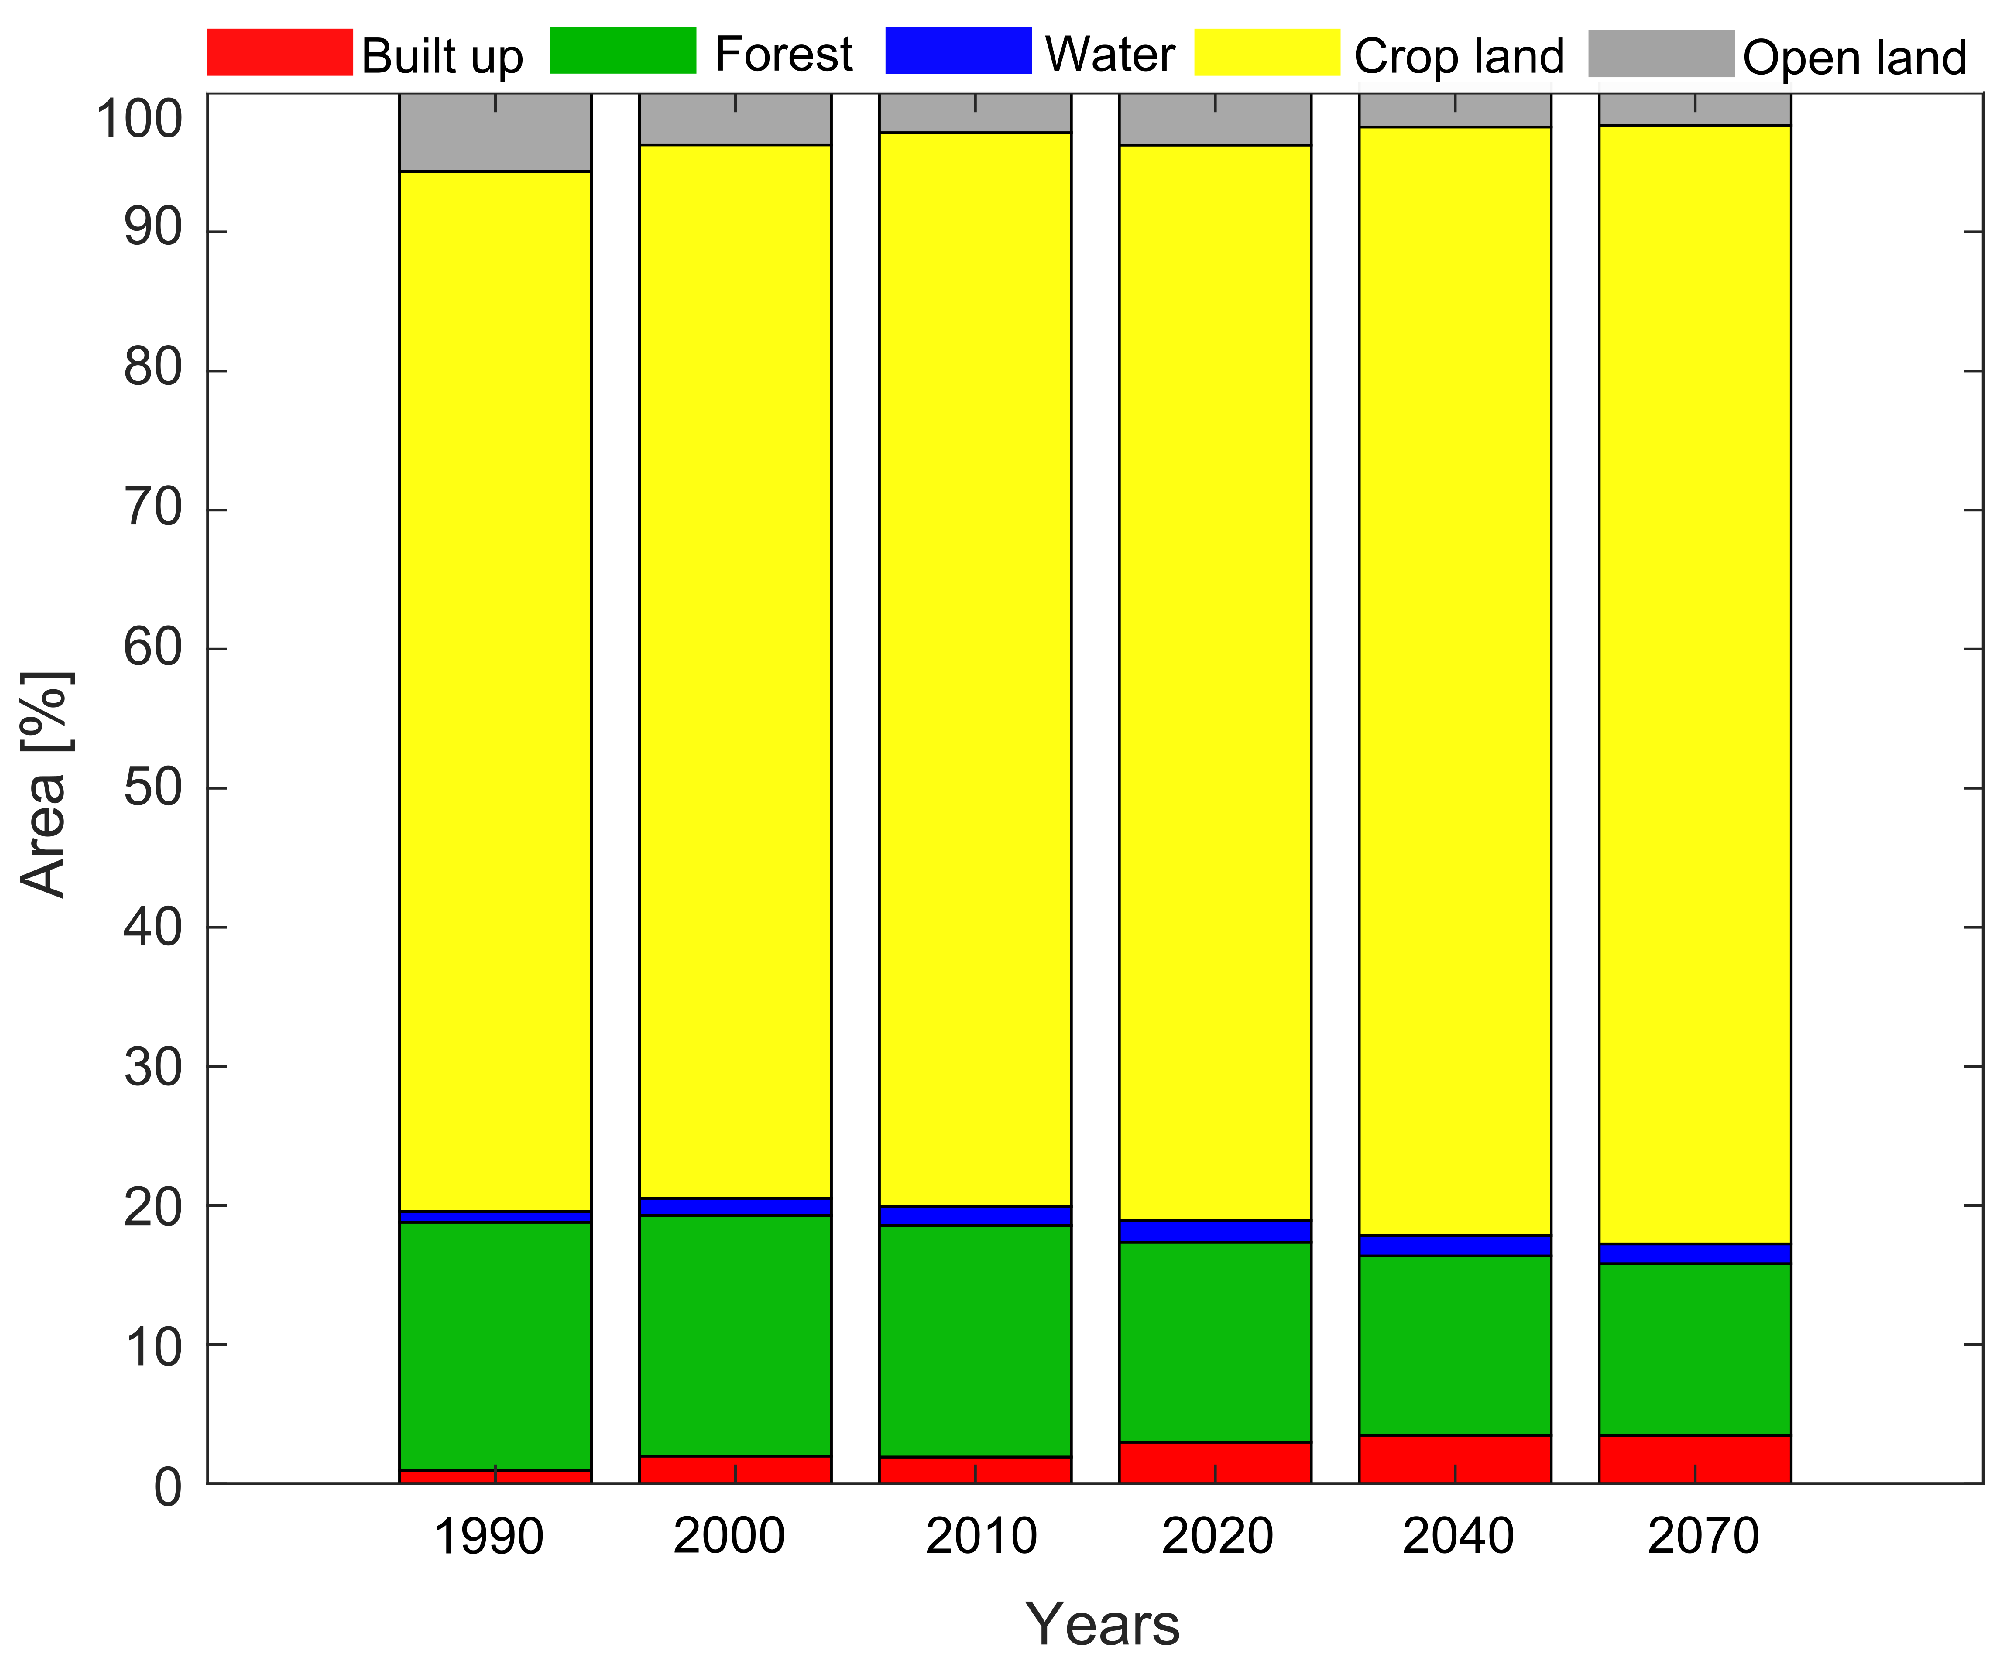
3.2. Observed and Projected LULC

Figure 4 depicts the LU-LC map of the study area from 1990–2070. During this period, agricultural land (76%) predominates in the UBRC, followed by forest (14%), urban (3%), open land (4%), and water body (2%). Figure 5 shows that from 1990–2020, the total area under agricultural land, built-up, and water bodies has increased by 3%, 2%, and 1%, respectively, in the catchment. However, at the same time, forest and open land have diminished by 4% and 2%. The change in LU-LC in the catchment is the result of different drivers, such as an increase in gross domestic product, population growth, rainfall, and temperature change in land use space, as well as interactions with socio-economic factors. Specifically, increase in agricultural land and urban area could be related to the rapid increase of population in the region. As per census data of India, the population in the catchment has increased by 60% from 1991 to 2011 (https://censusindia.gov.in/census.website/; accessed on 8 September 2021). In addition, increase in the area of water bodies can be attributed to the construction of dam in the catchment during 2011–2013.
We have predicted the future (2040 and 2070) LU-LC of the catchment (Figure 5e,f) using ANN based CA model and evaluated the change in percentage, keeping 1990 as a reference for each landuse class. The simulated LU-LC suggests a similar trend in each landuse class as the observed time period (1990–2020).

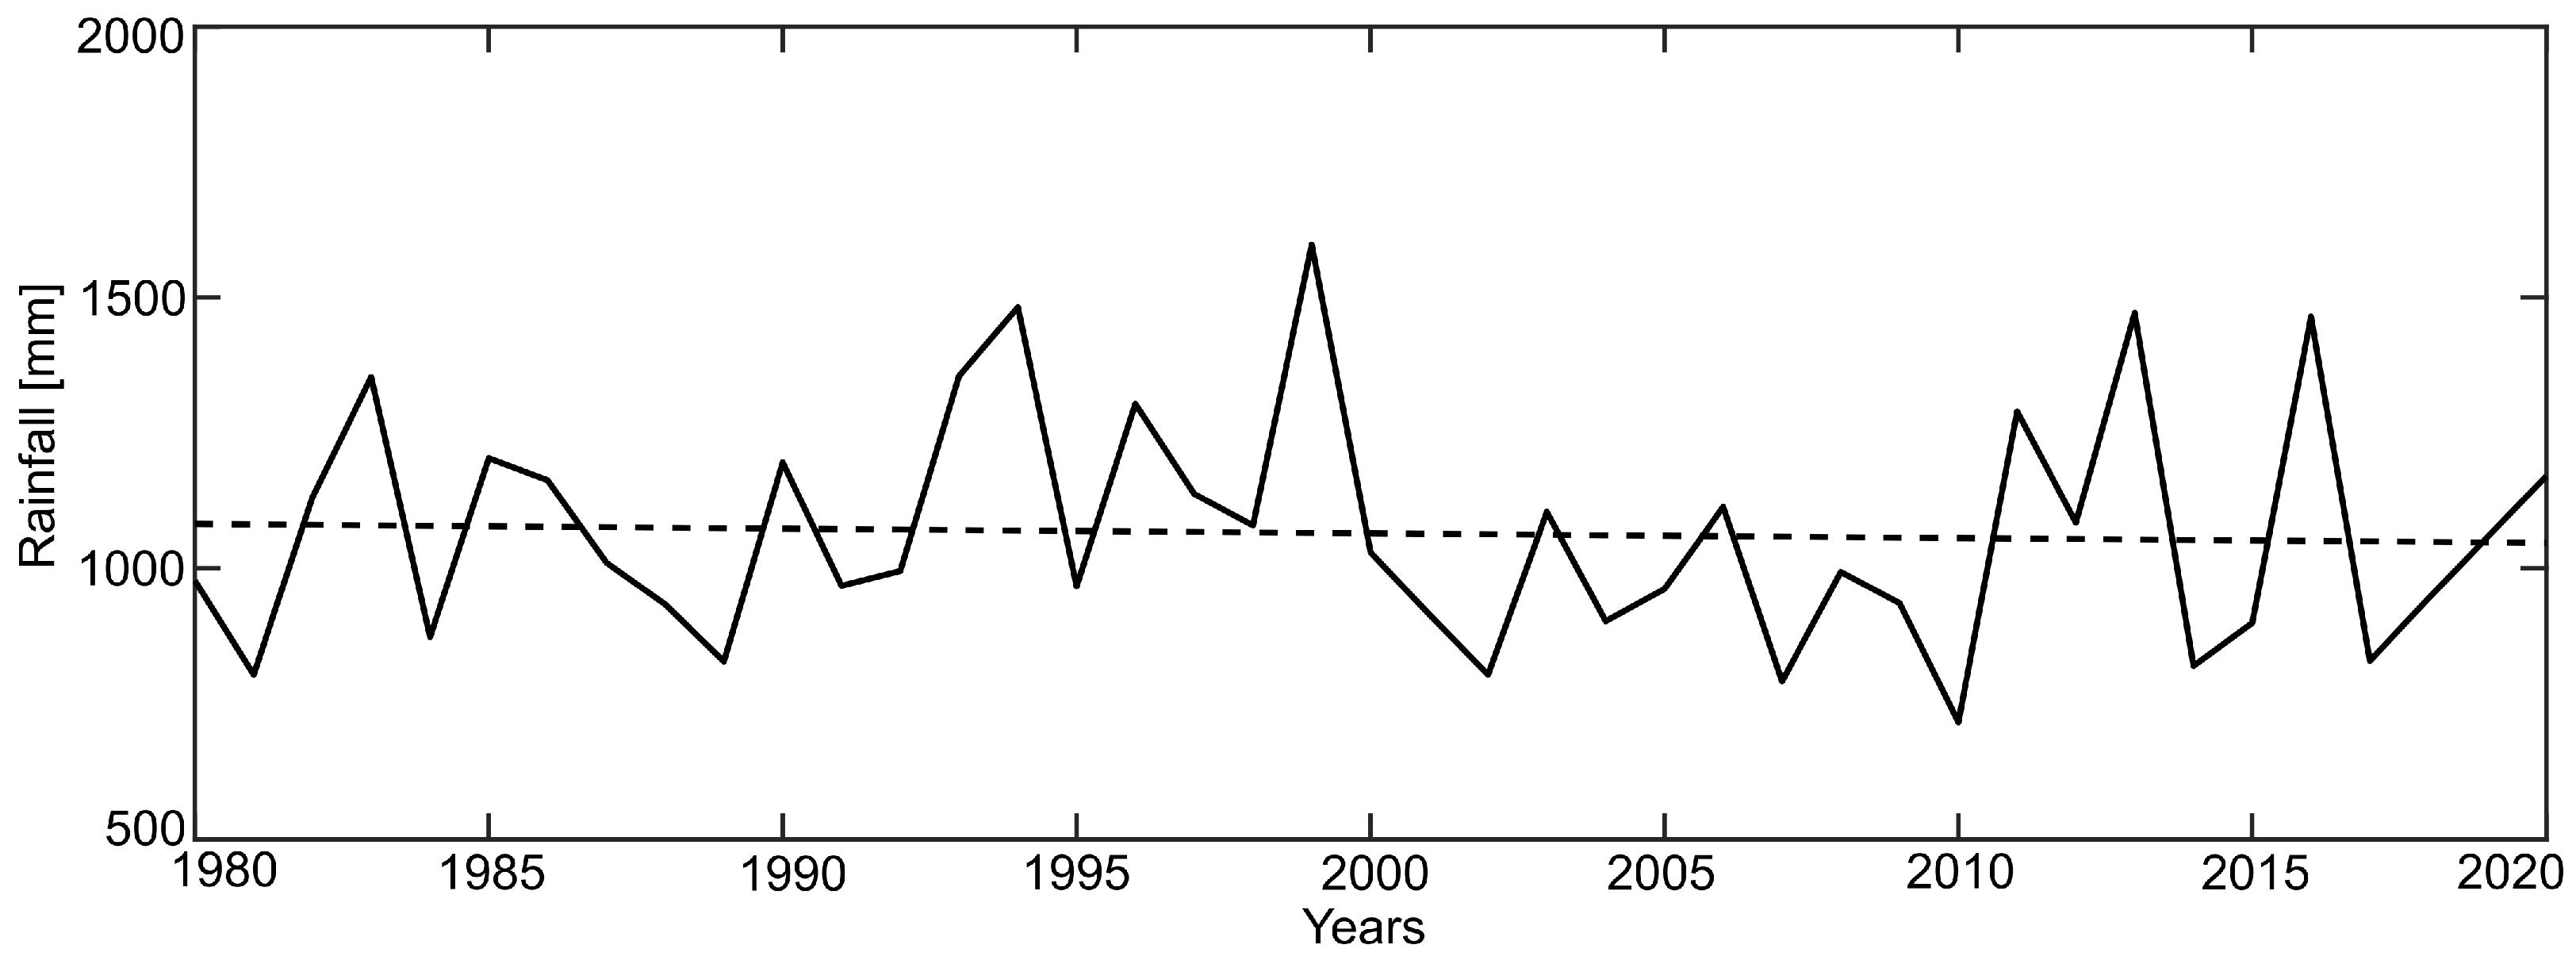
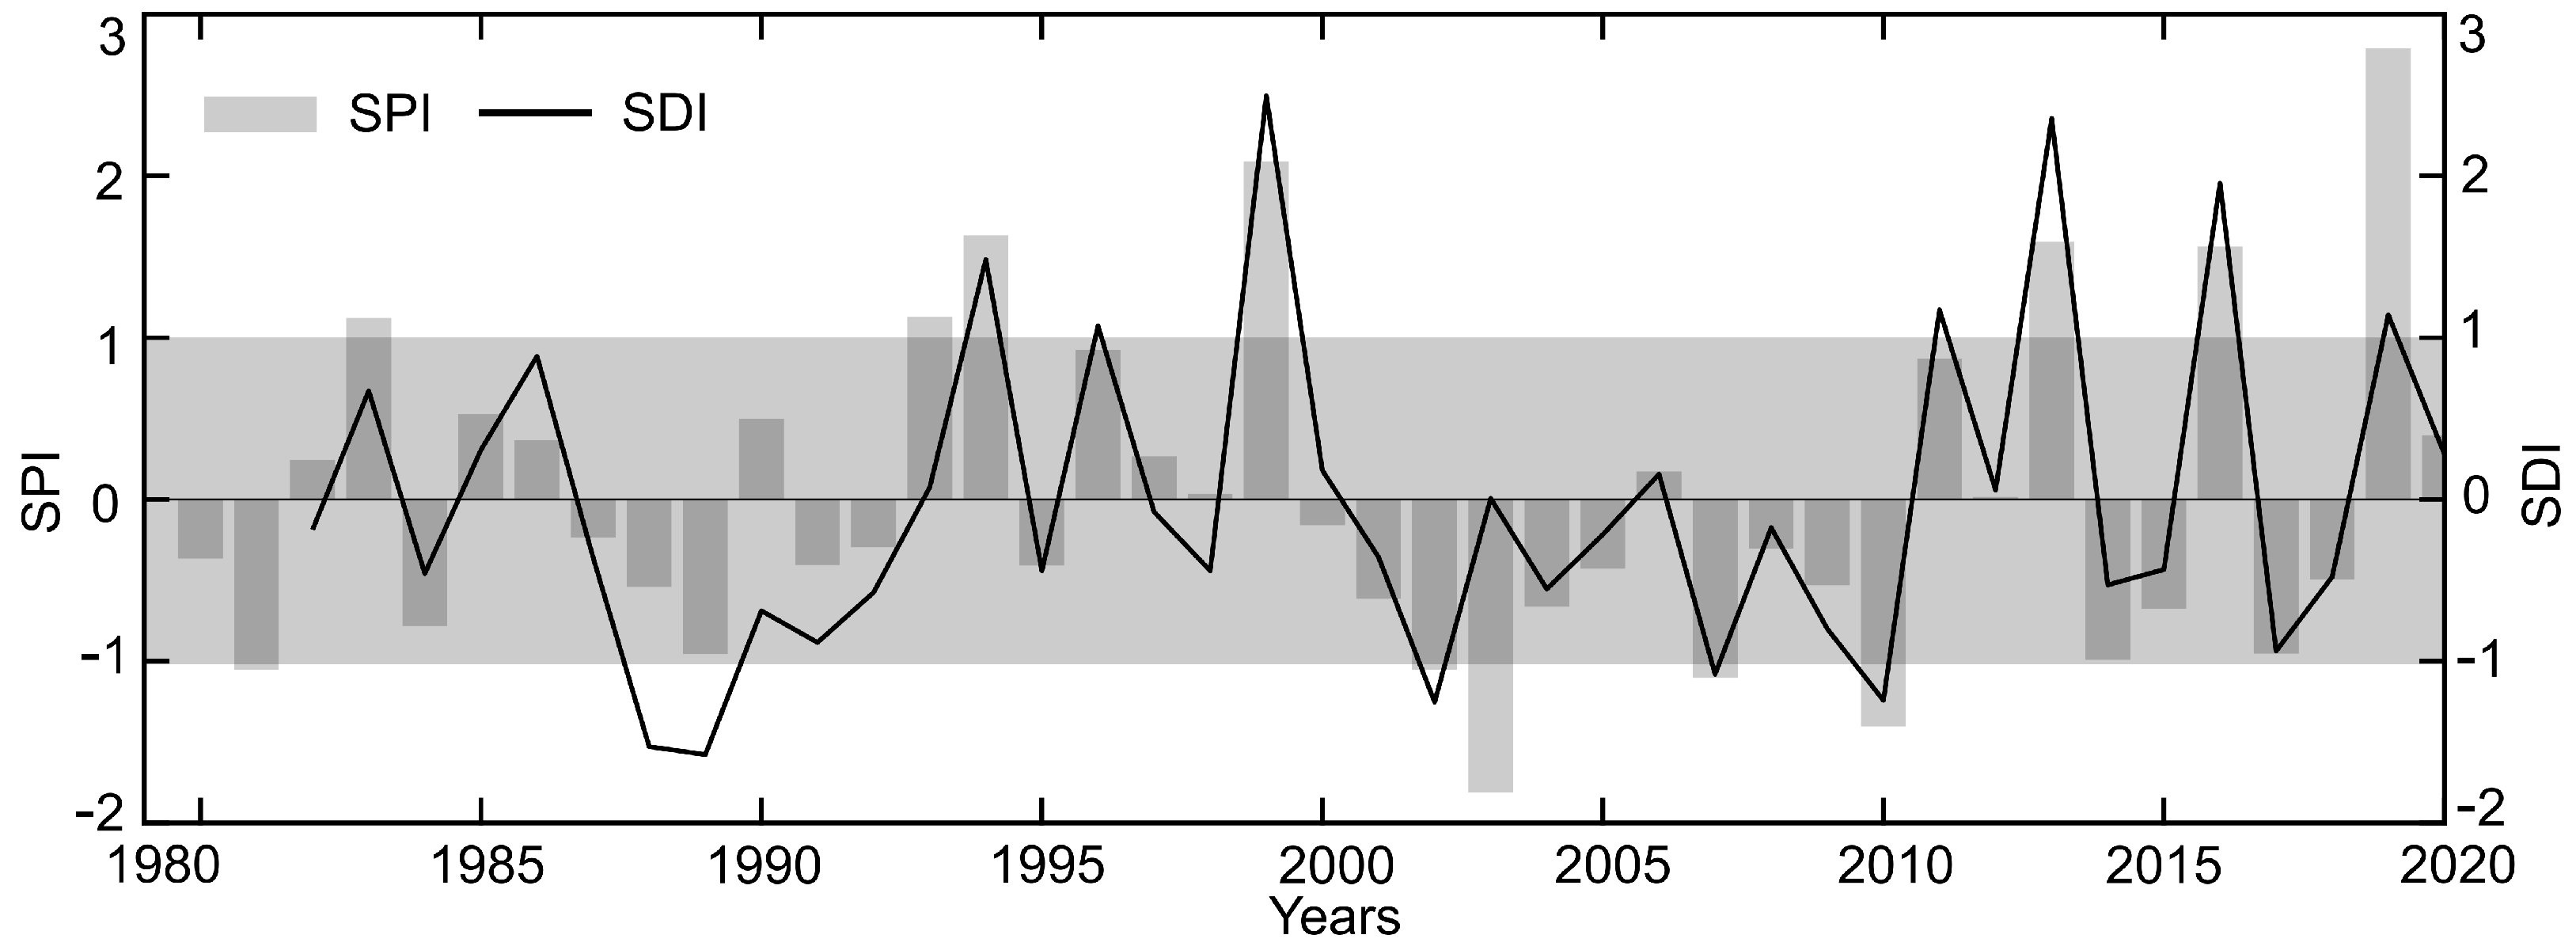
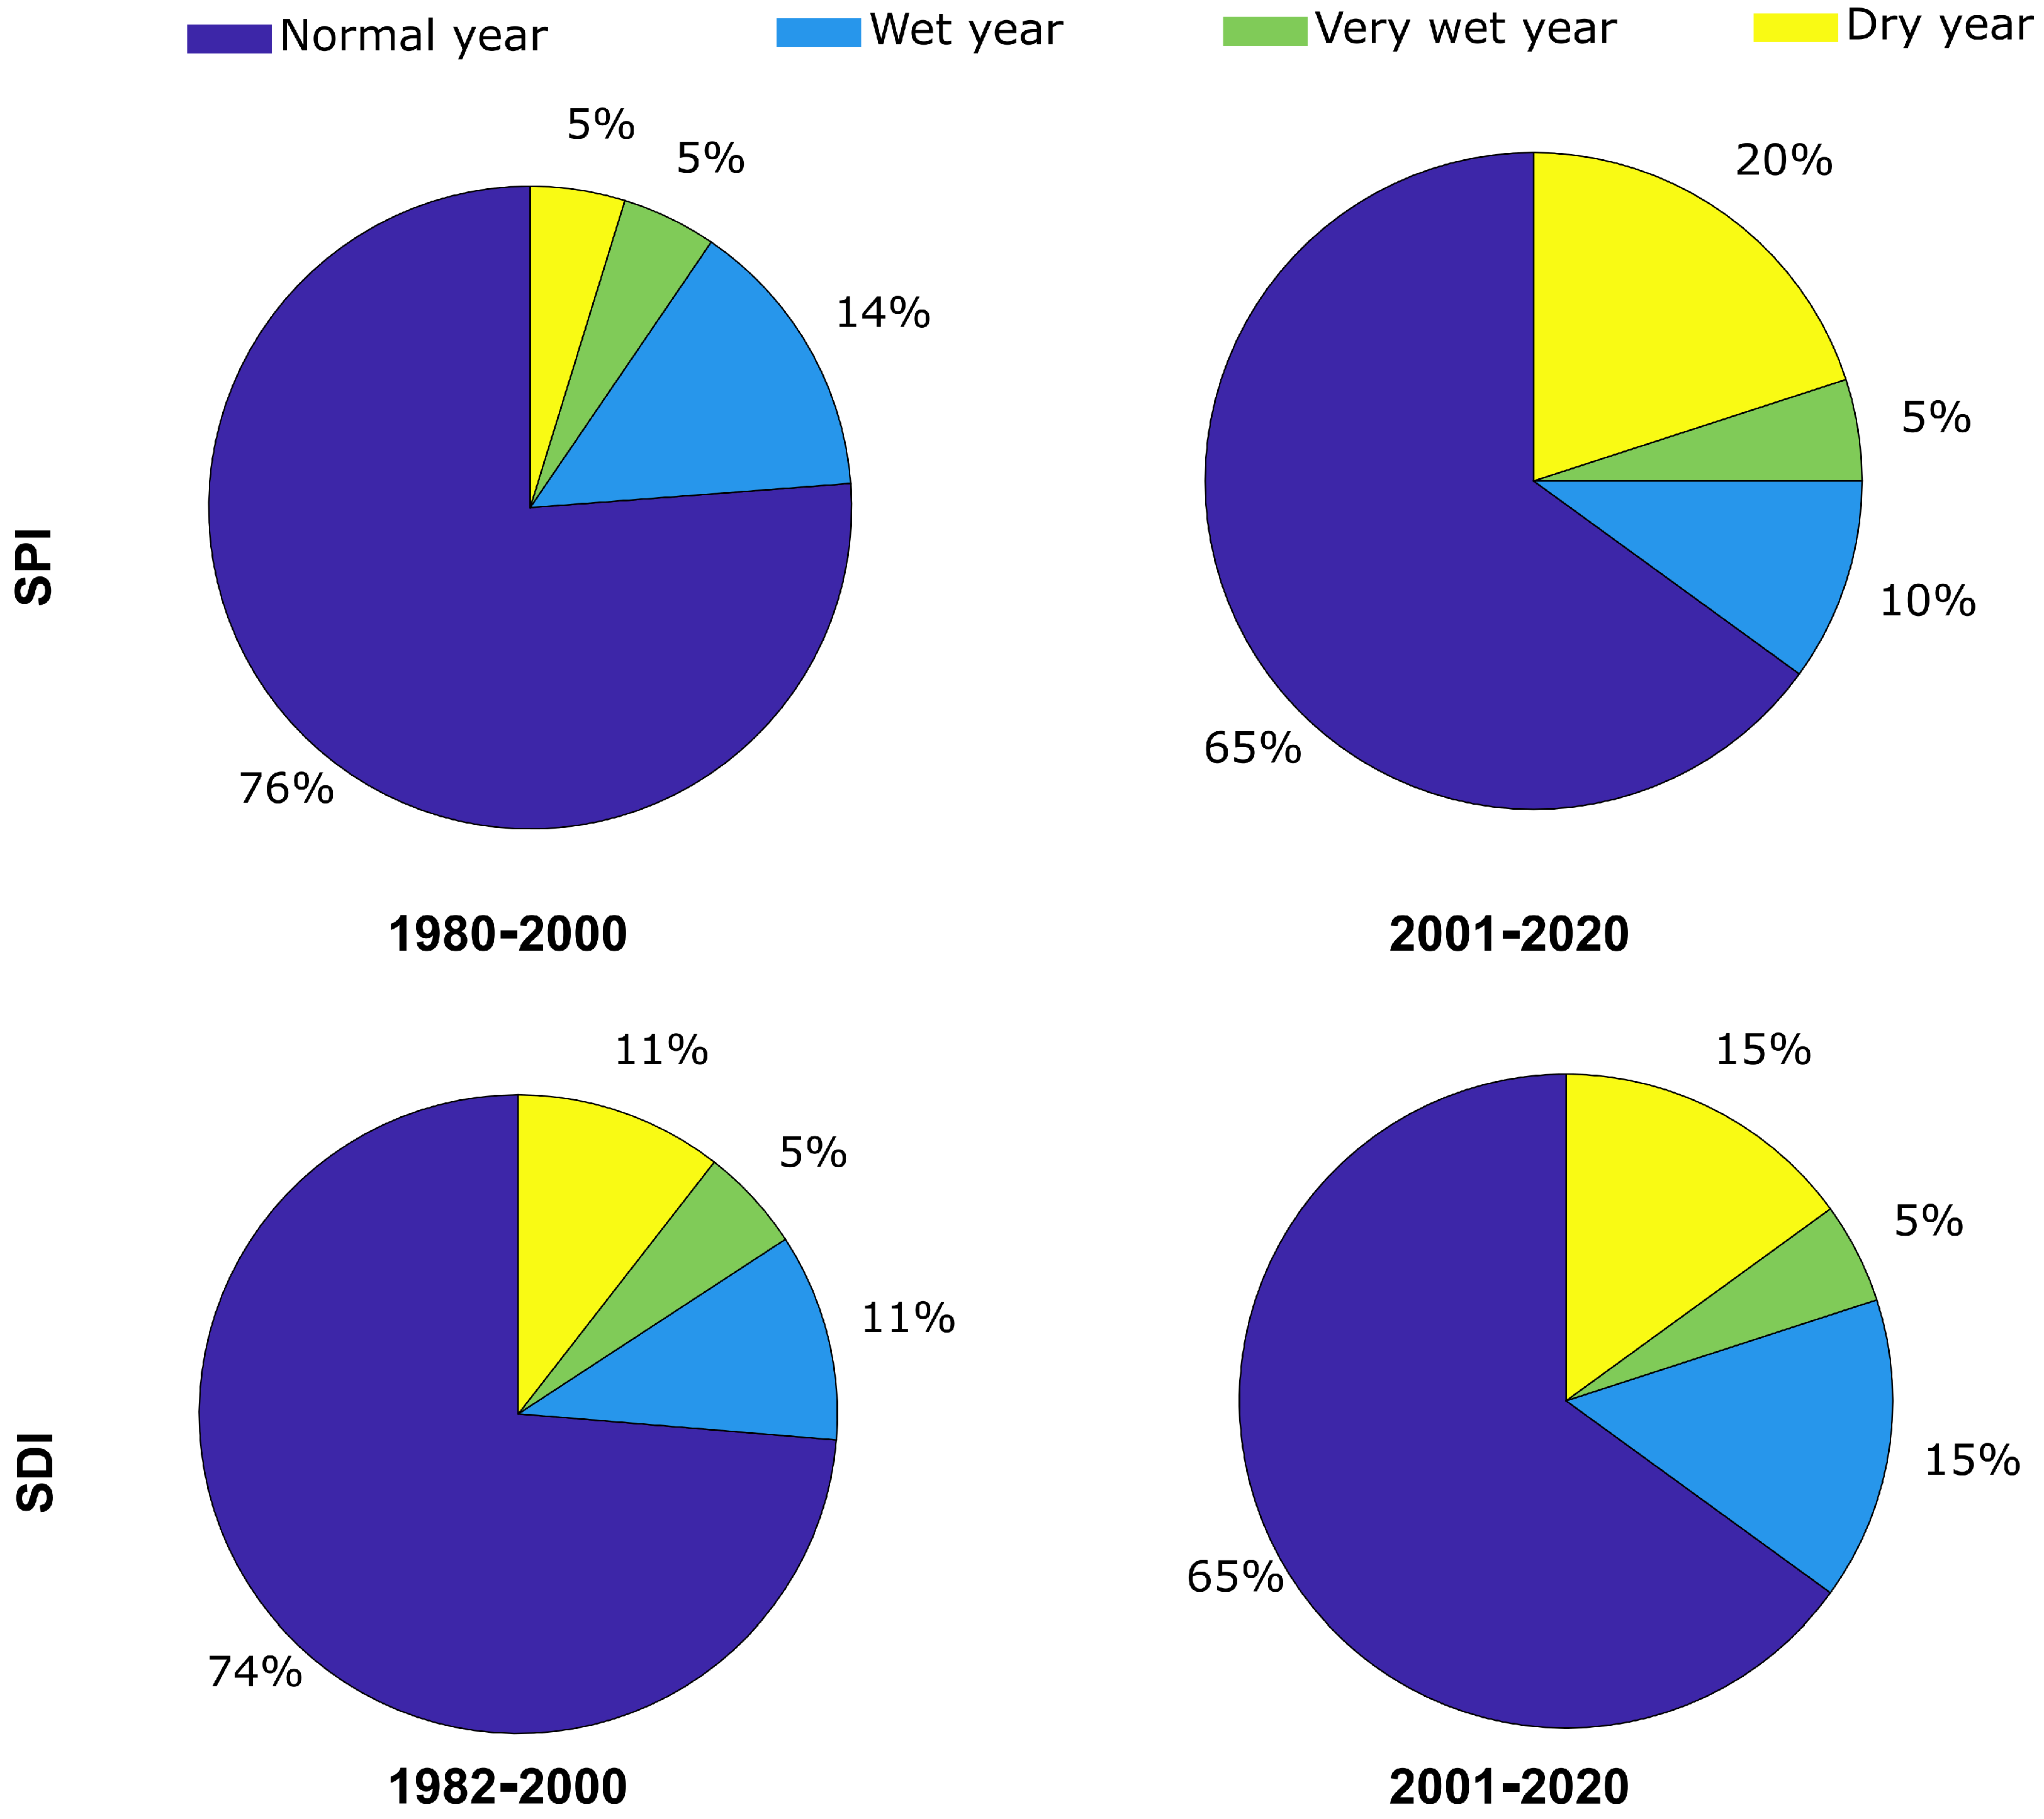
3.3. Hydro-Climatic Variability

The cumulative rainfall during the Indian summer monsoon shows a declining trend of 2 mm from 1980–2020 (Figure 6). We characterize the monsoon rainfall and streamflow of the Betwa River catchment using the SPI and SDI to identify the meteorological and hydrological wet, dry, and normal years [35,36,37]. Figure 7 illustrates the observed SPI and SDI for the time period 1980–2020 and 1982–2020, respectively. We observed that, according to SPI, before 2000, one dry and four wet events occurred. After the year 2000, four dry and three wet events have occurred in the catchment. According to SDI, before 2000, two dry and three wet events occurred, and post-2000, three dry and four wet years have occurred. The correlation between SPI and SDI is 0.87. It is also evident from Figure 7 that the propagation from meteorological to hydrological normal, dry, and wet events exists with some deviation. Based on this, it can be inferred that the contribution of sub-surface flow to the streamflow is limited as, during 1987–1989, the rainfall was below the long-term average rainfall though it was not the meteorological dry year. Whereas 1988 and 1989 were hydrological dry years.
Figure 8 shows that according to SPI from 2001–2020, the dry events have increased by 15% whereas wet and normal events have decreased by 4% and 11% respectively with respect to 1980–2000. At the same time, according to SDI, dry and wet events in the catchment have increased by 4%, whereas normal events have decreased by 9%.

3.4. Streamflow under LU-LC and Climate Change

We assessed the monthly variation of simulated streamflow at the outlet (Kurwai) of the river during the observed time period (1982–2020). Figure 9a illustrates the streamflow hydrograph of UBRC, which indicates that the rising limb begins in June that starts to fall after September. Figure 9b shows the spatial contribution of ISMR in the catchment. We observed that the entire UBRC receives more than 90% rainfall during the ISMR. The streamflow of the UBRC is relatively low in pre- and post-monsoon periods. It could be due to the limited contribution of sub-surface flow to the streamflow. Figure 10 illustrates the inter-annual monsoon rainfall and streamflow variability. We found that the low and high flow is largely in accordance with the rainfall.
We observed that the mean streamflow has decreased by 16% during 2001–2020 compared to 1982–2000. The maximum and minimum streamflow during 1982–2000 is 1079 and 139 m 3 s 1 , which has decreased during 2001–2020 to 673 and 127 m 3 s 1 respectively. During the second simulation (2001–2020), we have only updated the LU-LC and climatic variables, by keeping the reaming parameters (i.e., topography, soil types, and sensitive parameters) unchanged.
Now we use the calibrated SWAT model to simulate the streamflow of the Betwa River during the mid (2023–2060) and far (2061–2100) future time periods using the multi-model ensemble of CMIP6 GCM’s rainfall and temperature. We have considered the predicted baseline LU-LC of 2040 and 2070 in the simulation. We assumed that the other parameters (i.e., soil parameters, slope, and elevation) are not likely to change in the catchment during the simulation periods. The simulation result suggests that the mean monsoon streamflow is likely to decrease in all four future climate scenarios. It is projected to decrease by about 39–47% (2023–2060) and 31–41% (2061–2100) in the catchment with respect to the streamflow values observed during 1982–2020. From the same baseline period, the mean monsoon rainfall is expected to decrease by 30–35% during 2023–2060 and 23–30% during 2061–2100 (Figure 11).

4. Discussion

We evaluated the combined effect of climate and LU-LC change on the streamflow of the Upper Betwa River. We initially analysed the long-term climate of the catchment. It suggests that the catchment has experienced more dry events than wet during 2001–2020 (Figure 12). It could be due to the increase in mean temperature (0.01 °C) and decrease in rainfall (2 mm) in the catchment during 1980–2020. Figure 12 shows the accumulated rainfall in the monsoon season from 1980–2020 with the respective dry and wet events based on rainfall variability. We observed that before the year 2000, the driest (SPI = −1.2) year was 1981, and the wettest (SPI = 1.9) year was 1999. After 2000, the driest (SPI = −1.8) year was 2003, and wettest in 2019 (SPI = 2.7). This observation is in accordance with the monsoon rainfall variability in India during this period [46,47,48]. An increase in dry events might be associated with the decrease in rainfall (10–20%) from 1950–2015 and the increase in temperature (0.076 °C per decade) from 1981–2006 in the Central India [6,7,8].
LU-LC maps suggest that agricultural land is the dominant class in the study area in the past thirty years (1990–2020). The prediction of LU-LC shows that the agricultural and urban area is likely to increase in the future time period. Palmate [49], Singh et al. [50] also found a similar trend of LU-LC change in the Betwa River Catchment. The change in LU-LC can adversely alter the regional hydrology of a catchment by modifying the surface runoff, evapotranspiration, and infiltration processes Tan et al. [51].
We setup the SWAT model to simulate the streamflow of the Betwa River catchment under the observed and projected LU-LC and climate change scenario. The annual average flow during 1982–2000 was 312 m 3 s 1 , which has decreased to 281 m 3 s 1 during 2001–2020. We have analysed the seasonal variability of streamflow based on the SPI and SDI categorization. We observed that during the dry years, the mean monsoon streamflow of the Betwa River is 371 m 3 s 1 , and 688 m 3 s 1 during the wet years. To cope with the effects of LU-LC and climate change on streamflow, sustainable water resource management plan is needed.
Under the current and projected circumstances, we expect agricultural water demand to increase in the catchment. Since agriculture in the catchment is primarily rainfed [50] therefore, any deviation in the rainfall will eventually affect the yield of crops. Mall et al. [52] also found that the monsoon rainfall has a high correlation (0.8) with Kharif crop production anomalies. Therefore, Rabi crops in the winter season may be affected due to lower rainfall in this season and minimum surface water availability. Innovative irrigation facilities such as drip and micro irrigation can fulfill the agricultural water demand in dry environments [53]. Groundwater recharge activities such as farm ponds and percolation ponds should increase in the entire Upper Betwa River catchment for proper groundwater supply during non-monsoon periods to support agriculture and livelihood.
Future irrigation and other development projects have not taken into account in this analysis. The simulated hydrology of the Upper Betwa River could potentially alter as a result of these upcoming developments. We have also not changed the soil parameters in future simulations. This may account for the lack of response of soil moisture to climatic changes. In addition, hydrological model simulation is largely influenced by the model structure, model parameters, and input datasets [54]. We have used gridded climate datasets as an input having grid resolution of 0 . 25 for this study as per the availability of the datasets. So, further analysis can be improved by considering the fine resolution climatic datasets.

5. Conclusions

This study is a step towards quantifying the combined effect of LU-LC and climate change on the streamflow of the Betwa River basin under the observed and different future climate change scenarios. The outcome of this study can be used by policymakers for sustainable water resource management, agricultural planning, and other purposes. Based on the finding of this study following conclusions can be drawn;
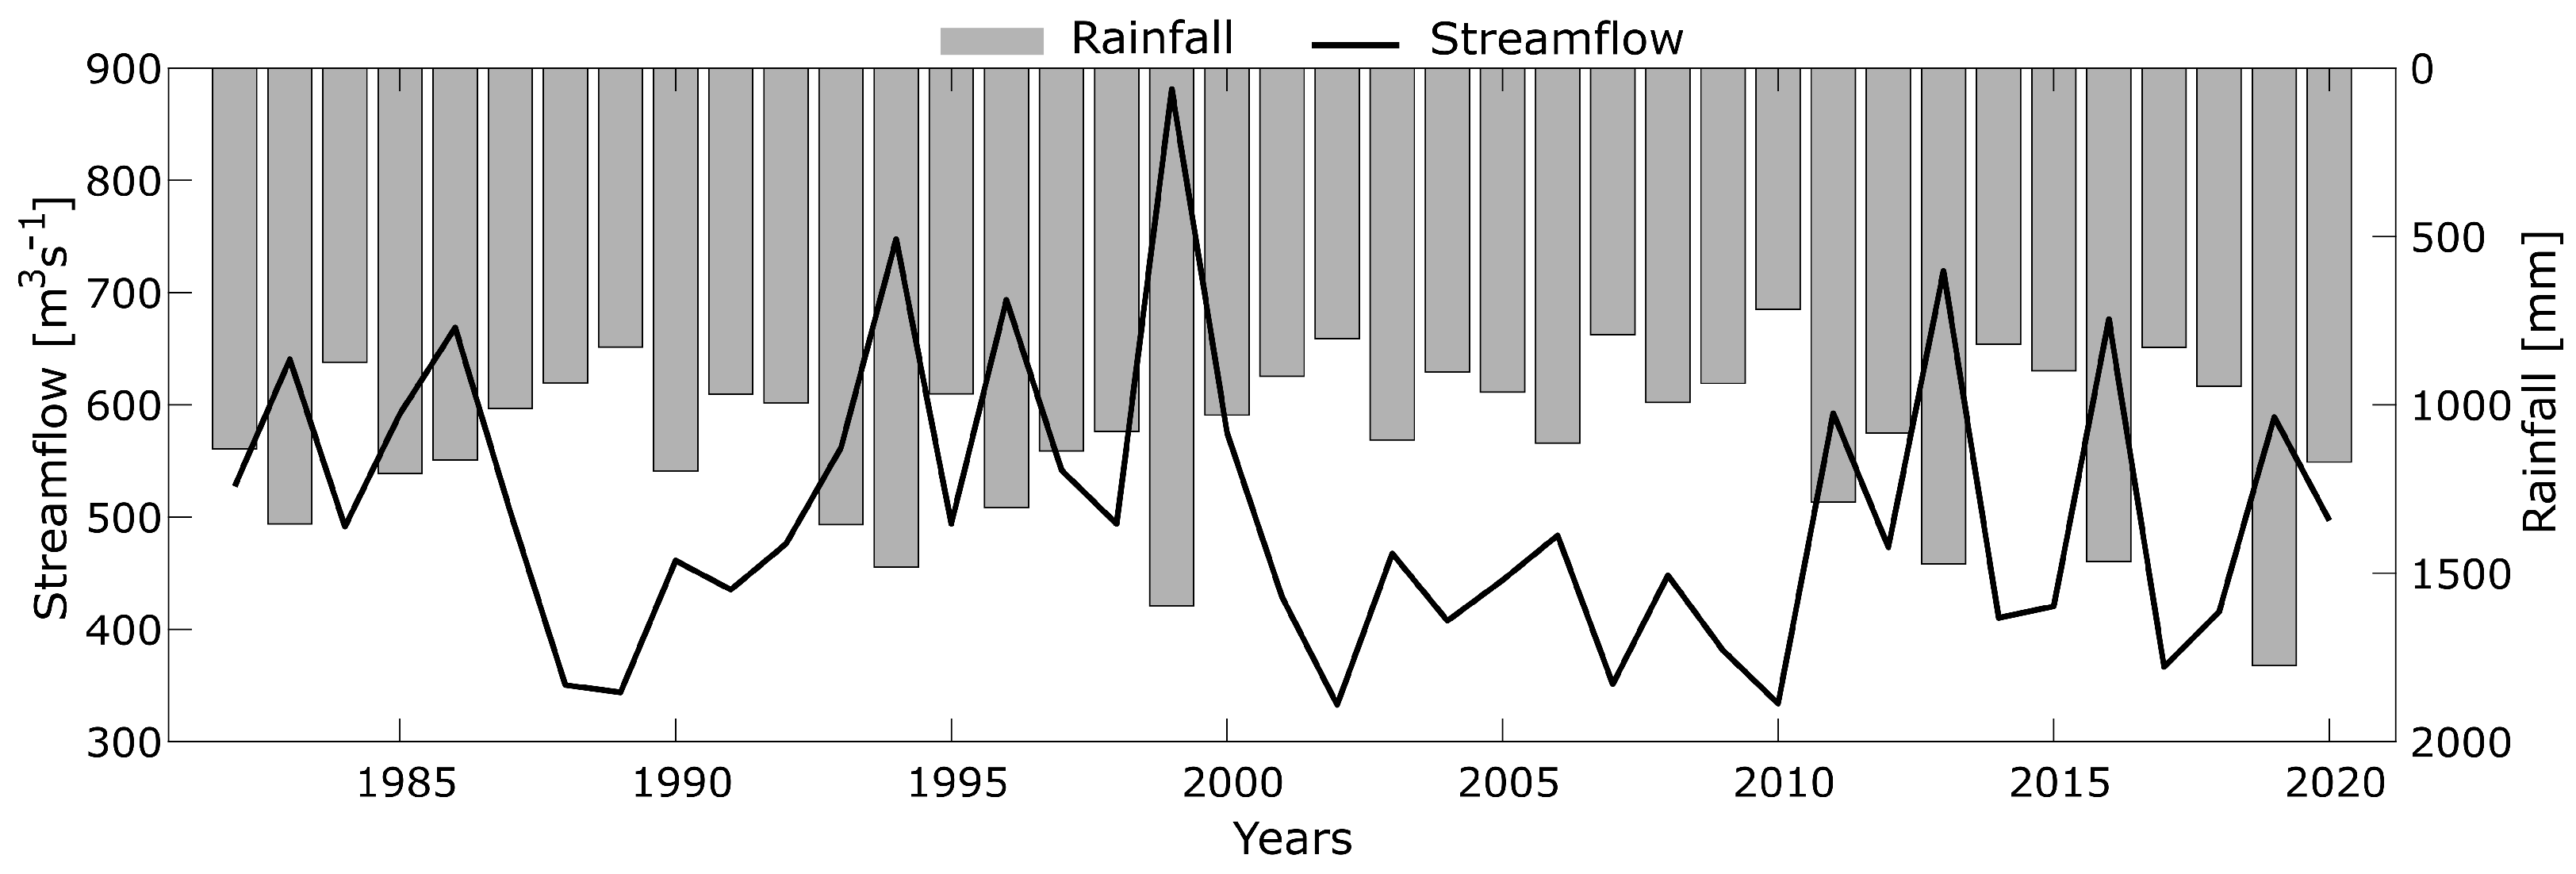
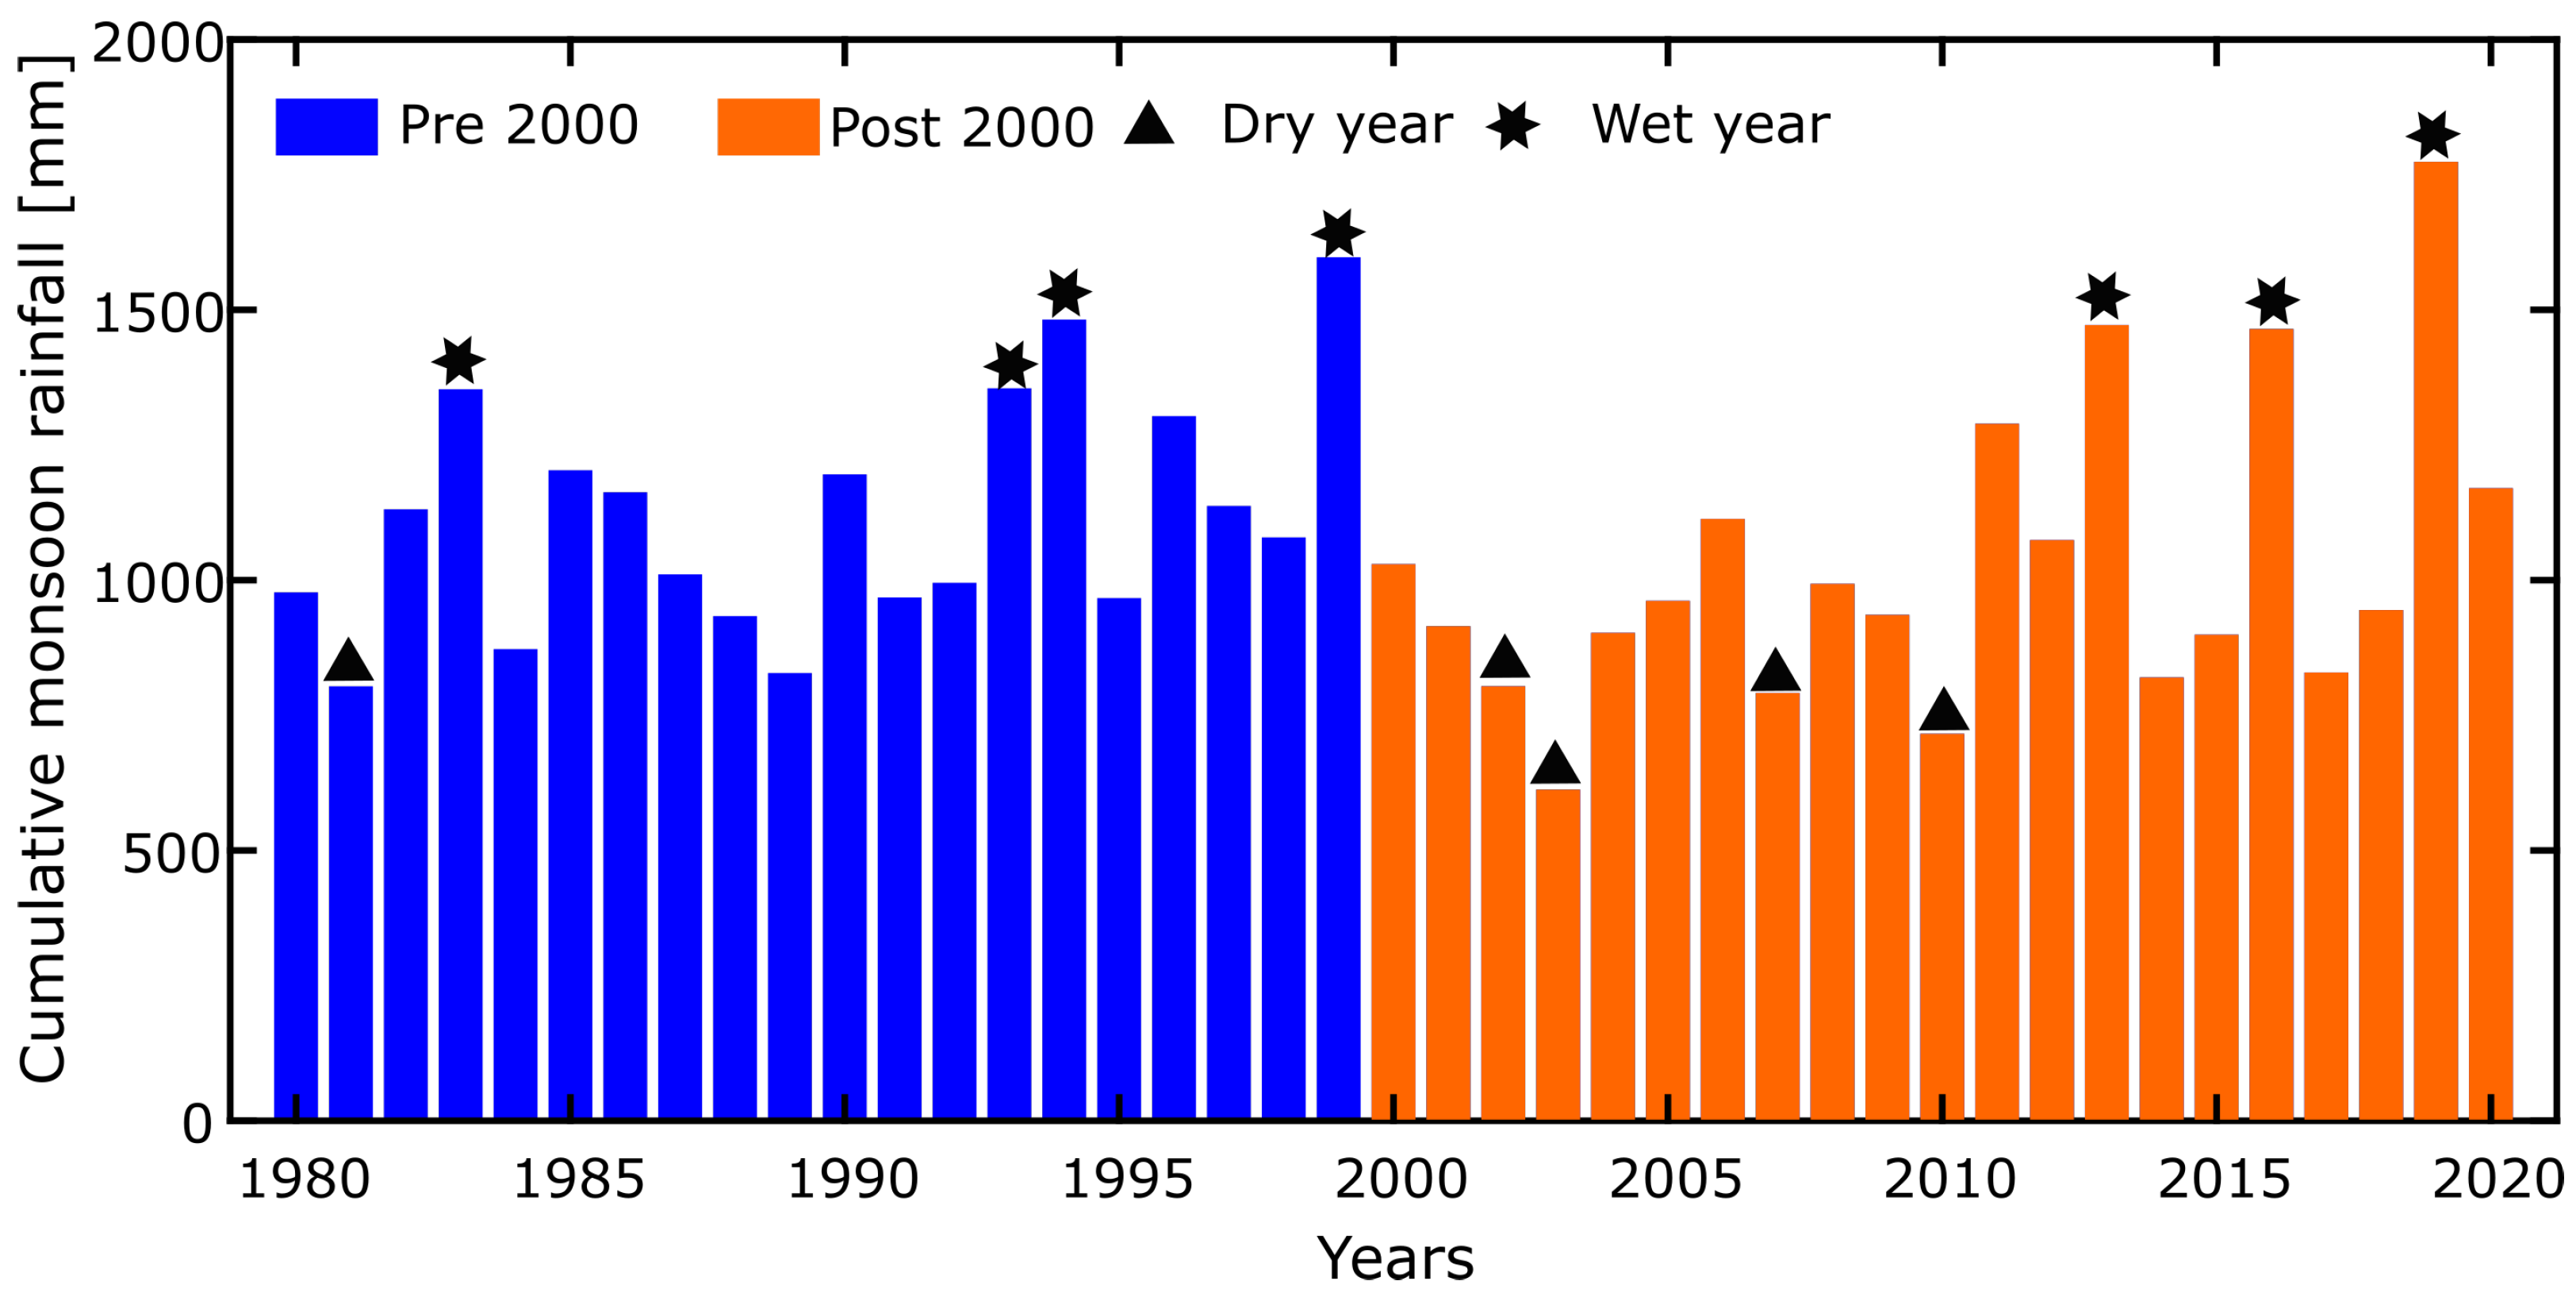
  • A transition from wetter to drier hydro-climatic conditions is evident in the upper Betwa River catchment, which affects the streamflow of the catchment.
  • The combined effect of climate and LU-LC change has resulted in the mean monsoon streamflow of Betwa River to decrease by 16% during 2001–2020 as compared to 1982–2000.
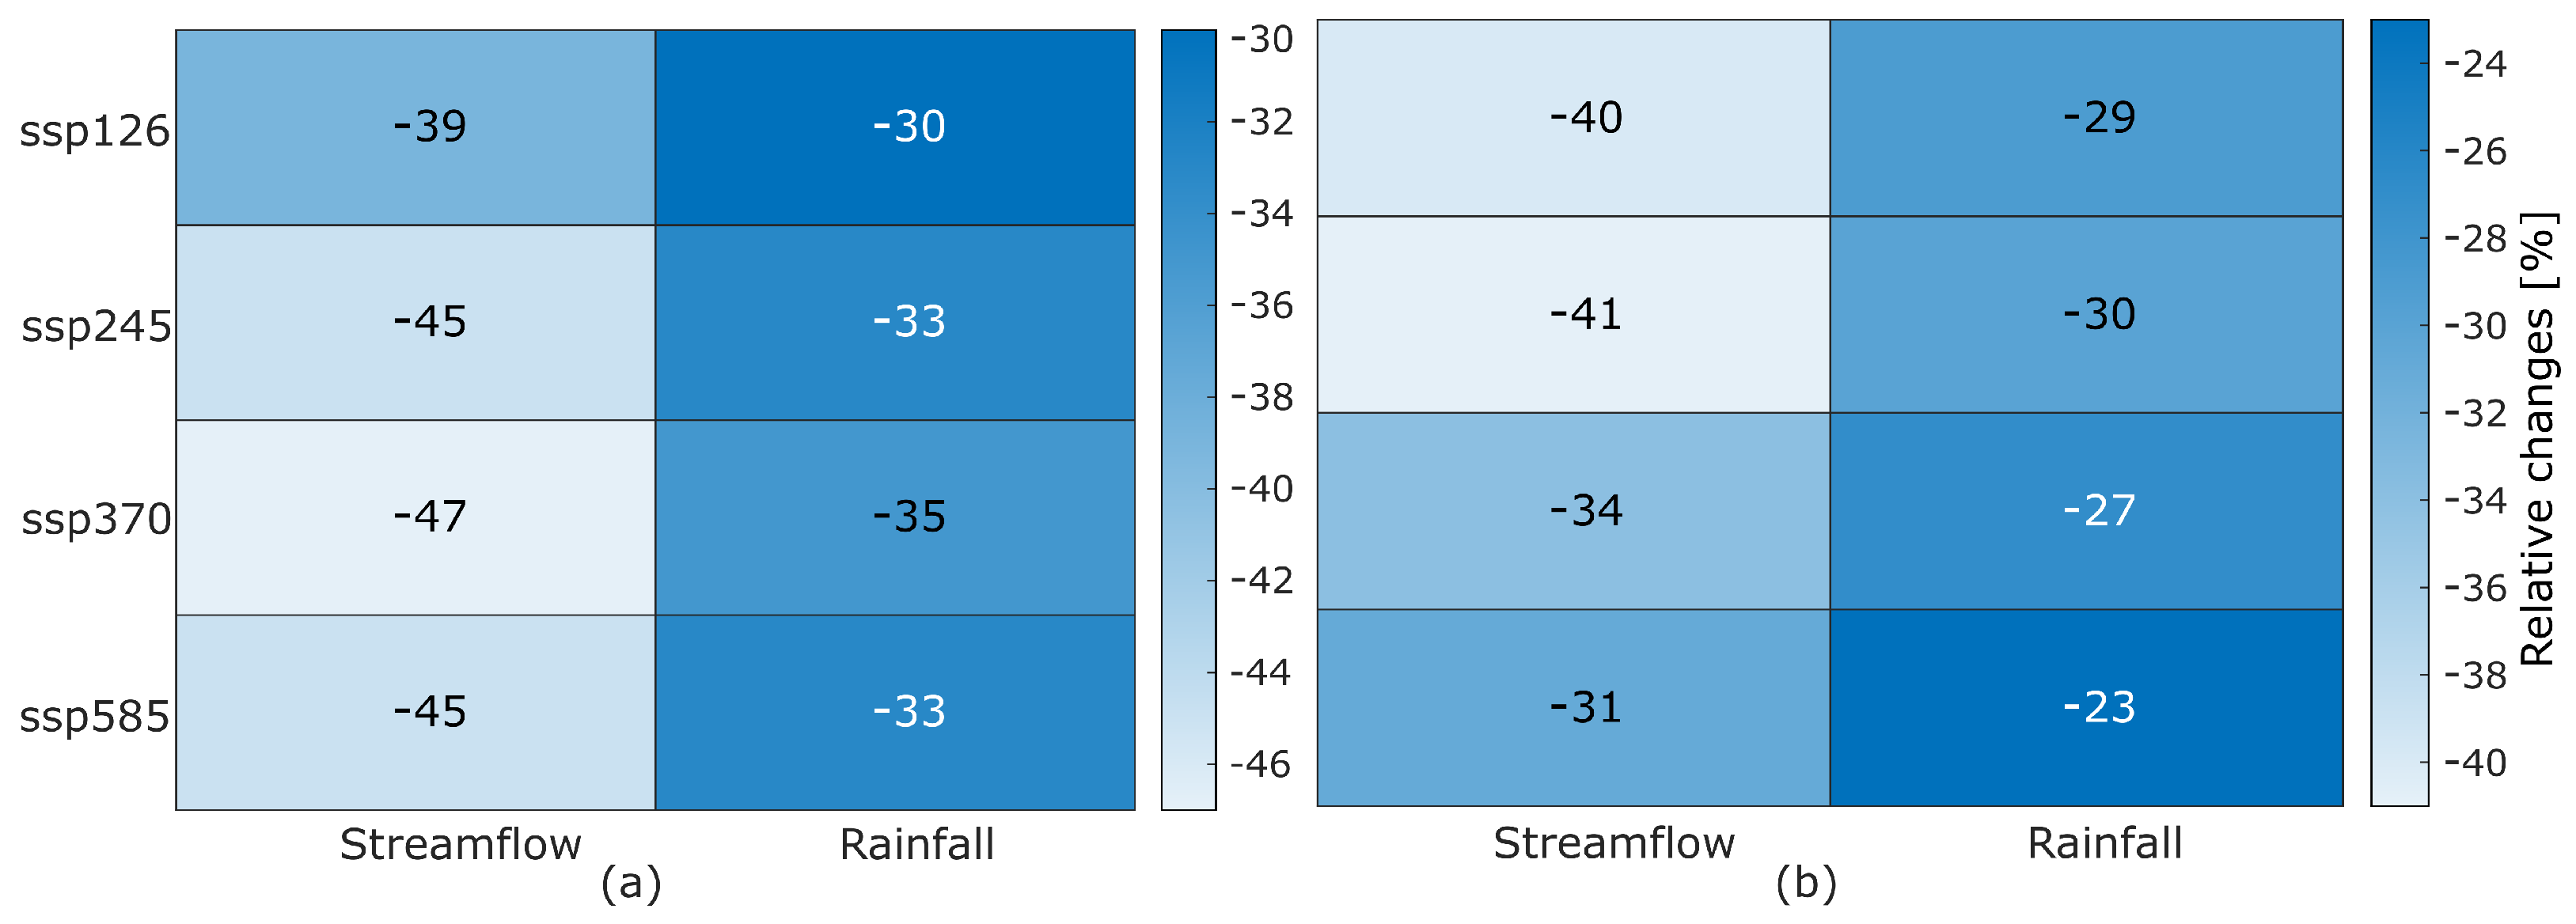
  • The mean monsoon streamflow is likely to decrease in all four future climate scenarios. It is projected to decrease by about 39–47% (2023-2060) and 31–41% (2061–2100) in the catchment with respect to the streamflow values observed during 1982–2020.
  • Water scarcity in the catchment is likely to aggravate due to landuse modification and climate change under four different CMIP6 future climate scenarios.

Author Contributions

A.K.: Conceptualization; Data processing; Analysis; Investigation; Methodology; Validation; Visualization; Roles/Writing—original draft; Writing—review & editing. K.G.: Conceptualization, Methodology, Investigation, Software, Resources, Writing—Review Editing, Visualization, Supervision. R.P.S.: Data processing; Analysis; Methodology. S.K.D.: Visualization & editing. All authors have read and agreed to the published version of the manuscript.

Funding

We do not have received any funds to conduct this research.

Institutional Review Board Statement

Not applicable.

Data Availability Statement

We have provided the link for the source of the dataset used in the manuscript.

Acknowledgments

The first author would like to acknowledge the Indian Institute of Science Education and Research Bhopal for providing funding to pursue Ph.D. and institutional support.

Conflicts of Interest

The authors do not have any conflict of interest.

References

  1. Cosgrove, W.J.; Loucks, D.P. Water management: Current and future challenges and research directions. Water Resour. Res. 2015, 51, 4823–4839. [Google Scholar] [CrossRef] [Green Version]
  2. Huang, J.; Tagawa, K.; Wang, B.; Wen, J.; Wang, J. Seasonal Surface Runoff Characteristics in the Semiarid Region of Western Heilongjiang Province in Northeast China—A Case of the Alun River Basin. Water 2019, 11, 557. [Google Scholar] [CrossRef] [Green Version]
  3. Singh, P.K.; Chudasama, H. Pathways for climate change adaptations in arid and semi-arid regions. J. Clean. Prod. 2021, 284, 124744. [Google Scholar] [CrossRef]
  4. Marhaento, H.; Booij, M.J.; Hoekstra, A.Y. Hydrological response to future land-use change and climate change in a tropical catchment. Hydrol. Sci. J. 2018, 63, 1368–1385. [Google Scholar] [CrossRef] [Green Version]
  5. Tian, J.; Guo, S.; Yin, J.; Pan, Z.; Xiong, F.; He, S. Quantifying both climate and land use/cover changes on runoff variation in Han River basin, China. Front. Earth Sci. 2022, 1–23. [Google Scholar] [CrossRef]
  6. Nayak, S. Land use and land cover change and their impact on temperature over central India. Lett. Spat. Resour. Sci. 2021, 14, 129–140. [Google Scholar] [CrossRef]
  7. Roxy, M.K.; Ghosh, S.; Pathak, A.; Athulya, R.; Mujumdar, M.; Murtugudde, R.; Terray, P.; Rajeevan, M. A threefold rise in widespread extreme rain events over central India. Nat. Commun. 2017, 8, 708. [Google Scholar] [CrossRef] [Green Version]
  8. Paul, S.; Ghosh, S.; Oglesby, R.; Pathak, A.; Chandrasekharan, A.; Ramsankaran, R. Weakening of Indian summer monsoon rainfall due to changes in land use land cover. Sci. Rep. 2016, 6, 2016. [Google Scholar] [CrossRef] [Green Version]
  9. Islam, A.; Sikka, A.K.; Saha, B.; Singh, A. Streamflow response to climate change in the Brahmani River Basin, India. Water Resour. Manag. 2012, 26, 1409–1424. [Google Scholar] [CrossRef]
  10. Chawla, I.; Mujumdar, P. Isolating the impacts of land use and climate change on streamflow. Hydrol. Earth Syst. Sci. 2015, 19, 3633–3651. [Google Scholar] [CrossRef]
  11. Vandana, K.; Islam, A.; Sarthi, P.P.; Sikka, A.K.; Kapil, H. Assessment of potential impact of climate change on streamflow: A case study of the Brahmani River basin, India. J. Water Clim. Chang. 2019, 10, 624–641. [Google Scholar] [CrossRef]
  12. Hung, C.L.J.; James, L.A.; Carbone, G.J.; Williams, J.M. Impacts of combined land-use and climate change on streamflow in two nested catchments in the Southeastern United States. Ecol. Eng. 2020, 143, 105665. [Google Scholar] [CrossRef]
  13. Sinha, R.K.; Eldho, T.; Subimal, G. Assessing the impacts of historical and future land use and climate change on the streamflow and sediment yield of a tropical mountainous river basin in South India. Environ. Monit. Assess. 2020, 192, 679. [Google Scholar] [CrossRef] [PubMed]
  14. Dubey, S.K.; Sharma, D.; Babel, M.S.; Mundetia, N. Application of hydrological model for assessment of water security using multi-model ensemble of CORDEX-South Asia experiments in a semi-arid river basin of India. Ecol. Eng. 2020, 143, 105641. [Google Scholar] [CrossRef]
  15. Desai, S.; Singh, D.; Islam, A.; Sarangi, A. Impact of climate change on the hydrology of a semi-arid river basin of India under hypothetical and projected climate change scenarios. J. Water Clim. Chang. 2021, 12, 969–996. [Google Scholar] [CrossRef]
  16. Kumar, N.; Tischbein, B.; Kusche, J.; Laux, P.; Beg, M.K.; Bogardi, J.J. Impact of climate change on water resources of upper Kharun catchment in Chhattisgarh, India. J. Hydrol. Reg. Stud. 2017, 13, 189–207. [Google Scholar] [CrossRef]
  17. Nilawar, A.P.; Waikar, M.L. Impacts of climate change on streamflow and sediment concentration under RCP 4.5 and 8.5: A case study in Purna river basin, India. Sci. Total. Environ. 2019, 650, 2685–2696. [Google Scholar] [CrossRef]
  18. Bisht, D.S.; Mohite, A.R.; Jena, P.P.; Khatun, A.; Chatterjee, C.; Raghuwanshi, N.S.; Singh, R.; Sahoo, B. Impact of climate change on streamflow regime of a large Indian river basin using a novel monthly hybrid bias correction technique and a conceptual modeling framework. J. Hydrol. 2020, 590, 125448. [Google Scholar] [CrossRef]
  19. Gosain, A.; Rao, S.; Basuray, D. Climate change impact assessment on hydrology of Indian river basins. Curr. Sci. 2006, 90, 346–353. [Google Scholar]
  20. Kumar, A.; Singh, A.; Gaurav, K. Assessing the synergic effect of land use and climate change on the upper Betwa River catchment in Central India under present, past, and future climate scenarios. Environ. Dev. Sustain. 2022, 1–22. [Google Scholar] [CrossRef]
  21. Pandey, R.; Mishra, S.K.; Singh, R.; Ramasastri, K. Streamflow drought severity analysis of Betwa river system (India). Water Resour. Manag. 2008, 22, 1127–1141. [Google Scholar] [CrossRef]
  22. Pai, D.; Rajeevan, M.; Sreejith, O.; Mukhopadhyay, B.; Satbha, N. Development of a new high spatial resolution (0.25 × 0.25) long period (1901–2010) daily gridded rainfall data set over India and its comparison with existing data sets over the region. Mausam 2014, 65, 1–18. [Google Scholar] [CrossRef]
  23. Srivastava, A.; Rajeevan, M.; Kshirsagar, S. Development of a high resolution daily gridded temperature data set (1969–2005) for the Indian region. Atmos. Sci. Lett. 2009, 10, 249–254. [Google Scholar] [CrossRef]
  24. Hersbach, H.; Bell, B.; Berrisford, P.; Hirahara, S.; Horányi, A.; Muñoz-Sabater, J.; Nicolas, J.; Peubey, C.; Radu, R.; Schepers, D.; et al. The ERA5 global reanalysis. Q. J. R. Meteorol. Soc. 2020, 146, 1999–2049. [Google Scholar] [CrossRef]
  25. Tatebe, H.; Watanabe, M. MIROC MIROC6 model output prepared for CMIP6 CMIP historical. Earth Syst. Grid Fed. 2018, 10. [Google Scholar] [CrossRef]
  26. Boucher, O.; Denvil, S.; Caubel, A.; Foujols, M. IPSL IPSL-CM6A-LR Model Output Prepared for CMIP6 CMIP. Earth System Grid Federation. 2018. Available online: https://doi.org/10.22033/ESGF/CMIP6.1534 (accessed on 22 March 2020).
  27. Bentsen, M.; Jan Leo, O.; Seland, Ø.; Toniazzo, T.; Gjermundsen, A.; Graff, L.S.; Debernard, J.B.; Gupta, A.K.; He, Y.; Kirkevåg,, A.; et al. NCC NorESM2-MM model output prepared for CMIP6 CMIP. Earth Syst. Grid Fed. 2019. [Google Scholar] [CrossRef]
  28. Eyring, V.; Bony, S.; Meehl, G.A.; Senior, C.A.; Stevens, B.; Stouffer, R.J.; Taylor, K.E. Overview of the Coupled Model Intercomparison Project Phase 6 (CMIP6) experimental design and organization. Geosci. Model Dev. 2016, 9, 1937–1958. [Google Scholar] [CrossRef] [Green Version]
  29. Iglewicz, B.; Hoaglin, D.C. How to Detect and Handle Outliers; American Society for Quality Control: Milwaukee, WI, USA, 1993; Volume 16. [Google Scholar]
  30. Hazarika, J.; Sarma, A.K. Importance of regional rainfall data in homogeneous clustering of data-sparse areas: A study in the upper Brahmaputra valley region. Theor. Appl. Climatol. 2021, 145, 1161–1175. [Google Scholar] [CrossRef]
  31. Mann, H.B. Nonparametric tests against trend. Econom. J. Econom. Soc. 1945, 13, 245–259. [Google Scholar] [CrossRef]
  32. Gocic, M.; Trajkovic, S. Analysis of changes in meteorological variables using Mann-Kendall and Sen’s slope estimator statistical tests in Serbia. Glob. Planet. Chang. 2013, 100, 172–182. [Google Scholar] [CrossRef]
  33. Kumar, A.; Sarthi, P.P.; Kumari, A. Observed rainfall events and outgoing longwave radiation over contrasting river basins in Bihar, India. Mausam 2022, 73, 273–282. [Google Scholar] [CrossRef]
  34. McKee, T.B.; Doesken, N.J.; Kleist, J. The relationship of drought frequency and duration to time scales. In Proceedings of the 8th Conference on Applied Climatology, Anaheim, CA, USA, 17–22 January 1993; pp. 179–184. [Google Scholar]
  35. Abbas, S.; Kousar, S. Spatial analysis of drought severity and magnitude using the standardized precipitation index and streamflow drought index over the Upper Indus Basin, Pakistan. Environ. Dev. Sustain. 2021, 23, 15314–15340. [Google Scholar] [CrossRef]
  36. Hayes, M.J.; Svoboda, M.D.; Wiihite, D.A.; Vanyarkho, O.V. Monitoring the 1996 drought using the standardized precipitation index. Bull. Am. Meteorol. Soc. 1999, 80, 429–438. [Google Scholar] [CrossRef]
  37. Nalbantis, I.; Tsakiris, G. Assessment of hydrological drought revisited. Water Resour. Manag. 2009, 23, 881–897. [Google Scholar] [CrossRef]
  38. Randall, D.A.; Wood, R.A.; Bony, S.; Colman, R.; Fichefet, T.; Fyfe, J.; Kattsov, V.; Pitman, A.; Shukla, J.; Srinivasan, J.; et al. Climate Models and Their Evaluation. In Climate Change 2007: The Physical Science Basis. Contribution of Working Group I to the Fourth Assessment Report of the IPCC (FAR); Cambridge University Press: Cambridge, UK, 2007; pp. 589–662. [Google Scholar]
  39. Legates, D.R. Limitations of climate models as predictors of climate change. Brief Anal. 2002, 396, 1–2. [Google Scholar]
  40. Saputra, M.H.; Lee, H.S. Prediction of land use and land cover changes for north sumatra, indonesia, using an artificial-neural-network-based cellular automaton. Sustainability 2019, 11, 3024. [Google Scholar] [CrossRef] [Green Version]
  41. e Silva, L.P.; Xavier, A.P.C.; da Silva, R.M.; Santos, C.A.G. Modeling land cover change based on an artificial neural network for a semiarid river basin in northeastern Brazil. Glob. Ecol. Conserv. 2020, 21, e00811. [Google Scholar] [CrossRef]
  42. Gómez, D.; Montero, J. Determining the accuracy in image supervised classification problems. In Proceedings of the 7th Conference of the European Society for Fuzzy Logic and Technology (EUSFLAT-2011), Paris, France, 18–22 July 2011. [Google Scholar]
  43. Cibin, R.; Sudheer, K.; Chaubey, I. Sensitivity and identifiability of stream flow generation parameters of the SWAT model. Hydrol. Process. Int. J. 2010, 24, 1133–1148. [Google Scholar] [CrossRef]
  44. Jiang, L.; Zhu, J.; Chen, W.; Hu, Y.; Yao, J.; Yu, S.; Jia, G.; He, X.; Wang, A.Z. Identification of Suitable Hydrologic Response Unit Thresholds for SWAT Streamflow Modelling in the Upper Hunhe River Watershed, Notheast China. Chin. Geogr. Sci. 2021, 31, 696–710. [Google Scholar] [CrossRef]
  45. Abbaspour, K.C. SWAT calibration and uncertainty programs. In A User Manual; Swiss Federal Institute of Aquatic Science and Technology (Eawag): Dübendorf, Switzerland, 2015; pp. 17–66. [Google Scholar]
  46. Aslam, O.P.M. Influence of cosmic-ray variability on the monsoon rainfall and temperature. J. Atmos. Sol.-Terr. Phys. 2015, 122, 86–96. [Google Scholar]
  47. Vishnu, S.; Chakraborty, A.; Srinivasan, J. Why the droughts of the Indian summer monsoon are more severe than the floods. Clim. Dyn. 2022, 58, 3497–3512. [Google Scholar] [CrossRef]
  48. Verma, S.; Bhatla, R.; Shahi, N.; Mall, R. Regional modulating behavior of Indian summer monsoon rainfall in context of spatio-temporal variation of drought and flood events. Atmos. Res. 2022, 274, 106201. [Google Scholar] [CrossRef]
  49. Palmate, S.S. Modelling spatiotemporal land dynamics for a trans-boundary river basin using integrated Cellular Automata and Markov Chain approach. Appl. Geogr. 2017, 82, 11–23. [Google Scholar] [CrossRef]
  50. Singh, V.G.; Singh, S.K.; Kumar, N.; Singh, R.P. Simulation of land use/land cover change at a basin scale using satellite data and markov chain model. Geocarto Int. 2022, 14, 1–26. [Google Scholar] [CrossRef]
  51. Tan, X.; Liu, S.; Tian, Y.; Zhou, Z.; Wang, Y.; Jiang, J.; Shi, H. Impacts of Climate Change and Land Use/Cover Change on Regional Hydrological Processes: Case of the Guangdong-Hong Kong-Macao Greater Bay Area. Front. Environ. Sci. 2022, 9, 783324. [Google Scholar] [CrossRef]
  52. Mall, R.K.; Singh, R.; Gupta, A.; Srinivasan, G.; Rathore, L. Impact of climate change on Indian agriculture: A review. Clim. Chang. 2006, 78, 445–478. [Google Scholar] [CrossRef] [Green Version]
  53. Levidow, L.; Zaccaria, D.; Maia, R.; Vivas, E.; Todorovic, M.; Scardigno, A. Improving water-efficient irrigation: Prospects and difficulties of innovative practices. Agric. Water Manag. 2014, 146, 84–94. [Google Scholar] [CrossRef] [Green Version]
  54. Yu, Z.; Man, X.; Duan, L.; Cai, T. Assessments of impacts of climate and forest change on water resources using swat model in a subboreal watershed in northern da hinggan mountains. Water 2020, 12, 1565. [Google Scholar] [CrossRef]
Figure 1. Topography of the upper Betwa River catchment. Lines in blue and black represent the streams and isohyets. The isohytes are computed from the long-term rainfall data (in mm) from 1980–2018. Circle in black represents the river gauging site at the catchment outlet (Kurwai).
Agriculture 12 02005 g001
Figure 2. Detailed flowchart of SWAT model setup used in this study.
Agriculture 12 02005 g002
Figure 3. The p and t-stat value of each sensitive parameter of the SWAT model during the simulation (a,c) 1980–2000 and (b,d) 1998–2020.
Agriculture 12 02005 g003
Figure 4. Observed and predicted LULC of Upper Betwa Catchment for the year (a) 1990, (b) 2000, (c) 2010, (d) 2020, (e) 2040, and (f) 2070.
Agriculture 12 02005 g004
Figure 5. Area of observed and predicted LULC of Upper Betwa Catchment.
Agriculture 12 02005 g005
Figure 6. Observed trend in total accumulated monsoon rainfall during 1980–2020.
Agriculture 12 02005 g006
Figure 7. Meteorological (SPI) and hydrological (SDI) drought for the monsoon season during 1980–2020.
Agriculture 12 02005 g007
Figure 8. Distribution of meteorological and hydrological drought during the monsoon season of 1980–2020.
Agriculture 12 02005 g008
Figure 9. (a) Shows the long-term (1982–2020) mean annual cycle of rainfall (black line) and streamflow (blue line). Figure (b) shows the spatial distribution of ISMR contribution (%) in the catchment.
Agriculture 12 02005 g009
Figure 10. Observed accumulated monsoon rainfall and corresponding simulated mean stream flow variability during 1980–2020.
Agriculture 12 02005 g010
Figure 11. Heat map illustrates the projected change in mean monsoon streamflow and rainfall of Upper Betwa River during (a) 2023–2060 and (b) 2061–2100 with respect to 1982–2020.
Agriculture 12 02005 g011
Figure 12. Accumulated rainfall of the monsoon season during 1980–2020 is represented by bar plot, respective wet and dry event based on SPI is shown with star and triangle symbol.
Agriculture 12 02005 g012
Table 1. Descriptions of the physical and hydro-climatic data used for the hydrological simulation.
Data TypeParameterSourceTime-StepYearResolution
Historical
climate data
RainfallIMDDaily1980–2020 0 . 25 × 0 . 25
Wind speedERA 5Hourly1980–2020 0 . 25 × 0 . 25
Minimum and Maximum
Temperature
IMDDaily1980–2020 1 × 1
Relative humidityERA 5Hourly1980–2020 0 . 25 × 0 . 25
Solar radiationERA 5Hourly1980–2020 0 . 25 × 0 . 25
Future
climate data
RainfallIPSL-CM6A-LR
MIROC 6
NorESM2-MM
Daily1980–2100
TemperatureIPSL-CM6A-LR
MIROC 6
NorESM2-MM
Daily1980–2100
Physical dataSoil mapFAO- 1 km
Land use mapLandsat5 and 8-1990–202030 m
ElevationSRTM- 90 m
DischargeIn-situ river dischargeWater Resource DepartmentDaily1991–2014Daily
Table 2. Descriptions of the satellite data used for the image classification.
Satellite SensorPath/RowAcquisition YearSpatial Resolution
Landsat 5 TM145/43
145/44
146/43
146/44
1990
2000
2010
30 m
Landsat 8 OLI145/43
145/44
146/43
146/44
2018
2020
30 m
Table 3. Accuracy assessment report of the observed LULC for years 1990, 2000, 2010, and 2020.
YearKappa StatisticsOverall Accuracy
19900.820.88
20000.880.92
20100.870.91
20200.900.95
Publisher’s Note: MDPI stays neutral with regard to jurisdictional claims in published maps and institutional affiliations.

