

Climatic Changes—A Challenge for the Bulgarian Farmers


 , ,
, ,
Abstract
1. Introduction
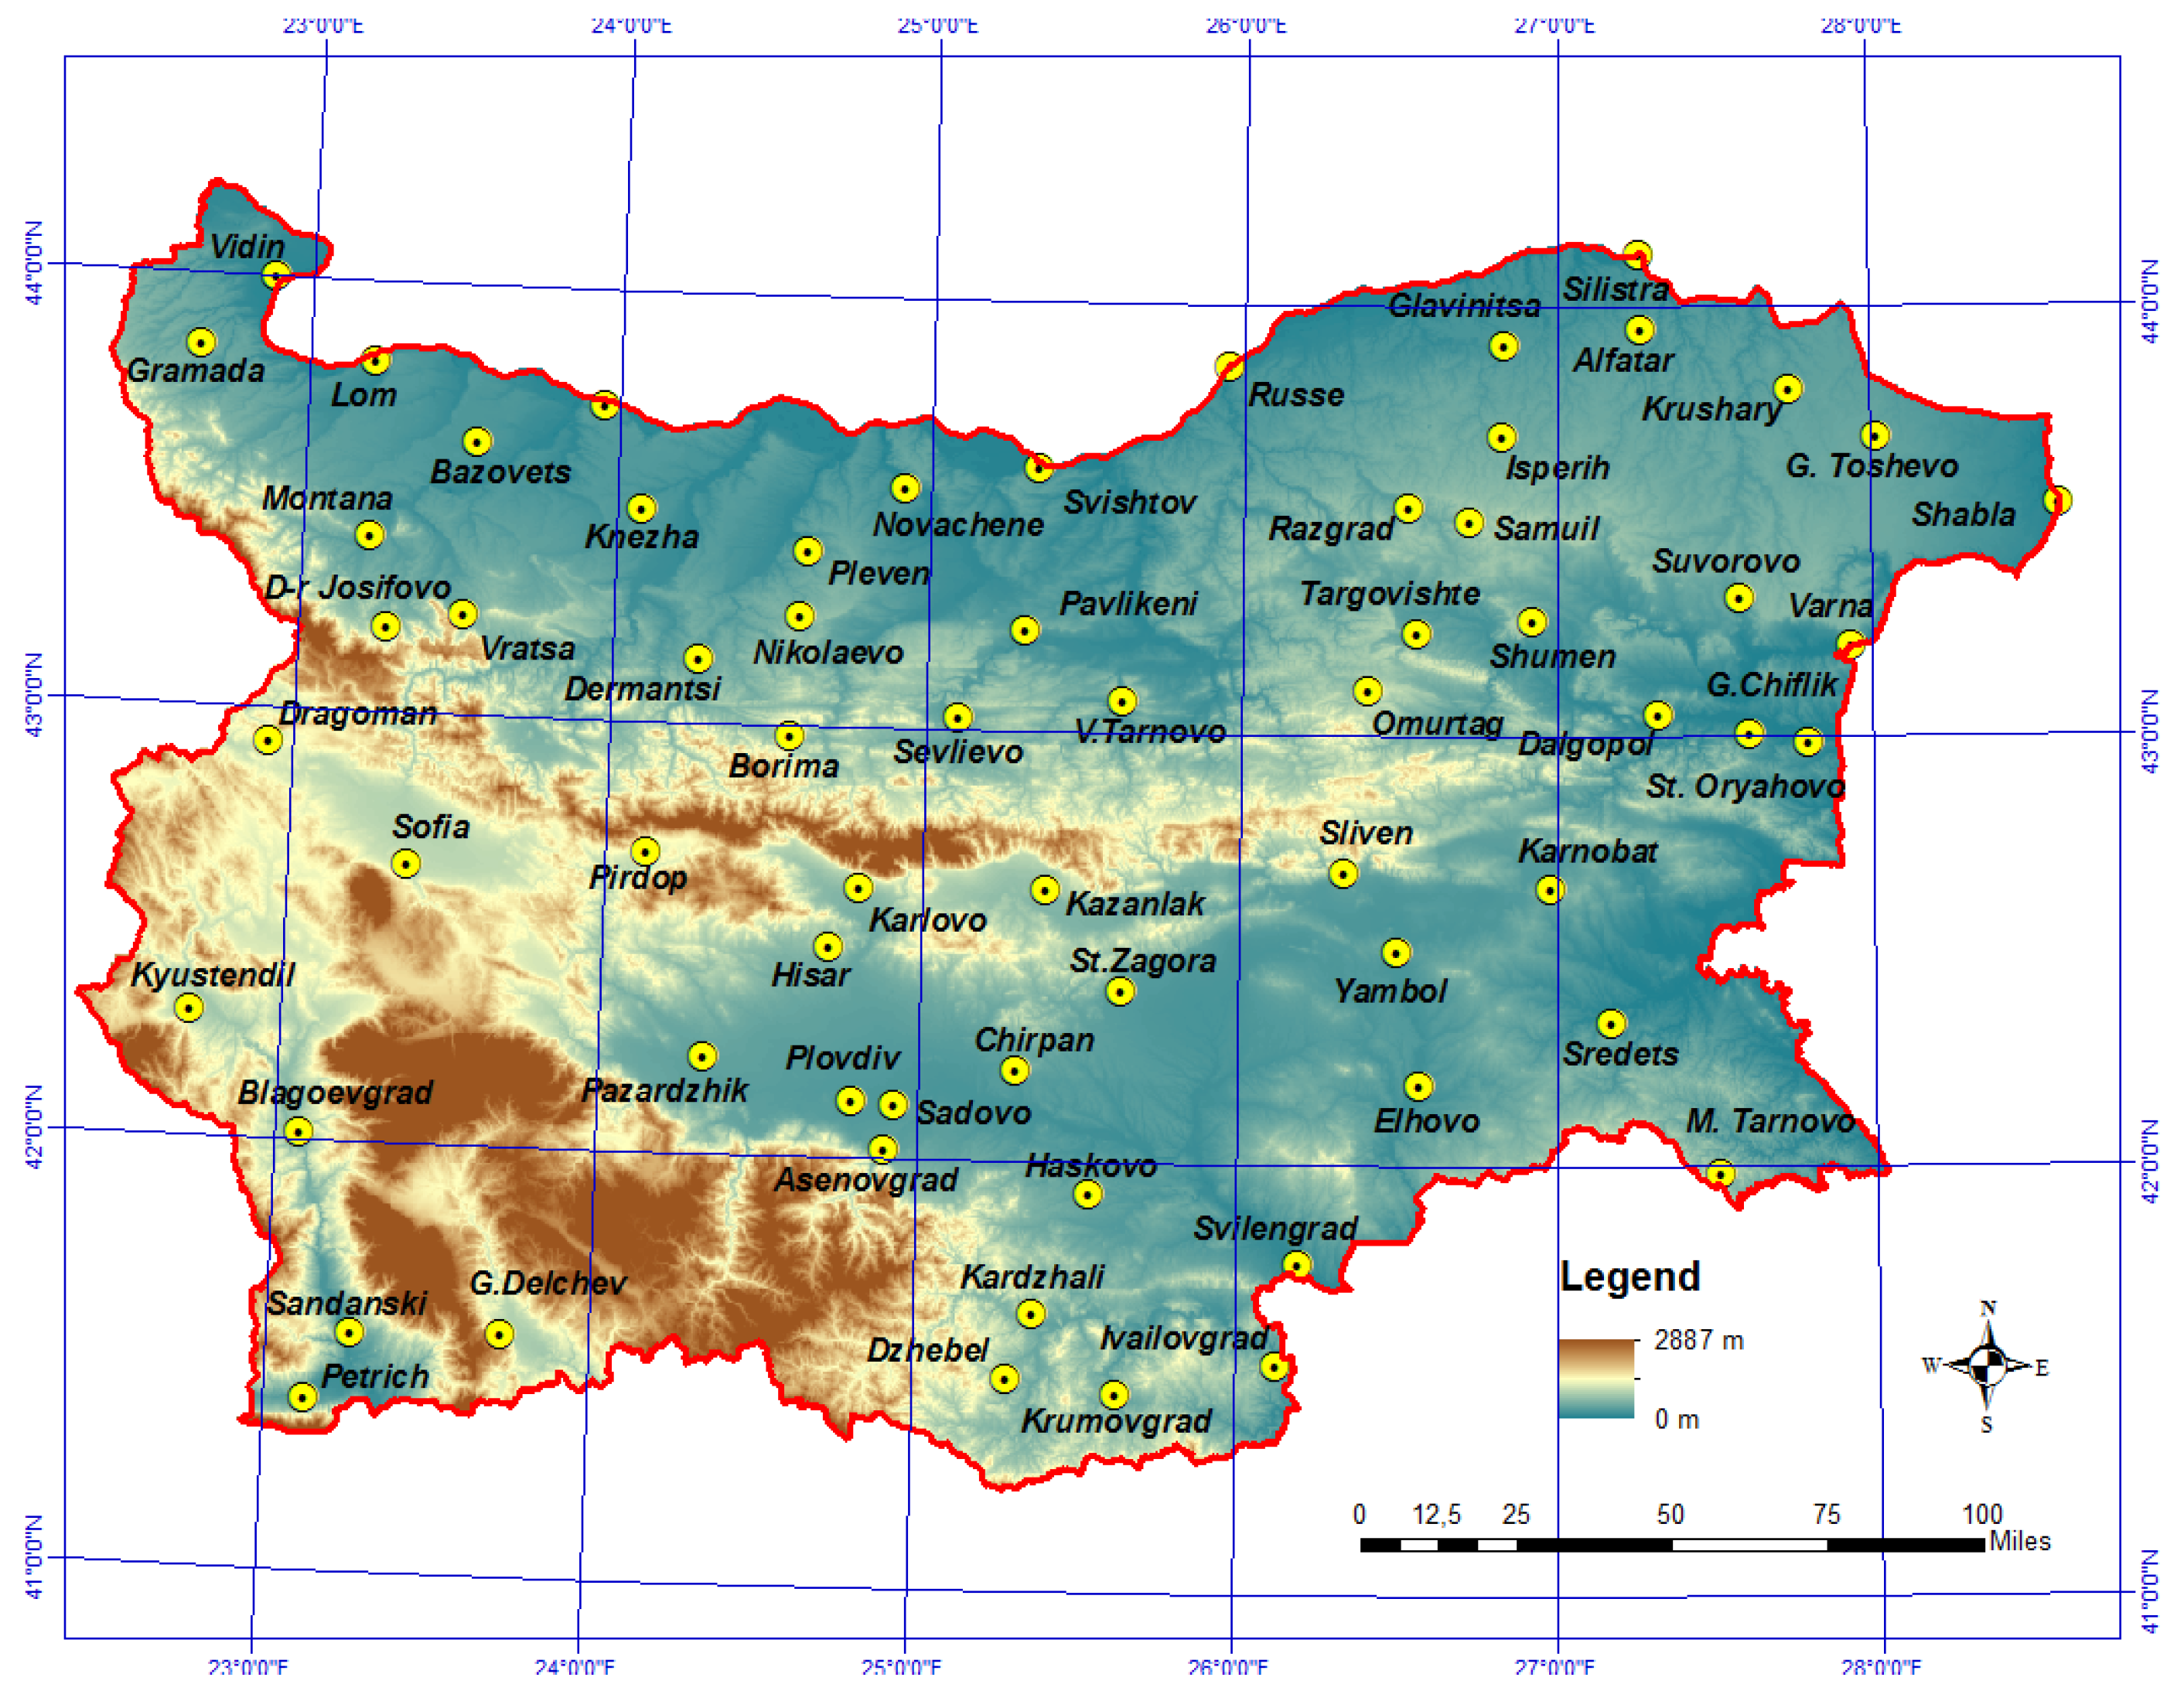
2. Material and Methods
3. Results and Discussion
3.1. Changes in the Meteorological Conditions
3.2. Changes in Agrometeorological Conditions
3.2.1. Transition in Average Daily Temperatures across Biological Thresholds 5 °C and 10 °C
3.2.2. Duration of the Period with Daily Temperature above 5 °C and 10 °C
3.2.3. Active and Effective Temperature Sums for the Period with Temperatures above 5 °C and 10 °C
3.3. Changes in Rainfall Sums during the Vegetation Season
3.4. Potential Evapotranspiration (ETo) Dynamics
4. Conclusions
- Draw up precise and highly reliable and sufficiently advanced forecasts for agrometeorological conditions, for the growth and development of crops and expected yields;
- Guide breeders when creating new varieties and hybrids;
- Update agroclimatic zoning of agricultural crops
- Optimize the varietal and hybrid composition of cultivated crops for the maximum use of agroclimatic resources;
- Shifting the sowing dates to adapt crops to rising temperatures. This will allow the crops to develop during a period with temperature closer to most favorable, optimizing the growing duration, especially the grain filling period on the grain crops;
- Growing varieties of autumn crops with an appropriate period of development, which will allow them to use the maximum accumulated soil water and the temperatures above 5 °C in the months of December, January, and February.
- Using cultivars and hybrids with a shorter growing season as spring crops in the areas with summer droughts and ones with a longer growing season in the regions with drought during the winter;
- Focusing on early and mid-early varieties during the growing season from April to October in conditions of dry spell and drought with tendencies for rising temperatures, which would allow the crops to complete their development earlier and exclude the loss of yields by extreme agrometeorological conditions;
- Seeking the advice and competence of experts for the deployment of precision agriculture in the context of dynamically changing agroclimatic conditions, which will minimize expenses and increase competitiveness of production.
Author Contributions
Funding
Institutional Review Board Statement
Data Availability Statement
Acknowledgments
Conflicts of Interest
References
- World Bank. The Changing Nature of Work; A World Bank Group Flagship Report; World Bank: Washington, DC, USA, 2019; 151p, e-ISBN: 978-1-4648-1356-6. [Google Scholar] [CrossRef]
- Chirkov, Y.I. Agrometeorology; Gidrometeoizdat: Leningrad, Russia, 1986; 294p. (In Russian) [Google Scholar]
- Sirotenko, O.D. Mathematical Modeling of the Water-Thermal Regime of Agroecosystems; L. Gidrometeoizdat: Leningrad, Russia, 1981; 167p. (In Russian) [Google Scholar]
- Gringof, I.G.V.V.; Popova, V.N. Strashni 1987—Agrometeorology; L. Gidrometeoizdat: Leningrad, Russia, 1987; 305p. (In Russian) [Google Scholar]
- De Wit, A.; van Diepen, K.; Kroes, J.; Eitzinger, J.; Kazandjiev, V.; Tulios, L. Application of remote sensing data as inputs for the SWAP 2.0 model. In Proceedings of the COST Action 718 Meteorological applications for Agriculture, Budapest, Hungary, 27–28 September 2001; p. 11. [Google Scholar]
- De Wit, C.T.; Brower, R.; Penning de Vries, F.W.T. A dynamic model of plant and crop growth. In Potential Crop Production; Wareing, P.P., Cooper, J.R., Eds.; Heinemann Educational Books: London, UK, 1971; pp. 117–142. [Google Scholar]
- Tooming, H.G. Solar Radiation and Crop Yield Formation; L. Gidrometeoizdat: Leningrad, Russia, 1977; 194p. (In Russian) [Google Scholar]
- Ross, Y.K. On the Mathematical Description of Plant Growth—AN; USSR, 1966; Volume 171/z, pp. 480–483. (In Russian) [Google Scholar]
- Slavov, N.; Kazandzhiev, V. Phytoclimatic estimation of air temperature transitions across characteristic boundary values in Bulgaria. 2003. In Proceedings of the Conference on Water Observation and Information System for Decision Support (BALWOIS), Ohrid, Macedonia, 25–29 May 2004; p. 33. [Google Scholar]
- Eitzinger, J.; Thaler, S.; Orlandini, S.; Nejedlik, P.; Kazandjiev, V.; Vucetic, V.; Sivertsen, T.H.; Mihailovic, D.T.; Lalic, B.; Tsiros, E.; et al. Agroclimatic Indices and Simulation Models. In Survey of Agrometeorological Practices and Applications in Europe, Regarding Climate Change Impacts; Copisteria Sangallo: ESF, COST: Brussels, Belgium, 2008; Volume 734, pp. 15–114. [Google Scholar]
- Kazandjiev, V. Climate Change—Fundamentals; Agroclimatic Conditions in Bulgaria and Resilience Agriculture Trough Adaptation. In Implications of Climate Change and Disasters on Military Activities: Building Resiliency and Mitigating Vulnerability in the Balkan Region; NATO SfPS series C: Environmental Security; Springer: Dordrecht, The Netherlands, 2017; 158p. [Google Scholar]
- Kazandjiev, V. Climate change, Agroclimatic Resources and Zonning of Agriculture in Bulgaria. J. Balk. Ecol. 2011, 14, 365–382. [Google Scholar]
- Kazandjiev, V.; Degorski, M.; Błażejczyk, K.; Georgieva, V. Agroclimatic Conditions in Bulgaria and Agriculture Adaptation. Europa XXI 2015, 29, 23–42. [Google Scholar] [CrossRef]
- Kazandjiev, V.; Georgieva, V. WOFOST Model Calibration for some Cereal Crops in Bulgaria. In Proceedings of the 8th Conference on Meteorology—Climatology and Atmospheric Physics COMECAP, Athens, Greece, 24–26 May 2006; Volume C, pp. 97–102. [Google Scholar]
- Hershkovich, E.L. Agroclimatic Resources of Bulgaria; Publisher BAS: Online, 1984; 115p. (In Bulgarian) [Google Scholar]


| Station | Longitude | Latitude | Eelevation (m) | Station | Longitude | Latitude | Elevation (m) | Station | Longitude | Latitude | Elevation (m) | Station | Longitude | Latitude | Elevation (m) |
|---|---|---|---|---|---|---|---|---|---|---|---|---|---|---|---|
| Vidin | 22.884 | 44.002 | 36 | Razgrad | 26.533 | 43.533 | 200 | Asenovgrad | 24.908 | 42.024 | 230 | Pirdop | 24.133 | 42.700 | 686 |
| Vratsa | 23.529 | 43.233 | 398 | Silistra | 27.273 | 44.121 | 35 | Karlovo | 24.808 | 42.627 | 453 | M. Tarnovo | 27.521 | 41.982 | 352 |
| Bazovets | 23.552 | 43.635 | 165 | Shumen | 26.933 | 43.267 | 211 | Pazardzhik | 24.338 | 42.227 | 208 | Suvorovo | 27.592 | 43.325 | 181 |
| Montana | 23.220 | 43.408 | 146 | Shabla | 28.609 | 43.539 | 22 | Sofia | 23.383 | 42.650 | 570 | G.Chiflik | 27.622 | 43.009 | 25 |
| Lom | 23.217 | 43.816 | 40 | Varna | 27.945 | 43.211 | 40 | Blagoevgrad | 23.086 | 42.015 | 390 | Alfatar | 27.280 | 43.946 | 140 |
| Knezha | 24.083 | 43.494 | 109 | G. Toshevo | 28.033 | 43.700 | 226 | Kyustendil | 22.722 | 42.290 | 523 | Samuil | 26.733 | 43.500 | 458 |
| Oryahovo | 23.959 | 43.734 | 150 | Karnobat | 26.991 | 42.646 | 203 | Sandanski | 23.270 | 41.554 | 297 | Omurtag | 26.412 | 43.105 | 502 |
| Pavlikeni | 25.320 | 43.239 | 121 | Yambol | 26.508 | 42.497 | 136 | Petrich | 23.133 | 41.400 | 178 | Isperih | 26.834 | 43.700 | 272 |
| Pleven | 24.618 | 43.409 | 126 | Sliven | 26.340 | 42.681 | 265 | D-r Josifovo | 23.283 | 43.197 | 202 | Gramada | 22.656 | 43.836 | 218 |
| Novachene | 24.926 | 43.562 | 333 | Chirpan | 25.310 | 42.211 | 185 | Borima | 24.577 | 42.977 | 484 | Dalgopol | 27.334 | 43.051 | 38 |
| Nikolaevo | 24.600 | 43.259 | 274 | St.Zagora | 25.642 | 42.402 | 205 | Elhovo | 26.580 | 42.186 | 111 | Svilengrad | 26.200 | 41.767 | 56 |
| V.Tarnovo | 25.628 | 43.077 | 215 | Kazanlak | 25.401 | 42.636 | 375 | Dzhebel | 25.301 | 41.500 | 325 | Sredets | 27.184 | 42.334 | 36 |
| Svishtov | 25.350 | 43.616 | 77 | Haskovo | 25.549 | 41.930 | 200 | Krumovgrad | 25.643 | 41.460 | 225 | Dermantsi | 24.283 | 43.150 | 199 |
| Targovishte | 26.566 | 43.240 | 191 | Kardzhali | 25.380 | 41.646 | 249 | Ivailovgrad | 26.134 | 41.533 | 86 | Hisar | 24.718 | 42.488 | 371 |
| Russe | 25.957 | 43.86 | 71 | Plovdiv | 24.802 | 42.134 | 162 | Dragoman | 22.932 | 42.922 | 734 | Sevlievo | 25.109 | 43.030 | 202 |
| St. Oryahovo | 27.804 | 42.986 | 14 | Glavinitsa | 26.838 | 43.910 | 109 |
| Station/Month | I | II | III | IV | V | VI | VII | VIII | IX | X | XI | XII | Average |
|---|---|---|---|---|---|---|---|---|---|---|---|---|---|
| Vidin | 1.4 | 0.5 | 0.8 | 0.2 | 0.3 | 0.9 | 1.3 | 1.4 | −0.1 | 0 | −0.1 | −0.5 | 1.7 |
| Gramada | 1.9 | 1.1 | 1.3 | 0.6 | 0.6 | 1.2 | 1.5 | 1.7 | 0.1 | 0.2 | 0.1 | 0.1 | 0.8 |
| Montana | 1.6 | 0.6 | 0.7 | 0.0 | 0.3 | 1.0 | 1.3 | 1.4 | 0.3 | 0.5 | 0.5 | 0.3 | 0.9 |
| D-r Josifoo | 1.5 | 1.0 | 1.0 | 0.3 | 0.5 | 1.4 | 1.5 | 1.6 | 0.5 | 0.4 | 0.4 | 0.0 | 0.4 |
| Bazovs | 1.6 | 1.3 | 1.3 | 0.2 | 0.4 | 1.1 | 1.4 | 1.7 | 0.6 | 0.9 | 0.6 | 0.3 | 0.6 |
| Lom | 1.5 | 0.9 | 1.1 | 0.5 | 0.8 | 1.3 | 1.5 | 1.6 | 0.3 | 0.4 | 0.3 | −0.1 | 1.0 |
| Vratsa | 1.5 | 0.9 | 1.0 | 0.3 | 0.5 | 1.0 | 1.3 | 1.5 | 0.0 | 0.0 | 0.1 | 0.1 | 1.1 |
| Knezha | 1.1 | 0.5 | 0.7 | 0.1 | 0.2 | 0.7 | 1.1 | 1.4 | 0.2 | 0.2 | 0.1 | −0.4 | 1.5 |
| Oryahovo | 1.3 | 0.8 | 0.9 | 0.1 | 0.4 | 0.8 | 1.2 | 1.4 | 0.1 | 0.2 | 0.1 | −0.2 | 0.4 |
| Station/Month | I | II | III | IV | V | VI | VII | VIII | IX | X | XI | XII | Average |
|---|---|---|---|---|---|---|---|---|---|---|---|---|---|
| Pleven | 1.5 | 0.9 | 0.9 | 0.2 | 0.3 | 0.8 | 1.2 | 1.6 | 0.3 | 0.3 | 0.1 | 0.0 | 0.7 |
| Novachene | 1.5 | 0.9 | 0.8 | 0.1 | 0.3 | 0.9 | 1.3 | 1.7 | 0.2 | 0.4 | 0.5 | 0.0 | 0.7 |
| Nikolaevo | 1.7 | 1.0 | 1.0 | 0.4 | 0.4 | 0.8 | 1.2 | 1.5 | 0.5 | 0.8 | 0.4 | 0.2 | 0.8 |
| Borima | 1.3 | 0.7 | 0.6 | 0.3 | 0.7 | 0.7 | 1.1 | 1.4 | 0.2 | 0.2 | 0.2 | 0.0 | 0.6 |
| Dermatsi | 1.7 | 0.8 | 0.9 | 0.4 | 0.6 | 1.0 | 1.1 | 1.5 | 0.4 | 0.4 | 0.2 | −0.2 | 0.7 |
| Sevlievo | 1.1 | 0.5 | 0.7 | 0.4 | 0.8 | 1.1 | 1.3 | 1.6 | 0.6 | 0.9 | 0.4 | −0.3 | 0.8 |
| V.Tarnovo | 1.2 | 0.6 | 0.5 | 0.3 | 0.6 | 1.1 | 1.6 | 1.8 | 0.3 | 0.3 | 0.0 | −0.1 | 0.7 |
| Pavlikeni | 1.3 | 1.0 | 0.5 | 0.2 | 0.4 | 1.1 | 1.4 | 1.8 | 0.5 | 0.6 | 0.1 | −0.1 | 0.7 |
| Svitshov | 1.2 | 0.7 | 0.8 | 0.0 | 0.4 | 0.7 | 1.3 | 1.6 | 0.2 | 0.0 | −0.1 | −0.4 | 0.5 |
| Russe | 1.2 | 0.5 | 0.7 | 0.1 | 0.3 | 0.7 | 1.2 | 1.5 | 0.2 | 0.0 | 0.0 | −0.3 | 0.5 |
| Obr. Chiflik | 1.3 | 0.8 | 0.9 | 0.2 | 0.5 | 0.9 | 1.3 | 1.4 | 0.0 | 0.0 | 0.1 | −0.1 | 0.6 |
| Station/Month | I | II | III | IV | V | VI | VII | VIII | IX | X | XI | XII | Average |
|---|---|---|---|---|---|---|---|---|---|---|---|---|---|
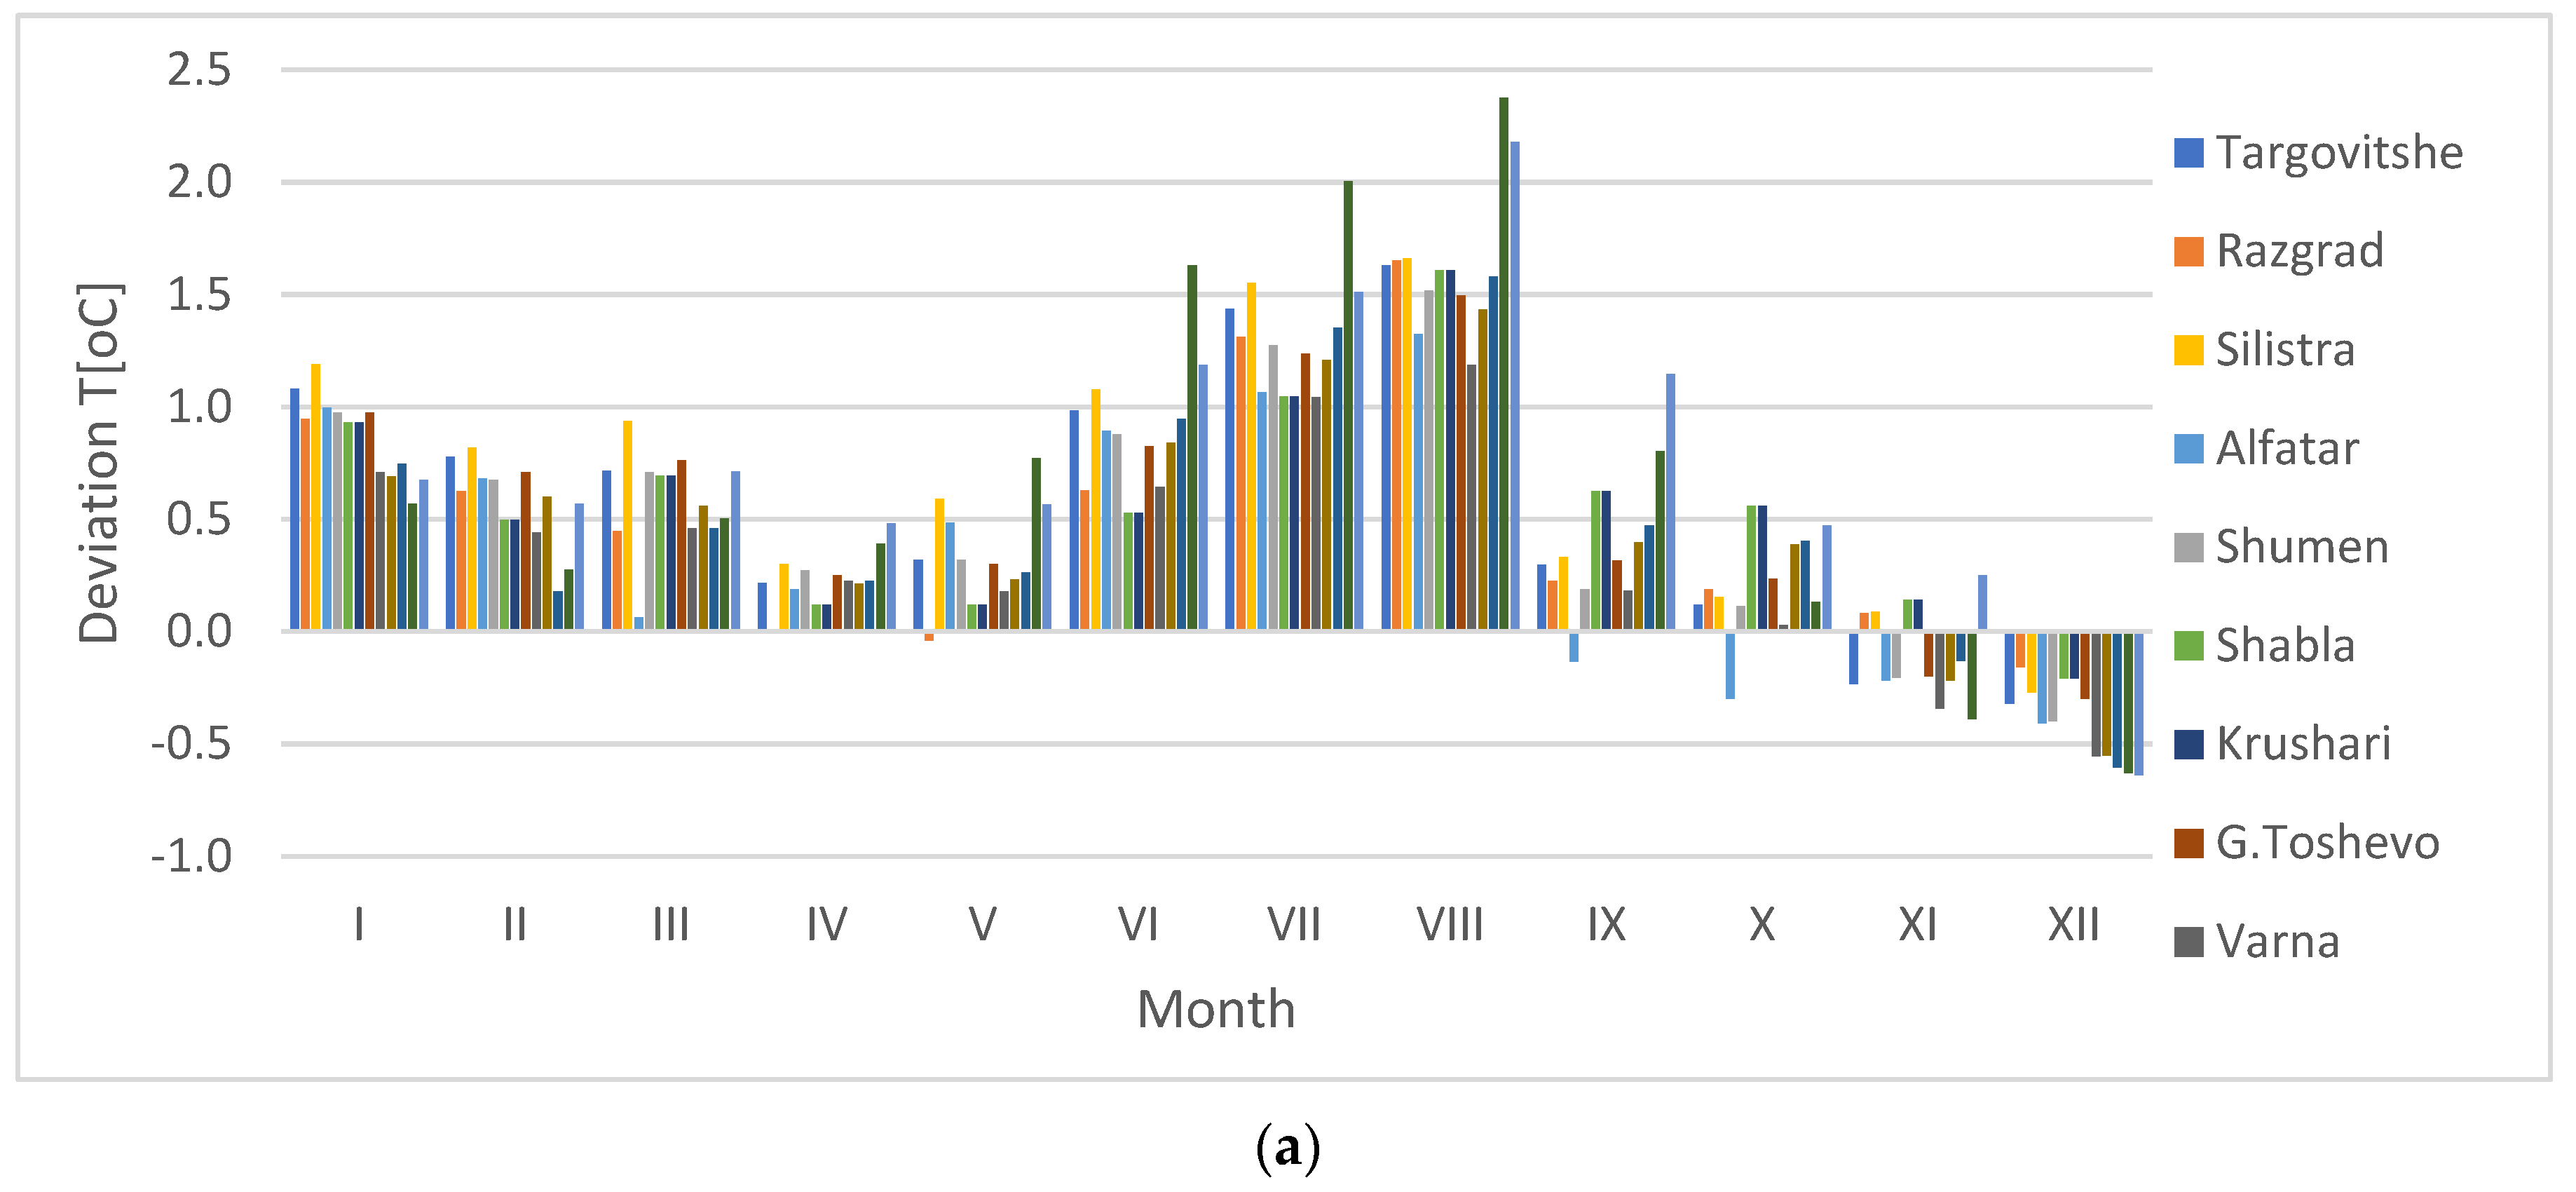
| Targovitshe | 1.1 | 0.8 | 0.7 | 0.2 | 0.3 | 1 | 1.4 | 1.6 | 0.3 | 0.1 | −0.2 | −0.3 | 0.6 |
| Razgrad | 0.9 | 0.6 | 0.4 | 0 | 0 | 0.6 | 1.3 | 1.7 | 0.2 | 0.2 | 0.1 | −0.2 | 0.5 |
| Silistra | 1.2 | 0.8 | 0.9 | 0.3 | 0.6 | 1.1 | 1.6 | 1.7 | 0.3 | 0.2 | 0.1 | −0.3 | 0.7 |
| Alfatar | 1.0 | 0.7 | 0.1 | 0.2 | 0.5 | 0.9 | 1.1 | 1.3 | −0.1 | −0.3 | −0.2 | −0.4 | 0.4 |
| Shumen | 1.0 | 0.7 | 0.7 | 0.3 | 0.3 | 0.9 | 1.3 | 1.5 | 0.2 | 0.1 | −0.2 | −0.4 | 0.5 |
| Shabla | 0.9 | 0.5 | 0.7 | 0.1 | 0.1 | 0.5 | 1.0 | 1.6 | 0.6 | 0.6 | 0.1 | −0.2 | 0.6 |
| Krushari | 0.9 | 0.5 | 0.7 | 0.1 | 0.1 | 0.5 | 1.0 | 1.6 | 0.6 | 0.6 | 0.1 | −0.2 | 0.6 |
| G. Toshevo | 1.0 | 0.7 | 0.8 | 0.3 | 0.3 | 0.8 | 1.2 | 1.5 | 0.3 | 0.2 | −0.2 | −0.3 | 0.6 |
| Varna | 0.7 | 0.4 | 0.5 | 0.2 | 0.2 | 0.6 | 1.0 | 1.2 | 0.2 | 0 | −0.3 | −0.6 | 0.3 |
| St. Oryahovo | 0.7 | 0.6 | 0.6 | 0.2 | 0.2 | 0.8 | 1.2 | 1.4 | 0.4 | 0.4 | −0.2 | −0.6 | 0.6 |
| G. Chiflik | 0.7 | 0.2 | 0.5 | 0.2 | 0.3 | 0.9 | 1.4 | 1.6 | 0.5 | 0.4 | −0.1 | −0.6 | 0.5 |
| Suvorovo | 0.6 | 0.3 | 0.5 | 0.4 | 0.8 | 1.6 | 2.0 | 2.4 | 0.8 | 0.1 | −0.4 | −0.6 | 0.5 |
| Dalgopol | 0.7 | 0.6 | 0.7 | 0.5 | 0.6 | 1.2 | 1.5 | 2.2 | 1.1 | 0.5 | 0.2 | −0.6 | 0.8 |
| Station/Month | I | II | III | IV | V | VI | VII | VIII | IX | X | XI | XII | Average |
|---|---|---|---|---|---|---|---|---|---|---|---|---|---|
| Karnobat | 0.7 | 0.5 | 0.6 | 0.3 | 0.4 | 0.9 | 1.4 | 1.5 | 0.4 | 0.5 | 0.0 | −0.4 | 0.6 |
| M. Tarnovo | 1.3 | 1.0 | 1.1 | 0.5 | 0.6 | 0.9 | 1.2 | 1.5 | 0.8 | 0.8 | 0.2 | 0.2 | 0.8 |
| Yambol | 0.4 | 0.4 | 0.5 | 0.1 | 0.4 | 1.0 | 1.5 | 1.9 | 0.6 | 0.5 | 0.3 | −0.6 | 0.6 |
| Elhovo | 0.7 | 0.4 | 0.4 | 0.1 | 0.2 | 0.8 | 1.1 | 1.3 | 0.3 | 0.5 | −0.1 | −0.4 | 0.4 |
| Sliven | 0.9 | 0.6 | 0.6 | 0.3 | 0.5 | 1.0 | 1.4 | 1.6 | 0.4 | 0.4 | 0.0 | −0.3 | 0.6 |
| Station/Month | I | II | III | IV | V | VI | VII | VIII | IX | X | XI | XII | Average |
|---|---|---|---|---|---|---|---|---|---|---|---|---|---|
| St. Zagora | 0.4 | 0.2 | 0.2 | 0.1 | 0.2 | 0.9 | 1.4 | 1.7 | 0.4 | 0.2 | −0.2 | −0.6 | 0.4 |
| Chirpan | 0.5 | 0.2 | 0.4 | 0.3 | 0.3 | 0.3 | 1.3 | 1.7 | 0.4 | 0.3 | −0.1 | −0.4 | 0.4 |
| Kazanlak | 0.9 | 0.4 | 0.5 | 0.2 | 0.5 | 1.0 | 1.7 | 1.9 | 0.7 | 0.6 | 0.1 | −0.4 | 0.7 |
| Haskovo | 0.6 | 0.4 | 0.4 | 0.1 | 0.4 | 1.0 | 1.6 | 1.9 | 0.5 | 0.3 | −0.2 | −0.5 | 0.6 |
| Kardzhali | 0.6 | 0.2 | 0.1 | −0.3 | −0.2 | 0.3 | 0.8 | 1.2 | 0.2 | 0.2 | −0.4 | −0.6 | 0.2 |
| Krumovgrad | 0.3 | 0.0 | 0.1 | −0.3 | −0.1 | 0.3 | 0.7 | 0.6 | 0.1 | 0.2 | −0.5 | −0.6 | 0.1 |
| Ivaylovgrad | 0.6 | 0.3 | 0.2 | −0.2 | −0.3 | 0.4 | 0.6 | 0.9 | −0.1 | 0.1 | −0.3 | −0.6 | 0.2 |
| Plovdiv | 0.9 | 0.3 | 0.6 | 0.3 | 0.5 | 1.0 | 1.4 | 1.8 | 0.6 | 0.5 | 0.1 | −0.3 | 0.6 |
| Sadovo | 0.8 | 0.3 | 0.6 | 0.3 | 0.5 | 1.0 | 1.3 | 1.6 | 0.4 | 0.4 | 0.1 | −0.3 | 0.6 |
| Asenovgrad | 0.6 | 0.4 | 0.5 | 0.3 | 0.6 | 0.9 | 1.4 | 1.9 | 0.3 | −0.1 | −0.2 | −0.4 | 0.5 |
| Karlovo | 0.9 | 0.5 | 0.6 | 0.0 | 0.2 | 0.7 | 0.9 | 1.4 | 0.1 | 0.1 | 0.0 | −0.3 | 0.6 |
| Pazardzhik | 0.9 | 0.2 | 0.4 | 0.1 | 0.3 | 0.8 | 1.2 | 1.5 | 0.5 | 0.5 | 0.0 | −0.3 | 0.5 |
| Station/Month | I | II | III | IV | V | VI | VII | VIII | IX | X | XI | XII | Average |
|---|---|---|---|---|---|---|---|---|---|---|---|---|---|
| Blagoevgrad | 0.7 | 0.3 | 0.4 | 0.2 | 0.4 | 1 | 1.4 | 1.7 | 0.3 | 0.5 | 0.3 | −0.2 | 0.6 |
| Sandanski | 0.7 | 0.5 | 0.5 | 0.2 | 0.4 | 1.1 | 1.4 | 1.6 | 0.3 | 0.3 | 0.3 | −0.1 | 0.6 |
| Petrich | 0.4 | 0.2 | 0.2 | −0.1 | 0.0 | 0.5 | 0.6 | 1.1 | 0.0 | 0.2 | 0.0 | −0.3 | 0.2 |
| Kyustendil | 0.3 | 0.0 | 0.1 | 0.0 | 0.2 | 0.6 | 1.1 | 1.4 | 0.2 | 0.3 | −0.1 | −0.4 | 0.3 |
| Sofia | 1.1 | 0.6 | 0.8 | 0.5 | 0.7 | 1.3 | 1.8 | 2.0 | 0.5 | 0.4 | 0.4 | −0.1 | 0.8 |
| Station/Month | I | II | III | IV | V | VI | VII | VIII | IX | X | XI | XII | Average |
|---|---|---|---|---|---|---|---|---|---|---|---|---|---|
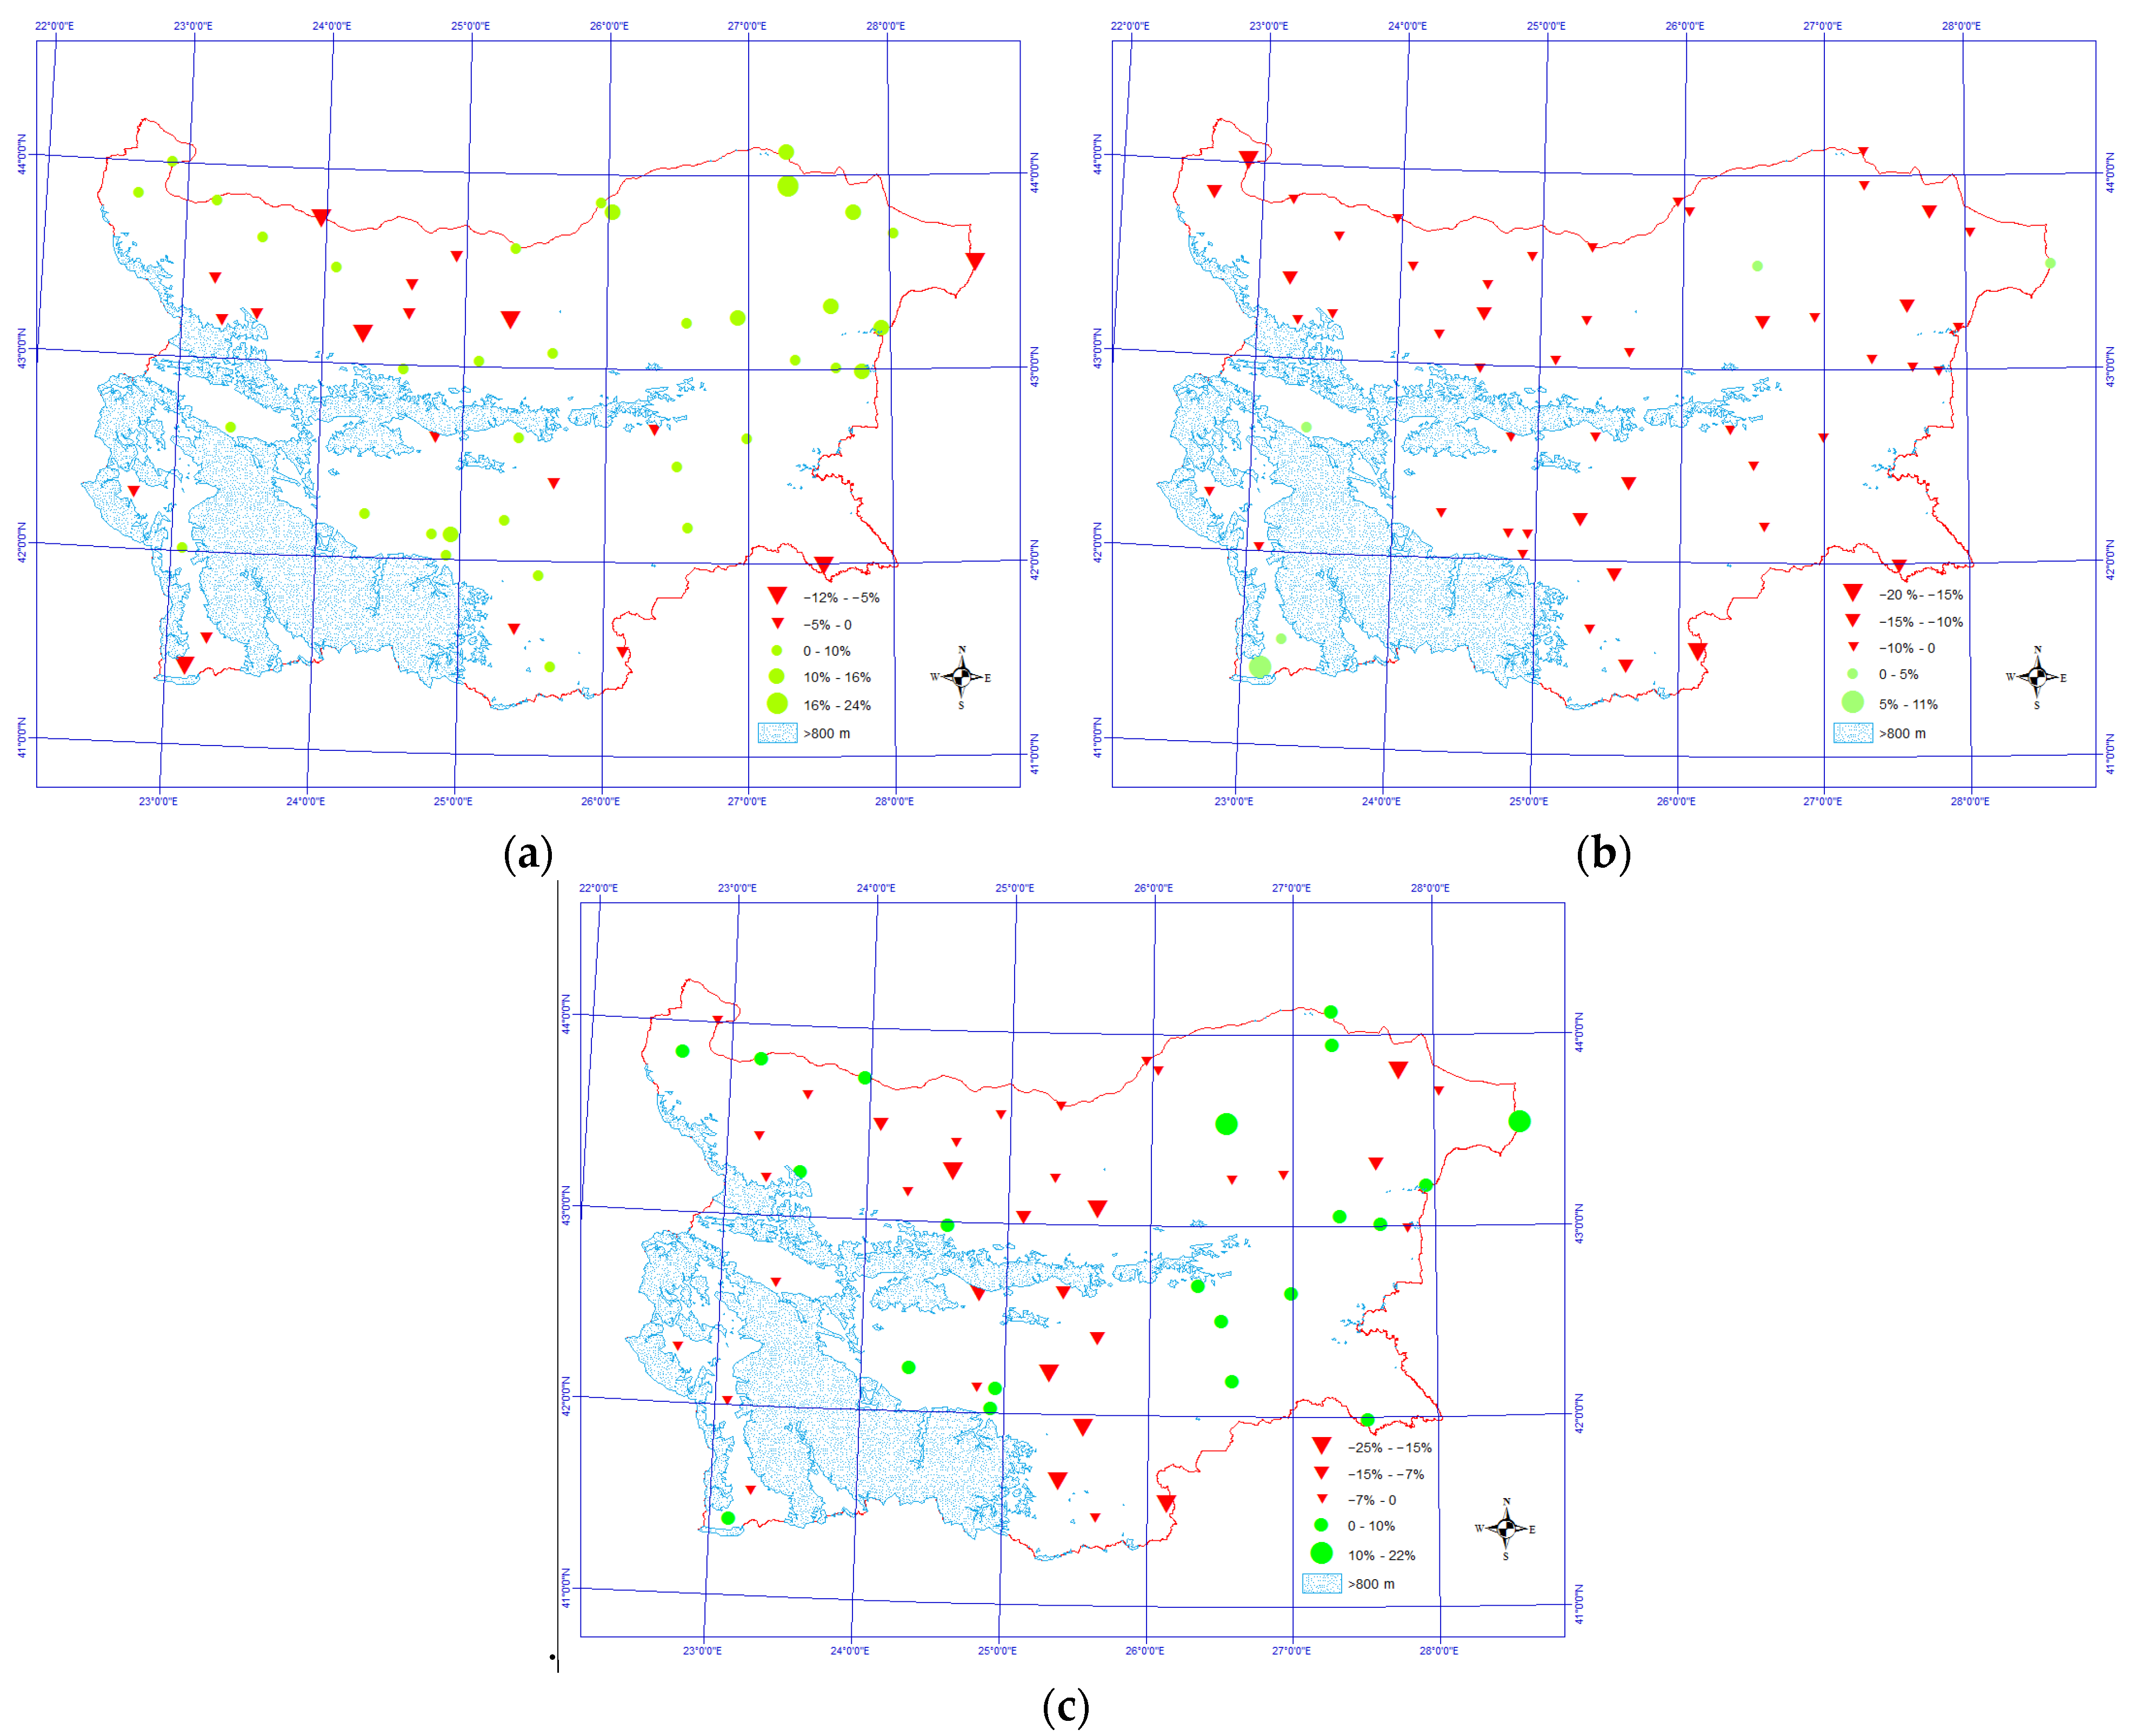
| Targovitshe | 2.0 | −4.2 | 0.4 | −4.6 | −6.8 | −11.9 | 2.6 | −1.6 | 32.2 | 22.3 | −0.8 | 2.0 | 31.7 |
| Razgrad | 1.2 | 6.9 | 8.8 | 4.1 | −0.1 | −1.0 | 11.2 | 8.4 | 26.6 | 24.4 | 5.0 | 6.8 | 102.4 |
| Silistra | 3.0 | −4.9 | 3.0 | 4.7 | −2.5 | −7.2 | 7.2 | 0.6 | 13.7 | 19.9 | −1.6 | 6.3 | 42.2 |
| Alfatar | 10.2 | −2.5 | 6.6 | −0.2 | −13.7 | 5.0 | 9.1 | −5.1 | 14.2 | 17.5 | −1.5 | 6.9 | 46.5 |
| Shumen | 8.9 | 1.5 | 5.8 | −2.6 | 1.6 | −7.4 | 4.3 | 2.2 | 27.6 | 14.1 | 0.3 | 5.7 | 62.0 |
| Shabla | −5.1 | −7.7 | −1.0 | 1.4 | −0.7 | 3.7 | 10.7 | 6.1 | 27.2 | 13.2 | −10.2 | −4.9 | 32.7 |
| Krushari | 5.0 | −6.0 | 6.7 | −4.0 | −7.4 | −10.9 | 2.5 | −21.6 | 20.0 | 10.9 | −0.1 | 8.6 | 3.8 |
| G. Toshevo | 4.9 | −7.3 | 4.1 | −1.3 | 2.0 | −2.6 | 8.6 | −6.8 | 23.5 | 17.3 | −5.7 | 3.9 | 40.7 |
| Varna | 5.2 | −4.6 | 7.9 | −0.7 | −2.9 | 1.5 | 8.8 | −0.1 | 18.4 | 18.9 | −5.1 | 5.9 | 53.3 |
| St. Oryahovo | −1.2 | −6.0 | 6.4 | −6.6 | 1.2 | −7.8 | −4.7 | 5.7 | 30.9 | 27.6 | −7.3 | 17.5 | 55.9 |
| G. Chiflik | −1.2 | −12.9 | 2.2 | −3.8 | −2.8 | −0.2 | 0.8 | 2.3 | 15.3 | 18.4 | −5.5 | 9.8 | 22.4 |
| Suvorovo | 6.6 | −3.7 | 6.5 | −6.7 | −7.6 | −1.5 | −3.7 | −6.9 | 14.7 | 23.3 | −3.0 | 2.6 | 20.5 |
| Dalgopol | 0.1 | −13.5 | 1.7 | −7.6 | −10.2 | 2.0 | 9.5 | −9.7 | 17.6 | 23.5 | −12.9 | 3.0 | 3.3 |
| Station/Month | I | II | III | IV | V | VI | VII | VIII | IX | X | XI | XII | Average |
|---|---|---|---|---|---|---|---|---|---|---|---|---|---|
| Karnobat | −1.3 | −2.2 | 10.7 | −5.3 | −1.7 | −5.5 | 1.0 | 12.1 | 11.2 | 22.1 | −6.6 | 2.6 | 37.2 |
| M. Tarnovo | −35.9 | −21.3 | −10.1 | −16.2 | −6.8 | −6.4 | 15.4 | 3.1 | 11.5 | 20.0 | −4.0 | −18.9 | −69.7 |
| Yambol | 2.9 | −3.6 | 10.0 | −7.0 | −4.3 | −4.0 | 12.0 | −7.2 | 11.3 | 9.5 | −6.8 | −0.5 | 12.4 |
| Elhovo | −6.9 | −1.6 | 1.2 | −0.9 | −5.6 | 1.7 | 1.0 | −1.6 | 18.7 | 20.1 | −3.9 | 2.7 | 24.8 |
| Sliven | −1.1 | −2.3 | 5.1 | −5.0 | −2.8 | 1.8 | −4.7 | 3.2 | 16.9 | 6.6 | −11.5 | −1.2 | 5.0 |
| Station/Month | I | II | III | IV | V | VI | VII | VIII | IX | X | XI | XII | Average |
|---|---|---|---|---|---|---|---|---|---|---|---|---|---|
| St. Zagora | −3.6 | −1.1 | 3.1 | −6.5 | −4.3 | −7.2 | −0.5 | −7.8 | 11.4 | 0.8 | −7.7 | −0.6 | −24.0 |
| Chirpan | −4.0 | −1.7 | 5.5 | −6.6 | −7.6 | −11.7 | 3.3 | −15.9 | 18.0 | 8.2 | −10.2 | 2.4 | −20.3 |
| Kazanlak | 1.5 | 1.0 | 0.3 | −2.5 | −5.0 | 2.2 | −5.5 | −9.8 | 16.3 | 9.1 | −5.7 | 6.2 | 8.0 |
| Haskovo | −2.8 | 7.1 | 2.1 | −7.4 | −3.1 | −13.6 | 0.0 | −10.0 | 8.5 | 13.9 | −5.4 | 2.5 | −8.2 |
| Karfzhali | −5.1 | 4.3 | 3.2 | −1.8 | 0.5 | −7.5 | −8.6 | −8.0 | 11.4 | 1.9 | −10.5 | −1.9 | −22.1 |
| Krumovgrad | −3.8 | −0.2 | −0.2 | −8.2 | −11.6 | −3.4 | −3.2 | −0.3 | 12.8 | 9.8 | 12.0 | −9.8 | −6.1 |
| Ivajlovgrad | −3.9 | −2.8 | −6.4 | −9.7 | −5.7 | −18.6 | −6.9 | −3.2 | 2.2 | 15.2 | 2.1 | −4.5 | −42.3 |
| Plovdiv | −2.5 | 0.9 | 7.8 | −3.4 | −9.6 | −2.9 | −3.8 | −0.2 | 9.9 | 12.0 | −7.6 | 5.1 | 6.0 |
| Sadovo | 1.9 | 5.6 | 7.0 | 0.6 | −7.3 | −7.6 | 0.4 | 8.8 | 9.4 | 12.5 | −5.0 | 8.1 | 34.5 |
| Asenovgrad | −3.3 | 5.6 | 5.5 | 0.1 | −6.0 | −1.5 | 4.6 | 8.4 | 11.7 | 13.6 | −10.1 | 5.9 | 34.7 |
| Karlovo | −2.0 | −1.4 | −2.2 | 5.5 | −5.2 | −3.1 | −1.6 | −27.0 | 10.4 | 11.2 | −8.6 | 2.2 | −21.9 |
| Pazardzhik | −1.4 | 1.7 | 1.7 | −4.8 | −6.8 | 9.8 | −1.3 | −0.3 | 8.2 | 11.6 | −13.3 | 5.6 | 10.7 |
| Station/Month | I | II | III | IV | V | VI | VII | VIII | IX | X | XI | XII | Average |
|---|---|---|---|---|---|---|---|---|---|---|---|---|---|
| Blagoevgrad | 1.3 | 1.0 | 3.9 | 6.9 | −8.4 | −2.4 | 2.3 | −4.9 | 15.0 | 19.3 | −12.2 | 11.3 | 33.1 |
| Sandanski | −2.1 | −3.5 | −2.0 | 3.2 | −3.6 | 4.7 | −0.1 | −5.5 | 12.8 | 14.8 | −18.6 | 6.8 | 6.9 |
| Petrich | −10.7 | −12.3 | 3.6 | 12.7 | 3.7 | −0.9 | 4.3 | 3.0 | 12.8 | 17.1 | −23.7 | −1.9 | 7.8 |
| Kyustendil | −4.8 | −4.1 | −2.5 | 2.9 | −9.8 | 2.3 | −6.1 | −1.4 | 8.2 | 16.1 | −16.6 | 0.8 | −15.0 |
| Sofia | 6.4 | 2.0 | 2.8 | 1.0 | −0.1 | −0.4 | −7.5 | 5.7 | 16.7 | 17.0 | −10.3 | 1.2 | 34.4 |
| Station/Month | I | II | III | IV | V | VI | VII | VIII | IX | X | XI | XII | Average |
|---|---|---|---|---|---|---|---|---|---|---|---|---|---|
| Vidin | 1.9 | −1.1 | −5.9 | −4.3 | −8.5 | −16.0 | 7.7 | 6.1 | 8.1 | 9.1 | −8.2 | 6.3 | −4.8 |
| Gramada | 7.8 | −2.2 | −5.1 | 0.6 | −15.0 | −13.0 | 6.1 | 11.9 | 9.1 | 8.4 | −4.5 | 13.0 | 17.0 |
| Montana | 0.8 | −1.7 | 1.4 | 2.4 | −13.5 | −18.8 | 4.5 | 3.9 | 8.7 | 9.2 | −14.6 | 2.0 | −15.6 |
| D-r Josifovo | 1.1 | −7.0 | −2.5 | 6.0 | −1.6 | −18.0 | 5.8 | 0.6 | 11.9 | 16.6 | −11.4 | 2.7 | 4.1 |
| Bazovets | 2.6 | −2.4 | −2.1 | −0.2 | −6.0 | −7.6 | 2.3 | −1.6 | 10.8 | 12.6 | −9.7 | 0.1 | −1.1 |
| Lom | 3.1 | −0.9 | −1.5 | 5.8 | 3.4 | −12.2 | 18.2 | 6.3 | 12.0 | 8.4 | −10.4 | 3.0 | 35.2 |
| Vratsa | −0.2 | −0.1 | −3.8 | 7.5 | −10.0 | −15.6 | −0.3 | 25.7 | 9.9 | 16.7 | −14.7 | −0.5 | 14.7 |
| Knezha | 1.2 | −0.3 | −0.4 | 4.8 | −5.6 | −13.2 | 3.4 | −9.8 | 8.8 | 13.5 | −12.8 | 2.7 | −7.6 |
| Oryahovo | −2.7 | −4.4 | −5.0 | 3.3 | 3.7 | −8.6 | 6.3 | 3.5 | 8.8 | 10.2 | −11.5 | 0.0 | 3.6 |
| Station/Month | I | II | III | IV | V | VI | VII | VIII | IX | X | XI | XII | Average |
|---|---|---|---|---|---|---|---|---|---|---|---|---|---|
| Pleven | −6.4 | −3.7 | 3.0 | 4.2 | −4.6 | −16.7 | 10.6 | −6.7 | 11.3 | 11.4 | −12.9 | 1.7 | −8.9 |
| Novachene | 0.2 | −1.8 | −4.0 | 0.8 | −5.1 | 3.4 | 7.1 | −11.1 | 13.1 | 13.1 | −10.7 | 1.7 | 6.7 |
| Nikolaevo | −5.4 | −5.7 | 2.3 | 2.5 | −12.1 | −23.0 | 3.3 | −17.4 | 12.3 | 14.6 | −10.4 | 1.8 | −37.2 |
| Borima | −2.8 | −3.8 | 7.1 | −0.6 | 1.4 | −2.7 | 15.9 | −11.7 | 12.1 | 19.2 | −14.2 | 4.0 | 24.0 |
| Dermatsi | −12.9 | −7.1 | −1.8 | −6.2 | −4.2 | −3.7 | 1.8 | −7.4 | 7.1 | 13.6 | −10.0 | −4.7 | −35.4 |
| Sevlievo | −4.7 | −0.7 | 5.6 | −8.6 | −4.9 | −7.2 | −3.6 | −9.3 | 23.8 | 12.3 | −6.7 | 2.4 | −1.7 |
| V.Tarnovo | −9.2 | −4.8 | 2.3 | −2.8 | −2.9 | −16.9 | −1.9 | −14.4 | 19.1 | 15.0 | −7.4 | 6.6 | −17.4 |
| Pavlikeni | −10.8 | −7.1 | −4.6 | −1.8 | −2.8 | −11.0 | 12.3 | −13.1 | 17.8 | 10.7 | −9.3 | −0.1 | −19.7 |
| Svitshov | −2.5 | −0.8 | −0.8 | 0.9 | −9.0 | −0.8 | 3.0 | −6.8 | 11.8 | 18.2 | −8.0 | 2.6 | 7.8 |
| Russe | −5.6 | −5.7 | −2.3 | −6.0 | 2.0 | −7.8 | 0.4 | −3.7 | 15.4 | 20.6 | −6.1 | 5.9 | 7.1 |
| Obr. Chiflik | 0.2 | 0.3 | 3.1 | −7.1 | −5.0 | −1.8 | 6.5 | −8.3 | 12.7 | 20.9 | −0.9 | 8.9 | 29.6 |
Publisher’s Note: MDPI stays neutral with regard to jurisdictional claims in published maps and institutional affiliations. |
© 2022 by the authors. Licensee MDPI, Basel, Switzerland. This article is an open access article distributed under the terms and conditions of the Creative Commons Attribution (CC BY) license (https://creativecommons.org/licenses/by/4.0/).
Share and Cite
Georgieva, V.; Kazandjiev, V.; Bozhanova, V.; Mihova, G.; Ivanova, D.; Todorovska, E.; Uhr, Z.; Ilchovska, M.; Sotirov, D.; Malasheva, P. Climatic Changes—A Challenge for the Bulgarian Farmers. Agriculture 2022, 12, 2090. https://doi.org/10.3390/agriculture12122090
Georgieva V, Kazandjiev V, Bozhanova V, Mihova G, Ivanova D, Todorovska E, Uhr Z, Ilchovska M, Sotirov D, Malasheva P. Climatic Changes—A Challenge for the Bulgarian Farmers. Agriculture. 2022; 12(12):2090. https://doi.org/10.3390/agriculture12122090
Chicago/Turabian StyleGeorgieva, Veska, Valentin Kazandjiev, Violeta Bozhanova, Galina Mihova, Dafinka Ivanova, Elena Todorovska, Zlatina Uhr, Mima Ilchovska, Dimitar Sotirov, and Petia Malasheva. 2022. "Climatic Changes—A Challenge for the Bulgarian Farmers" Agriculture 12, no. 12: 2090. https://doi.org/10.3390/agriculture12122090
APA StyleGeorgieva, V., Kazandjiev, V., Bozhanova, V., Mihova, G., Ivanova, D., Todorovska, E., Uhr, Z., Ilchovska, M., Sotirov, D., & Malasheva, P. (2022). Climatic Changes—A Challenge for the Bulgarian Farmers. Agriculture, 12(12), 2090. https://doi.org/10.3390/agriculture12122090