Article

Effect of Nutrient Management on Soil Carbon Quantities, Qualities, and Stock under Rice-Wheat Production System

1
ICAR-Indian Agricultural Research Institute (ICAR-IARI), New Delhi 110012, India
2
Department of Soil Science, Sugarcane Research Institute, Dr. Rajendra Prasad Central Agricultural University (RPCAU), Pusa, Samastipur 848125, India
3
ICAR-National Bureau of Soil Survey and Land Use Planning (ICAR-NBSS & LUP), Nagpur 440033, India
4
ICAR-Central Research Institute for Dryland Agriculture (ICAR-CRIDA), Hyderabad 500059, India
5
ICAR-Indian Institute of Farming Systems Research (ICAR-IIFSR), Modipuram Meerut 250110, India
6
ICAR-Vivekananda Parvatiya Krishi Anusandhan Sansthan (ICAR-VPKAS), Almora 263601, India
7
CIMMYT-Borlaug Institute for South Asia (BISA), Samastipur 848125, India
*
Author to whom correspondence should be addressed.
Agriculture 2022, 12(11), 1822; https://doi.org/10.3390/agriculture12111822
Submission received: 22 August 2022 / Revised: 21 September 2022 / Accepted: 27 September 2022 / Published: 1 November 2022
(This article belongs to the Special Issue Soil Organic Matter and Its Role in Soil Fertility)

Abstract

:
The nutrient management options have been contemplated to be sustainable strategies to sustain rice-wheat production systems and a conceivable option to maintain soil organic carbon (SOC) in soil systems. We hypothesized that carbon fraction could be a critical factor in improving carbon storage in cereal-based production systems. The results suggested that the adoption of IPNS legumes (berseem and cowpea), STCR, and OF improved SOC concentrations. It was observed that significantly higher (57%) contribution in carbon concentration very labile carbon (VLC) was trailed by the non-labile carbon (NLC, 23%), labile carbon (LC, 12%), and less labile carbon (LLC 8%) in the surface soil layer. Results showed that carbon stock varied from 11.73 to 18.39 and 9.95 to 11.75 t ha−1 in the surface and subsurface soil depths, respectively, and significantly higher carbon stock was maintained in OF in both soil depths over the other nutrient management practices. Results showed that for the surface layer C-stocks registered in the following order (0–15 cm soil depth) OF (18.39 t ha−1) > IPNS + C (17.54 t ha−1) > IPNS + B (17.26 t ha−1) > IPNS (16.86 t ha−1) > STCR (15.54 t ha−1) > NPK (15.32 t ha−1) and unfertilized control (11.73 t ha−1). Overall, results suggested that the adoption of IPNS options addition of legumes significantly enhanced all carbon pools.

Graphical Abstract

1. Introduction

Land degradation is a major concern of the current century; more than 33% of the area globally comes under degraded land. Recognizing this fact, United Nations (UN) Decade on Ecosystem Restoration is being celebrated from 2021 to 2030 [1]. Global climate change and feeding the rapidly growing population are the greatest challenges to reaching the UN Sustainable Development Goals (SDGs) for modern agriculture food production system. The estimated atmospheric concentration of carbon dioxide (CO2) on 11 January 2022 at 417.16 parts per million by volume (ppmv) stands for an increase of 0.59% (2.44 ppmv) over the one-year 11 January 2021 (415.17 ppmv). Best management practices are important to counterpart these problems by managing the food production system, restoration of degraded soil, and carbon management to meet the UN-SDGs and Paris climate treaty pledges [1,2,3], and restoring the ecosystem is appropriate to meet the UN-SDGs (zero hunger, climate action, life on land), this will allow an agricultural solution to these emerging issues [4].
The terrestrial soil systems have the largest capacity to capture double as much CO2 in the atmosphere [5,6,7], with an expected one-meter (100 cm) soil depth soil carbon storage (1462–1584 Pg) [8]. Significant loss of SOC and increased CO2 emission by the adoption of intensive land use changes (LUC) and management technologies [1,9,10,11]. Natural grass and forest land have more carbon-storge potential as compared to cultivated land [12,13].
Mitigating the climate change issue requires a decrease in CO2 concentrations, which could help to achieve soil and environmental sustainability [1,4], and COP21 in Paris (2015) aims to increase SOC stocks by adopting improved management practices in the agricultural food production system [3,14].
Long-run integration of nutrients (organic manure and chemical/mineral fertilizers) had a significant effect on soil sustainability [15,16], and it plays a significant role in improving soil [17] and environmental sustainability [14]. The adoption of integrated plant nutrition system (IPNS) options could help to restore the soil systems. The use of crop residue also could increase carbon storage, which enhances higher carbon storage in the agroecosystem. Crop residues kept as mulch on the soil have effects on the soil-related structural components and processes of the agroecosystem [18,19]. Furthermore, organic manure, which may be bulky organic manures and concentrated organic manures, and the inclusion of legumes in production systems enhance soil organic matter (SOM) concentration, maintain rhizospheric microbes and improve soil sustainability [19,20]. Adoption of integrated nutrient management options helps to improve soil structure [21,22,23,24]. Soil carbon management may be affected by different management practices during crop production (Figure 1).
Long-rung rice-wheat production system experiments provide prospects to know the long-run changes in carbon concentration and storage, yield stability, soil [4], and environmental sustainability [22,24,25,26]. Thus, its maintenance in agriculture soil system through various management practices such as IPNS, soil test crop response (STCR), and the addition of legumes has improved soil productivity and sustainability.
Some fundamental questions and state-of-the-art remain unexplored, such as (i) the general importance of soil carbon in the context of mitigating climate change; (ii) how and where soil carbon concentrations may change, and how stable (“permanent”) any accrued carbon may be, as well as how carbon fractionation may help on understanding carbon permanence in soils; (iii) importance of nutrient management strategies for the system under study; and (iv) how (i–iii) may lead to a better understanding of additional soil carbon accrual and permanence (sequestration) as dependent of nutrient management strategies in the system studied. Consequently, the adoption of long-run IPNS options was tested to appraise its impact on carbon dynamics. We hypothesized that carbon fraction could be a critical factor for improving carbon storage with these objectives: (i) to quantify the carbon fractions and (ii) to measure the best treatment combination.

2. Materials and Methods

2.1. Study Area and Site Characteristics

The selected field experiment site of ICAR-IIFSR (https://iifsr.icar.gov.in/icar-iifsr/ accessed on 1 September 2022) Modipuram Meerut (India) for this study, and initial soil characteristics and climatic conditions were presented in [27].

2.2. Experimental Design and Nutrient Management

The long-term rice-wheat production system trial was established in 1998 [27] in randomized block design (RBD) with four replications. The long-term cropping system experiment at an involving different nutrient supply options under rice-wheat rotation. A total of seven nutrient management practices were tested (Figure 2).

2.3. Soil Carbon Pool Analysis

Walkley–Black carbon [28] total soil carbon was analyzed by CHN (carbon, hydrogen, and nitrogen) analyzer. Soil microbial biomass carbon [29] and SOC pools [28,30] were analyzed (Figure 3).
Soil microbial biomass carbon concentrations (SMB-C) were calculated using the following equation:
S o i l   M i c r o b i a l   B i o m a s s   C a r b o n   ( C ) = C   i n   f u m i g a t e d   s o i l C   i n   n o n f u m i g a t e d   s o i l × k
where ‘k’ is the correction factor, which quantifies the fractions of killed biomass extracted as C under standardized conditions
K M n O 4 C   ( g   k g 1 ) = [ ( m M   B l a n k m   M   S a m p l e ) × 25 × 25 × 9 ]   W e i g h t   o f   S a m p l e   ( g ) × 1000
Carbon stock of a soil depth (t ha−1) = Total Carbon concentration (%) × bulk density (Mg m−3) × depth (cm)

2.4. Data Analysis

Data were processed using analysis of variance (ANOVA) and Duncan’s multiple range test (DMRT) [31].

3. Results and Discussion

3.1. Walkley and Black Carbon (WBC)

Data showed that the WBC content under different treatments varied significantly (Figure 4) in both soil depths, and it was in the range of 3.33 to 7.42 (0–15 cm) and 2.65 to 5.24 g C kg−1 (15–30 cm). The significantly higher WBC content was seen with OF and IPNS + C values of WBC was 7.42 and 5.24 g C kg−1 in the surface and subsurface soil, respectively. Results revealed that the significantly highest WBC concentration was reported in OF (7.42 g C kg−1) treatment trailed by IPNS + C (6.49 g C kg−1), IPNS + B (6.44 g C kg−1), IPNS (6.25 g C kg−1), STCR (5.25 g C kg−1), NPK (5.22 g C kg−1) and lowest concentration was observed in the unfertilized control (3.37 g C kg−1) plot in the 0–15 cm soil depth. However, in case of subsurface soil layer significantly higher WBC was found in following order IPNS + C > IPNS + B > IPNS > OF > STCR > NPK and control plot. Plots with the adoption of organic farming management practices (OF) and IPNS + C showed the largest build-up of WBC and the lowest value in control. Plot with NPK had higher WBC than unbalanced fertilization and control in both the soil depth (Figure 4).
OF treatment showed substantial dominance over the rest of the combinations in 0–15 cm soil depth. Although, in the case of 15–30 cm soil depth, it was with IPNS + C/IPNS + B. OF plot had +45% higher amount of WBC as compared to unfertilized treatment. Nevertheless, the concentration of WBC was higher (+18%) in 0–15 cm than in 15–30 cm (Figure 4). The lower concentration of WBC in control and sole application of chemical fertilizer might be due to less biomass returning compared to judicious application of organic and inorganics [20,32]. Meanwhile, higher WBC in IPNS options over the indiscriminate use of fertilization [33]. However, higher WBC concentration is due to a balanced supply of FYM and the inclusion of legumes [34,35].

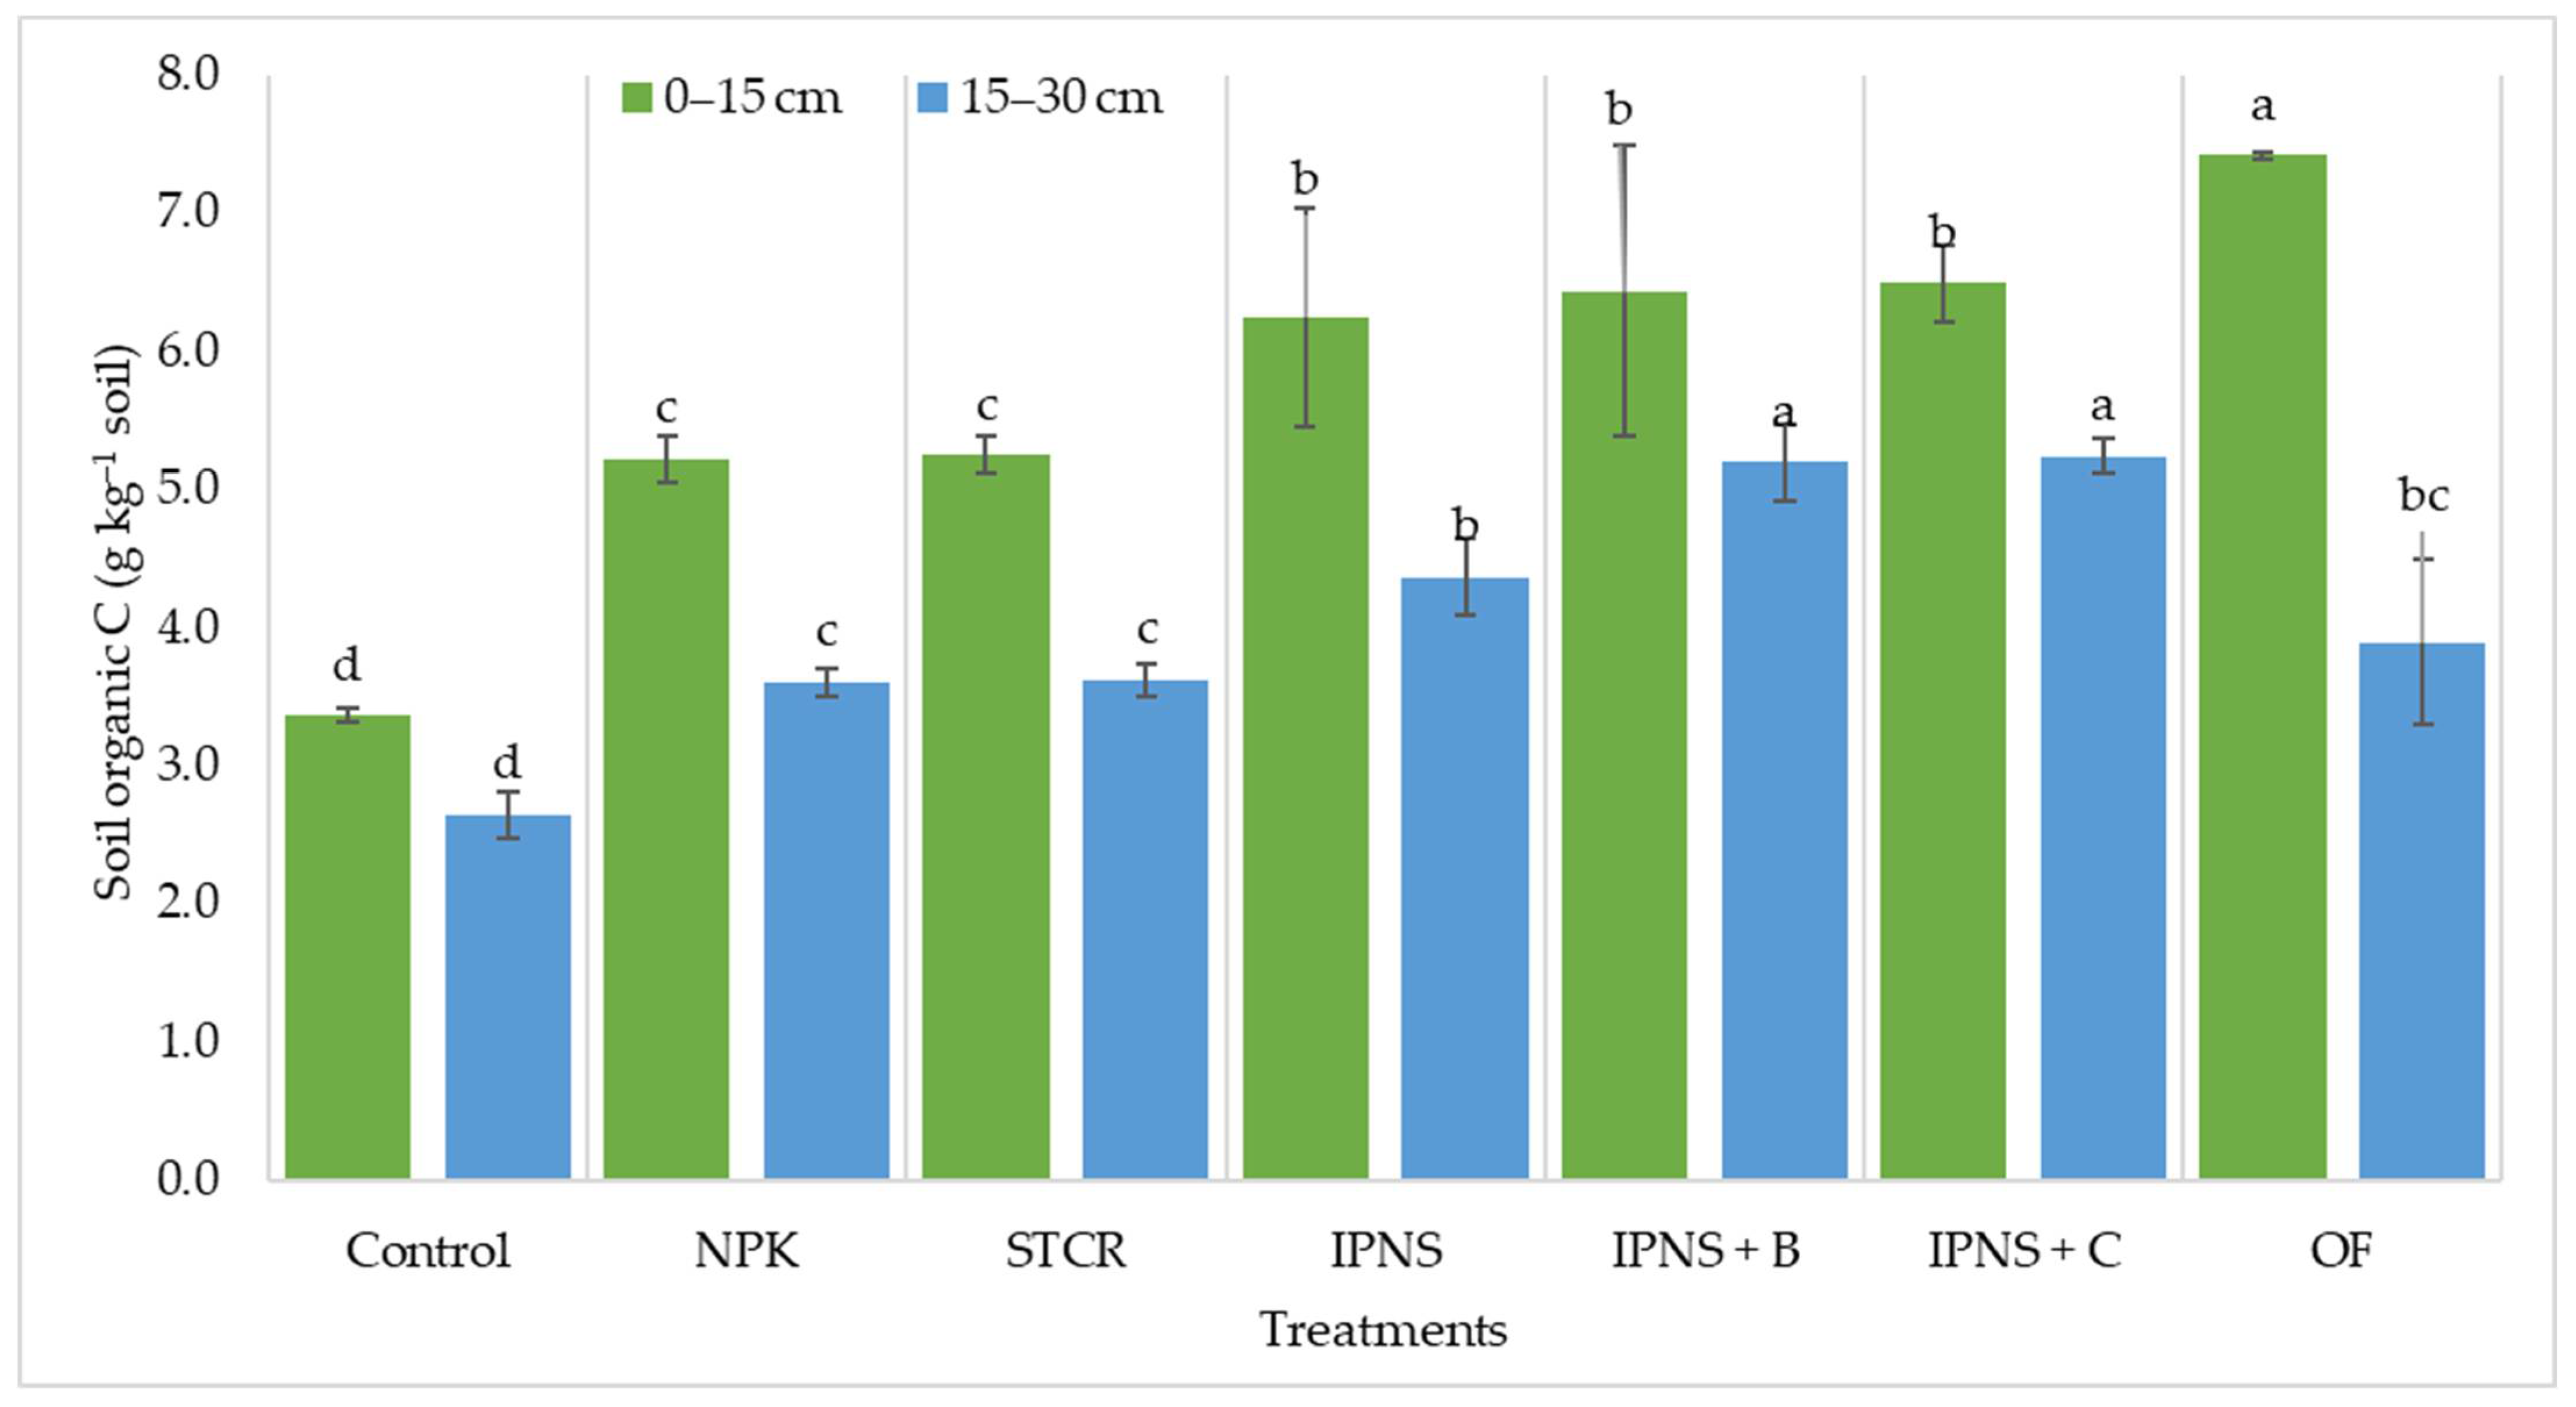
3.2. Total Organic Carbon (TOC)

Results showed that the adoption of improved management practices build-up the TOC concentration over the unfertilized control plot after harvest (Table 1 and Table 2). Outcomes displayed that the concentration of TOC was significantly diverse after 5.25 to 8.88 and 4.36 to 6.98 g C kg−1 in different treatments (Table 1). Significantly higher TOC content was witnessed in the OF (8.88 g C kg−1)-treated plot; it was at par with IPNS + C (8.35 g C kg−1) and IPNS + B (8.22 g C kg−1), followed by the IPNS (7.92 g C kg−1), STCR (6.77 g C kg−1), NPK (6.68 g C kg−1) and unfertilized control (5.25 g C kg−1) plot in the 0–15 cm soil depth. However, in the case of the subsurface (15–30 cm) soil layer maximum was recorded with IPNS + C (6.98 g C kg−1) and IPNS + B (6.73 g C kg−1), followed by the IPNS (6.12 g C kg−1), and it was at par with the OF (5.68 g C kg−1), STCR (5.18 g C kg−1), NPK (5.13 g C kg−1) and control (4.36 g C kg−1). It was reported that the TOC concentration increased significantly by ~21 and 38% as compared to the first (starting of the experiment) under 0–15 and 15–30 cm soil depth, respectively.
Plots with the application of IPNS with legumes (cowpea and berseem) significantly influenced TOC concentration as compared to the rest of the treatment except organic farming management. In surface soil, the OF-treated plot showed its significant dominance over the rest of the treatment combination; it was ~40% advanced TOC concentration over the unfertilized control plot (5.25 g C kg−1). However, in the case of subsurface soil depth, it was maximum with IPNS + C/IPNS + B. It was ~23% higher as compared to the control plot (4.36 g C kg−1) (Table 2). Earlier researchers have set up that the application of organic manure in soil enhances C store than to that of chemical fertilization [4,24,36].

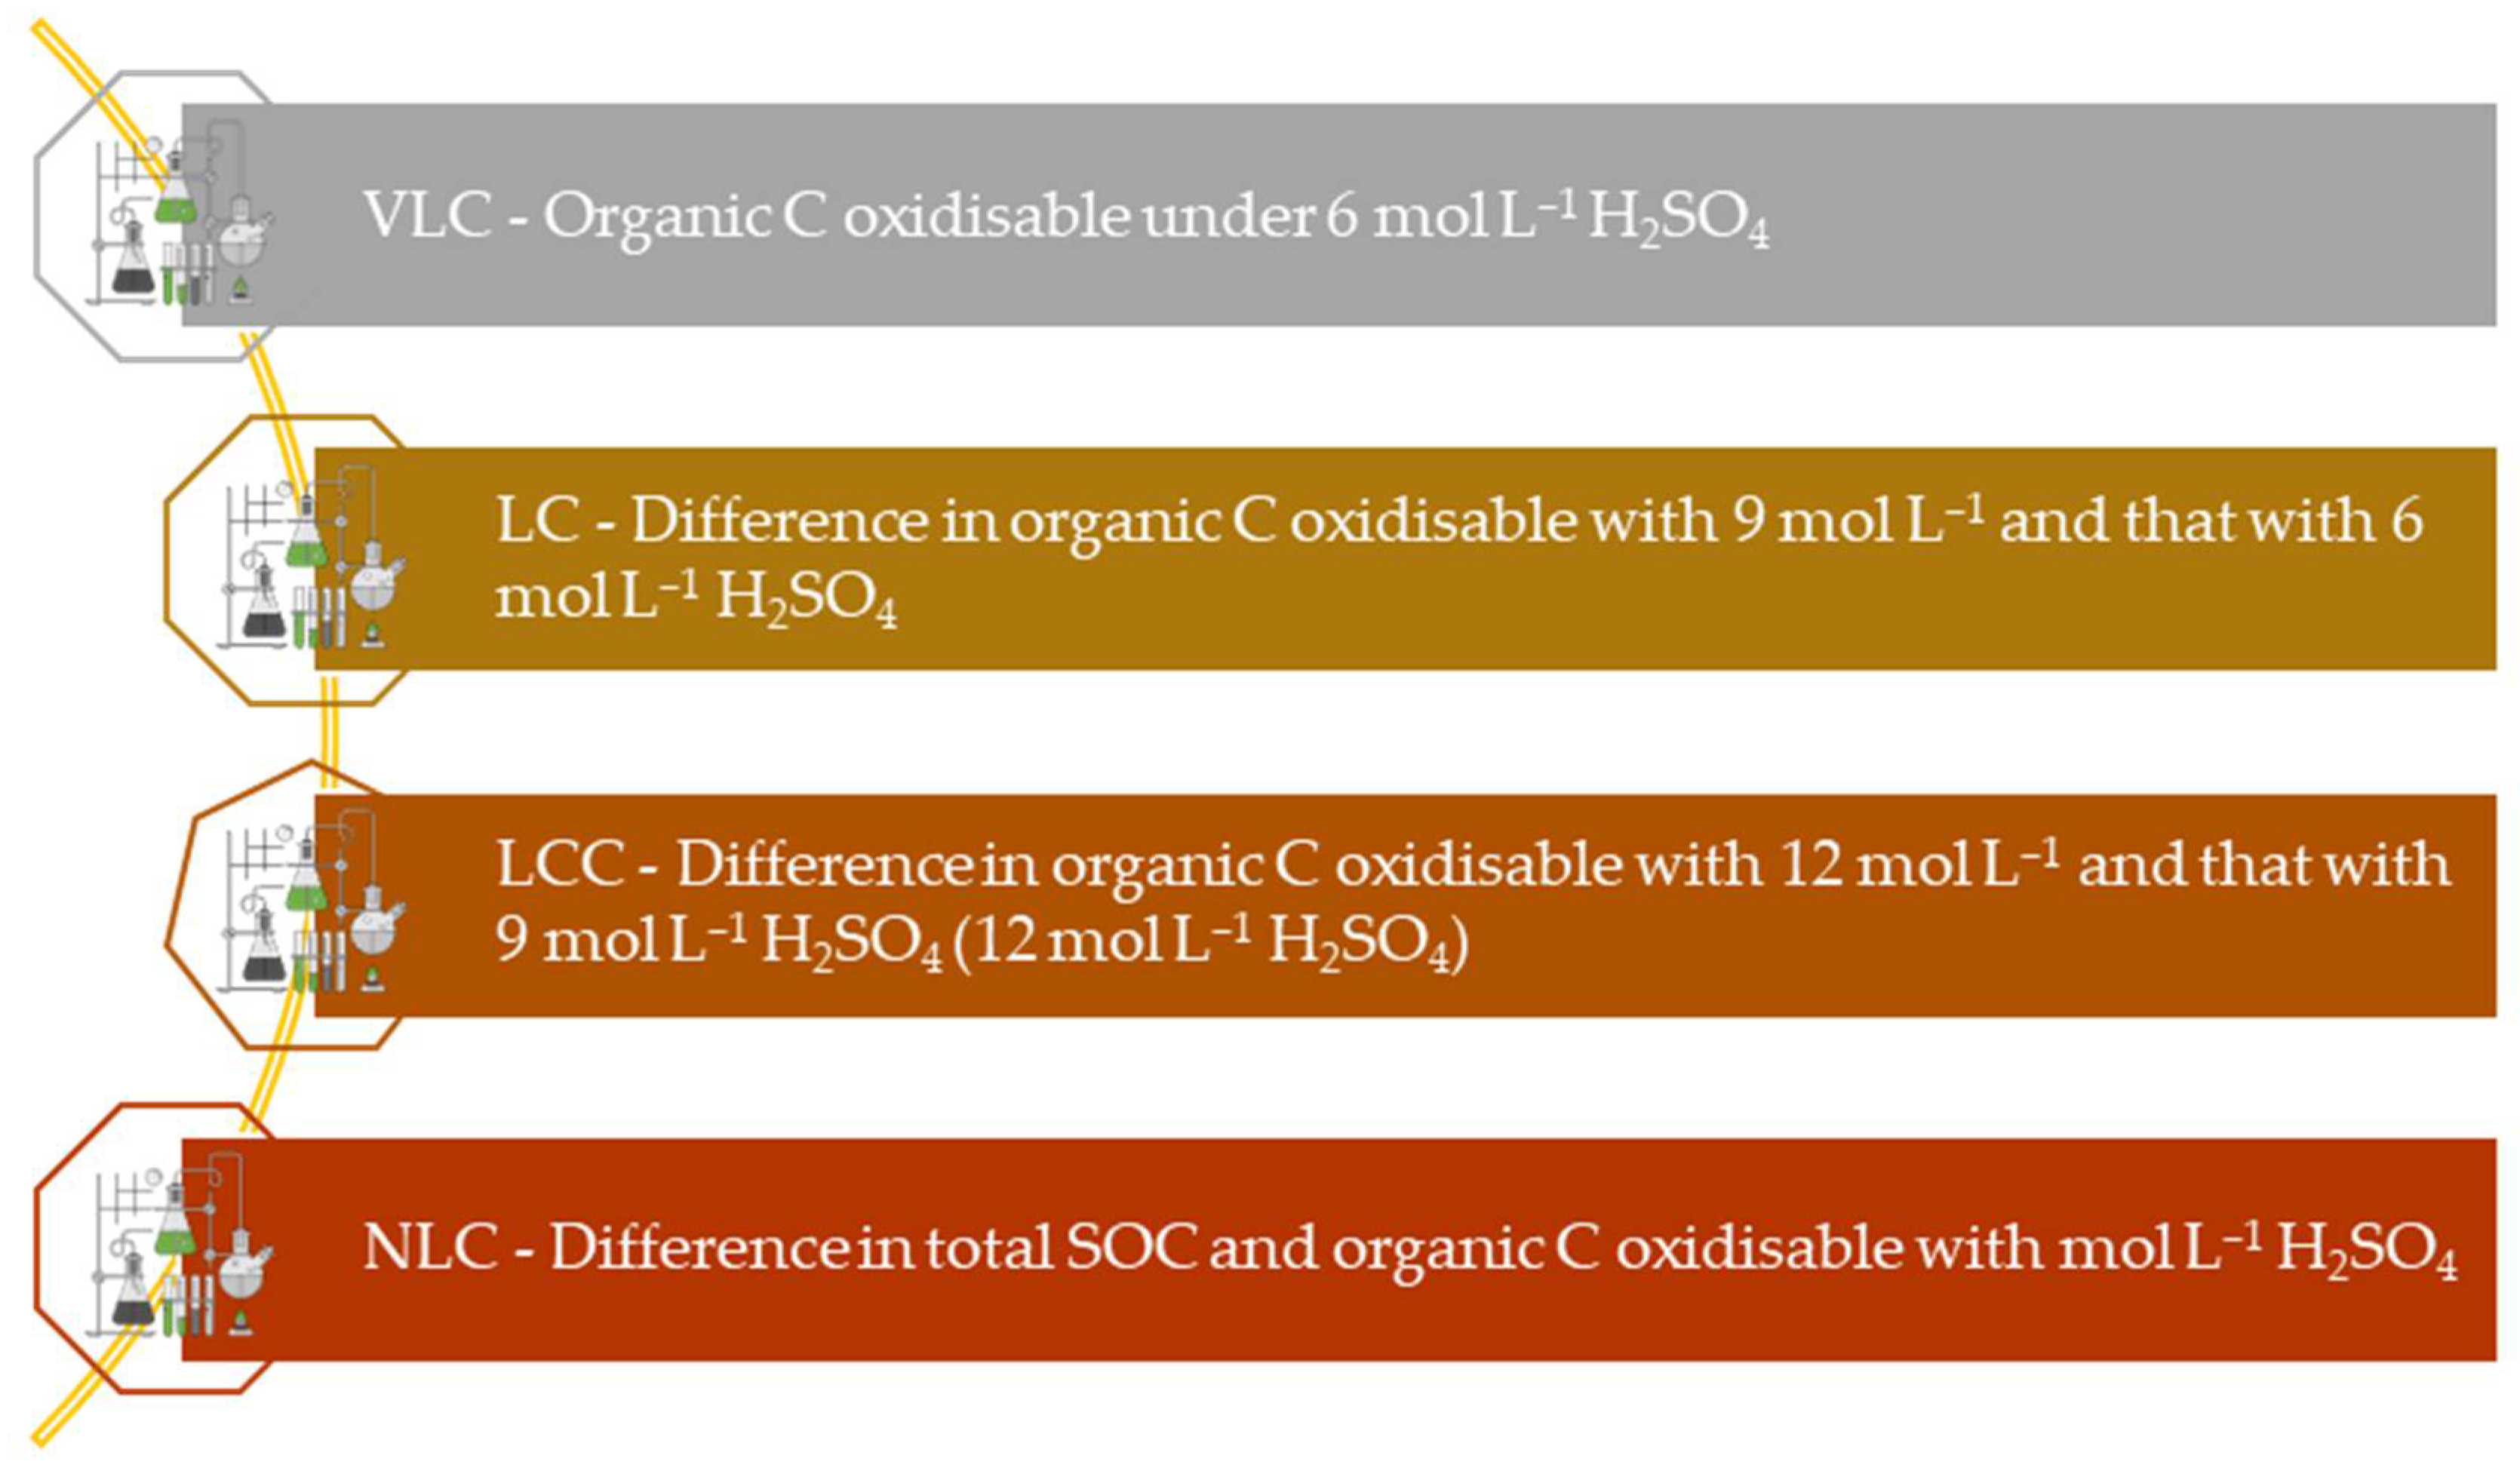
3.3. Very Labile Soil Organic Carbon (VLC)

Integrated plant nutrition system (IPNS) with legumes (cowpea/berseem) and organic farming management practices had a great impact on the very labile carbon (VLC) of the rice-wheat production system (Table 1 and Table 2). Plot with OF (5.36 g C kg−1) had a significantly higher VLC concentration; it was at par with IPNS + C (4.90 g C kg−1), followed by the IPNS + B (4.87 g C kg−1), IPNS (4.83 g C kg−1), STCR (4.00 g C kg−1), NPK (3.99 g C kg−1) and unfertilized control (2.55 g C kg−1) plot in the 0–15 cm soil depth. OF treatment showed its significant advantage over the rest of the treatment combination, its advantage (+48%) over the unfertilized plot.
Nevertheless, in the case of 15–30 cm soil depth, maximum VLC concentration was observed with IPNS + C/IPNS + B (4.44/4.43 g C kg−1) followed by IPNS (3.58 g C kg−1), OF (3.30 g C kg−1), STCR (2.94 g C kg−1), NPK (2.94 g C kg−1) and control (2.13 g C kg−1) plot. IPNS + C/IPNS + B displayed its significant advantage over the rest of the combination. The VLC significantly increased with the adoption of IPNS and OF management practices in the rice-wheat production system (Table 1). Under surface soil (0–15 cm depth) IPNS + C and IPNS + B plots, VLC was 16 and 39% higher compared with 15–30 cm soil depth. In the surface soil layer, OF showed ~38% higher VLC compared with subsurface soil. Plots with NPK and STCR had a similar amount of VLC compared with IPNS practice with legumes (cowpea and berseem) (Table 2). We saw that VLC increased in the IPNS option along with legumes. The lability of carbon concentrations depends on organic inputs and output, i.e., grain, fodder, and losses from the soil system [22,24].

3.4. Labile Soil Organic Carbon (LC)

Data revealed that the sharing of SOC in labile soil organic carbon (LC) followed a similar pattern as that of VLC in both sampling depths with relatively smaller management variances (Table 1 and Table 2). Results showed that the LC varied significantly from 0.50 to 1.28 g C kg−1 among the different nutrient management practices in 0–15 cm soil depth. The plot with OF had a substantial advantage over the rest of the treatment. The largest LC concentration was seen with the OF-treated plot, followed by the IPNS + C. It was at par with IPN + B, followed by IPNS, STCR, NPK, and unfertilized control plots. It showed significant superiority (by +39%) over the unfertilized control plot (0.50 g C kg−1). Nevertheless, the subsurface (15–30 cm depth) concentration of LC was non significantly varied among the treatment. However, the concentration of LC ranged from 0.31 to 0.44 g C kg−1 under different treatment combinations in the rice-wheat production system over the period (Table 2). All IPNS treatment combinations with legumes (cowpea and berseem) crops had a significantly higher amount of LC 0.98 to 0.99 and 0.39 to 0.44 g C kg−1 in the 0–15 and 15–30 cm soil depth, respectively. This could be due to the inclusion of legumes (berseem and cowpea) after completion of each two cropping system cycles along with the IPNS option because legumes help in carbon storage [37,38].

3.5. Less Labile Soil Organic Carbon (LLC)

The LLC concentration was significantly higher under OF (0.78 g C kg−1), followed by the rest of the treatment combination in the 0-15 cm soil depth (Table 1). The intensity of LLC significantly differed from 0.32 to 0.78 g C kg−1 among the different treatment combinations. Highest LLC concentration was observed with OF (0.78 g C kg−1) trailed by the IPNS + C (0.61 g C kg−1), IPNS + B (0.59 g C kg−1), IPNS (0.57 g C kg−1), STCR (0.49 g C kg−1), NPK (0.48 g C kg−1) and unfertilized control (0.32 g C kg−1) plots in the 0–15 cm soil depth. The plot with OF had a significant advantage over the rest of the treatment grouping. It was +41% higher as compared to the unfertilized plot (0.32 g C kg−1) (Table 2). This could be due to less addition of organic inputs. An earlier report showed that the organic amendment improves structures and low solubility [39,40,41].

3.6. Non-Labile Soil Organic Carbon (NLC)

The concentration of NLC varied from 1.46 to 1.88 and 1.53 to 1.78 g C kg−1 in the 0–15 and 15–30 cm soil depth, respectively (Table 1 and Table 2). The higher concentration of NLC in IPNS + B and IPNS + C in our present study could be due to the judicious application of contributions and legumes significantly contributing to different carbon fractions. Application of different management practices significant gain or losses in soil system carbon [15,42,43,44].

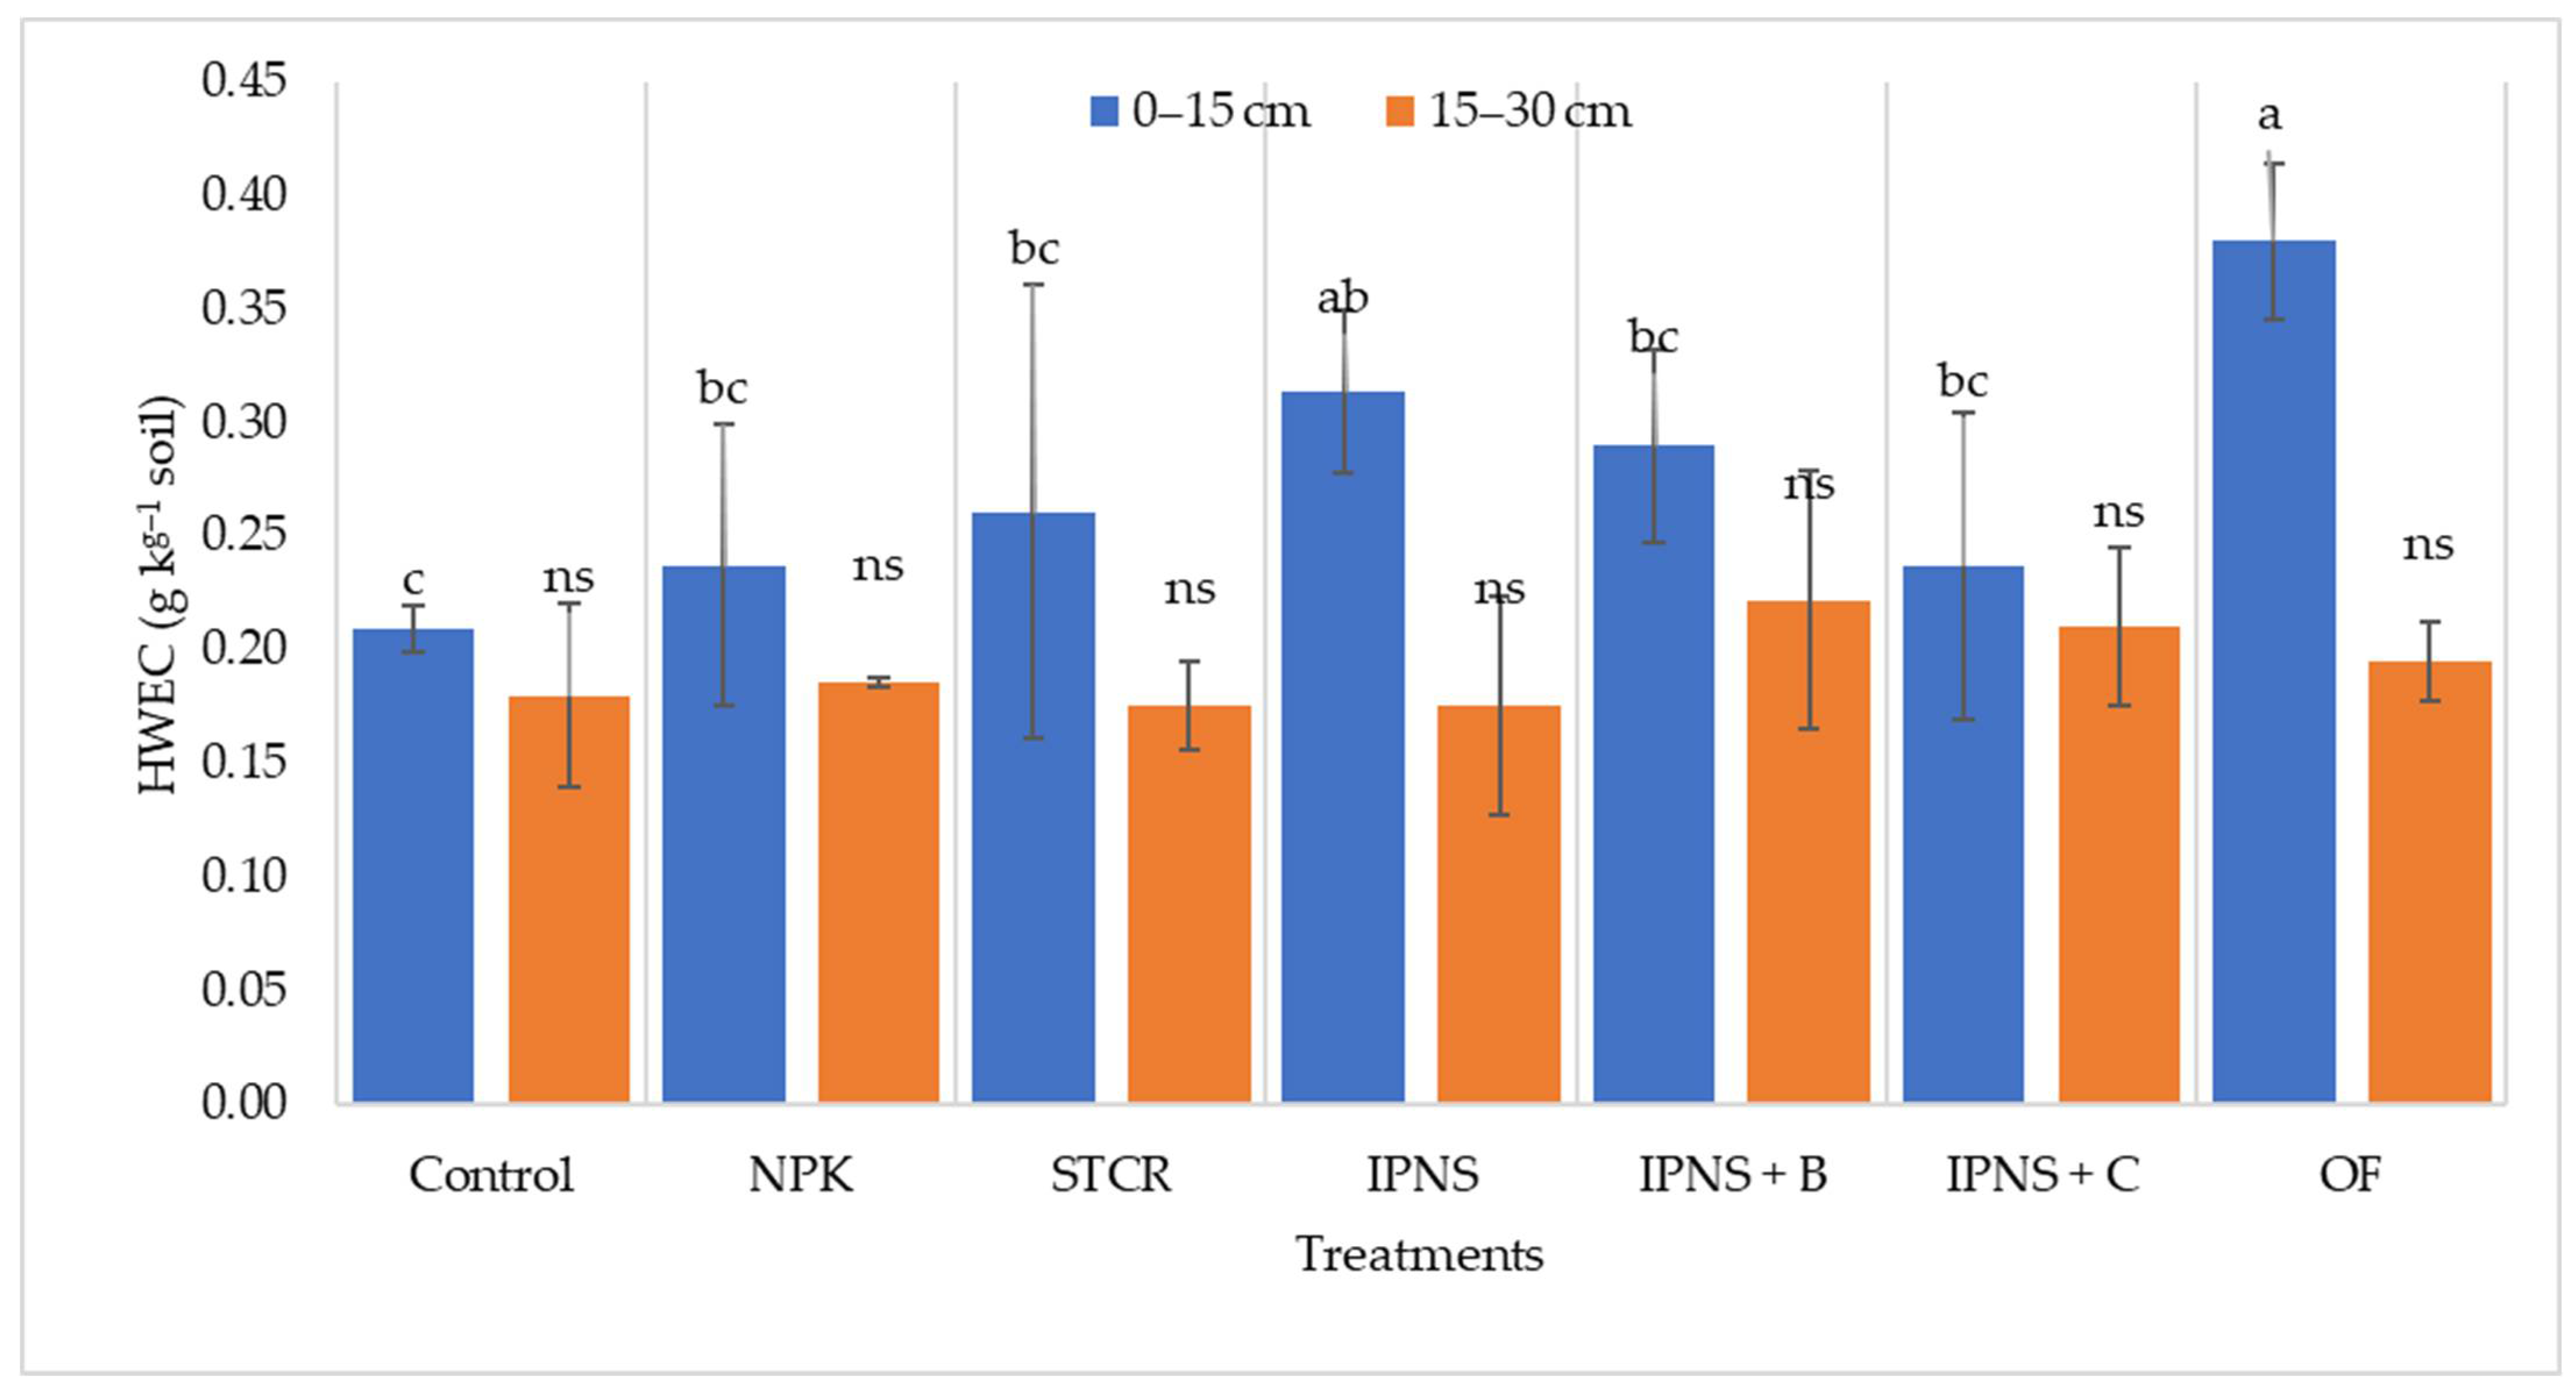
3.7. Hot Water Extractable Carbon (HWEC)

Results revealed that the concentration of hot water extractable carbon (HWEC) significantly varied among the different treatment combinations (Figure 5). The concentration of HWEC varied from 0.21 to 0.38 and 0.18 to 0.22 g C kg−1 in 0–15 and 15–30 cm soil depth separately. Significant highest HWEC concentration was detected with OF (0.38 g C kg−1) followed by the IPNS (0.31 g C kg−1), IPNS + B (0.29 g C kg−1), STCR (0.26 g C kg−1), NPK (0.24 g C kg−1), IPNS + C (0.24 g C kg−1) and the lowest concentration was observed with unfertilized (0.21 g C kg−1) control. The plot with OF had a substantial advantage over the rest of the treatment; it was a 45% higher concentration as compared to the unfertilized control plot (0.21 g C kg−1). The treatment differences in the 15–30 cm soil depth was non significant (Figure 5). Conflicting reports are found in the publication, which could be due to the very diverse ecological conditions of the experiments. HWEC is less labile as compared to WSC [41,45,46].

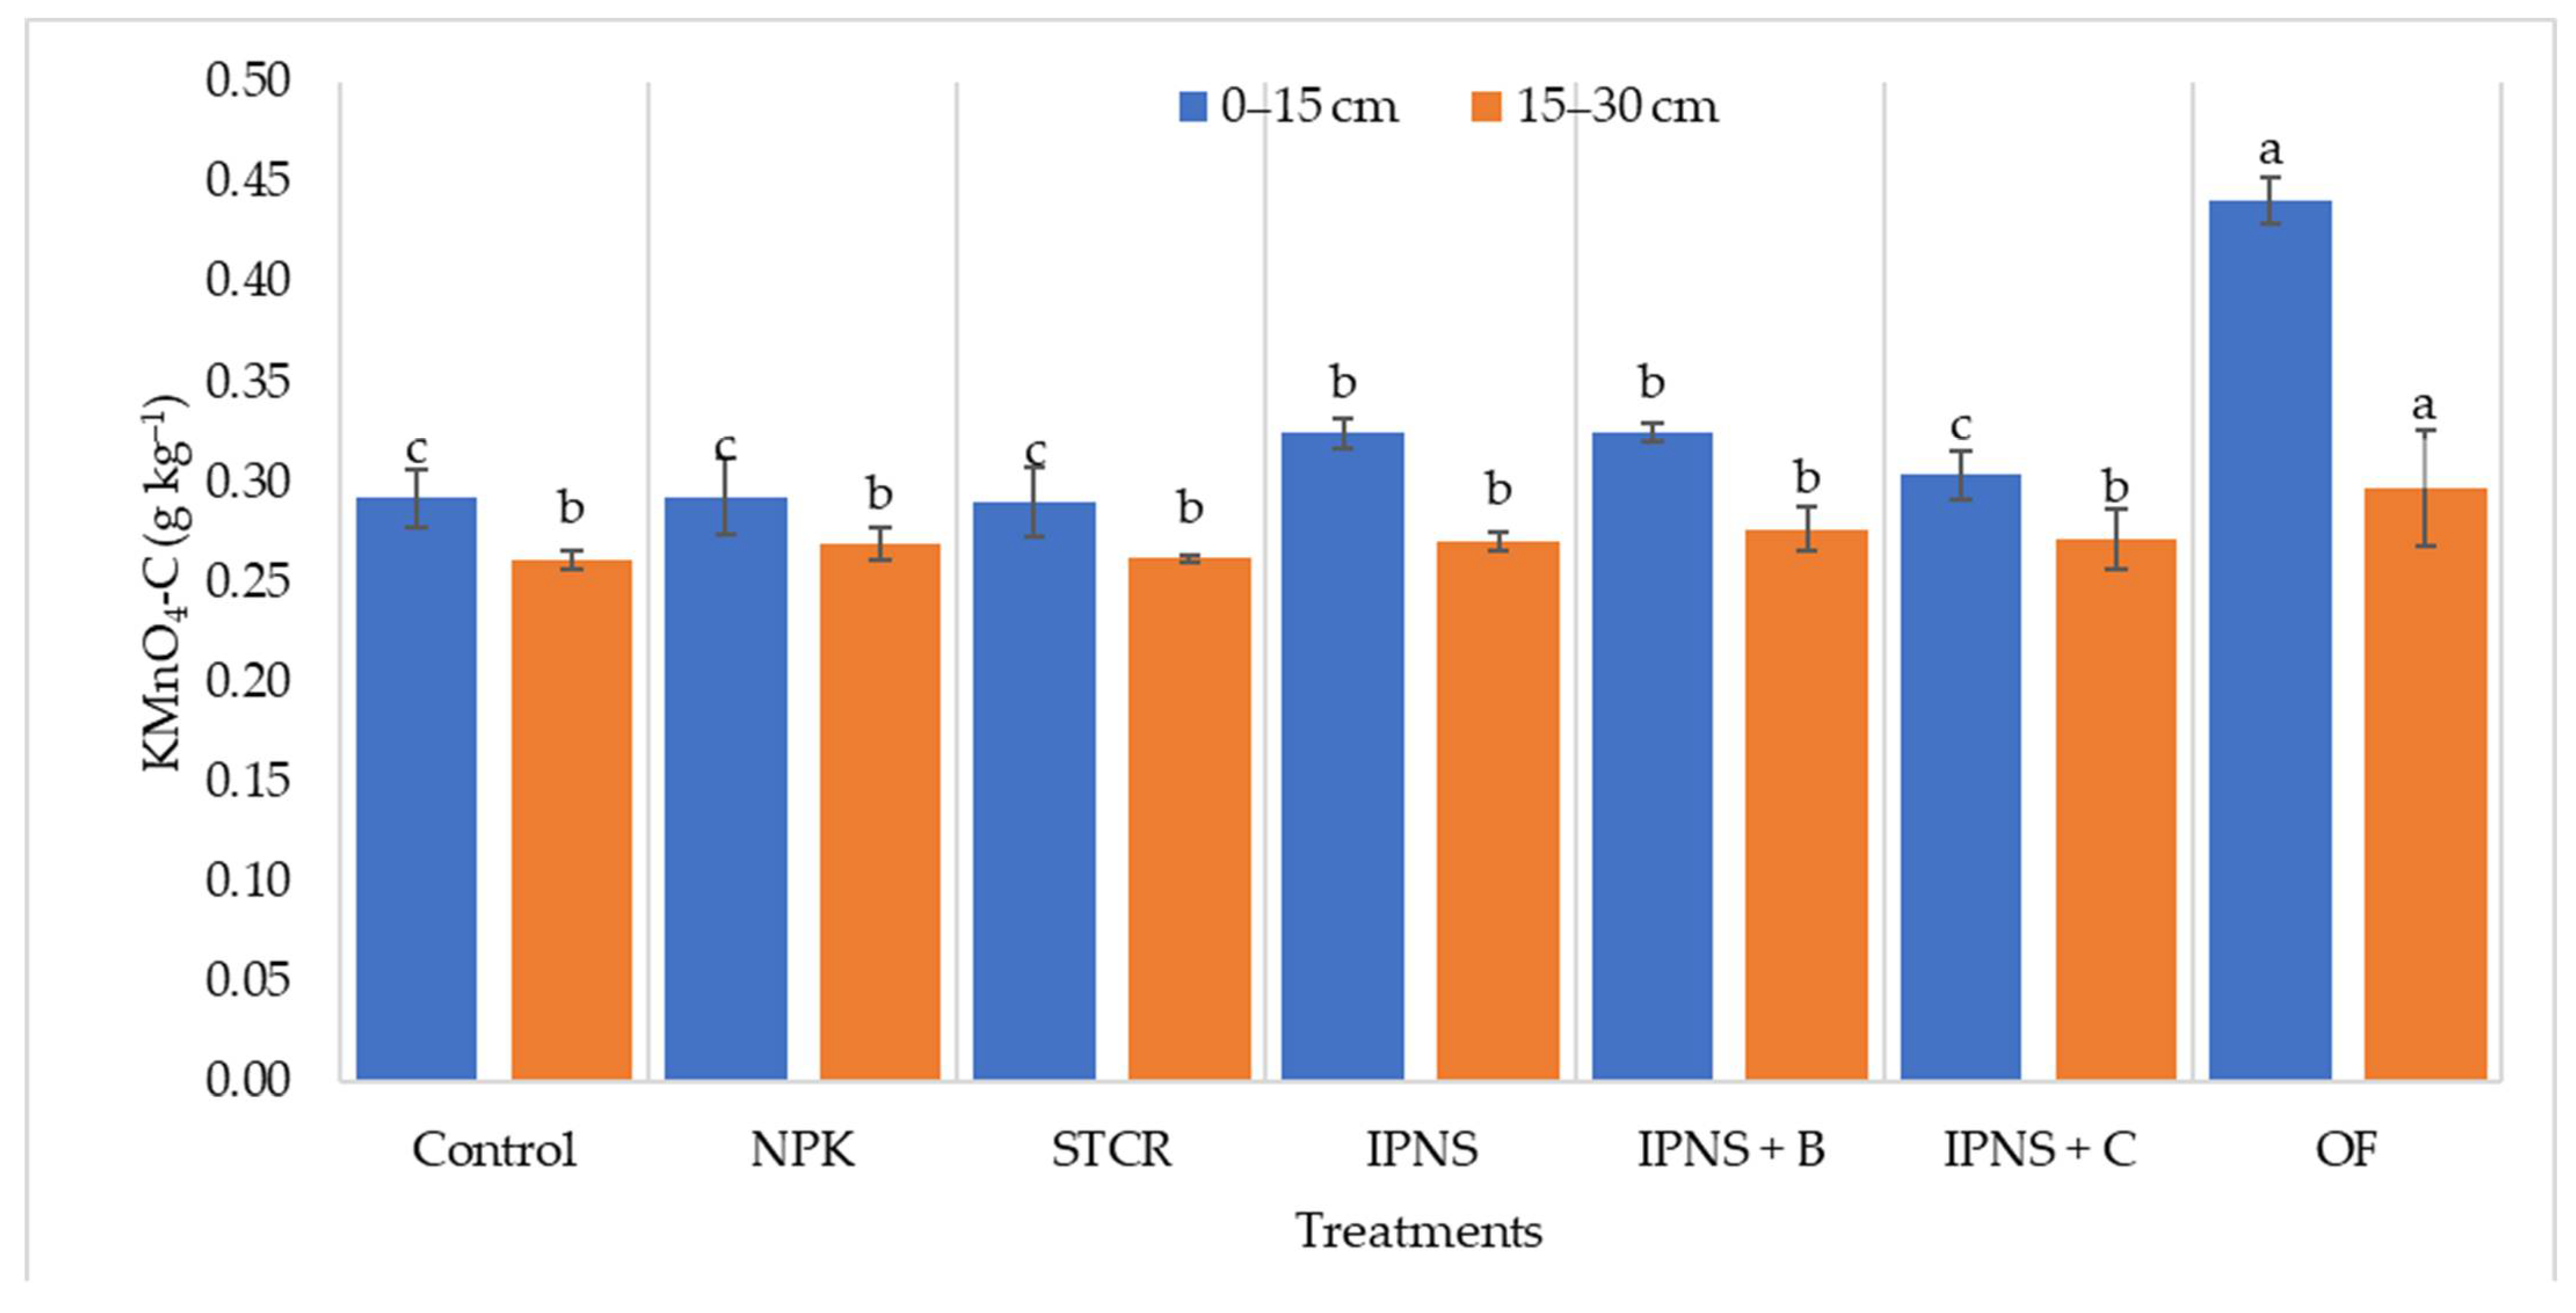
3.8. Permanganate Oxidisable Carbon (KMnO4-C)

Results revealed that the permanganate oxidizable carbon (KMnO4-C) was significantly varied (Figure 6). It varied from 0.29 to 0.44 and 0.26 to 0.30 g C kg−1 in the 0–15 and 15–30 cm soil depths, respectively (Figure 6). The build-up of KMnO4-C in 0–15 and 15–30 cm depths were 0.44 and 0.30 g C kg−1 in plots OF management practices, respectively, as against 0.29 and 0.26 g C kg−1 in the unfertilized control plot, respectively.
The KMnO4-C increased by ~36 and 13% in 0–15 and 15–30 cm soil depth in plots receiving OF management practices, respectively, over the control plots. The concentration of KMnO4-C in the 0–15 cm depth was recorded in following order OF (0.44 g C kg−1) > IPNS (0.32 g C kg−1) ≥ IPNS + B (0.32 g C kg−1) > IPNS + C (0.30 g C kg−1) > STCR (0.29 g C kg−1) ≥ NPK (0.29 g C kg−1) ≥ control (0.29 g C kg−1). The soil KMnO4-C is composition polysaccharides and lignin of SOM, and its decomposition depends on rhizosphere microbes [47]; in our study, IPNS options contributed to KMnO4-C concentrations with the inclusion of legumes.

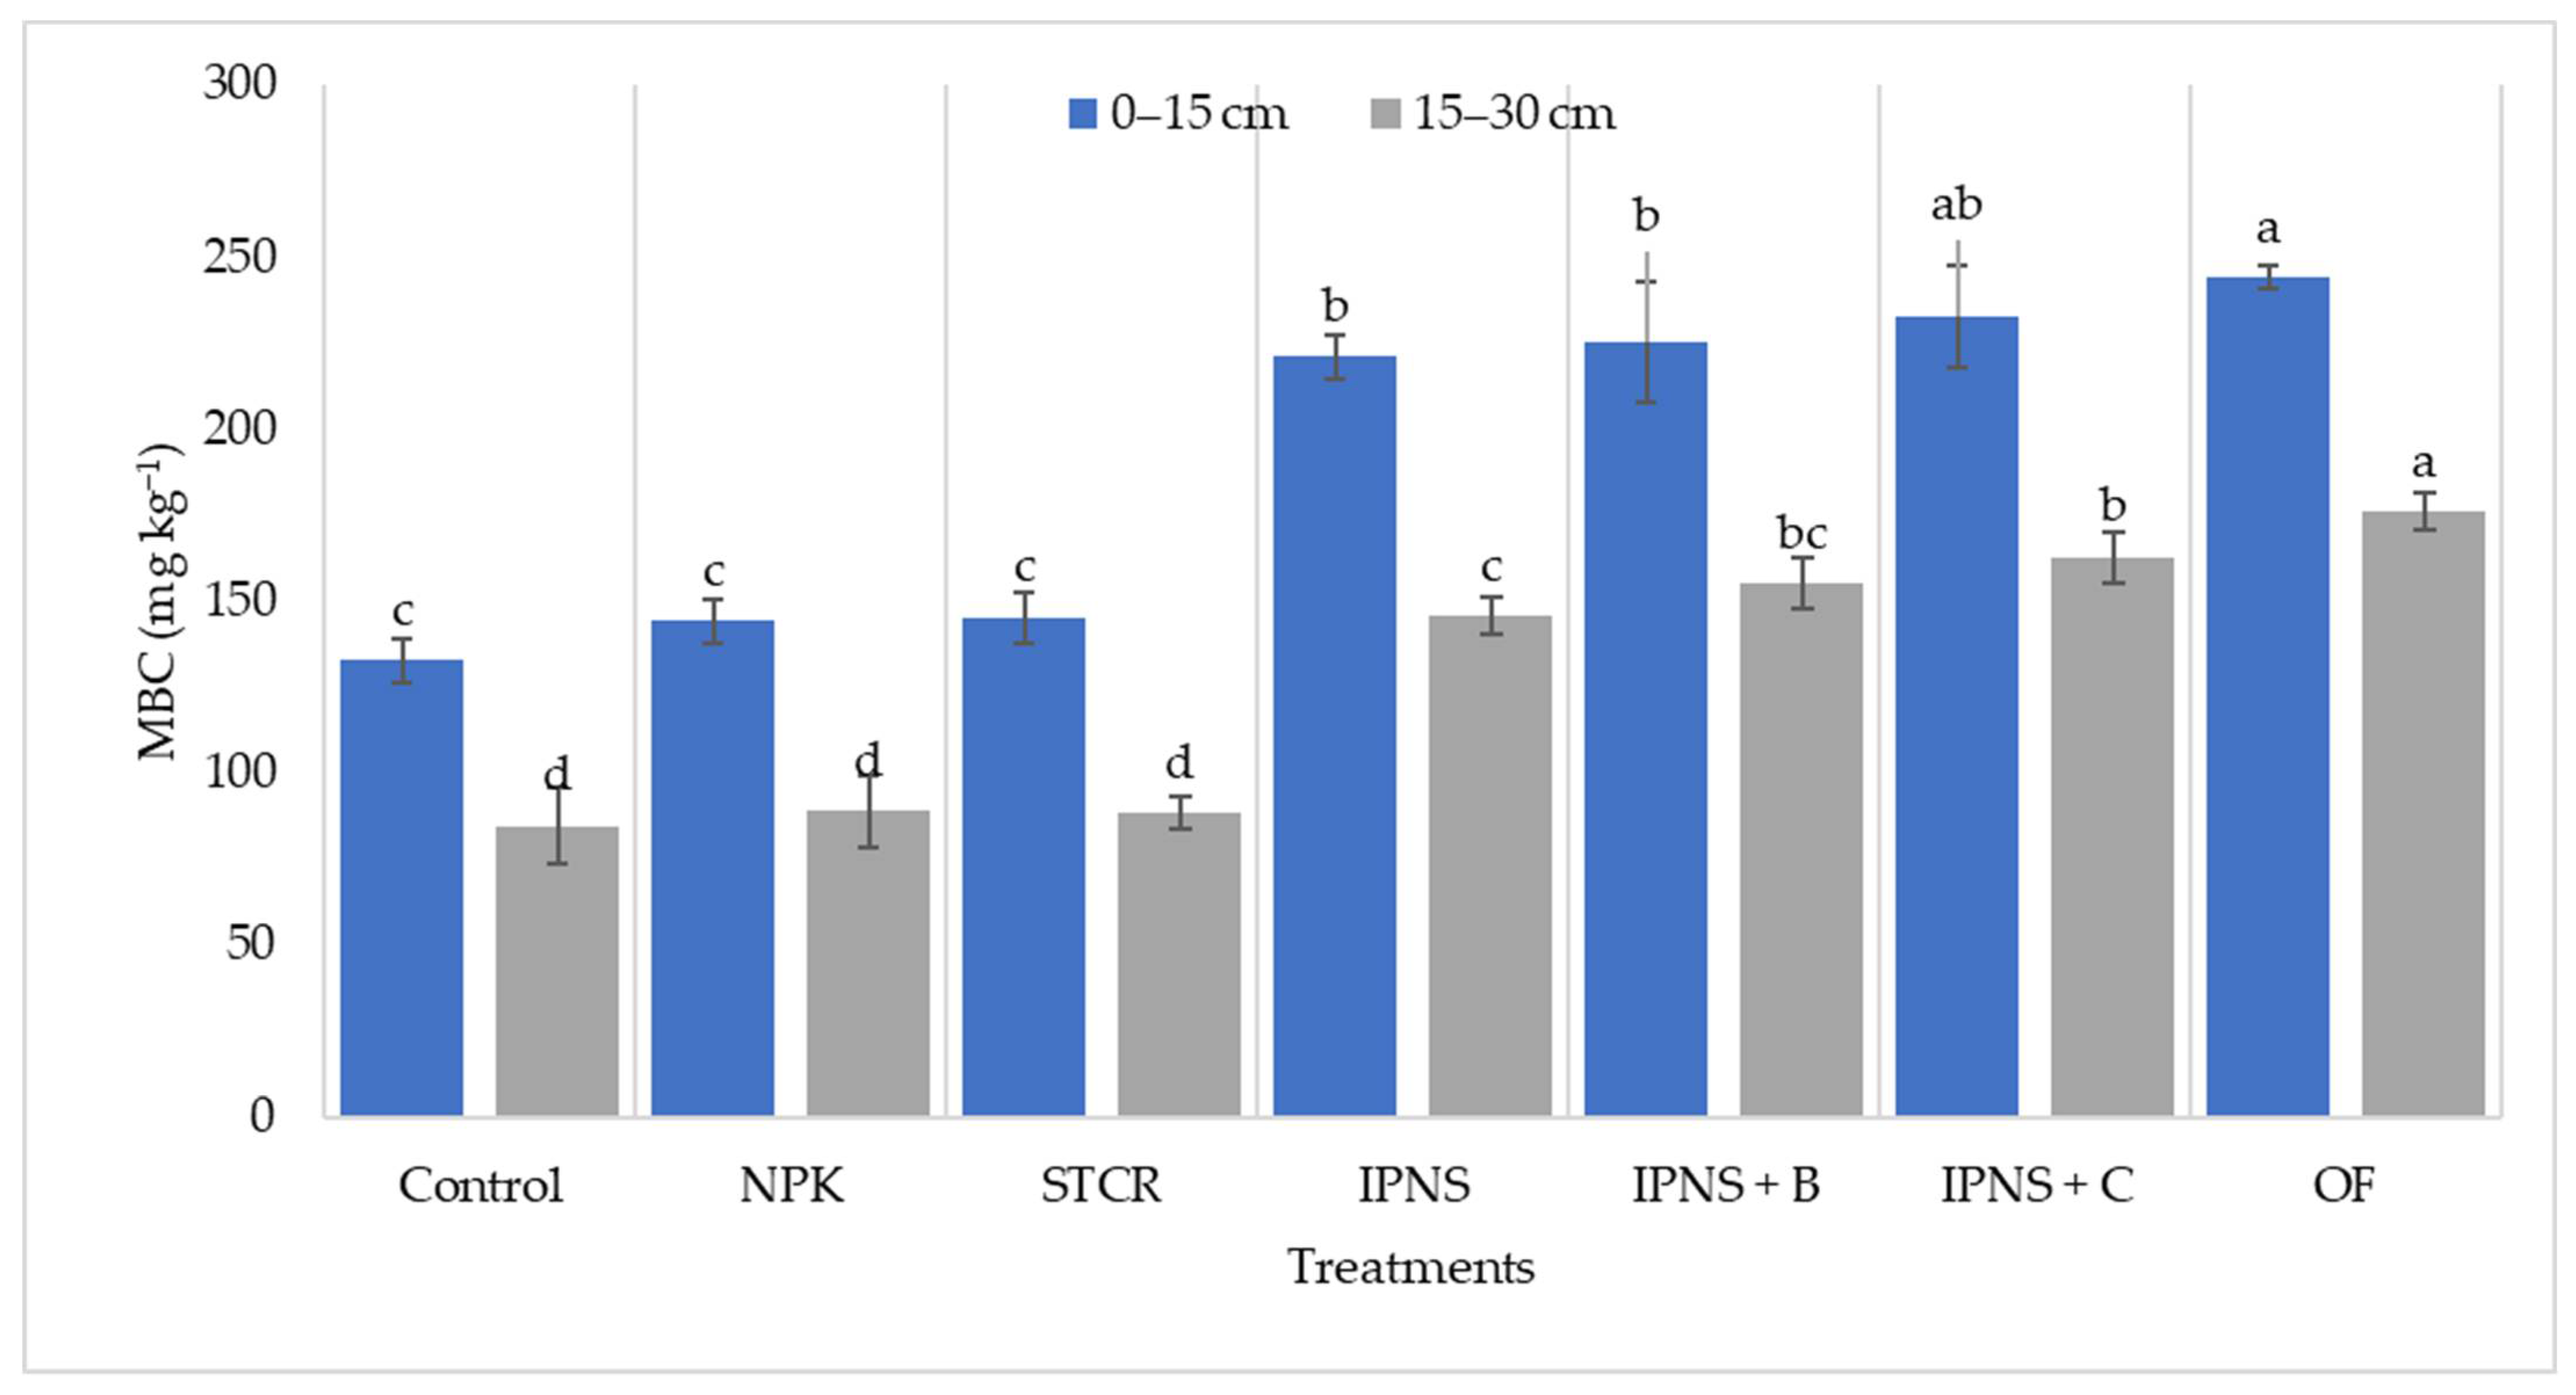
3.9. Microbial Biomass Carbon (MBC)

A significantly greater amount of microbial biomass carbon (MBC) was supported in OF over the rest of the treatment except IPNS + C in both surface and subsurface soil layers (Figure 7). The build-up of MBC was reached from 244.20 to 175.79 mg C kg−1 in OF as against 132.52 and 84.39 mg C kg−1 in unfertilized control plots under 0–15 and 15–30 cm depth, respectively. The MBC was augmented by ~46 and 51% with OF in 0–15 and 15–30 cm soil depth, respectively, over control. In the case of surface soil, MBC ranged from 132.52 to 244.20 mg C kg−1. The determined MBC was documented with OF (244.20 mg C kg−1)-treated plots. It was at par with IPNS + C (232.49 mg C kg−1) followed by IPNS + B (225.05 mg C kg−1), IPNS (221.12 mg C kg−1), STCR (145.19 mg C kg−1), NPK (144.28 mg C kg−1) and significant lowest (132.52 mg C kg−1) concentration of MBC was recorded with unfertilized control plot (Figure 7). After completion of 19 cropping system cycles, MBC higher found in OF followed by IPNS + C/IPNS + B could be due to the higher WSC and WBC being more sensitive to rhizospheric microbial activity than other carbon fractions [47,48].

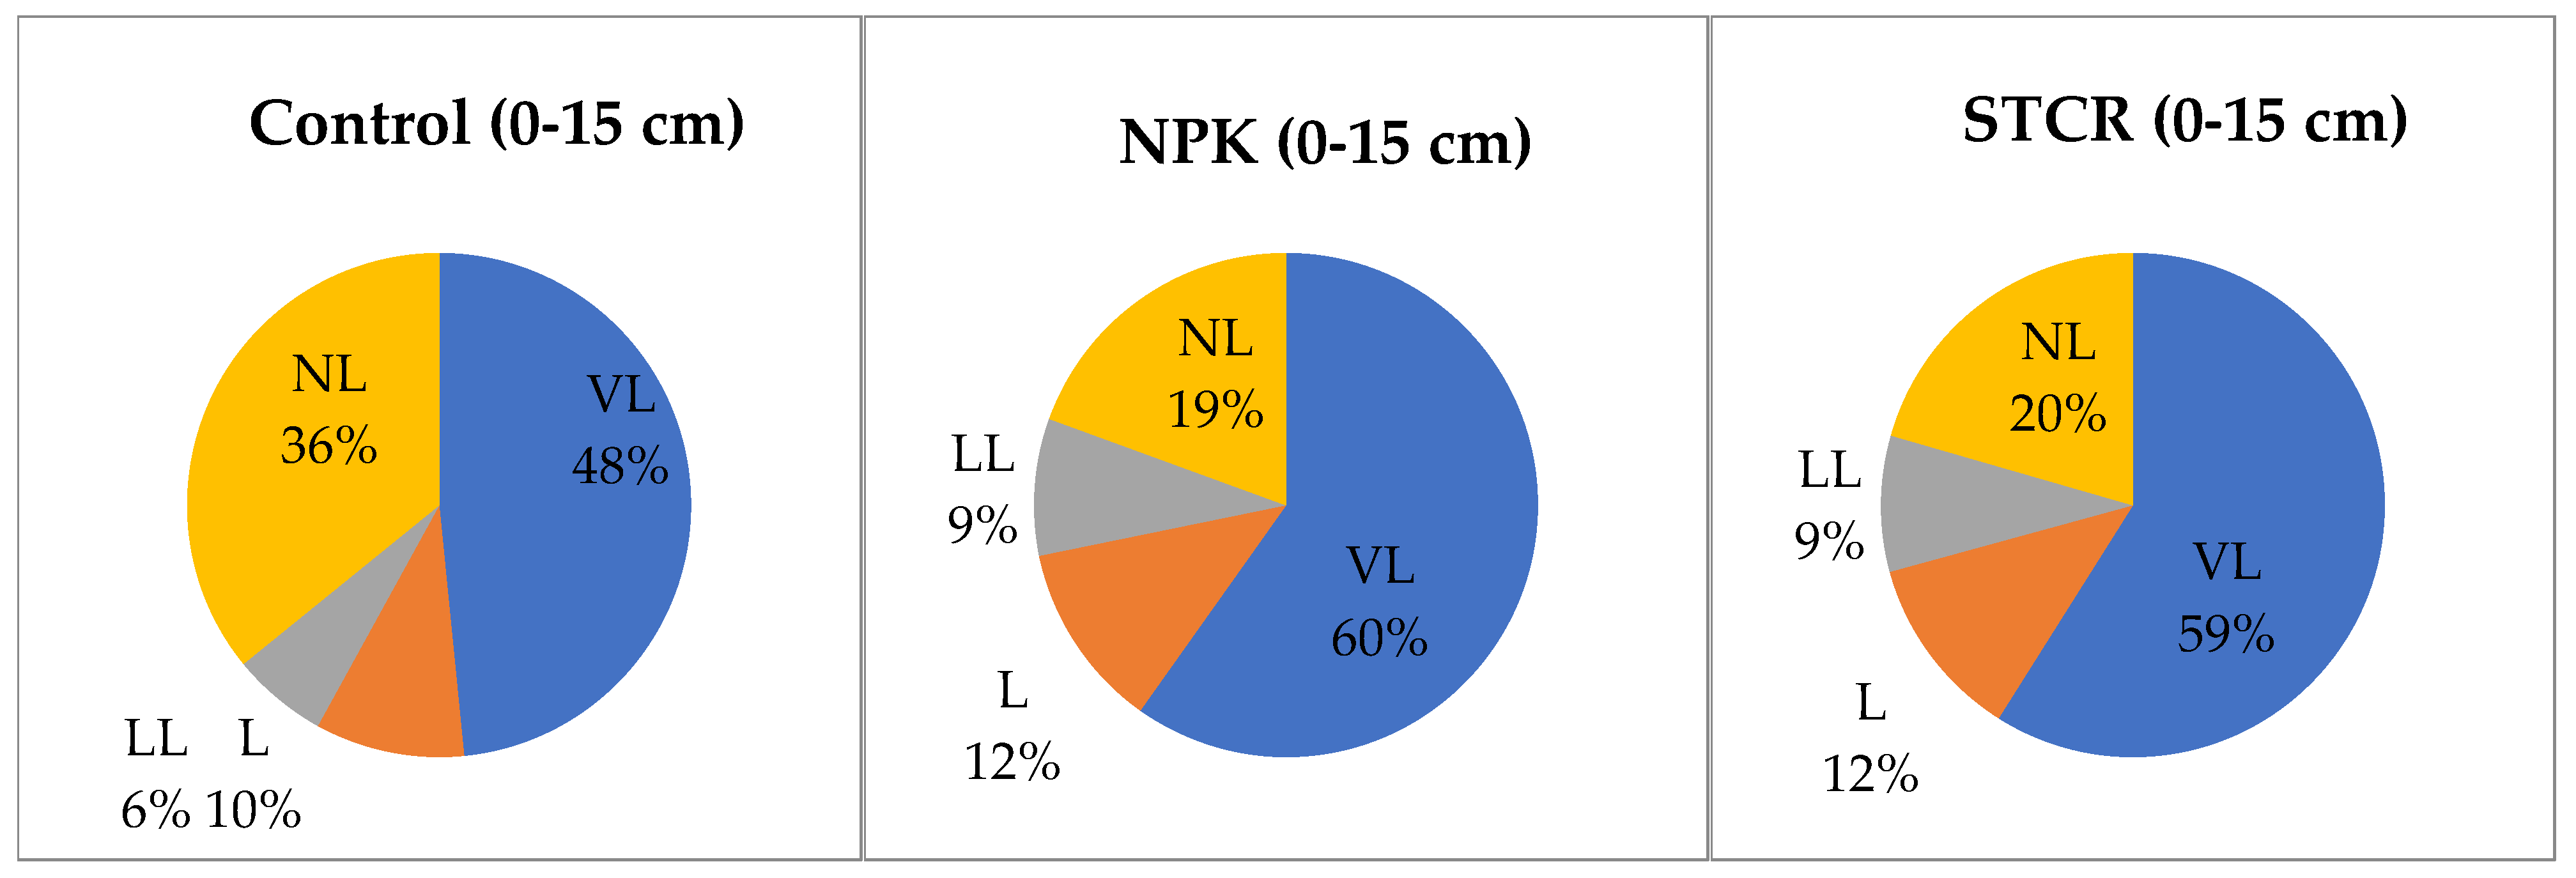
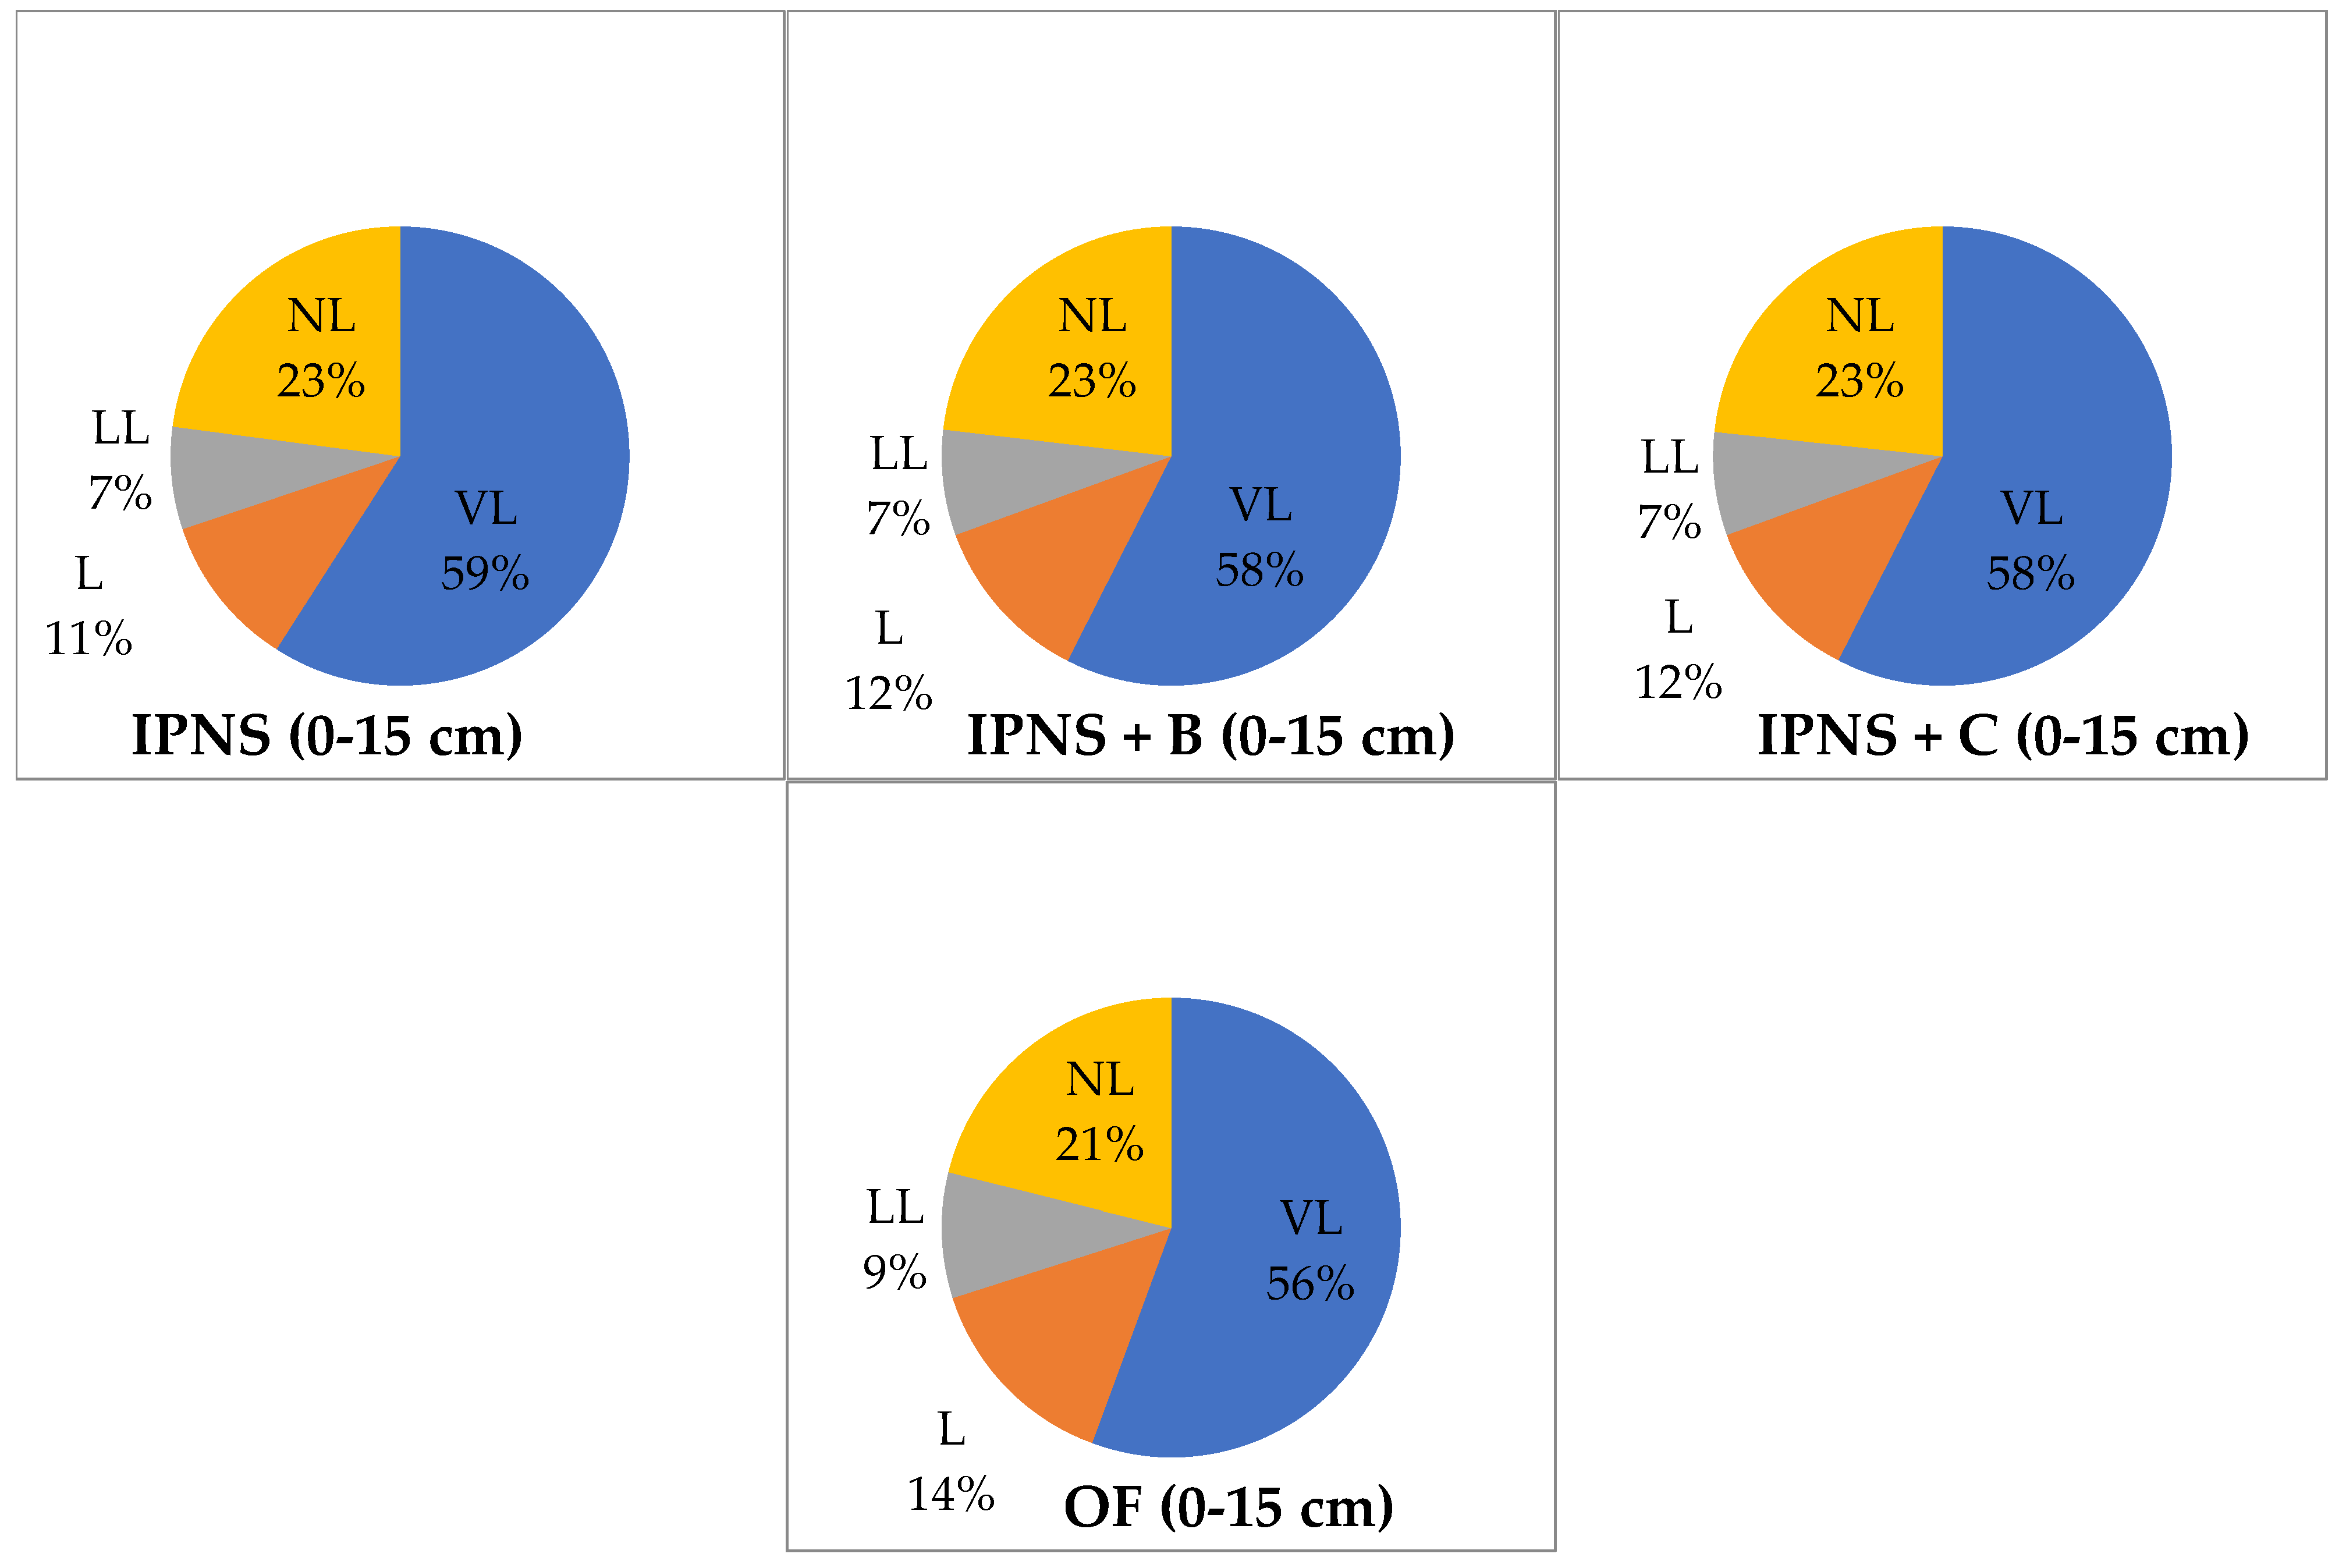
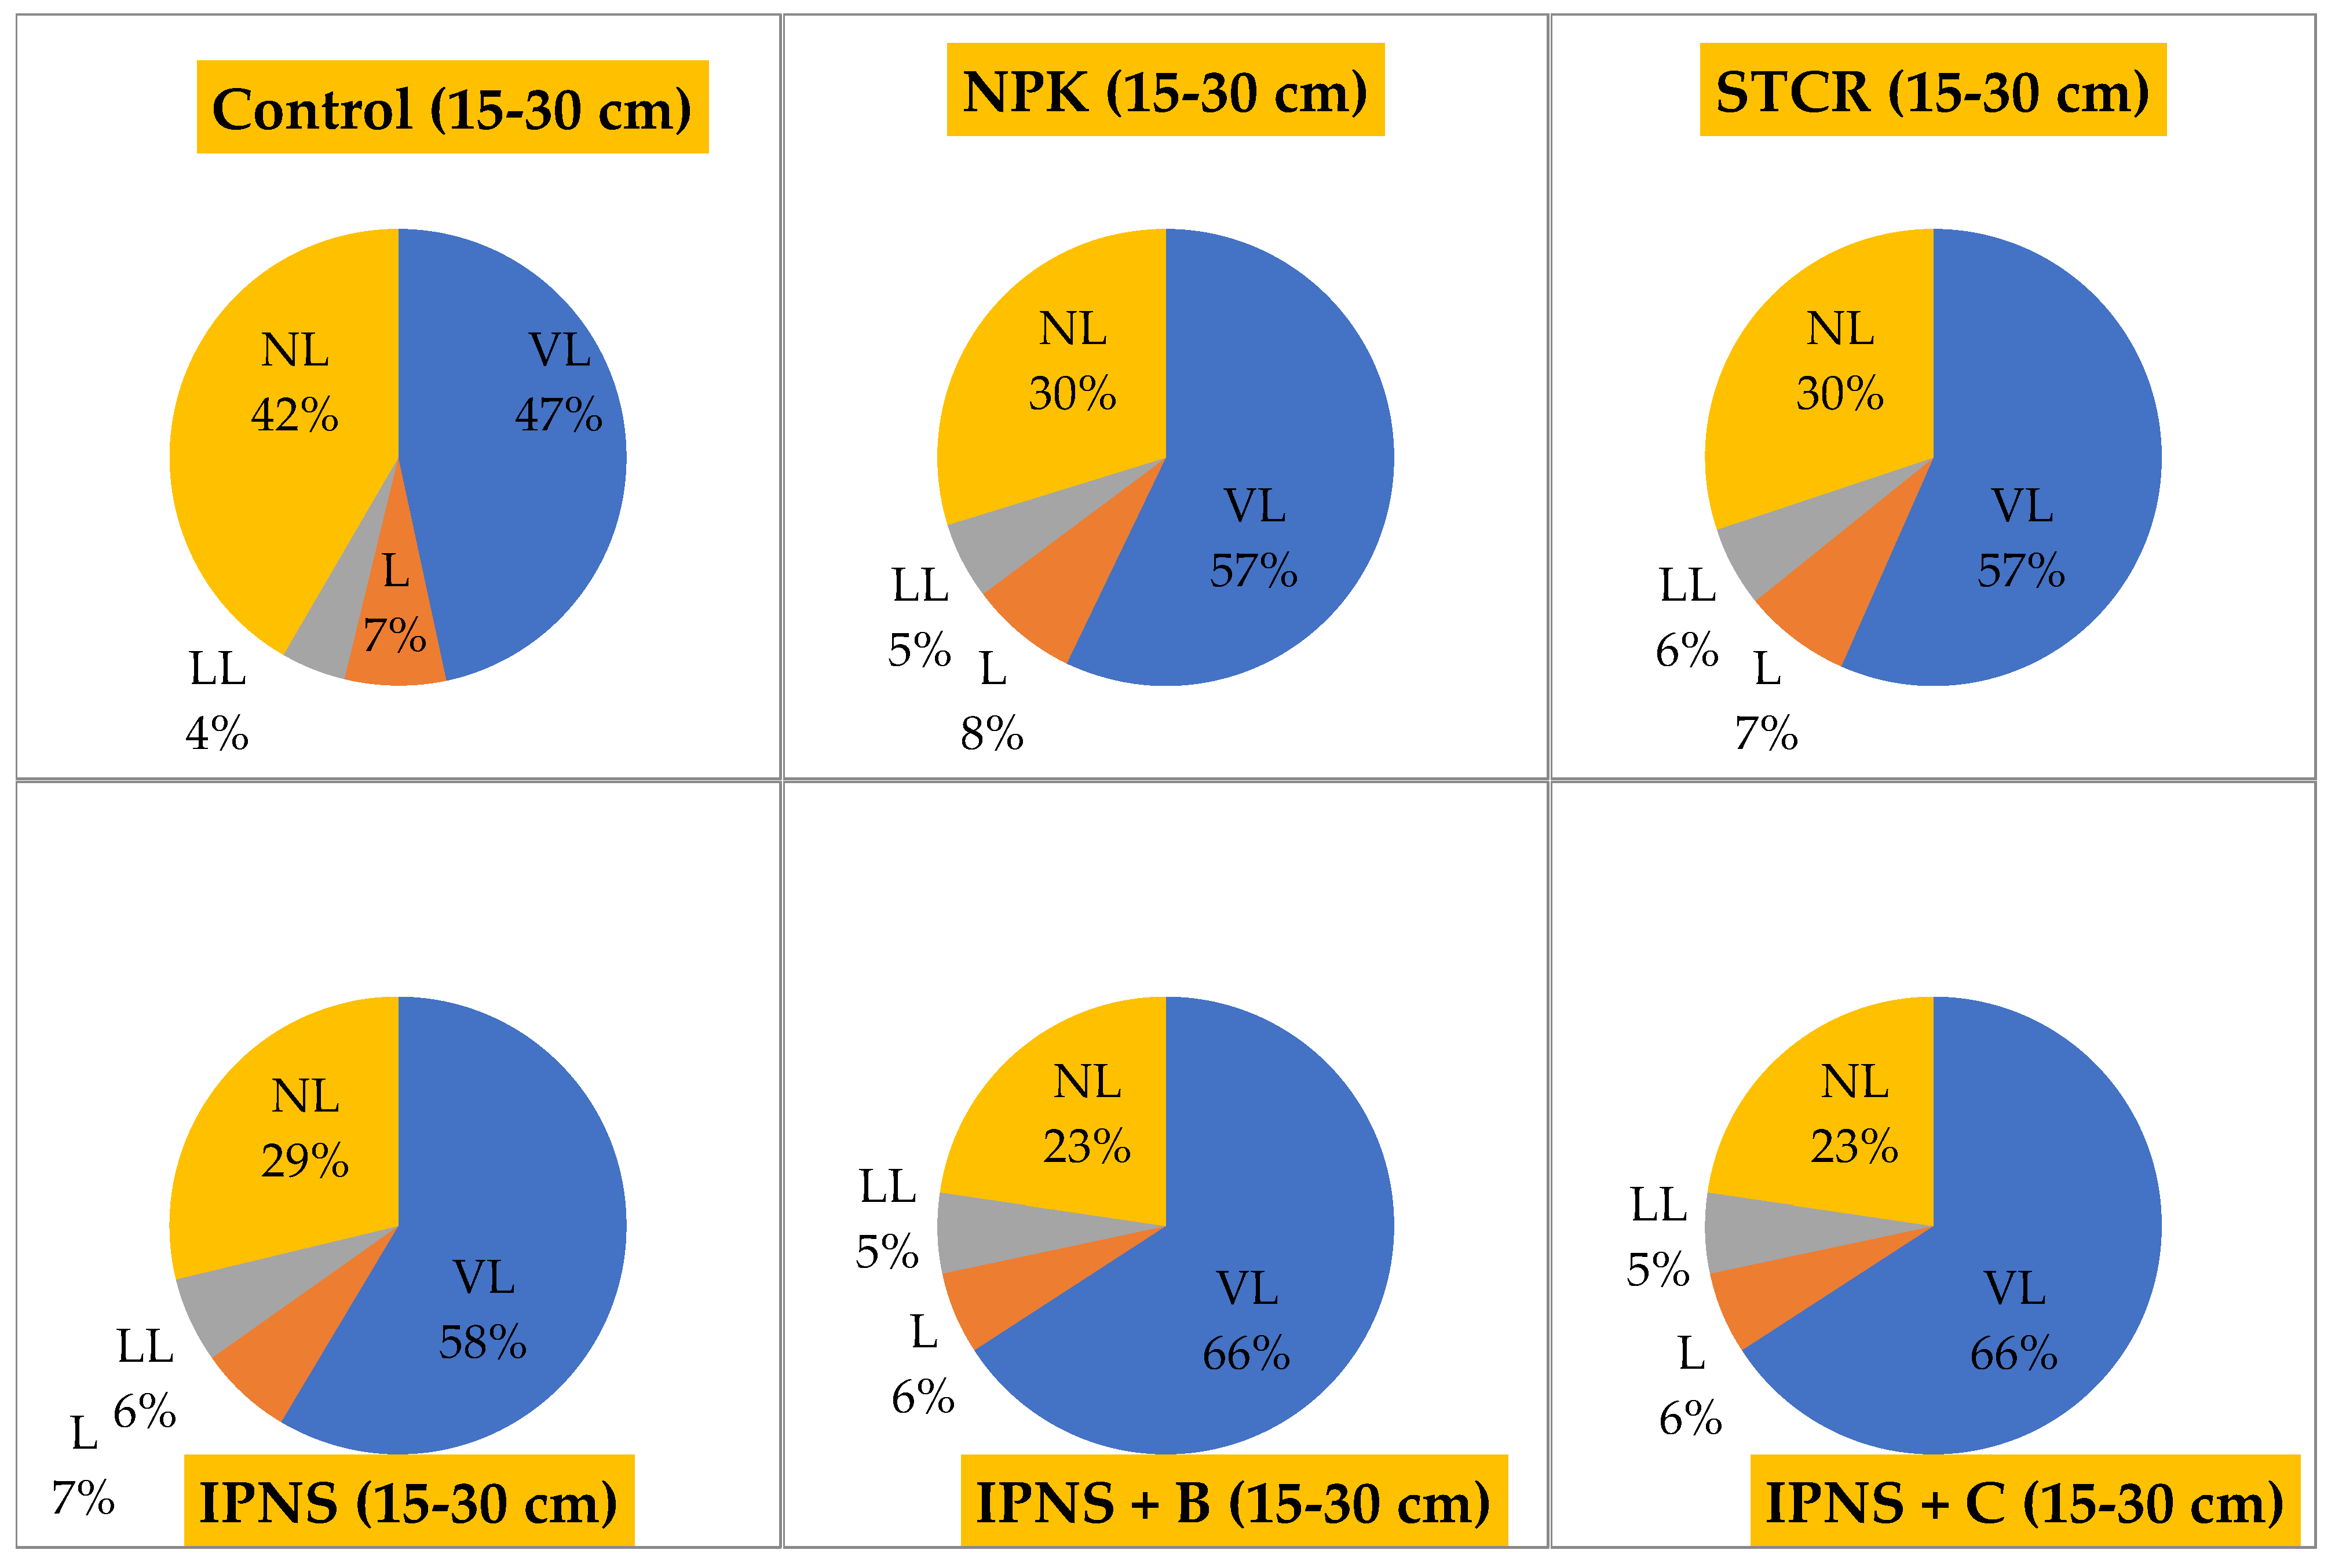
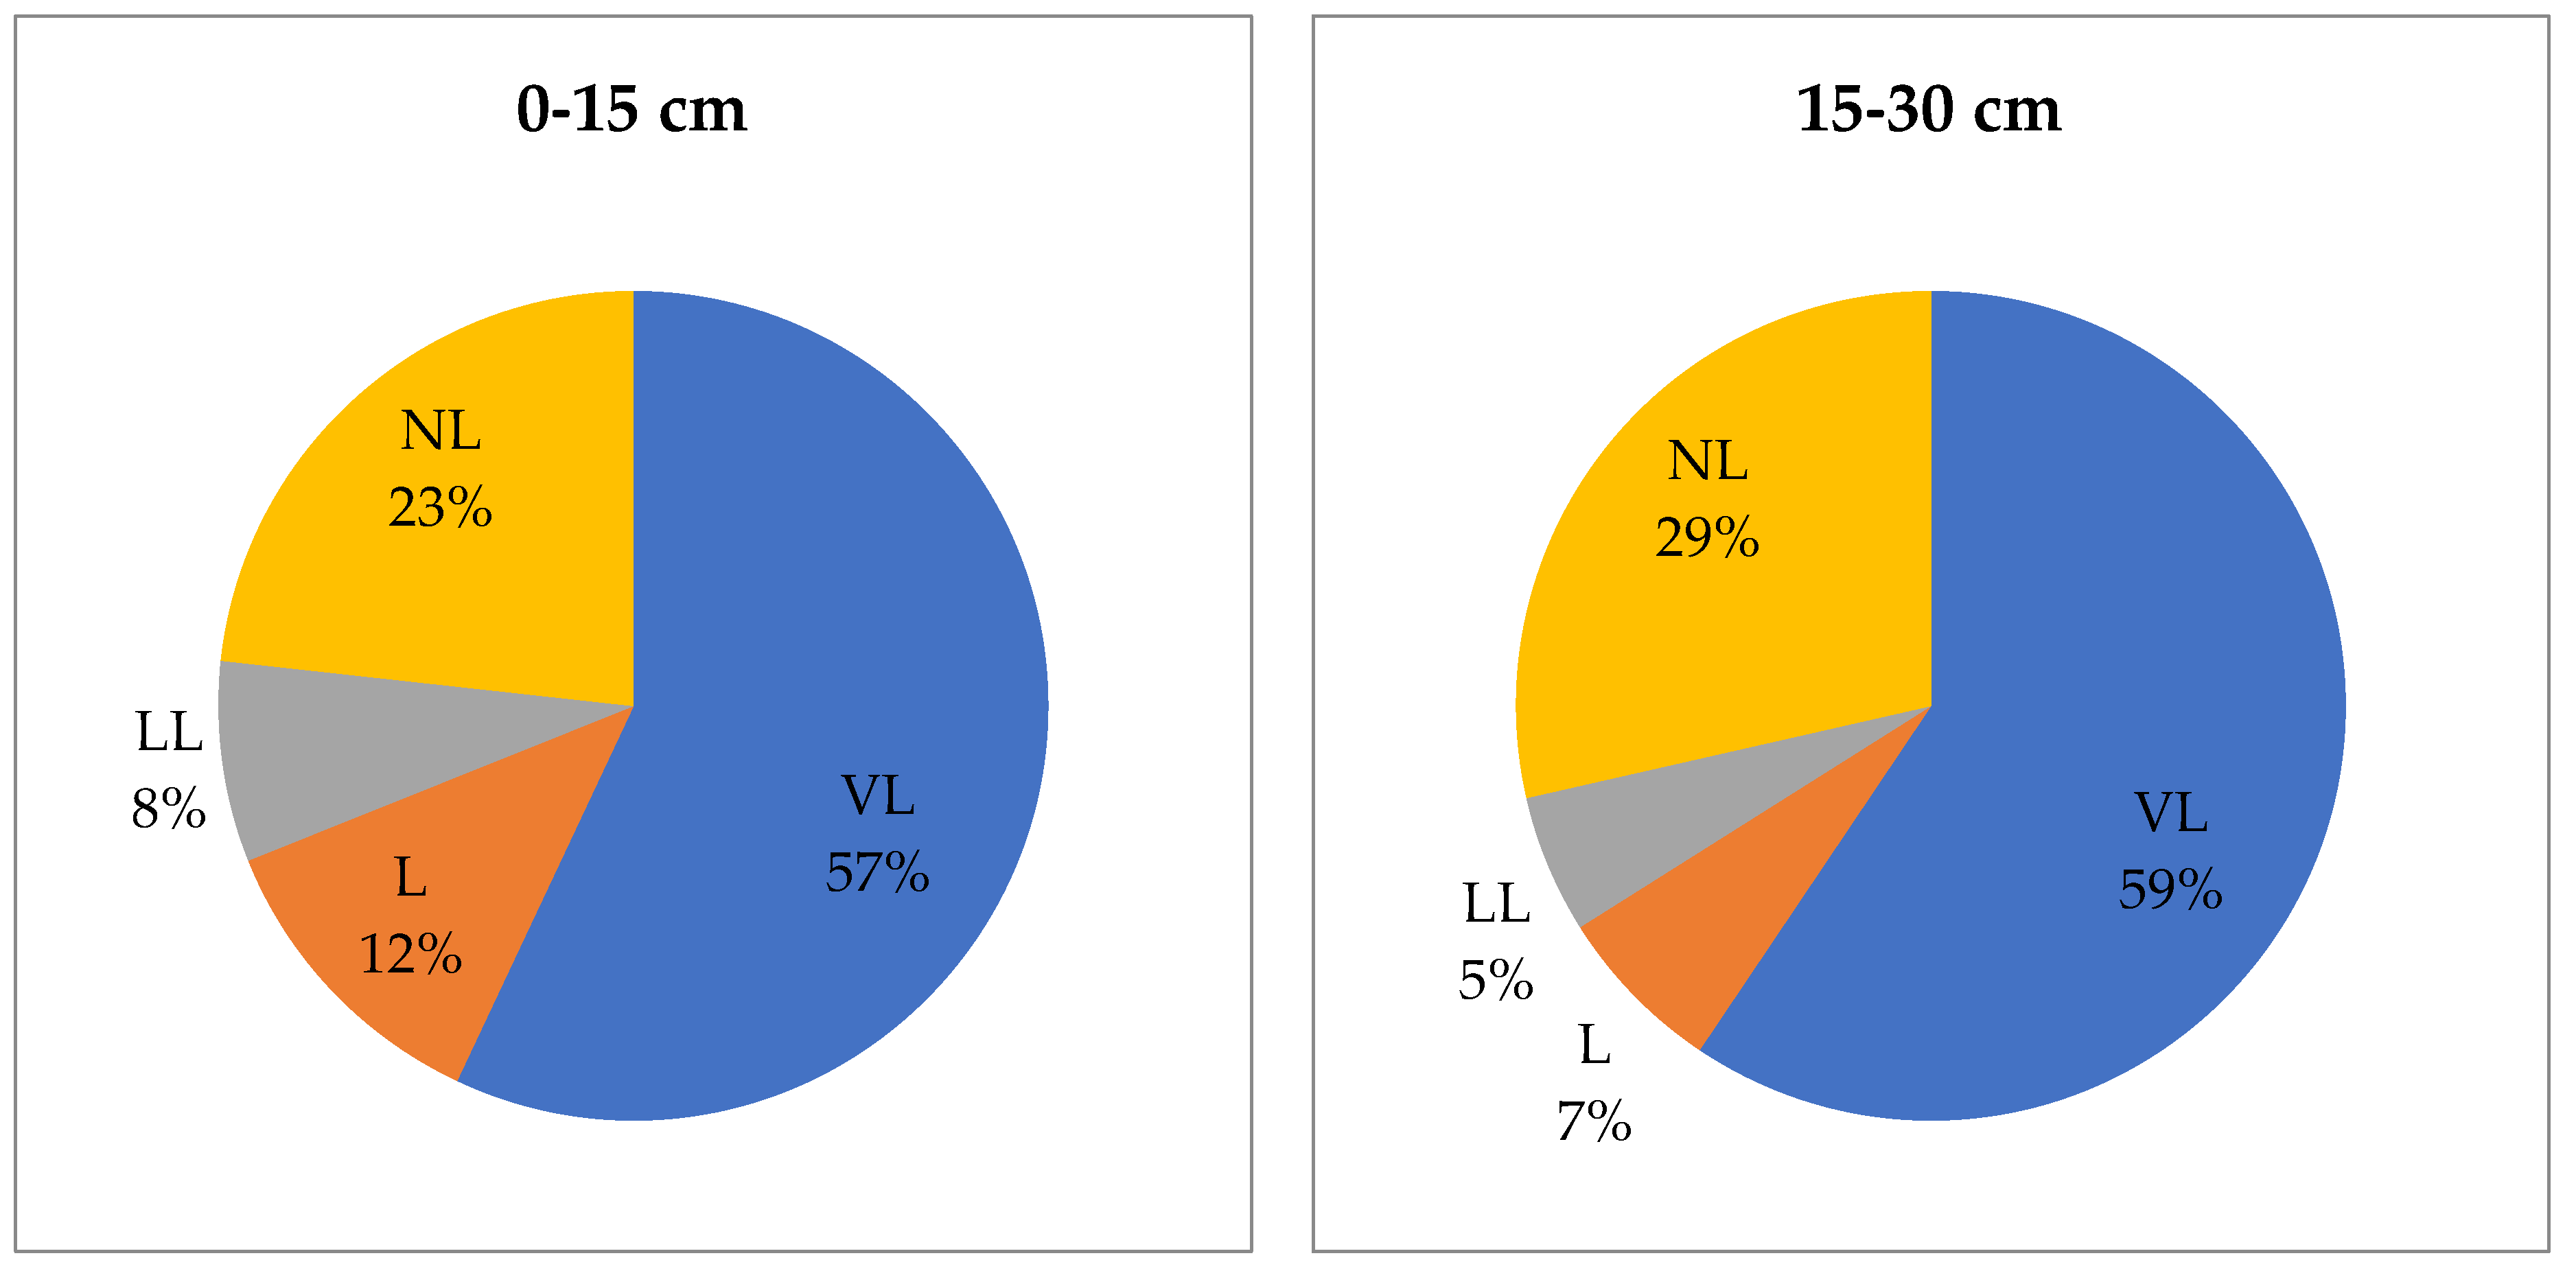
3.10. Carbon Fractions Contribution

Results showed that the VLC was the dominant carbon fraction in both soil layers after the completion of 19 cropping system cycles (Figure 8 and Figure 9). In the case of the 0–15 cm soil layer (Figure 10), the maximum (57%) was contributed by VLC, followed by the NLC (23%), LC (12%), and LLC (8%). Meanwhile, in the 15–30 cm soil layer, the maximum contribution by the VLC (57%), followed by NLC (29%), LC (7%), and the lowest as LLC (5%) (Figure 10). Enhanced in LLC in different IPNS options and organic manure application plots might be due to the accumulation of more SOM [49,50,51,52,53].

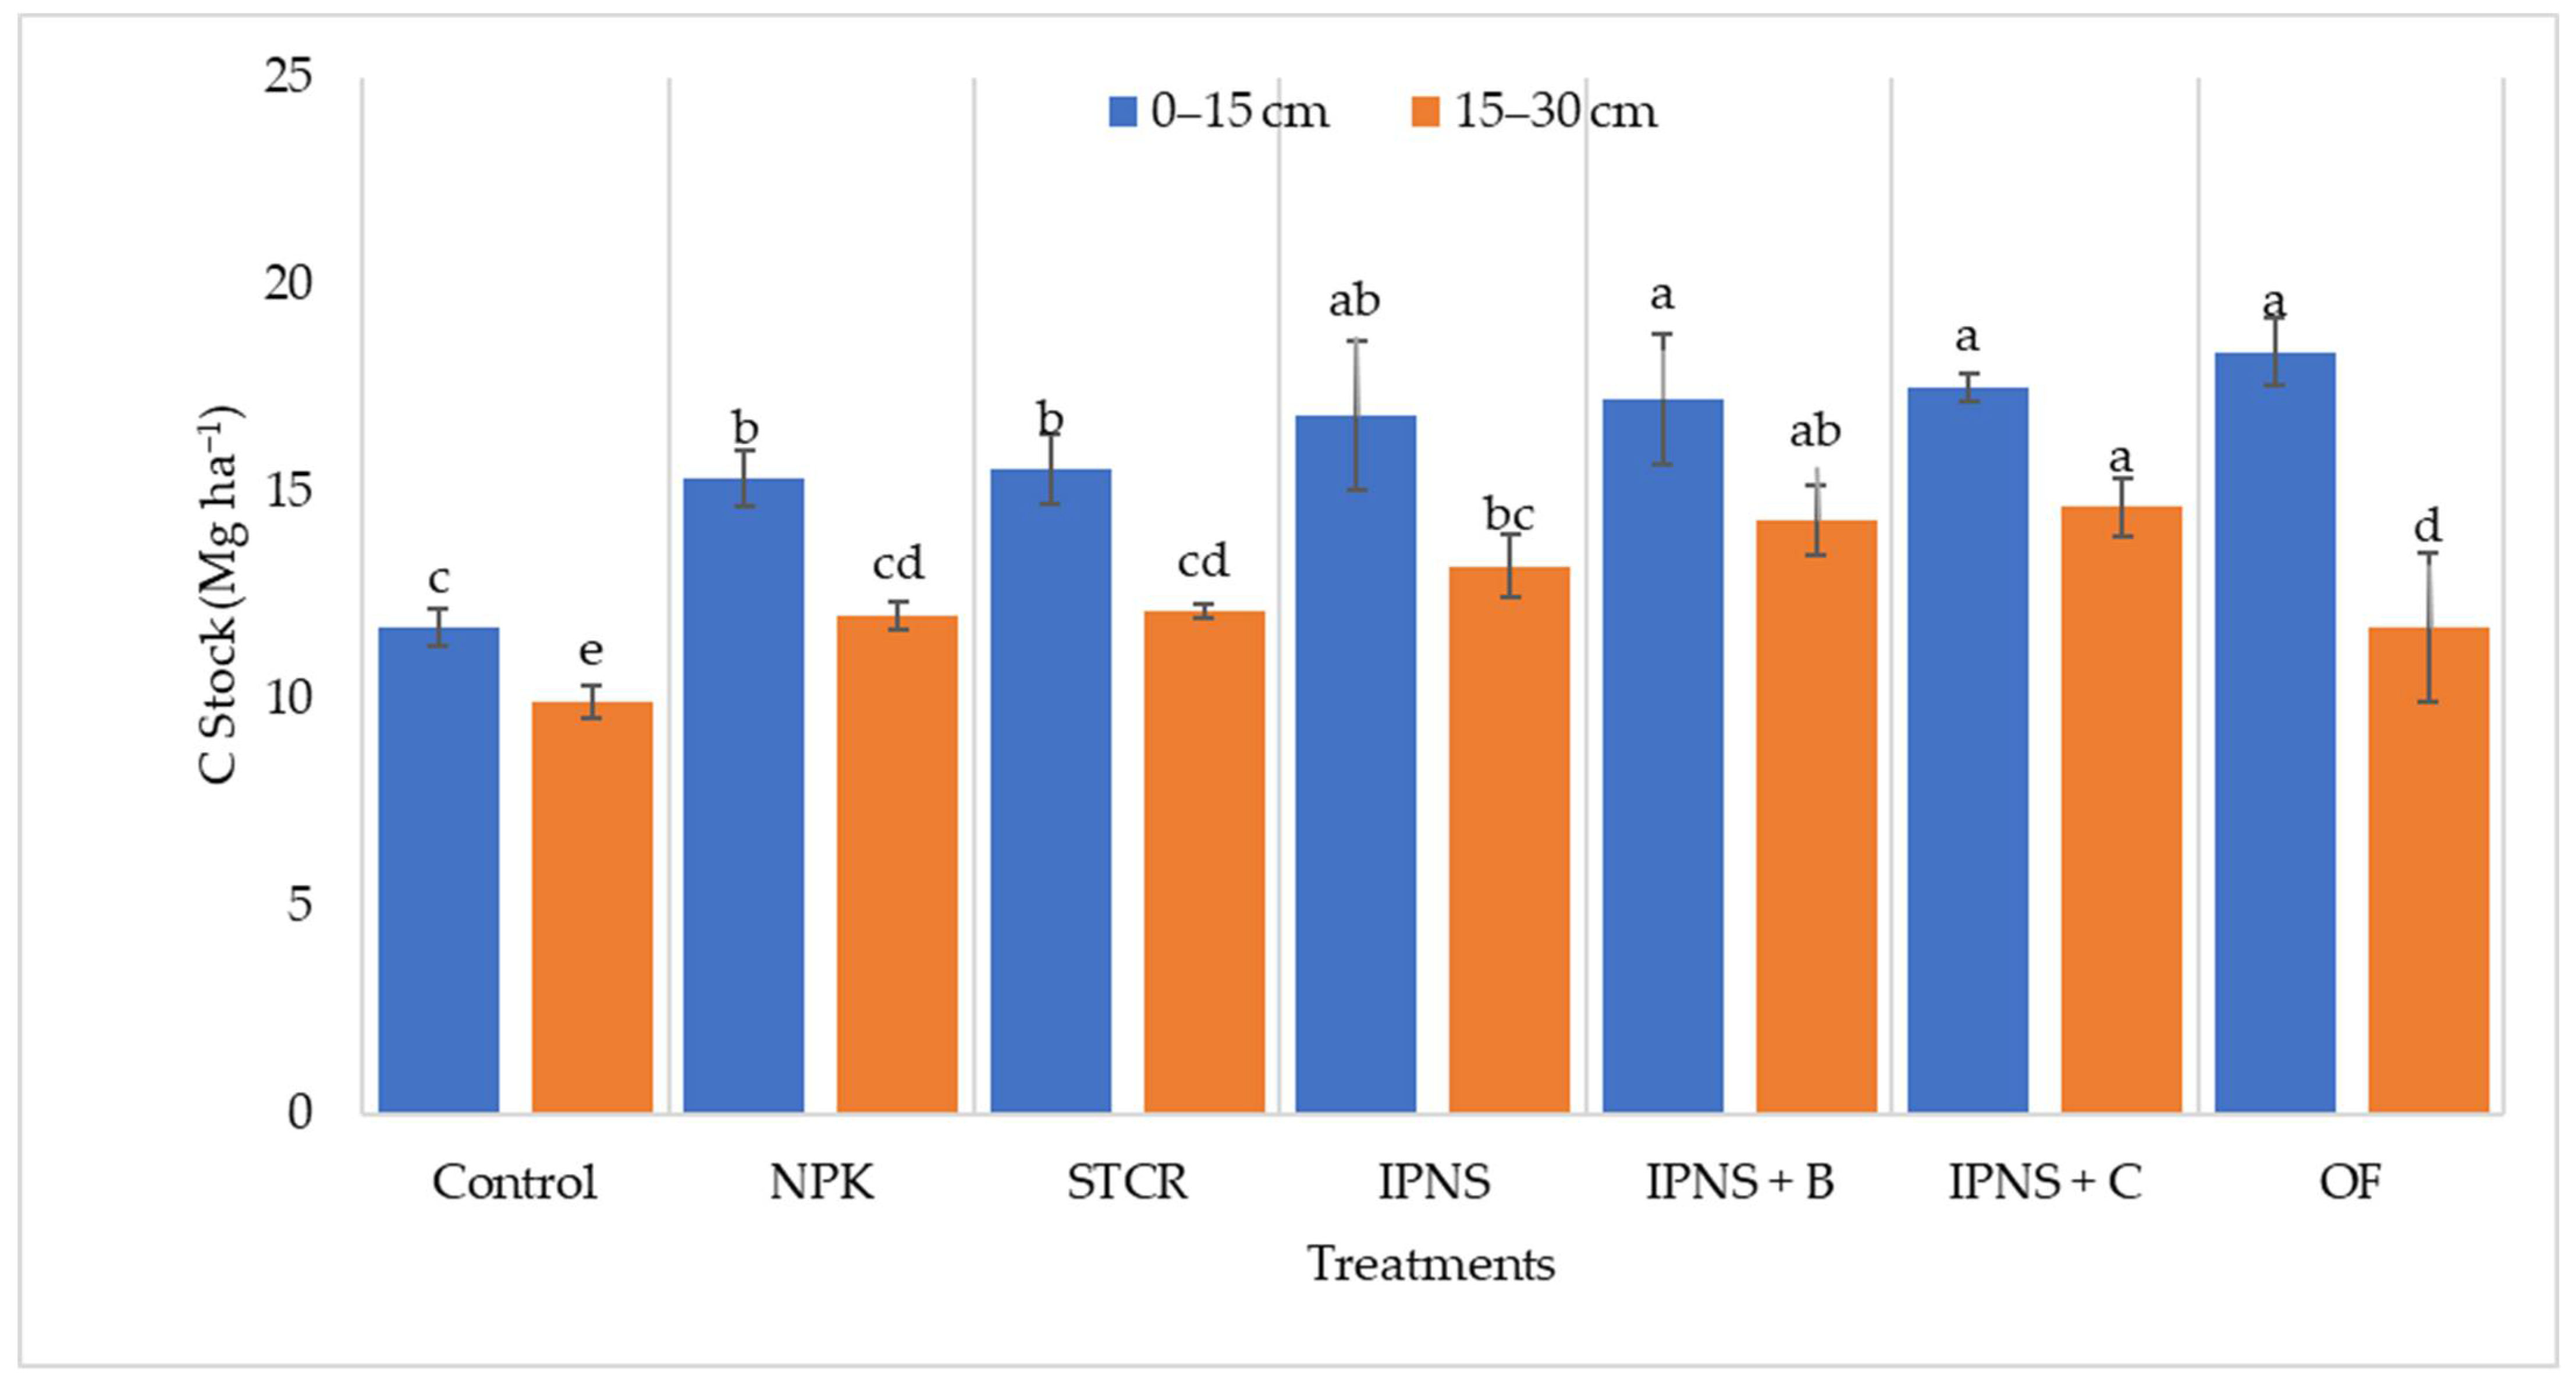
3.11. Carbon Stock (C-Stock)

Consequences exposed that the carbon stock was suggestively ranged (Figure 11). C-stock was varied from 11.73 to 18.39 and 9.95 to 11.75 t ha−1 in the 0–15 and 15–30 cm soil depths, respectively. The suggestively greater amount of carbon stock in surface and subsurface soil (0–15 and 15–30 cm) was supported by organic OF over the rest of the treatment combination (Figure 11).
The build-up of carbon stock in 0–15 and 15–30 cm depths were 18.39 and 11.75 t ha−1 in plots OF management practices, respectively, as against 11.73 and 9.95 t ha−1 in unfertilized control plots, respectively. The carbon stock increased by ~36 and 15% in 0–15 and 15–30 cm soil depth in plots receiving OF management practices, respectively, over the control plots. The carbon stock in the 0–15 cm depth was recorded in following order OF (18.39 t ha−1) > IPNS + C (17.54 t ha−1) > IPNS + B (17.26 t ha−1) > IPNS (16.86 t ha−1) > STCR (15.54 t ha−1) > NPK (15.32 t ha−1) and unfertilized control (11.73 t ha−1).
Although, in the case of 15–30 cm, soil depth maximum was observed in IPNS + C (14.65 t ha−1) followed by IPNS + B (14.32 t ha−1), IPNS (13.22 t ha−1), STCR (12.13 t ha−1), NPK (12.02 t ha−1), OF (11.75 t ha−1) and unfertilized control (9.95 t ha−1) (Figure 11).
OF and IPNS + legumes (both berseem and cowpea) have the highest carbon stock in surface soil. Similarly, subsurface soil plots with IPNS + B and IPNS + C options have higher C-stock after completing 19 cropping system cycles. It could be the addition of a higher amount of crop residue in both options over the years [35,54,55].

3.12. Correlation Matrix

Association between different carbon fractions is suggestively prejudiced by different IPNS options (Table 3). WBC fraction had a significant positive relationship with VLC (r = 0.990 **), LC (r = 0.940 **), TOC (r = 0.978 **), MBC (r = 0.859 *).
Similarly, VLC had a significant positive relationship with LC (r = 0.884 *), LLC (r = 0.885 **), TOC (r = 0.970 **), and MBC (r = 0.862 *). In case of LC, it had a significant positive relationship with LLC (r = 0.952 **), TOC (r = 0.935 **), and MBC (r = 0.830 *). For LLC had a significant positive relationship with only TOC (r = 0.868 **). However, TOC had significant relationship with and MBC (r = 0.945 **). It might be due to the variation in carbon fraction availability due to different nutrient management practices [56,57,58,59].

4. Conclusions and Recommendations

The IPNS strategies have the potential to support carbon stock, and the co-managing of IPNS and OF options is (+17%) higher than the RDF (+36%) higher over control after completing 19 cropping system cycles. Reductions in carbon stock in control and RDF were higher than that of IPNS + legumes options. Better strategies for best nutrient management practices and other innovative IPNS management strategies need to be developed and applied to improve the carbon balance in the soil system.
We also found that certain nutrient management strategies (STCR, OF, IPNS + berseem, and cowpea) have a suitable potential for sustaining carbon stock. When legumes (cowpea and berseem) were grown every three years, nutrient availabilities to plants were positive in both IPNS options. At the level of legume, inclusion reported berseem (+32%) and cowpea (+33%) than the control plot.

Author Contributions

S.K.M.: investigation, writing—original draft, visualization. B.S.D.: conceptualization, supervision. M.C.M.: software, supervision. S.P.D.: conceptualization, supervision. V.K.S.: conceptualization, supervision. R.P.M.: maintenance, supervision. D.C.: methodology, supervision. A.D.: formal and data analysis, editing. V.S.M.: data curation, writing, review, visualization, editing. All authors have read and agreed to the published version of the manuscript.

Funding

This research has received no external funding.

Institutional Review Board Statement

Not applicable.

Data Availability Statement

The data that support the findings of this study are available from the corresponding author upon reasonable request.

Conflicts of Interest

All authors declared that no conflict of interest.

Abbreviations

C—carbon; C-stock—carbon stock; IPNS + B—IPNS + Berseem; IPNS + C—IPNS + Cowpea; IPNS—integrated plant nutrition system (IPNS); LC—labile carbon; LLC—less labile carbon; NLC—non-labile carbon; NPK—nitrogen, phosphorous, potassium; OF—organic farming; RDF—recommended dose of fertilizer; SOC—soil organic carbon; STCR—soil test crop response; VLC—very labile carbon.

References

  1. Abhilash, P.C. Restoring the Unrestored: Strategies for Restoring Global Land during the UN Decade on Ecosystem Restoration (UN-DER). Land 2021, 10, 201. [Google Scholar] [CrossRef]
  2. Edrisi, S.A.; Abhilash, P.C. Exploring marginal and degraded lands for biomass and bioenergy production: An Indian scenario. Renew. Sustain. Energy Rev. 2016, 54, 1537–1551. [Google Scholar] [CrossRef]
  3. Tiefenbacher, A.; Sandén, T.; Haslmayr, H.-P.; Miloczki, J.; Wenzel, W.; Spiegel, H. Optimizing Carbon Sequestration in Croplands: A Synthesis. Agronomy 2021, 11, 882. [Google Scholar] [CrossRef]
  4. Lal, R. Soil management for carbon sequestration. S. Afr. J. Plant Soil 2021, 38, 231–237. [Google Scholar] [CrossRef]
  5. Lal, R. Soil Carbon Sequestration Impacts on Global Climate Change and Food Security. Science 2004, 304, 1623–1627. [Google Scholar] [CrossRef] [Green Version]
  6. Davidson, E.A.; Janssens, I.A. Temperature sensitivity of soil carbon decomposition and feedbacks to climate change. Nature 2006, 440, 165–173. [Google Scholar] [CrossRef] [Green Version]
  7. Paustian, K.; Lehmann, J.; Ogle, S.; Reay, D.; Robertson, G.P.; Smith, P. Climate-smart soils. Nature 2016, 532, 49–57. [Google Scholar] [CrossRef] [Green Version]
  8. Singh, M.; Sarkar, B.; Sarkar, S.; Churchman, J.; Bolan, N.; Mandal, S.; Menon, M.; Purakayastha, T.J.; Beerling, D.J. Stabilization of Soil Organic Carbon as Influenced by Clay Mineralogy. In Advances in Agronomy; Elsevier: Amsterdam, The Netherlands, 2018; Volume 148, pp. 33–84. ISBN 978-0-12-815179-2. [Google Scholar]
  9. Janzen, H.H. Carbon cycling in earth systems—A soil science perspective. Agric. Ecosyst. Environ. 2004, 104, 399–417. [Google Scholar] [CrossRef]
  10. Meena, V.S.; Mondal, T.; Pandey, B.M.; Mukherjee, A.; Yadav, R.P.; Choudhary, M.; Singh, S.; Bisht, J.K.; Pattanayak, A. Land use changes: Strategies to improve soil carbon and nitrogen storage pattern in the mid-Himalaya ecosystem, India. Geoderma 2018, 321, 69–78. [Google Scholar] [CrossRef]
  11. Edrisi, S.A.; Abhilash, P.C. Need of transdisciplinary research for accelerating land restoration during the UN Decade on Ecosystem Restoration. Restor. Ecol. 2021, 29, e13531. [Google Scholar] [CrossRef]
  12. Meena, V.S.; Ghosh, B.N.; Singh, R.J.; Bhattacharyya, R.; Sharma, N.K.; Alam, N.M.; Meena, S.K.; Mishra, P.K. Land use types and topographic position affect soil aggregation and carbon management in the mountain agro-ecosystems of the Indian Himalayas. Land Degrad. Dev. 2020, 32, 3992–4003. [Google Scholar] [CrossRef]
  13. Guillaume, T.; Bragazza, L.; Levasseur, C.; Libohova, Z.; Sinaj, S. Long-term soil organic carbon dynamics in temperate cropland-grassland systems. Agric. Ecosyst. Environ. 2021, 305, 107184. [Google Scholar] [CrossRef]
  14. Rumpel, C.; Amiraslani, F.; Chenu, C.; Garcia Cardenas, M.; Kaonga, M.; Koutika, L.-S.; Ladha, J.; Madari, B.; Shirato, Y.; Smith, P.; et al. The 4p1000 initiative: Opportunities, limitations and challenges for implementing soil organic carbon sequestration as a sustainable development strategy. Ambio 2020, 49, 350–360. [Google Scholar] [CrossRef] [Green Version]
  15. Wang, W.; Sardans, J.; Zeng, C.; Zhong, C.; Li, Y.; Peñuelas, J. Responses of soil nutrient concentrations and stoichiometry to different human land uses in a subtropical tidal wetland. Geoderma 2014, 232, 459–470. [Google Scholar] [CrossRef] [Green Version]
  16. Mattila, T.J.; Hagelberg, E.; Söderlund, S.; Joona, J. How farmers approach soil carbon sequestration? Lessons learned from 105 carbon-farming plans. Soil Tillage Res. 2022, 215, 105204. [Google Scholar] [CrossRef]
  17. Baveye, P.C.; Schnee, L.S.; Boivin, P.; Laba, M.; Radulovich, R. Soil Organic Matter Research and Climate Change: Merely Re-storing Carbon Versus Restoring Soil Functions. Front. Environ. Sci. 2020, 8, 1–8. [Google Scholar] [CrossRef]
  18. Lal, R. Restoring Soil Quality to Mitigate Soil Degradation. Sustainability 2015, 7, 5875–5895. [Google Scholar] [CrossRef] [Green Version]
  19. Wu, L.; Zhang, S.; Ma, R.; Chen, M.; Wei, W.; Ding, X. Carbon sequestration under different organic amendments in saline-alkaline soils. CATENA 2021, 196, 104882. [Google Scholar] [CrossRef]
  20. Choudhary, M.; Panday, S.C.; Meena, V.S.; Singh, S.; Yadav, R.P.; Mahanta, D.; Mondal, T.; Mishra, P.K.; Bisht, J.K.; Pattanayak, A. Long-term effects of organic manure and inorganic fertilization on sustainability and chemical soil quality indicators of soybean-wheat cropping system in the Indian mid-Himalayas. Agric. Ecosyst. Environ. 2018, 257, 38–46. [Google Scholar] [CrossRef]
  21. Wen, Y.; Liu, W.; Deng, W.; He, X.; Yu, G. Impact of agricultural fertilization practices on organo-mineral associations in four long-term field experiments: Implications for soil C sequestration. Sci. Total Environ. 2019, 651, 591–600. [Google Scholar] [CrossRef]
  22. Ghosh, B.N.; Meena, V.S.; Singh, R.J.; Alam, N.M.; Patra, S.; Bhattacharyya, R.; Sharma, N.K.; Dadhwal, K.S.; Mishra, P.K. Effects of fertilization on soil aggregation, carbon distribution and carbon management index of maize-wheat rotation in the north-western Indian Himalayas. Ecol. Indic. 2019, 105, 415–424. [Google Scholar] [CrossRef]
  23. Chen, S.; Arrouays, D.; Angers, D.A.; Martin, M.P.; Walter, C. Soil carbon stocks under different land uses and the applicability of the soil carbon saturation concept. Soil Tillage Res. 2019, 188, 53–58. [Google Scholar] [CrossRef]
  24. Wankhede, M.; Dakhli, R.; Manna, M.C.; Sirothia, P.; Rahman, M.M.; Ghosh, A.; Bhattacharyya, P.; Singh, M.; Jha, S.; Patra, A.K. Long-term manure application for crop yield stability and carbon sequestration in subtropical region. Soil Use Manag. 2021, 37, 264–276. [Google Scholar] [CrossRef]
  25. Sharma, N.K.; Singh, R.J.; Mandal, D.; Kumar, A.; Alam, N.M.; Keesstra, S. Increasing farmer’s income and reducing soil erosion using intercropping in rainfed maize-wheat rotation of Himalaya, India. Agric. Ecosyst. Environ. 2017, 247, 43–53. [Google Scholar] [CrossRef]
  26. Singh, R.J.; Ghosh, B.N.; Sharma, N.K.; Patra, S.; Dadhwal, K.S.; Meena, V.S.; Deshwal, J.S.; Mishra, P.K. Effect of seven years of nutrient supplementation through organic and inorganic sources on productivity, soil and water conservation, and soil fertility changes of maize-wheat rotation in north-western Indian Himalayas. Agric. Ecosyst. Environ. 2017, 249, 177–186. [Google Scholar] [CrossRef]
  27. Meena, S.K.; Dwivedi, B.S.; Meena, M.C.; Datta, S.P.; Singh, V.K.; Mishra, R.P.; Chakraborty, D.; Dey, A.; Meena, V.S. Long-Term Nutrient Supply Options: Strategies to Improve Soil Phosphorus Availability in the Rice-Wheat System. Sustainability 2022, 14, 8629. [Google Scholar] [CrossRef]
  28. Walkley, A.; Black, I.A. An examination of the Degtjareff method for determining soil organic matter, and a proposed modification of the chromic acid titration method. Soil Sci. 1934, 37, 29–38. [Google Scholar] [CrossRef]
  29. Jenkinson, D.S.; Powlson, D.S. The effects of biocidal treatments on metabolism in soil—V: A method for measuring soil biomass. Soil Biol. Biochem. 1976, 8, 209–213. [Google Scholar] [CrossRef]
  30. Tirol-Padre, A.; Ladha, J.K. Assessing the Reliability of Permanganate-Oxidizable Carbon as an Index of Soil Labile Carbon. Soil Sci. Soc. Am. J. 2004, 68, 969–978. [Google Scholar] [CrossRef]
  31. Gomez, K.A.; Gomez, A.A. Statistical Procedures for Agricultural Research; John Wiley and Sons: New York, NY, USA, 1984; 680p. Available online: https://pdf.usaid.gov/pdf_docs/PNAAR208.pdf (accessed on 1 September 2022).
  32. Manna, M.C.; Swarup, A.; Wanjari, R.H.; Mishra, B.; Shahi, D.K. Long-term fertilization, manure and liming effects on soil organic matter and crop yields. Soil Tillage Res. 2007, 94, 397–409. [Google Scholar] [CrossRef]
  33. von Lützow, M.; Kögel-Knabner, I.; Ludwig, B.; Matzner, E.; Flessa, H.; Ekschmitt, K.; Guggenberger, G.; Marschner, B.; Kalbitz, K. Stabilization mechanisms of organic matter in four temperate soils: Development and application of a conceptual model. J. Plant Nutr. Soil Sci. 2008, 171, 111–124. [Google Scholar] [CrossRef]
  34. Bhattacharyya, R.; Tuti, M.D.; Kundu, S.; Bisht, J.K.; Bhatt, J.C. Conservation Tillage Impacts on Soil Aggregation and Carbon Pools in a Sandy Clay Loam Soil of the Indian Himalayas. Soil Sci. Soc. Am. J. 2012, 76, 617–627. [Google Scholar] [CrossRef]
  35. Ghosh, A.; Bhattacharyya, R.; Meena, M.C.; Dwivedi, B.; Singh, G.; Agnihotri, R.; Sharma, C. Long-term fertilization effects on soil organic carbon sequestration in an Inceptisol. Soil Tillage Res. 2018, 177, 134–144. [Google Scholar] [CrossRef]
  36. Schiedung, M.; Tregurtha, C.S.; Beare, M.H.; Thomas, S.M.; Don, A. Deep soil flipping increases carbon stocks of New Zealand grasslands. Glob. Chang. Biol. 2019, 25, 2296–2309. [Google Scholar] [CrossRef] [Green Version]
  37. Herrero, M.; Henderson, B.; Havlík, P.; Thornton, P.K.; Conant, R.T.; Smith, P.; Wirsenius, S.; Hristov, A.N.; Gerber, P.; Gill, M.; et al. Greenhouse gas mitigation potentials in the livestock sector. Nat. Clim. Chang. 2016, 6, 452–461. [Google Scholar] [CrossRef] [Green Version]
  38. Sykes, A.J.; Macleod, M.; Eory, V.; Rees, R.M.; Payen, F.; Myrgiotis, V.; Williams, M.; Sohi, S.; Hillier, J.; Moran, D.; et al. Characterising the biophysical, economic and social impacts of soil carbon sequestration as a greenhouse gas removal technology. Glob. Chang. Biol. 2020, 26, 1085–1108. [Google Scholar] [CrossRef] [Green Version]
  39. Bol, R.; Poirier, N.; Balesdent, J.; Gleixner, G. Molecular turnover time of soil organic matter in particle-size fractions of an arable soil. Rapid Commun. Mass Spectrom. 2009, 23, 2551–2558. [Google Scholar] [CrossRef]
  40. Ladha, J.K.; Reddy, C.K.; Padre, A.T.; van Kessel, C. Role of Nitrogen Fertilization in Sustaining Organic Matter in Cultivated Soils. J. Environ. Qual. 2011, 40, 1756–1766. [Google Scholar] [CrossRef] [Green Version]
  41. Zhou, X.; Chen, C.; Wu, H.; Xu, Z. Dynamics of soil extractable carbon and nitrogen under different cover crop residues. J. Soils Sediments 2012, 12, 844–853. [Google Scholar] [CrossRef]
  42. Mclauchlan, K. The Nature and Longevity of Agricultural Impacts on Soil Carbon and Nutrients: A Review. Ecosystems 2006, 9, 1364–1382. [Google Scholar] [CrossRef]
  43. Peichl, M.; Thevathasan, N.V.; Gordon, A.M.; Huss, J.; Abohassan, R.A. Carbon Sequestration Potentials in Temperate Tree-Based Intercropping Systems, Southern Ontario, Canada. Agrofor. Syst. 2006, 66, 243–257. [Google Scholar] [CrossRef]
  44. Fichtner, A.; von Oheimb, G.; Härdtle, W.; Wilken, C.; Gutknecht, J.L.M. Effects of anthropogenic disturbances on soil microbial communities in oak forests persist for more than 100 years. Soil Biol. Biochem. 2014, 70, 79–87. [Google Scholar] [CrossRef]
  45. Ahn, M.-Y.; Zimmerman, A.R.; Comerford, N.B.; Sickman, J.O.; Grunwald, S. Carbon Mineralization and Labile Organic Carbon Pools in the Sandy Soils of a North Florida Watershed. Ecosystems 2009, 12, 672–685. [Google Scholar] [CrossRef]
  46. Filep, T.; Draskovits, E.; Szabó, J.; Koós, S.; László, P.; Szalai, Z. The dissolved organic matter as a potential soil quality indicator in arable soils of Hungary. Environ. Monit. Assess. 2015, 187, 479–490. [Google Scholar] [CrossRef] [Green Version]
  47. Bongiorno, G.; Bünemann, E.K.; Oguejiofor, C.U.; Meier, J.; Gort, G.; Comans, R.; Mäder, P.; Brussaard, L.; de Goede, R. Corrigendum to “Sensitivity of labile carbon fractions to tillage and organic matter management and their potential as comprehensive soil quality indicators across pedoclimatic conditions in Europe”. Ecol. Indic. 2019, 99, 38–50. [Google Scholar] [CrossRef]
  48. Meng, F.; Yang, X.; Riksen, M.; Geissen, V. Effect of different polymers of microplastics on soil organic carbon and nitrogen—A mesocosm experiment. Environ. Res. 2022, 204, 111938. [Google Scholar] [CrossRef]
  49. Jastrow, J.D.; Amonette, J.E.; Bailey, V.L. Mechanisms controlling soil carbon turnover and their potential application for enhancing carbon sequestration. Clim. Chang. 2007, 80, 5–23. [Google Scholar] [CrossRef]
  50. Bhattacharyya, R.; Prakash, V.; Kundu, S.; Srivastva, A.; Gupta, H. Soil aggregation and organic matter in a sandy clay loam soil of the Indian Himalayas under different tillage and crop regimes. Agric. Ecosyst. Environ. 2009, 132, 126–134. [Google Scholar] [CrossRef]
  51. Yan, M.; Korshin, G.; Wang, D.; Cai, Z. Characterization of dissolved organic matter using high-performance liquid chromatography (HPLC)–size exclusion chromatography (SEC) with a multiple wavelength absorbance detector. Chemosphere 2012, 87, 879–885. [Google Scholar] [CrossRef]
  52. Oelofse, M.; Markussen, B.; Knudsen, L.; Schelde, K.; Olesen, J.E.; Jensen, L.S.; Bruun, S. Do soil organic carbon levels affect potential yields and nitrogen use efficiency? An analysis of winter wheat and spring barley field trials. Eur. J. Agron. 2015, 66, 62–73. [Google Scholar] [CrossRef]
  53. Yang, W.; Xia, L.; Zhu, Z.; Jiang, L.; Cheng, X.; An, S. Shift in soil organic carbon and nitrogen pools in different reclaimed lands following intensive coastal reclamation on the coasts of eastern China. Sci. Rep. 2019, 9, 5921. [Google Scholar] [CrossRef] [PubMed] [Green Version]
  54. Li, Z.; Liu, M.; Wu, X.; Han, F.; Zhang, T. Effects of long-term chemical ertilization and organic amendments on dynamics of soil organic C and total N in paddy soil derived from barren land in subtropical China. Soil Till. Res. 2010, 106, 268–274. [Google Scholar] [CrossRef]
  55. Bhattacharyya, R.; Kundu, S.; Srivastva, A.K.; Gupta, H.S.; Prakash, V.; Bhatt, J.C. Long term fertilization effects on soil organic carbon pools in a sandy loam soil of the Indian sub-Himalayas. Plant Soil 2010, 341, 109–124. [Google Scholar] [CrossRef]
  56. Kusumawati, A.; Hanudin, E.; Purwanto, B.H.; Nurudin, M. Composition of organic C fractions in soils of different texture affected by sugarcane monoculture. Soil Sci. Plant Nutr. 2020, 66, 206–213. [Google Scholar] [CrossRef]
  57. Trivedi, A.; Bhattacharyya, R.; Biswas, D.R.; Das, S.; Das, T.K.; Mahapatra, P.; Shahi, D.K.; Sharma, C. Long-term impacts of integrated nutrient management with equivalent nutrient doses to mineral fertilization on soil organic carbon sequestration in a sub-tropical Alfisol of India. Carbon Manag. 2020, 11, 483–497. [Google Scholar] [CrossRef]
  58. Ghosh, B.N.; Meena, V.S.; Alam, N.M.; Dogra, P.; Bhattacharyya, R.; Sharma, N.K.; Mishra, P.K. Impact of conservation practices on soil aggregation and the carbon management index after seven years of maize–wheat cropping system in the Indian Himalayas. Agric. Ecosyst. Environ. 2016, 216, 247–257. [Google Scholar] [CrossRef]
  59. Liang, Q.; Chen, H.Q.; Gong, Y.S.; Fan, M.S.; Yang, H.F.; Lal, R.; Kuzyakov, Y. Effects of 15 years of manure and inorganic fertilizers on soil organic carbon fractions in a wheat-maize system in the North China Plain. Nutr. Cycl. Agroecosyst. 2012, 92, 21–33. [Google Scholar] [CrossRef]
Figure 1. Carbon cycle in the soil–plant–microbes–atmosphere interaction.
Agriculture 12 01822 g001
Figure 2. Treatment combinations used during experimental periods.
Agriculture 12 01822 g002
Figure 3. Systematic representation of soil carbon fractions of varying oxidizability.
Agriculture 12 01822 g003
Figure 4. Effect of nutrient management on Walkley–Black carbon. Means ± standard deviation of different treatments followed by the different lower-case letter (a–d) are significantly different at p < 0.05 level of significance according to DMRT.
Agriculture 12 01822 g004
Figure 5. Effect of nutrient management on HWEC. Means ± standard deviation of different treatments followed by the different lower-case letter (a–c) are significantly different at p < 0.05 level of significance according to DMRT, NS—non significant.
Agriculture 12 01822 g005
Figure 6. Effect of nutrient management on KMnO4-C. Means ± standard deviation of different treatments followed by the different lower-case letter (a–c) are significantly different at p < 0.05 level of significance according to DMRT.
Agriculture 12 01822 g006
Figure 7. Effect of nutrient management on SMBC. Means ± standard deviation of different treatments followed by the different lower-case letter (a–d) are significantly different at p < 0.05 level of significance according to DMRT.
Agriculture 12 01822 g007
Figure 8. Effect of nutrient management on C fractions contribution (0–15 cm).
Agriculture 12 01822 g008aAgriculture 12 01822 g008b
Figure 9. Effect of nutrient management on C fractions contribution (15–30 cm).
Agriculture 12 01822 g009aAgriculture 12 01822 g009b
Figure 10. Effect of nutrient management on overall C fractions contribution under rice-wheat production system.
Agriculture 12 01822 g010
Figure 11. Effect of nutrient management on C-stock contribution. Means ± standard deviation of different treatments followed by the different lower-case letter (a–e) are significantly different at p < 0.05 level of significance according to DMRT.
Agriculture 12 01822 g011
Table 1. Effect of nutrient management on soil C fractions (0–15 cm) under rice-wheat production system. Means ± standard deviation of different treatments followed by the different lower-case letter (a–d) are significantly different at p < 0.05 level of significance according to DMRT, NS—non significant.
TreatmentTOCVLCLCLLCNLC
g C kg−1
Control5.25 ± 0.20 d2.55 ± 0.33 d0.50 ± 0.06 d0.32 ± 0.08 c1.88 ± 0.21 NS
NPK6.68 ± 0.29 c3.99 ± 0.21 c0.75 ± 0.13 c0.48 ± 0.11 b1.46 ± 0.25 NS
STCR6.77 ± 0.36 c4.00 ± 0.17 c0.76 ± 0.09 c0.49 ± 0.09 b1.52 ± 0.38 NS
IPNS7.92 ± 0.84 b4.83 ± 0.59 b0.85 ± 0.09 bc0.57 ± 0.05 b1.67 ± 0.24 NS
IPNS + B8.22 ± 0.75 ab4.87 ± 0.27 b0.98 ± 0.16 b0.59 ± 0.11 b1.78 ± 0.40 NS
IPNS + C8.35 ± 0.17 ab4.90 ± 0.17 ab0.99 ± 0.13 b0.61 ± 0.07 b1.86 ± 0.14 NS
OF8.88 ± 0.39 a5.36 ± 0.43 a1.28 ± 0.16 a0.78 ± 0.10 a1.47 ± 0.41 NS
Table 2. Effect of nutrient management on soil C fractions (15–30 cm) under rice-wheat production system. Means ± standard deviation of different treatments followed by the different lower-case letter (a–d) are significantly different at p < 0.05 level of significance according to DMRT, NS—non significant.
TreatmentTOCVLCLCLLCNLC
g C kg−1
Control4.36 ± 0.18 d2.13 ± 0.16 d0.31± 0.06 NS0.20 ± 0.07 NS1.72 ± 0.26 NS
NPK5.13 ± 0.14 c2.94 ± 0.17 c0.39 ± 0.05 NS0.28 ± 0.05 NS1.53 ± 0.15 NS
STCR5.18 ± 0.08 c2.94 ± 0.14 c0.39 ± 0.04 NS0.29 ± 0.05 NS1.56 ± 0.17 NS
IPNS6.12 ± 0.36 b3.58 ± 0.51 b0.41 ± 0.08 NS0.37 ± 0.03 NS1.76 ± 0.09 NS
IPNS + B6.73 ± 0.39 a4.43 ± 0.15 a0.39 ± 0.04 NS0.38 ± 0.06 NS1.53 ± 0.24 NS
IPNS + C6.98 ± 0.34 a4.44 ± 0.20 a0.44 ± 0.13 NS0.36 ± 0.15 NS1.74 ± 0.37 NS
OF5.68 ± 0.86 bc3.30 ± 0.07 bc0.34 ± 0.04 NS0.28 ± 0.08 NS1.78 ± 0.36 NS
Table 3. Effect of nutrient management on relationship between C fractions. ** Correlation is significant at the 0.01 level (2-tailed); * Correlation is significant at the 0.05 level (2-tailed); NS—Non significant.
PropertiesVLCLCLLCNLCTOCMBC
WBC0.990 **0.940 **0.935 **0.205 NS0.978 **0.859 *
VLC10.884 **0.885 **0.211 NS0.970 **0.862 *
LC 10.952 **0.269 NS0.935 **0.830 *
LLC 1−0.027 NS0.868 *0.678 NS
NLC 10.403 NS0.668 NS
TOC 10.945 **
Publisher’s Note: MDPI stays neutral with regard to jurisdictional claims in published maps and institutional affiliations.

