Article

Sorghum–Grass Intercropping Systems under Varying Planting Densities in a Semi-Arid Region: Focusing on Soil Carbon and Grain Yield in the Conservation Systems

by
Risely Ferraz-Almeida
1,*,
Carlos Juliano Brant Albuquerque
2,
Reginaldo Camargo
3,
Ernane Miranda Lemes
3,
Renato Soares de Faria
4 and
Regina Maria Quintão Lana
3
1
Escola Superior de Agricultura Luiz de Queiroz, Avenida Pádua Dias, Num. 11, Piracicaba 13418-900, SP, Brazil
2
Instituto de Ciências Agrárias, Universidade Federal de Minas Gerais, Avenida Universitária, Num. 1000, Montes Claros 39404-547, MG, Brazil
3
Instituto de Ciências Agrarias, Universidade Federal de Uberlândia, Road BR 050, km 78, Uberlândia 38400-000, MG, Brazil
4
Empresa de Pesquisa Agropecuária de Minas Gerais, Road MGT 122, km 155, Nova Porteirinha 39525-000, MG, Brazil
*
Author to whom correspondence should be addressed.
Agriculture 2022, 12(11), 1762; https://doi.org/10.3390/agriculture12111762
Submission received: 12 September 2022 / Revised: 19 October 2022 / Accepted: 20 October 2022 / Published: 25 October 2022
(This article belongs to the Special Issue Soil Organic Matter and Its Role in Soil Fertility)

Abstract

:
A major challenge in sorghum intercropping systems is maintaining their yields compared to the yields of the solo crops, especially in arid and semi-arid regions. This study aimed to test the hypothesis that intercropping systems using sorghum (Sorghum bicolor (L.) Moench.) and Brachiaria sp. are viable means to increase sorghum production and soil carbon in the conservation systems. Field trials were conducted in the semi-arid region of Minas Gerais, Brazil, during two crop cycles of sorghum associated with different grasses (Andropogon gayanus—AG; Cenchrus ciliaris cv. Aridus—CCA; Cenchrus ciliaris cv. 131—CC; Brachiaria decumbents—BD; Brachiaria brizantha—BB; Brachiaria ruziziensis—BR; Panicum maximum—PM), using row spacings of 0.4 and 0.8 m. Panicles of sorghum (yield) and grass dry matter were collected to determine yields. Results showed that the addition of grasses in systems decreased the grain yield in all systems, except in the systems using sorghum with CCA in 0.4 m, AG in 0.8 m, or BR in 0.8 m. In the 0.4 m row spacing, the sorghum associations with CC, BB, or PM are greater alternatives to increase soil carbon. However, when the row spacing was increased, the sole sorghum was the best alternative to increase the carbon. In machine learning, sorghum systems with CCA and AG are better alternatives to increase the yields, while sorghum with CC, PM, BR, and BB increases the grass dry matter in soil.

1. Introduction

The sustainable use of agricultural resources, especially soil and water, is a major challenge globally [1]. Production systems need to produce food with less environmental impact than they do currently. The no-tillage system is an agricultural technique that does not disturb the soil, through no-tillage, crop integration, and species rotations, increasing the stocks’ soil organic matter, aggregation, moisture retention, and cation exchange capacity in the soil, and directly impacting crop production and the diversity of fauna and flora [2]. According to FAO [3], conservation systems are great alternatives to avoid soil degradation and restore soil with a high level of erosion and compaction.
In semi-arid regions, the intercropping system is a challenge due to the seasonal water restrictions that impact crop production and crop residue accumulation in the soil. Alvalá et al. [4] showed that the Brazilian semi-arid region presents dry periods directly affecting the establishment of communities in the countryside.
Sorghum (Sorghum bicolor (L.) Moench.) is presented as a substitute for maize (Zea mays) in the feeding of ruminants, poultry, and pigs in semi-arid regions, where maize presents a low production due to limited water and high temperatures. Sorghum has a high potential as an energy source with high biomass production in the short cycle (≅4 months) and a low demand for water and nutrients [5]. Buso et al. [6] showed that sorghum has a high capacity to produce high-quality forage for animal feed, mainly in periods of low production of cultivated or native systems with cactus (Opuntia stricta; [7]), crotalaria (Crotalaria ochoroleuca; [8]), soybean (Glycine max; [9]), cowpea (Vigna unguiculate [10]), and different grass cultivars (e.g., Brachiaria sp. [11]). Mattos et al. [12] showed that B. brizantha cv. Marandu and B. brizantha presented a high leaf area in water stress conditions. However, Oliveira et al. [13] did not recommend establishing B. brizantha cv. Marandu associated with sorghum in regions of hydric stress. Albuquerque et al. [14] showed a low sorghum yield in its intercropping with Panicum maximum in Leme do Prado and Jaíba (Minas Gerais, Brazil). However, there was a positive effect of sorghum yield when intercropped with B. brizantha (average of 4.9 Mg ha−1), B. decumbens (average of 4.7 Mg ha−1), and Andropogon gayanus (average of 5.5 Mg ha−1).
In semi-arid regions, irregular rainfall combined with low soil fertility reduces the production of monoculture systems [15]. The success of intercropping sorghum with grasses could be a promising system to increase crop residue accumulation (i.e., as a cover crop) that promotes soil health through carbon sequestration, and thereby promoting grain production [16]. Accumulation of soil organic matter positively reflects on soil preservation with a higher porosity [17,18], biological activities [19], and stocks of nutrients in the soil [20,21]. Generally, the intercropping systems have an association between legumes and cereals to improve the use of soil nitrogen resources caused by biological nitrogen fixation by legumes, reducing the requirement for synthetic fertilizer nitrogen [22,23]. In our study, we focused on sorghum and grasses due to the possibility of the substitution of maize by sorghum in the feeding of ruminants as an alternative to promoting food and nutritional security.
Based on this, the intercropping of sorghum and grasses can be an alternative to increase soil quality, positively impact society, and establish communities in the countryside. The aims of the study were the following: to (i) identify sorghum planting densities in association with grasses that lead to higher grain yields in a system with simultaneous sowing (iii) demonstrate the grain production and the soil carbon after the intercropping systems of sorghum and grasses in a semi-arid region.

2. Materials and Methods

2.1. Site Characterization

Field trials were conducted in an experimental area of the Empresa Agropecuária de Minas Gerais (EPAMIG), Gorutuba farm, in Nova Porteirinha, Minas Gerais (14°47′ S and 43°18′ W, 516 m altitude), from 2015 to 2017. The region presents a climate classified as BSh (hot semi-arid climate) according to the Köppen classification with summer rains, well-defined dry periods in winter, an annual average rainfall of 700 mm, and an average temperature of 26 °C (Climate-data, 2021).
The weather data were obtained from the meteorological station located close to the site, and they were used to calculate the water balance, according to Thornthwaite and Mather (1955), (Figure 1), which represents the balance between the inflow and outflow of water in the system (Hordon, 1998).
Before the sowing of grasses, soil samples were collected from six positions (replications) at 0.0–0.3 m soil layers (i.e., at 0.1 m depth intervals), for physical and chemical characterization (Table 1). The soil analyses were performed in the Epamig’s soil fertility laboratory in Nova Porteirinha, Minas Gerais, following the recommendation of EMBRAPA (1997). The soil was classified as a Ferralsol (FAO, 1998), corresponding to a Latossolo in the Brazilian Soil Classification System (EMBRAPA, 2018), with a sandy clay loam texture and average contents of clay, silt, and sand of 270; 360; and 630 g kg−1, respectively, at 0 to 0.2 m soil depths. The sites have been cultivated with pasture in the previous 15 years.

2.2. Experimental Characterization

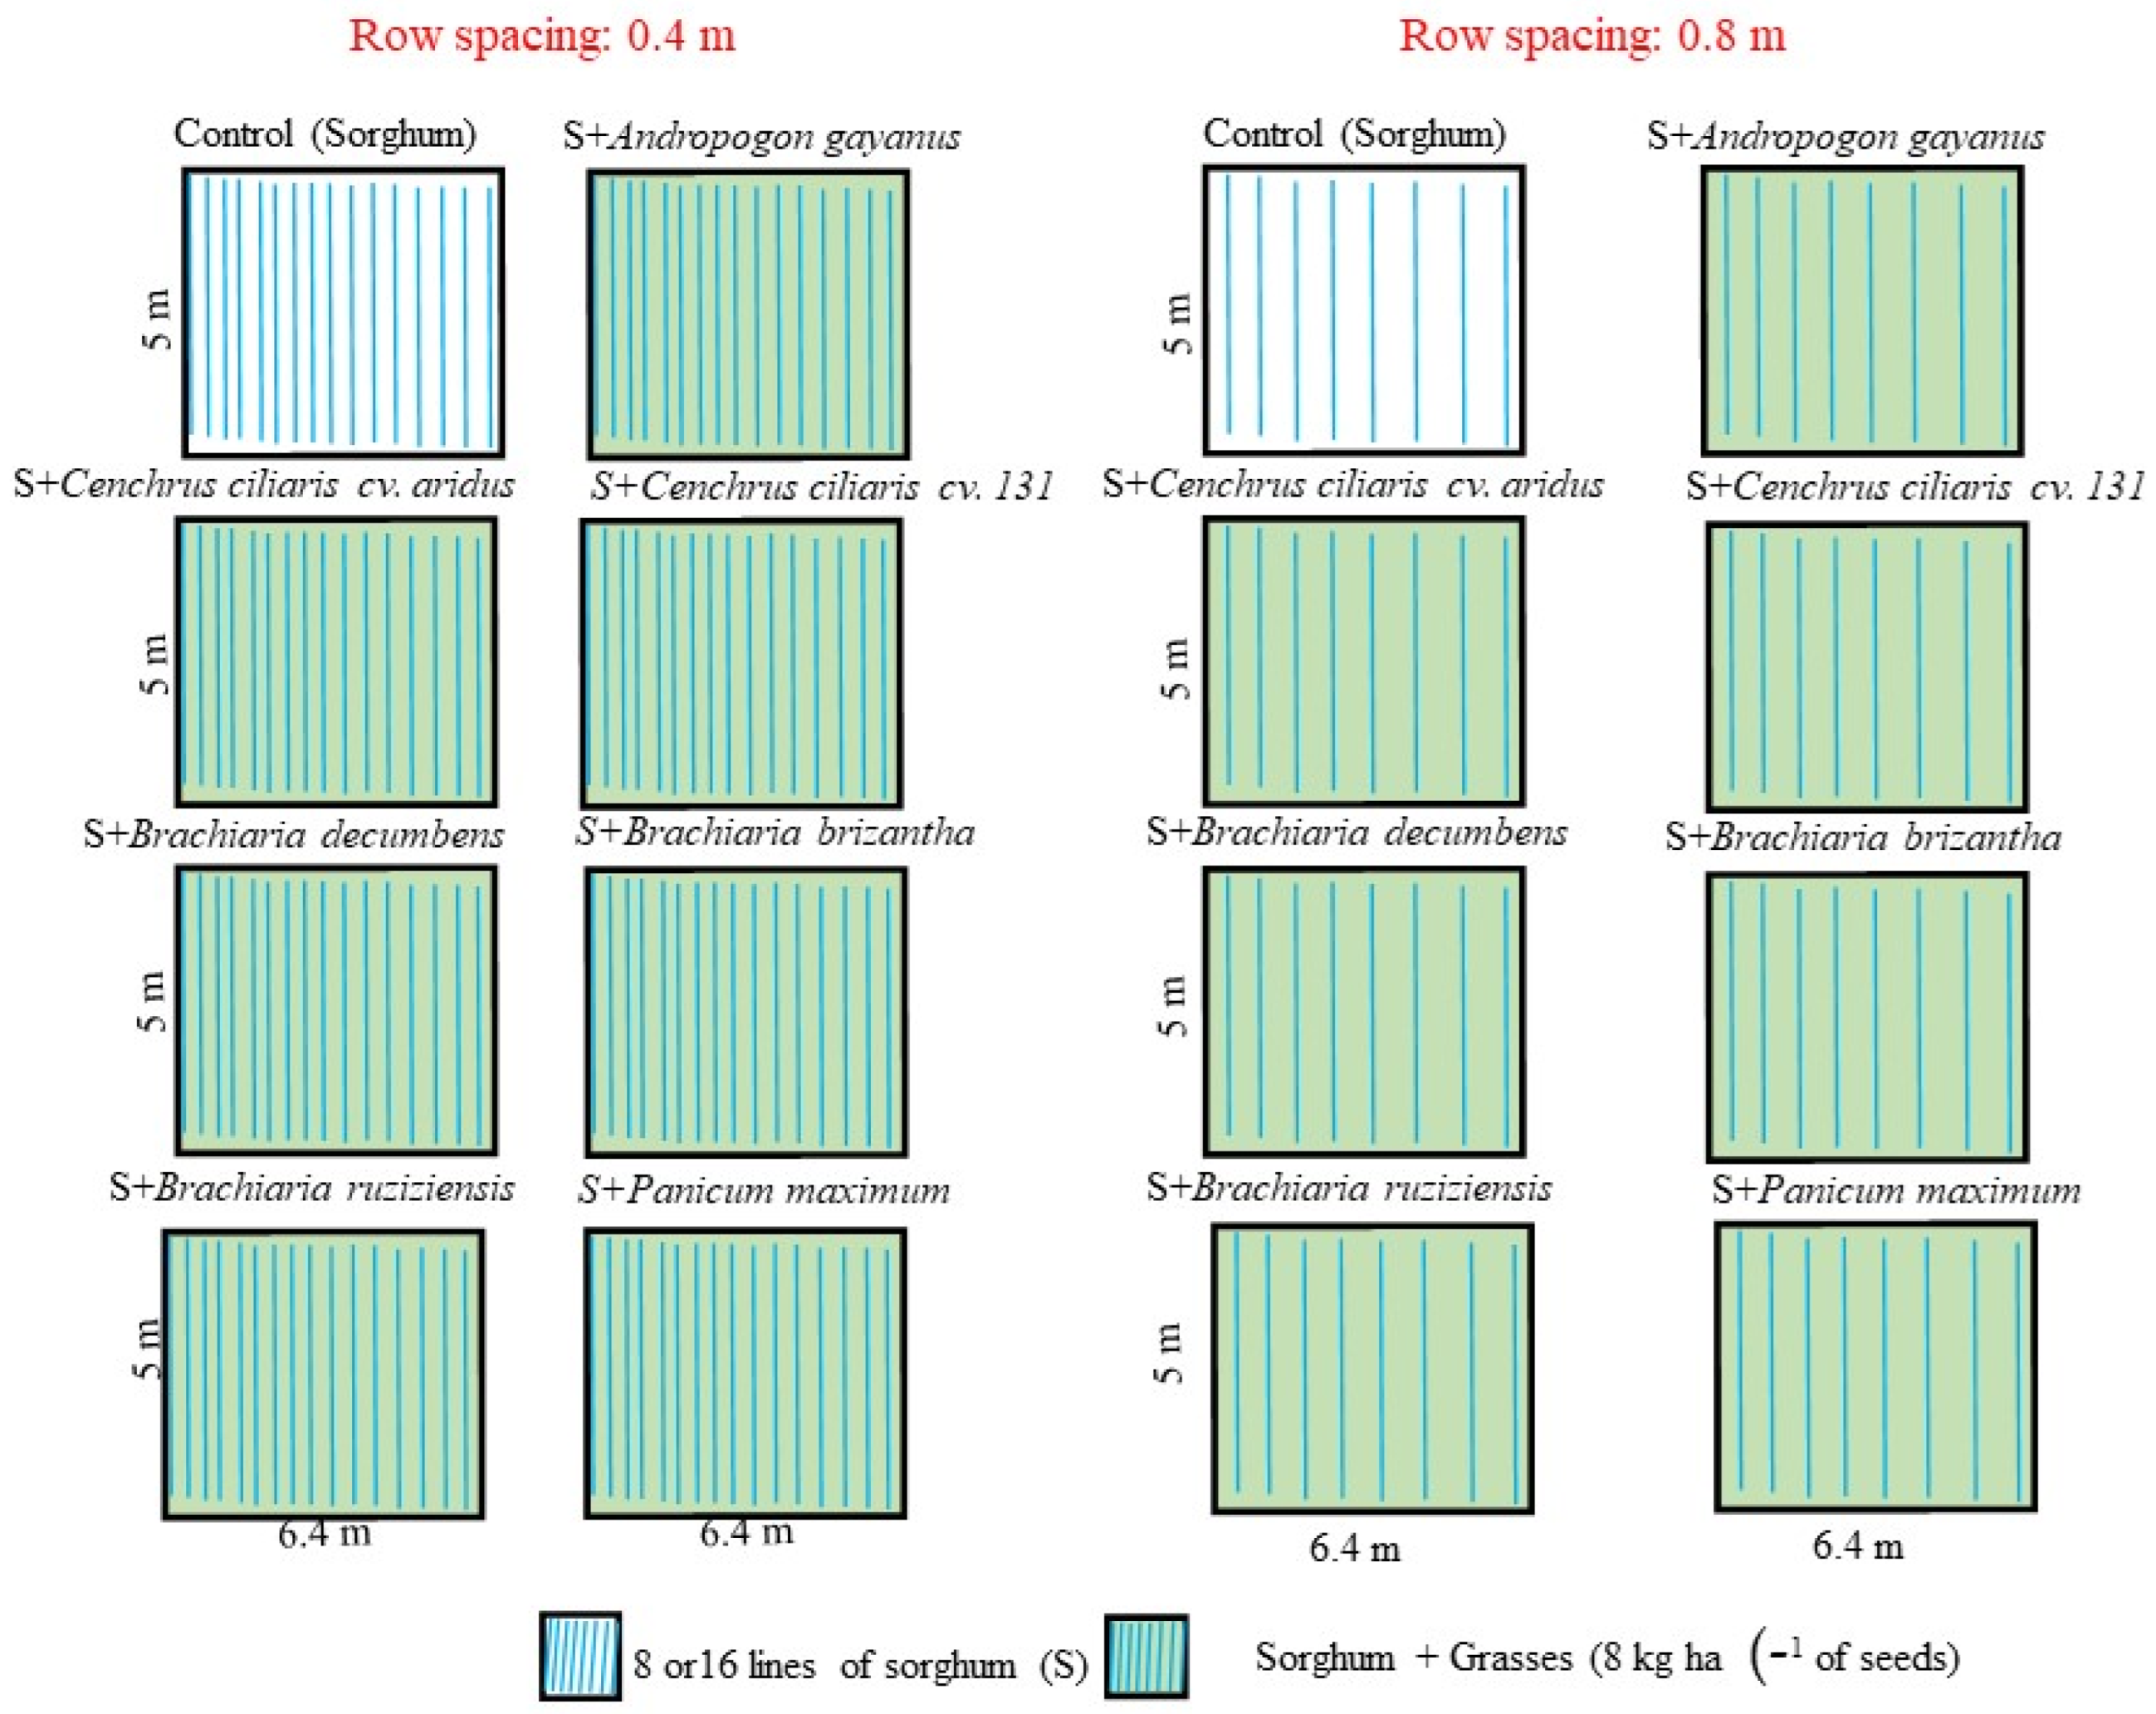
The experimental design was a randomized complete block design (regular), in a 7 × 2 + 1 factorial scheme, corresponding to (i) seven sorghum and grass intercrop combinations (Andropogon gayanus—AG; Cenchrus ciliaris cv. aridus—CCA; Cenchrus ciliaris cv. 131—CC; Brachiaria decumbens—BD; Brachiaria brizantha—BB; Brachiaria ruziziensis—BR; Panicum maximum Jacq—PM), two planting-row spacings (0.4 or 0.8 m), (ii) plus an additional treatment of sorghum without grasses (check-plot), Figure 2.
Experimental units (with four replications) contained either 16 sorghum rows spaced at 0.4 × 0.4 (row spacing of 0.4 m) or eight sorghum rows spaced at 0.8 × 0.8 (row spacing of 0.8 m). In both rows spacing, there were lines 5 m long in the plot. There were 60 experimental units with a total area of 1920 m2 (32 unit−1). The density of plants followed the sorghum recommendation from 140 to 170 thousand plants ha−1 in Brazil (EMBRAPA 2008).
Before planting, the soil was prepared using the conventional system by plowing, disking, harrowing, and furrowing to incorporate 400 kg ha−1 reactive phosphate (Gafsa; 28% de P2O5 total). Grasses were mechanically sown in-furrow (5 cm deep), with 400 points of cultural value per hectare, representing a rate of 8 kg ha−1 of seeds planted in the interrow of sorghum. Seeds were sown with an application of 200 kg ha−1 of formulation 04-30-10 (N, nitrogen; P, phosphorus; and K, potassium). Sorghum seeds (grain hybrid; DKB599) were sown at a 0.02 m soil depth. Cover fertilization was performed using 60 and 80 kg ha−1 of potassium (K2O; potassium chloride) and nitrogen (N; urea), respectively.
The crop-operation schedule is demonstrated in Figure 1. The production systems were cultivated during the rainy period (during December and February). Weed plants were controlled with the application of post-emergence herbicide (Gezaprim® 500, atrazine, rate of 3 L ha−1) to control the incidence of Beldroega (Portulaca oleracea), Guanxuma (Sida rhombifolia), and Poaia-branca, poaia (Richardia brasiliensis).
After ten days of planting, sorghum plants with more than three leaves were kept in the area. The stands were (manually) thinned to obtain the desired density; sick plants were also removes and plants were close to one another. Pulverization with Decis 25CE (rate: 200 mL ha−1) was manually applied to control Spodoptera frugiperda. Panicles were protected with Kraft paper bags to avoid bird attacks.

2.3. Measurements

In Crop Year 1, the productivity of grains was assessed after mechanized harvesting of two inner-most lines in plots at 90 days after planting (physiological maturity). In Crop Years 1 and 2, the fresh biomass of grasses was collected in each plot and separated to determine the dry matter by drying and weighing (65 °C; 72 h). The sorghum fresh biomass was not measured in the study.
After both crop cycles were completed, soil samples were collected in the 0.0–0.2 m soil layer to determine the porosity (macro and microporosity of soil) between the two central rows (undisturbed soil monoliths). The soil was collected in rings of a known volume (41 mm height and 55 mm diameter; Uhland sampler). The soil porosity was determined by the volumetric ring method, according to EMBRAPA (1997). Disturbed soil samples were collected within the two central lines in the soil layer of 0.0–0.2 m to determine the content of phosphorus and potassium using the extraction in Mehlich I (phosphorus) and the extraction in a solution of HCL 0.05 mol L−1 + H2SO4 0.0125 mol L−1 (potassium) according to EMBRAPA [24]. The data were used to calculate the balance of soil nutrients, comparing the initial (before planting) and post-harvest soil values in all treatments.
Disturbed soil samples also were used to determine the organic matter using the colorimetric method [25] with oxidation in the sodium dichromate following the recommendation of EMBRAPA [24]. The carbon (C) content was estimated using the conversion factor 1.72 (derived from 100% organic matter/58% of carbon).

2.4. Data Analysis

The data normality and homogeneity of variance were evaluated using the Shapiro–Wilk test (Sigmaplot Inc., Palo Alto, USA) and the Bartlett test (SPSS Inc., Chicago, IL, USA), respectively, with adequate conditions of data set to analyses. Data were assessed using an analysis of variance (ANOVA), based on the F-test (p ≤ 0.05); when the F test showed significance, the average was compared by the Scott–Knott test (p ≤ 0.05). The interaction between systems of planting and row spacing was tested (i) when the interaction was significant, representing the average of all treatments; (ii) when the interaction was not significant, representing the average of individual factors (systems of planting and row spacing). The correlation of variables was tested using the Pearson correlation (p ≤ 0.05).
The data of sorghum yield, grass dry matter, bulk density, and soil porosity were analyzed using the k-means clustering algorithm in the machine learning method (unsupervised learning). The data were separated into 2 clusters (Clusters 1 and 2) using the Silhouette method, which is based on the comparison of tightness and separation. The distances between the observations and clusters were calculated from the Euclidean distance. The averages of sorghum yield, grass dry matter, carbon, bulk density, and soil porosity within clusters were compared using the Student’s t-test (p ≤ 0.05). Statistical analysis was performed using the programming language in R (version 4.0.0; R Foundation for Statistical Computing, Vienna, Austria); and Python (version 3.8.3; Python Software Foundation, Wilmington, DE, USA), and results were graphed in Sigmaplot (version 11.0; Systat Software, Inc., Palo Alto, Santa Clara, CA, USA).

3. Results

3.1. Productivity of Grains and Dry Matter

In Crop Year 1, sorghum (solo) and intercropping with sorghum + CCA promoted grain yield in a row spacing of 0.4 m with an average of 3.07 and 3.30 Mg ha−1, respectively. In the row spacing of 0.8 m, sorghum + AG and sorghum + BR also presented higher grain yields with respective averages of 3.05 and 3.05 Mg ha−1 (Table 2 and Table 3).
For sorghum in systems with CCA (0.4 m), AG, and BR (0.8 m), the yields obtained were higher than the control, which presents an average of 3.07 (0.4 m) and 2.19 Mg ha−1 (0.8 m). In general, the row spacing of 0.4 m promoted grain yield, considered 5% higher than 0.8 m (Table 2 and Table 3).
In general, the addition of grass intercrop components decreased sorghum grain yield in all systems, except for sorghum + CCA (0.4 row spacing), sorghum + AG (0.8 row spacing), and sorghum + BR (0.8 row spacing), which experienced grain yield increases of 7, 39, and 39%, respectively (Table 2 and Table 3). There was no clear relation between the grain yield and dry matter production of grasses, with a correlation coefficient of −0.19 (p: 0.51; p ≥ 0.05).

3.2. Soil Carbon and Soil Porosity

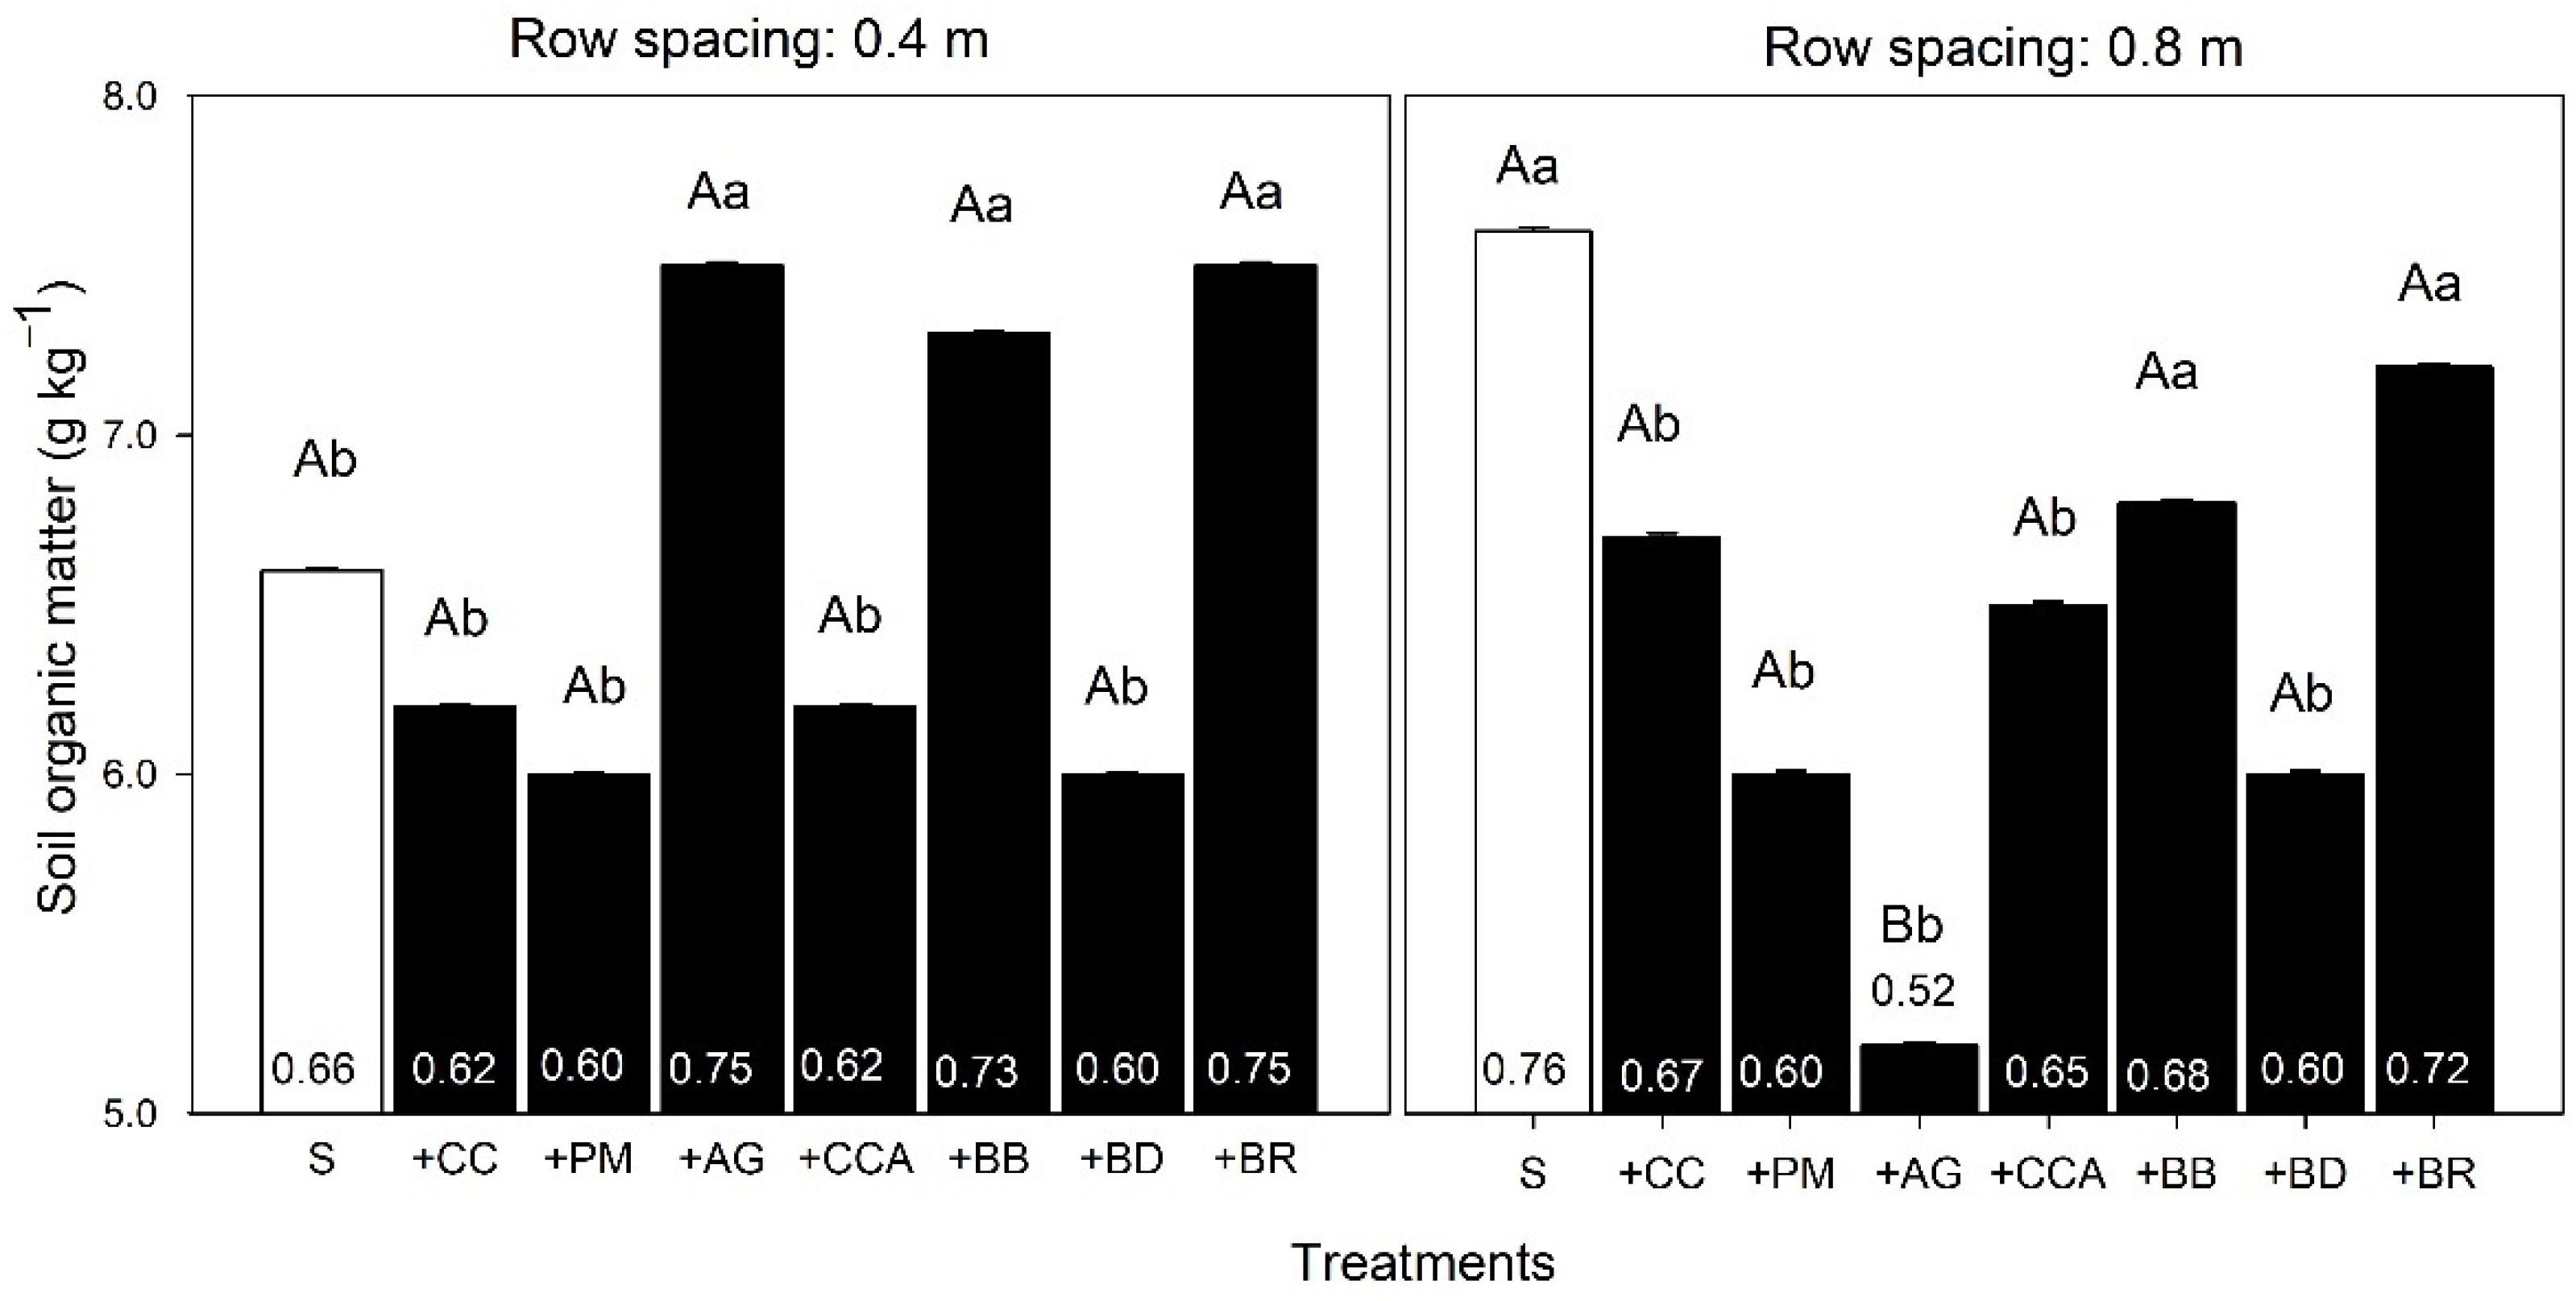
A system of production with sorghum and AG, BB, and BR increased the soil organic matter with an average of 7.5, 7.3, and 7.5 g kg−1, respectively, in row spacings of 0.4 m (Figure 3). When the row spacing was increased, the addition of BB and BR in the production system also promoted soil organic matter with an average of 6.8 and 7.2 g kg−1, respectively. On the other hand, the AG presented the lowest carbon input in soil with a respective average soil organic matter of 5.2 g kg−1 (Figure 3). Interestingly, at 0.8 m, sole sorghum also presented high soil organic matter with an average of 7.6 g kg−1 (Figure 3).
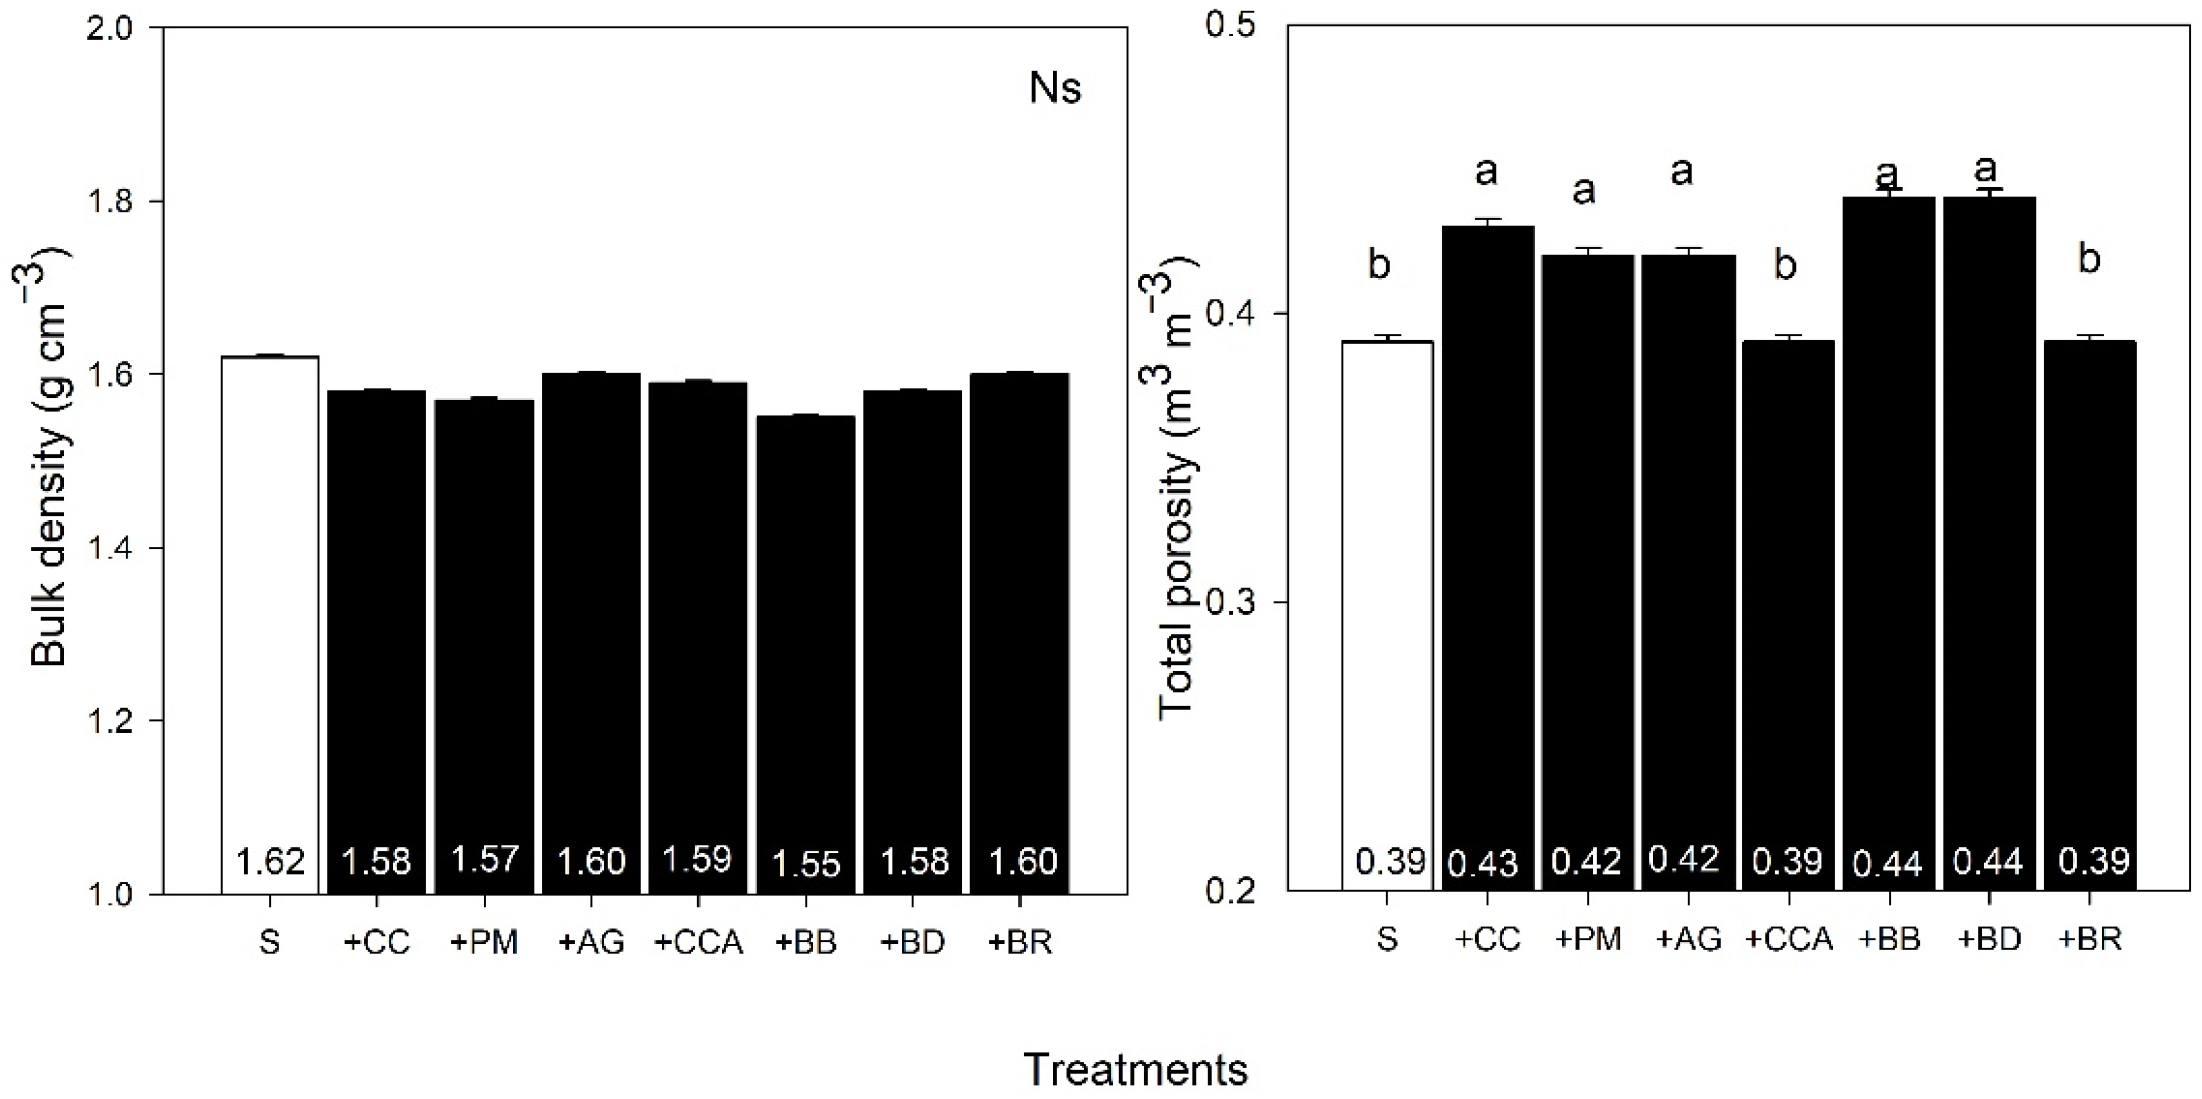
Soil density and total porosity varied from 1.55 to 1.62 g cm−3 and 0.39 to 0.44 m3 m−3. There was no difference in soil density with an average of 1.58 g cm−3, but when comparing total porosity, sole sorghum and the intercropping of sorghum with CCA or BR presented a lower average value of 0.39 m3 m−3 (Figure 4).
Soil macroporosity was higher in sorghum systems with grasses in row spacings of 0.4 m, with an average yield 6% higher than in the row spacing of 0.8 m. The sorghum intercropped with BD and PM presented higher macroporosity averages of 0.16 m3 m−3 in 0.4 m (Table 4). For soil microporosity, sorghum with BB presented a microporosity average of soil 0.36 m3 m−3, representing an increase of 22% compared with the other intercropping grasses in row spacings of 0.4 m. With the increase of row spacing to 0.8 m, there was no difference in microporosity (average of 0.29 m3 m−3), while the lowest macroporosity averages were in sorghum with AG, CCA, BR, and PM (Table 4).

3.3. Cluster Formation

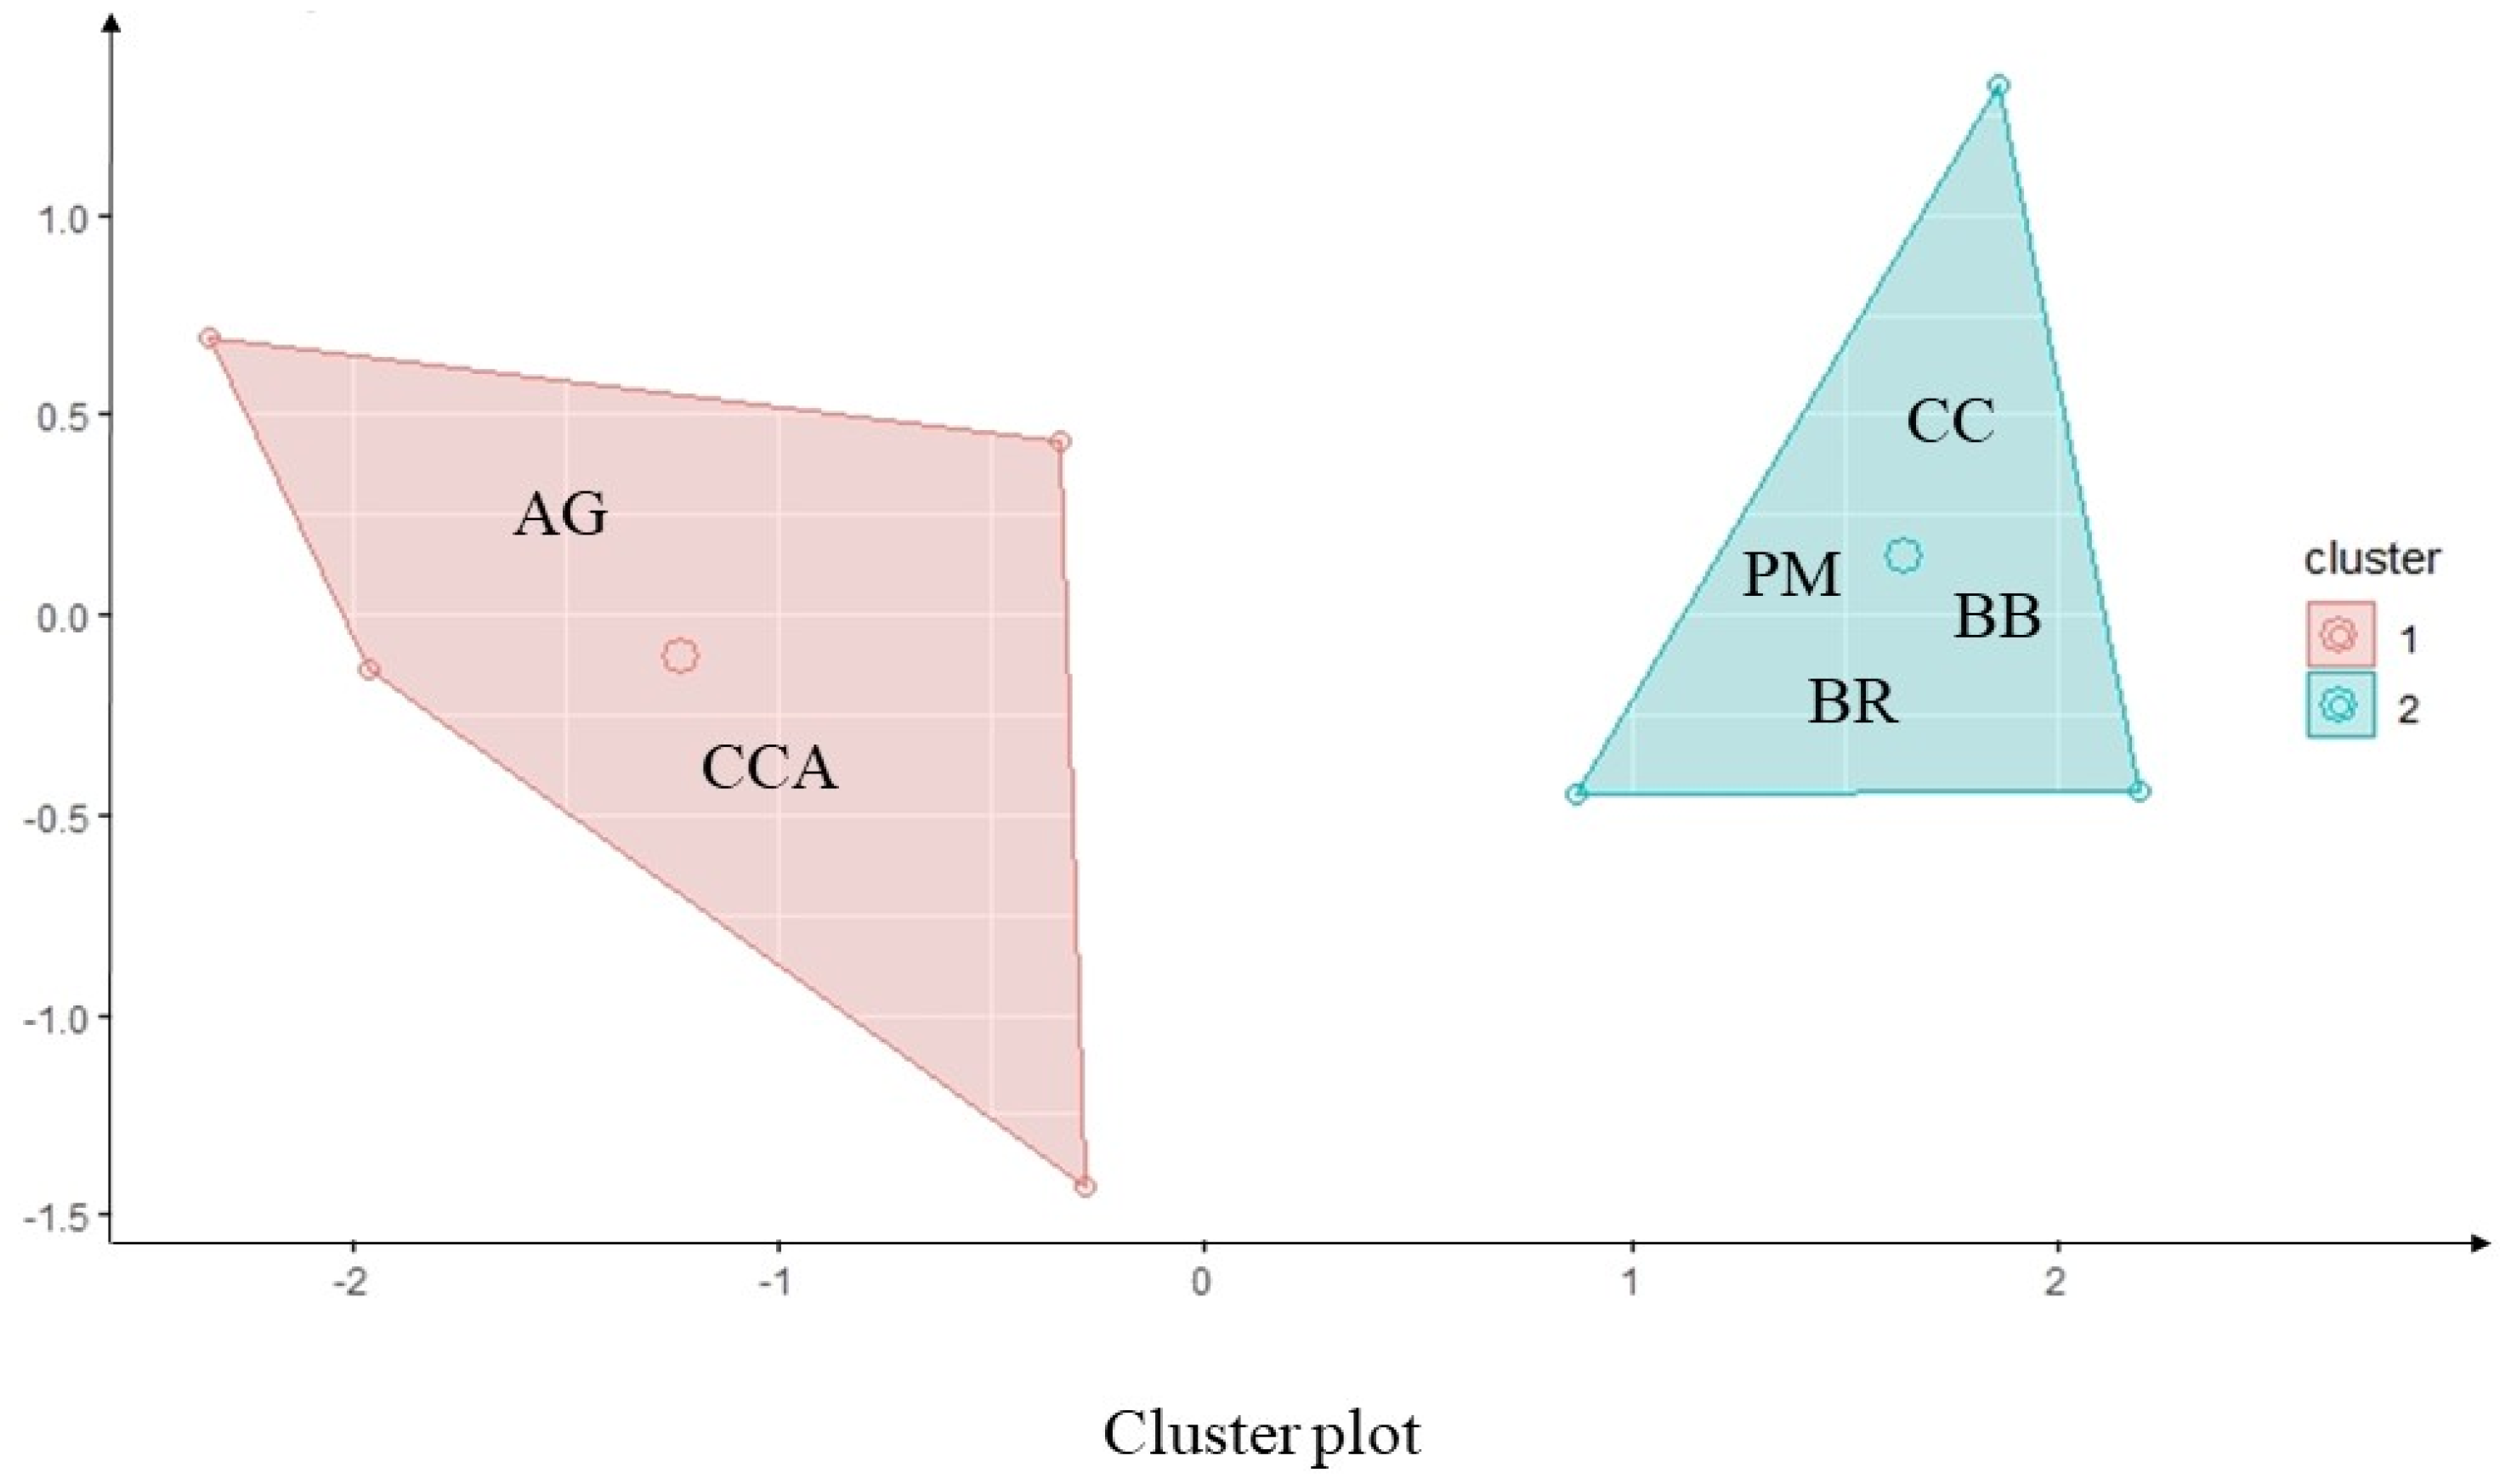
There was a formation of a one-dimensional plane with two clusters accounting for a sum of squares of 81%, with a sum of squares of 1.16 and 2.11, respectively, in Clusters 1 and 2 (Table 4). The high sum of squares indicated a higher variability within Cluster 2, which was true for all sorghum systems with CC, PM, BR, and BB, while systems of sorghum with CCA and AG were associated with Cluster 1 (Figure 5).
With the clustering algorithm, the data were separated into two clusters with distinct differences in yield and grass dry matter, demonstrating that the yield and dry matter production were not associated in the short time. The increase of grain yield was evident in sorghum systems with CCA and AG, with an average yield of 2.07 Mg ha−1. However, if an increase in dry matter production of grasses is desired, sorghum production with CC, PM, BR, and BB can be recommended under the associated management implemented as part of this study. Sorghum intercropped with BD led to poor sorghum grain production and dry matter in the semi-arid region.
The main difference between the clusters was sorghum yield, which was associated with a higher average in Cluster 1, with an average of 2.07 Mg ha−1, considered to be 11% higher than the average in Cluster 2. The dry matter production of grasses associated with Cluster 2 presented an average of 4.32 Mg ha−1, considered to be 65% higher than Cluster 1 (Table 5). There was no clear difference in bulk density and soil porosity between the Clusters.

4. Discussion

4.1. Productivity of Grains and Dry Matter

Sole sorghum and the intercropping systems of sorghum with grasses presented an average grain yield of 2.0 Mg ha−1, which is considered lower than the Brazilian grain yield in the last harvest season, which was 2.7 Mg ha−1 [26]. Albuquerque et al. [27] studying four sorghum cultivars (SHS 400; 1G220; BRS 310; and 0992045) registered yields varying from 1.7 to 5.1 Mg ha−1 in the Brazilian semi-arid areas with a high dependence on water available when higher water accumulation during the cycle (519 mm) promoted yield. The water demand for sorghum varies from 450 to 550 mm during the yield cycle [28], with greater yields for accumulated precipitations higher than 500 mm [29]. During the study, the accumulated precipitation was lower than 400 mm, with a water deficit during the cycle (Figure 1), which explains the low sorghum yield. Srinivasarao et al. [30] and Datta et al. (2018) also noticed a correlation between the grain yield of sorghum and rainfall in semi-arid regions. The prolonged water deficit periods reduced sorghum yield, nutrient absorption, photosynthetic efficiency, and stomatal closure [31]. In the condition of 20% (or lower) availability of soil water, the sorghum controls transpiration by reducing leaf area through leaf senescence, with an increase in root length. The low water availability also influenced the grass production with a reduction of 80% in dry matter from Crop Year 1 (2.56 Mg ha−1) to Crop Year 2 (0.52 Mg ha−1). Mattos et al. [12], testing the leaf-area of six kinds of grasses (B. decumbens cv. Basilisk, B. brizantha cv. Marandu, B. mutica, B. brizantha, B. humidicola cv. Tupi, and B. dictyoneura) noticed that the leaf area index of grasses was decreased under water deficit, except for B. brizantha. Araujo et al. [32] noticed that the final production of leaves, stems, and root dry matter of the Brachiaria brizantha cv. Maranduwhen was reduced when the water level in the soil reached 25% of moisture, corresponding to the field capacity. In our study, both years presented a water deficit, which was more severe in Year 1 (Figure 1). The Brachiaria sp. presented higher dry matter production in Crop Year 2, which can be explained by the high resistance to the water restrictions. The main adaptation mechanisms of Brachiaria sp. to water stress are its control of osmoregulation and the deepening of the root system [33], which have led to recognition the Brachiaria sp. as grasses resistant to water deficits that perform well under arid conditions [34].
In both crop years, the grass dry matter was higher with the cultivation of PM with an average of 3.9 and 0.8 Mg ha−1 in the first and second crop-years, respectively. In the first crop year, the dry matter of CC (0.4 and 0.8 m) and BR (0.4 m) also presented higher production with a respective average of 5.26 3.51 and 3.98 Mg ha−1. In the second crop year, the BB presented a high dry matter production in both planting densities with an average of 1.05 (0.4 m) and 0.70 Mg ha−1 (0.8 m) (Table 2). In general, the row spacing of 0.4 m promoted grass dry matter, considered to be 35% higher than for 0.8 m spacings. In the first crop year, the dry matter was 80% higher than the second crop year (Table 2).
The factor sorghum plant density, here expressed by the row spacing, also significantly affected the grain production and grass dry matter. The average grain yield numerically decreased from 2.06 to 1.97 Mg ha−1 with a reduction of 5% from the shorter to wider spacing (Table 2). Several studies in the literature have been demonstrated the reduction in sorghum production in the intercropping systems with a variation according to grass species [14,15,16,17,18,19,20,21,22,23,24,25,26,27,28,29,30,31,32,33,34,35]. The competition of light, nutrients, and water between the plants are the main factors responsible for yield reduction [36], causing reductions of 15–97% in the sorghum growth and yield under different climatic conditions [37]. We expected that the increase in row spacing would decrease the negative effect of competition between sorghum and grasses. However, the free-spacing promoted the incidence of weed plants such as Portulaca oleracea, Sida rhombifolia, and Richardia brasiliensis, which explain the reduction of 5% in grain yield from the shorter to wider spacing. The absence of grain reduction in the intercropping with AG and BR is explained by rapid ground cover, which avoided weed predominance [38]. It explains the challenge to maintain high yields in intercropping sorghum systems, especially in arid and semi-arid regions.
Probably there was high competition for nitrogen and phosphorus in the intercropping system, requiring the application of fertilizer to supply the demand of both plants. Therefore, fertilization is also an important practice to increase sorghum yield, mainly in the intercropping systems [30,31,32,33,34,35,36,37,38,39]. There was an increase of phosphorus in the soil associated with the application of 400 kg ha−1 reactive phosphate and 200 kg ha−1 of formulation 04-30-10 (nitrogen, phosphorus, and potassium). Ramos et al. [39] showed that the phosphorus use efficiency of grasses was high in the oxisol, characterized by the low soil phosphorus available due to the adsorption on the soil surface [40,41]. Additionally, there was an increase of potassium in the soil associated with the application of planting of 200 kg ha−1 of formulation 04-30-10—nitrogen, phosphorus, and potassium—and in the increased rate of 60 kg ha−1 of potassium.
The sorghum grain yield was similar or greater in the low spacing when sorghum was cultivated with CCA. The CCA is characterized by high drought tolerance [42] and presents thin culms with a superior accumulation of carbohydrates [43]. These CCA characteristics might explain the low competition with sorghum and the positive effect on sorghum grain production at 0.8 row spacing. The sole sorghum also presented a higher grain yield in the shorter density. Ferrazza et al. [44] also recommend sorghum planting alone for row spacings lower than 0.8 m. With the increase of row spacing to 0.8 m, the AG and BR presented higher yields than sole sorghum, while other forages presented a reduction of yields. The AG has long been known as a promising cover crop for arid or tropical regions, mostly due to its deep root system exploring a greater soil volume to the uptake of water and mineral nutrients in soil [16]. Our results suggest that the 0.4 m row spacing is recommended for sole sorghum or CCA to be cropped with sorghum, and it is requested to increase this to 0.8 m row spacing with the intercropping of sorghum and AG or BR.

4.2. Carbon and Soil Porosity

The combination of grasses in the systems promoted an input of dry matter varying from 0.76 to 5.26 Mg ha−1. Generally, grass residues have a slower decomposition in the soil than legumes and crucifers [45,46]. Ferraz-Almeida et al. [22] testing the decomposition rate of sugarcane, soybean, corn, and brachiaria residues showed that brachiaria presented a low decomposition rate due to the low contents of nitrogen and high contents of lignin, starch, pectin, hemicellulose, and cellulose (all present high proportion of carbon). Crop residues of sorghum also present a high C:N ratio, directly impacting C stabilization and accumulation [30,31,32,33,34,35,36,37,38,39,40,41,42,43,44,45,46,47]. The high carbon/nitrogen ratio (low N and high C) affects the total soil organic carbon with a higher accumulation of residues on the soil surface reducing mineral N’s availability to the plants [20,21,22]. After accumulating residues in the soil, microorganisms are responsible for decomposition with about 80% of C lost with CO2 emissions, and 20% of C incorporated into the soil. In regions where there is a predominance of high temperatures associated with water inputs, the oxidation of organic matter is faster due to the increment of biological activities (i.e., beta-glucosidase enzymes) [2,3,4,5,6,7,8,9,10,11]. The semi-arid region presents a long dry period during March and November, and a rainy period during December and February; both periods present high temperatures. The production systems were cultivated during the rainy period, presenting climate conditions that promote a high residue accumulation and decomposition in the soil. Morais et al. [48] noticed high carbon assimilation in the water period with about 0.16 Mg C m−2 with a consecutive dry period reduction (0.2 Mg C m−2). The positive effect of grasses in soil C accumulation was earlier reported by [12,13,14,15,16,17,18,19,20,21,22,23,24,25,26,27,28,29,30,31,32,33,34,35,36,37,38,39,40,41,42,43,44,45,46,47,48,49]. Lal and Kimble [50] showed that soils under Brachiaria sp. pasture contained between 23 and 29 Mg ha−1 more soil organic carbon than soils under cultivation observing a soil-use for 11 years. Srinivasarao et al. [30] showed that sorghum sequestrated 0.59 Mg ha−1 yr−1 in the semi-arid tropics of central India, which is similar to the value found in our study. In the semi-arid regions, a minimum C input from 0.96 to 1.1 Mg ha−1 yr−1 is requested to maintain soil organic carbon at the adequate level (with no change). These results highlight that C input increases are needed in such semi-arid regions.
The increase of organic matter was positively correlated with soil porosity (r: 0.44; p < 0.05) and decreased the bulk density (r: −0.74; p < 0.05). Positive effects of C on soil porosity space are well-known in the literature [17,18,19,20,21,22,23,24,25,26,27,28,29,30,31,32,33,34,35,36,37,38,39,40,41,42,43,44,45,46,47,48,49,50,51]. There was no clear difference in bulk density, with an average ranging from 1.55 to 1.62 g cm−3. The total porosity was reduced in systems where sorghum was intercropped with CCA and BR, and in sole sorghum. This can be explained by the higher dry matter accumulation. Generally, the soil physical attributes (bulk density and soil porosity) require a long time to be restored after soil disturbance [17]. Over a period of 30 years, Schlegel et al. [52] noticed an increase in sorghum yield in the no-tillage sorghum-wheat rotation system due to better water-use availability, due to increased soil porosity. In another long-term study, Govindasamy et al. [53] also showed that an increase of total porosity in semi-arid regions can increase sorghum grain and soil-water holding capacity.

5. Conclusions

The addition of grasses in systems decreased the grain yield in all systems, except in the systems using sorghum with CC (Cenchrus ciliaris cv. Aridus; row spacing, 0.4 m), AG (Andropogon gayanus, row spacing 0.8 m), and BR (Brachiaria ruziziensis; row spacing, row spacing 0.8 m). In the 0.4 m row spacing, the sorghum associations with CC, BB (Brachiaria brizantha), or PM (Panicum maximum) are better options to increase the C-sequestration. However, when the row spacing was increased, the sole sorghum was the best option to increase the C-sequestration. In machine learning, sorghum systems with CCA and AG are better alternatives to increase the yields, while sorghum with CC, PM, BR, and BB increase the grass dry matter.

Author Contributions

Conceptualization, C.J.B.A. and R.F.-A.; data curation, R.F.-A.; writing—original draft preparation, R.F.-A., R.C., E.M.L., R.S.d.F. and R.M.Q.L.; writing—review and editing, R.F.-A., R.C. and E.M.L.; visualization, R.F.-A.; supervision, C.J.B.A., R.C. and R.M.Q.L. All authors have read and agreed to the published version of the manuscript.

Funding

This research received no external funding.

Institutional Review Board Statement

Not applicable.

Data Availability Statement

Not applicable.

Acknowledgments

Thanks to the Coordenação de Aperfeiçoamento de Pessoal de Nível Superior (CAPES; grant number 88882.317567/2019-01), and the Empresa Agropecuária de Minas Gerais (EPAMIG) for financial support.

Conflicts of Interest

The authors declare no conflict of interest.

References

  1. Brodt, S.; Six, J.; Feenstra, G.; Ingels, C.; Campbell, D. Sustainable agriculture. Nat. Educ. Knowl. 2011, 3, 1. [Google Scholar]
  2. Wendling, B.; Jucksch, I.; Mendonca, E.S.; Almeida, R.F.; Martins, C.E.; Domingues, L.A.S. Simulation of use and management effects on the soil organic matter pools of the Atlantic Forest biome, Brazil. Biosci. J. 2014, 30, 1278–1290. [Google Scholar]
  3. FAO—Food and Agriculture Organization of the United Nations. The Economics of Conservation Agriculture. Available online: http://wwwfaoorg/3/Y2781E/y2781e03htm (accessed on 24 January 2020).
  4. Alvalá, R.C.S.; Cunha, A.P.M.A.; Brito, S.S.B.; Seluchi, M.E.; Marengo, J.A.; Moraes, O.L.L.; Carvalho, M.A. Drought monitoring in the Brazilian Semiarid region. An. Acad. Bras. Ciênc. 2017, 91. [Google Scholar] [CrossRef] [Green Version]
  5. Fortes, C.; Evaristo, A.B.; Barros, A.; Pimentel, L.D. Agronomic performance of biomass sorghum hybrids at edaphoclimatic conditions of Tocantins state. Rev. Energ. Na Agric. 2018, 33, 27–30. [Google Scholar]
  6. Buso, W.H.D.; Morgado, H.S.; Silva, L.B.; França, A.F.S. Utilização do sorgo forrageiro na alimentação animal. Pubvet 2011, 5, 1145. [Google Scholar] [CrossRef]
  7. Lima, L.R.; Silva, T.G.F.; Pereira, P.C.; Morais, J.E.F.; Assis, M.C.S. Productive-economic benefit of forage cactus-sorghum intercropping systems irrigated with saline water. Rev. Caatinga 2018, 31, 191–201. [Google Scholar] [CrossRef] [Green Version]
  8. Silva, J.M.F.; Dutra, A.S.; Câmara, F.T.; Pinto, A.A.; Silva, F.E. Row spacing, plant density, sowing and harvest times for sweet sorghum. Pesqui. Agropecu. Trop. 2017, 47, 408–415. [Google Scholar] [CrossRef] [Green Version]
  9. Fidelis, R.R.; Gonzaga, L.A.M.; Silva, R.R.; Andrade, C.A.O. Desempenho produtivo e nutricional de sorgo forrageiro consorciado com soja em doses de nitrogênio. Comun. Sci. 2016, 7, 204–208. [Google Scholar] [CrossRef] [Green Version]
  10. Santos, J.M.R.; Silva, M.R.B.; Santos, M.L.S.; Melo, R.F.; Oliveira, A.R. Desenvolvimento e produtividade de sorgo sacarino consorciado com feijão-caupi em barragem subterrânea. In Jornada de Iniciação Científica da Embrapa Semiárido Petrolina Anais Petrolina; Embrapa Semiárido: Petrolina, Brazil, 2016; pp. 173–178. [Google Scholar]
  11. Almeida, R.F.; Mikhael, J.E.R.; Franco, F.O.; Santana, L.M.F.; Wendling, B. Measuring the labile and recalcitrant pools of carbon and nitrogen in forested and agricultural soils: A study under tropical conditions. Forests 2019, 10, 544. [Google Scholar] [CrossRef] [Green Version]
  12. Mattos, J.L.S.; Gomide, J.A.; Martinez, C.A. Effect of water deficit and flooding on the growth of Brachiaria species in the field. Rev. Bras. Zootec. 2005, 34, 755–764. [Google Scholar] [CrossRef] [Green Version]
  13. Oliveira, A.R.F.; Araujo, L.C.; Ludkiewicz, M.G.Z.; Zagato, L.Q.S.D.; Galindo, F.S.; Maruno, T.C. Productivity, composition morphological and chemical the grass marandu intercropped with forage sorghum for renewal of degraded pastures in closed. Rev. Cult. Agron. 2017, 26, 69–81. [Google Scholar]
  14. Albuquerque, C.J.B.; Oliveira, R.M.; Silva, K.M.J.; Alves, D.D.; Alvarenga, R.C.; Borges, G.L.F.N. Intercropping of tropical forage crops with grain sorghum in two localities of Minas Gerais state. Rev. Bras. Milho Sorgo 2013, 12, 1–9. [Google Scholar] [CrossRef]
  15. Ashoori, N.; Abdi, M.; Golzardi, F.; Ajalli, F.; Ilkaee, M.N. Forage potential of sorghum-clover intercropping systems in semi-arid conditions. Bragantia 2021, 80, e1421. [Google Scholar] [CrossRef]
  16. Müller, M.M.L.; Guimarães, M.F.; Desjardins, T.; Mitja, D. The relationship between pasture degradation and soil properties in the Brazilian Amazon: A case study. Agric. Ecosyst. Environ. 2004, 103, 279–288. [Google Scholar] [CrossRef]
  17. Arruda, E.M.; De-Almeida, R.F.; Domingues, L.A.S.; Silva Junior, A.C.; Moraes, E.R.; Barro, L.R.; Sousa, J.L.O.; Lana, R.M.Q. Soil porosity and density in sugarcane cultivation under different tillage systems. Afr. J. Agric. Res. 2016, 11, 2689–2696. [Google Scholar]
  18. Martins, F.P.; Almeida, R.F.; Mikhael, J.E.R.; Queiroz, I.D.S.; Teixeira, W.G.; Borges, E.N. Correlação do COT e porosidade em Latossolo com diferentes usos e manejos na região de Uberaba, MG. Rev. Agrogeoambient. 2014, 7, 81–90. [Google Scholar] [CrossRef] [Green Version]
  19. Almeida, R.F.; Nave, E.R.; Mota, R.P. Soil quality: Enzymatic activity of soil β-glucosidase. Glob. Sci. Res. J. 2015, 3, 146–150. [Google Scholar]
  20. Mikhael, J.E.R.; Almeida, R.F.; Franco, F.O.; Camargo, R.O.; Wendling, B. Recalcitrant carbon and nitrogen in agriculture soils with residue accumulation and fertilization under tropical conditions. Biosci. J. 2019, 35, 732–740. [Google Scholar] [CrossRef] [Green Version]
  21. Almeida, R.F.; Sanches, B.C. Availability of soil organic carbon in the Brazilian Cerrado. Sci. Agrar. Parana. 2014, 13, 259–264. [Google Scholar]
  22. Ferraz-Almeida, R.; da Silva, N.L.; Wendling, B. How does N mineral fertilizer influence the crop residue N credit? Nitrogen 2020, 1, 99–110. [Google Scholar] [CrossRef]
  23. Ferraz-Almeida, R.; Silveira, C.H.; Mota, R.P.; Moitinho, M.; Arruda, E.M.; Mendonça, E.S.; La Scala, N.; Wendling, B. For how long does the quality and quantity of residues in the soil affect the carbon compartments and CO2-C emissions? J. Soils Sediments 2016, 16, 2354–2364. [Google Scholar] [CrossRef] [Green Version]
  24. EMBRAPA—Empresa Brasileira de Pesquisa Agropecuária. Manual de Métodos de Análise de Solo, 2nd ed.; Embrapa—CNPS: Rio de Janeiro, Brazil, 1997. [Google Scholar]
  25. Nelson, D.W.; Sommers, L.E. Total Carbon, Organic Carbon, and Organic Matter. In Methods of Soil Analysis Part 3 Chemical Methods Soil Science of America and American Society of Agronomy; Black, C.A., Ed.; Wiley: Madison, WI, USA, 1996; pp. 961–1010. [Google Scholar]
  26. CONAB—Companhia Nacional de Abastecimento. Sorgo. Available online: https://wwwconabgovbr/info-agro/analises-do-mercado-agropecuario-e-extrativista/analises-do-mercado/historico-mensal-de-sorgo/item/download/24901_d14bbb75a7ea3485fc1180409183ac2b (accessed on 10 January 2019).
  27. Albuquerque, C.J.B.; Von Pinho, R.G.; Rodrigues, J.A.S.; Brant, R.S.; Mendes, M.C. Row spacing and sowing density for grain sorghum in semi-arid. Bragantia 2011, 70, 278–285. [Google Scholar] [CrossRef] [Green Version]
  28. Von Pinho, R.G.V.; Vasconcelos, R.C. Sorghum Planting Lavras; UFLA: Lavras, Brazil, 2002; p. 76. [Google Scholar]
  29. EMBRAPA—Empresa Brasileira de Pesquisa Agropecuária. Sorgo granífero Embrapa—Milho e Sorgo. Sete Lagoas, Brazil, 2008. Available online: https://www.embrapa.br/en/busca-de-solucoes-tecnologicas/-/produto-servico/3547/sorgo-granifero-brs-373 (accessed on 15 October 2022).
  30. Srinivasarao, C.; Deshpande, A.N.; Venkateswarlu, B.; Lal, R.; Singh, A.K.; Kundu, S.; Vittal, K.P.R.; Mishra, P.K.; Prasad, J.V.N.S.; Mandal, U.K.; et al. Grain yield and carbon sequestration potential of post monsoon sorghum cultivation in Vertisols in the semi-arid tropics of central India. Geoderma 2012, 175–176, 90–97. [Google Scholar] [CrossRef]
  31. Júnior, I.D.O.A.; Santos, S.R.D.; Kondo, M.K.; Oliveira, P.M.D.; Júnior, V.R.R. Response of forage sorghum to water availability in a typic quartzipsamment. Rev. Caatinga 2019, 32, 1015–1026. [Google Scholar] [CrossRef]
  32. De Araujo, L.C.; Santos, P.M.; Mendonca, F.C.; Mourão, G. Establishment of Brachiaria brizantha cv. Marandu, under levels of soil water availability in stages of growth of the plants. Rev. Bras. Zootec. 2011, 40, 1405–1411. [Google Scholar] [CrossRef] [Green Version]
  33. Santos, P.M.; da Cruz, P.G.; de Araujo, L.C.; Pezzopane, J.R.M.; do Valle, C.B.; Pezzopane, C.G. Response mechanisms of Brachiaria brizantha cultivars to water deficit stress. Rev. Bras. Zootec. 2013, 42, 767–773. [Google Scholar] [CrossRef] [Green Version]
  34. Philp, J.N.M.; Vance, W.; Bell, R.W.; Chhay, T.; Boyd, D.; Phimphachanhvongsod, V.; Denton, M.D. Forage options to sustainably intensify smallholder farming systems on tropical sandy soils: A review. Agron. Sustain. Dev. 2019, 39, 30. [Google Scholar] [CrossRef]
  35. Baumhardt, R.L.; Howell, T.A. Seeding Practices, Cultivar Maturity, and Irrigation Effects on Simulated Grain Sorghum Yield. Agron. J. 2006, 98, 462–470. [Google Scholar] [CrossRef]
  36. Ghosh, P.K.; Tripathi, A.K.; Bandyopadhyay, K.K.; Manna, M.C. Assessment of nutrient competition and nutrient requirement in soybean/sorghum intercropping system. Eur. J. Agron. 2009, 1, 43–50. [Google Scholar] [CrossRef]
  37. Peerzada, A.M.; Ali, H.H.; Chauhan, B.S. Weed management in sorghum [Sorghum bicolor (L.) Moench] using crop competition: A review. Crop Prot. 2017, 95, 74–80. [Google Scholar] [CrossRef]
  38. Gazola, R.N.; de Melo, L.M.M.; Dinalli, R.P.; Teixeira Filho, M.C.M.; Garcia, C.M.P. Sowing depths of brachiaria in intercropping with corn in no tillage planting. Energ. Na Agric. 2013, 33, 157–166. [Google Scholar] [CrossRef]
  39. Ramos, S.J.; Faquin, V.; Rodrigues, C.R.; Silva, C.A.; Boldrin, P.F. Biomass production and phosphorus use of forage grasses fertilized with two phosphorus sources. Rev. Bras. Ciênc. Solo 2009, 33, 335–343. [Google Scholar] [CrossRef] [Green Version]
  40. Zavaschi, E.; de Abreu Faria, L.; Ferraz-Almeida, R.; do Nascimento, C.A.C.; Pavinato, P.S.; Otto, R.; Vitti, A.C.; Vitti, G.C. Dynamic of P flux in tropical acid soils fertilized with humic acid–complexed phosphate. J. Soil Sci. Plant Nutr. 2020, 1, 1937–1948. [Google Scholar] [CrossRef]
  41. Almeida, R.F.; Queiroz, I.D.S.; Mikhael, J.E.R.; Oliveira, R.C.; Borges, E.N. Enriched animal manure as a source of phosphorus in sustainable agriculture. Int. J. Recycl. Org. Waste Agric. 2019, 8, 203–210. [Google Scholar] [CrossRef] [Green Version]
  42. Giongo, V.; Salviano, A.M.; Dos Santos, B.R.C.; Leal, E.F. Phosphorus fertilization and growth of buffel grass (Cenchrus ciliares L.) cultivars. Rev. Bras. Eng. Agríc. Ambient. 2015, 19, 34–38. [Google Scholar] [CrossRef] [Green Version]
  43. Porto, E.M.V.; Manoel, T.V.C.; David Alves, D.; Lima, M.V.G.; Ferreira da Silva, M. Structural components of variety of grass buffel submitted to nitrogen. Agropecu. Cient. Semiárido 2014, 10, 90. [Google Scholar]
  44. Ferrazza, R.A.; Lopes, M.A.; Albuquerque, C.J.B. Bioeconomic evaluation of a sorghum consortium with different forage species for an integrated crop-livestock system in nova porteirinha, MG. Forragicultura Pastagens 2016, 73, 94–102. [Google Scholar]
  45. Amado, T.J.C.; Bayer, C.; Conceição, P.C.; Spagnollo, E.; Campos, B.H.C.; Veiga, M. Potential of carbon accumulation in no-till soils with intensive use and cover crops in Southern Brazil. J. Environ. Qual. 2006, 35, 1599–1607. [Google Scholar] [CrossRef]
  46. Almeida, R.A.; Haddad Silveira, C.; Mikhael, J.E.R.; Oliveira Franco, F.; Teixeira Ribeiro, B.S.; Mendonça, E.; Wendling, B. CO2 emissions from soil incubated with sugarcane straw and nitrogen fertilizer. Afr. J. Biotechnol. 2014, 13, 3376–3384. [Google Scholar]
  47. Maia, P.R.; Fernandes, A.R.; Melo, V.S.; Santos, E.R.; da Silva, G.B. Nutrient recycling of sorghum straw and soil biological attributes in Eastern Amazon. Ciênc. Agrotecnol. 2012, 36, 518–525. [Google Scholar] [CrossRef]
  48. Morais, Y.C.B.; Araújo Mdo, S.B.; Moura, M.S.B.; Galvíncio, J.D.; Miranda, R.Q. Analysis of carbon sequestration in Caatinga areas of Pernambucano Semiarid. Rev. Bras. Meteorol. 2017, 32, 585–599. [Google Scholar] [CrossRef] [Green Version]
  49. Amézquita, M.C.; Ibrahim, M.; Llanderal, T.; Buurman, P.; Amézquita, E. Carbon Sequestration in Pastures, Silvo-Pastoral Systems and Forests in Four Regions of the Latin American Tropics. J. Sustain. For. 2004, 21, 31–49. [Google Scholar] [CrossRef]
  50. Lal, R.; Kimble, J.M. Conservation tillage for carbon sequestration. Nutr. Cycl. Agroecosyst. 1997, 49, 243–253. [Google Scholar] [CrossRef]
  51. Joris, H.A.W.; Vitti, A.C.; Ferraz-Almeida, R.; Otto, R.; Cantarella, H. Long-term N fertilization reduces uptake of N from fertilizer and increases the uptake of N from soil. Sci. Rep. 2020, 10, 18834. [Google Scholar] [CrossRef] [PubMed]
  52. Schlegel, A.J.; Assefa, Y.; Haag, L.A.; Thompson, C.R.; Stone, L.R. Long-Term tillage on yield and water use of grain sorghum and winter wheat. Agron. J. 2018, 110, 269–280. [Google Scholar] [CrossRef] [Green Version]
  53. Govindasamy, P.; Mowrer, J.; Rajan, N.; Provin, T.; Hons, F.; Bagavathiannan, M. Influence of long-term (36 years) tillage practices on soil physical properties in a grain sorghum experiment in Southeast Texas. Arch. Agron. Soil Sci. 2020, 1, 11. [Google Scholar] [CrossRef]
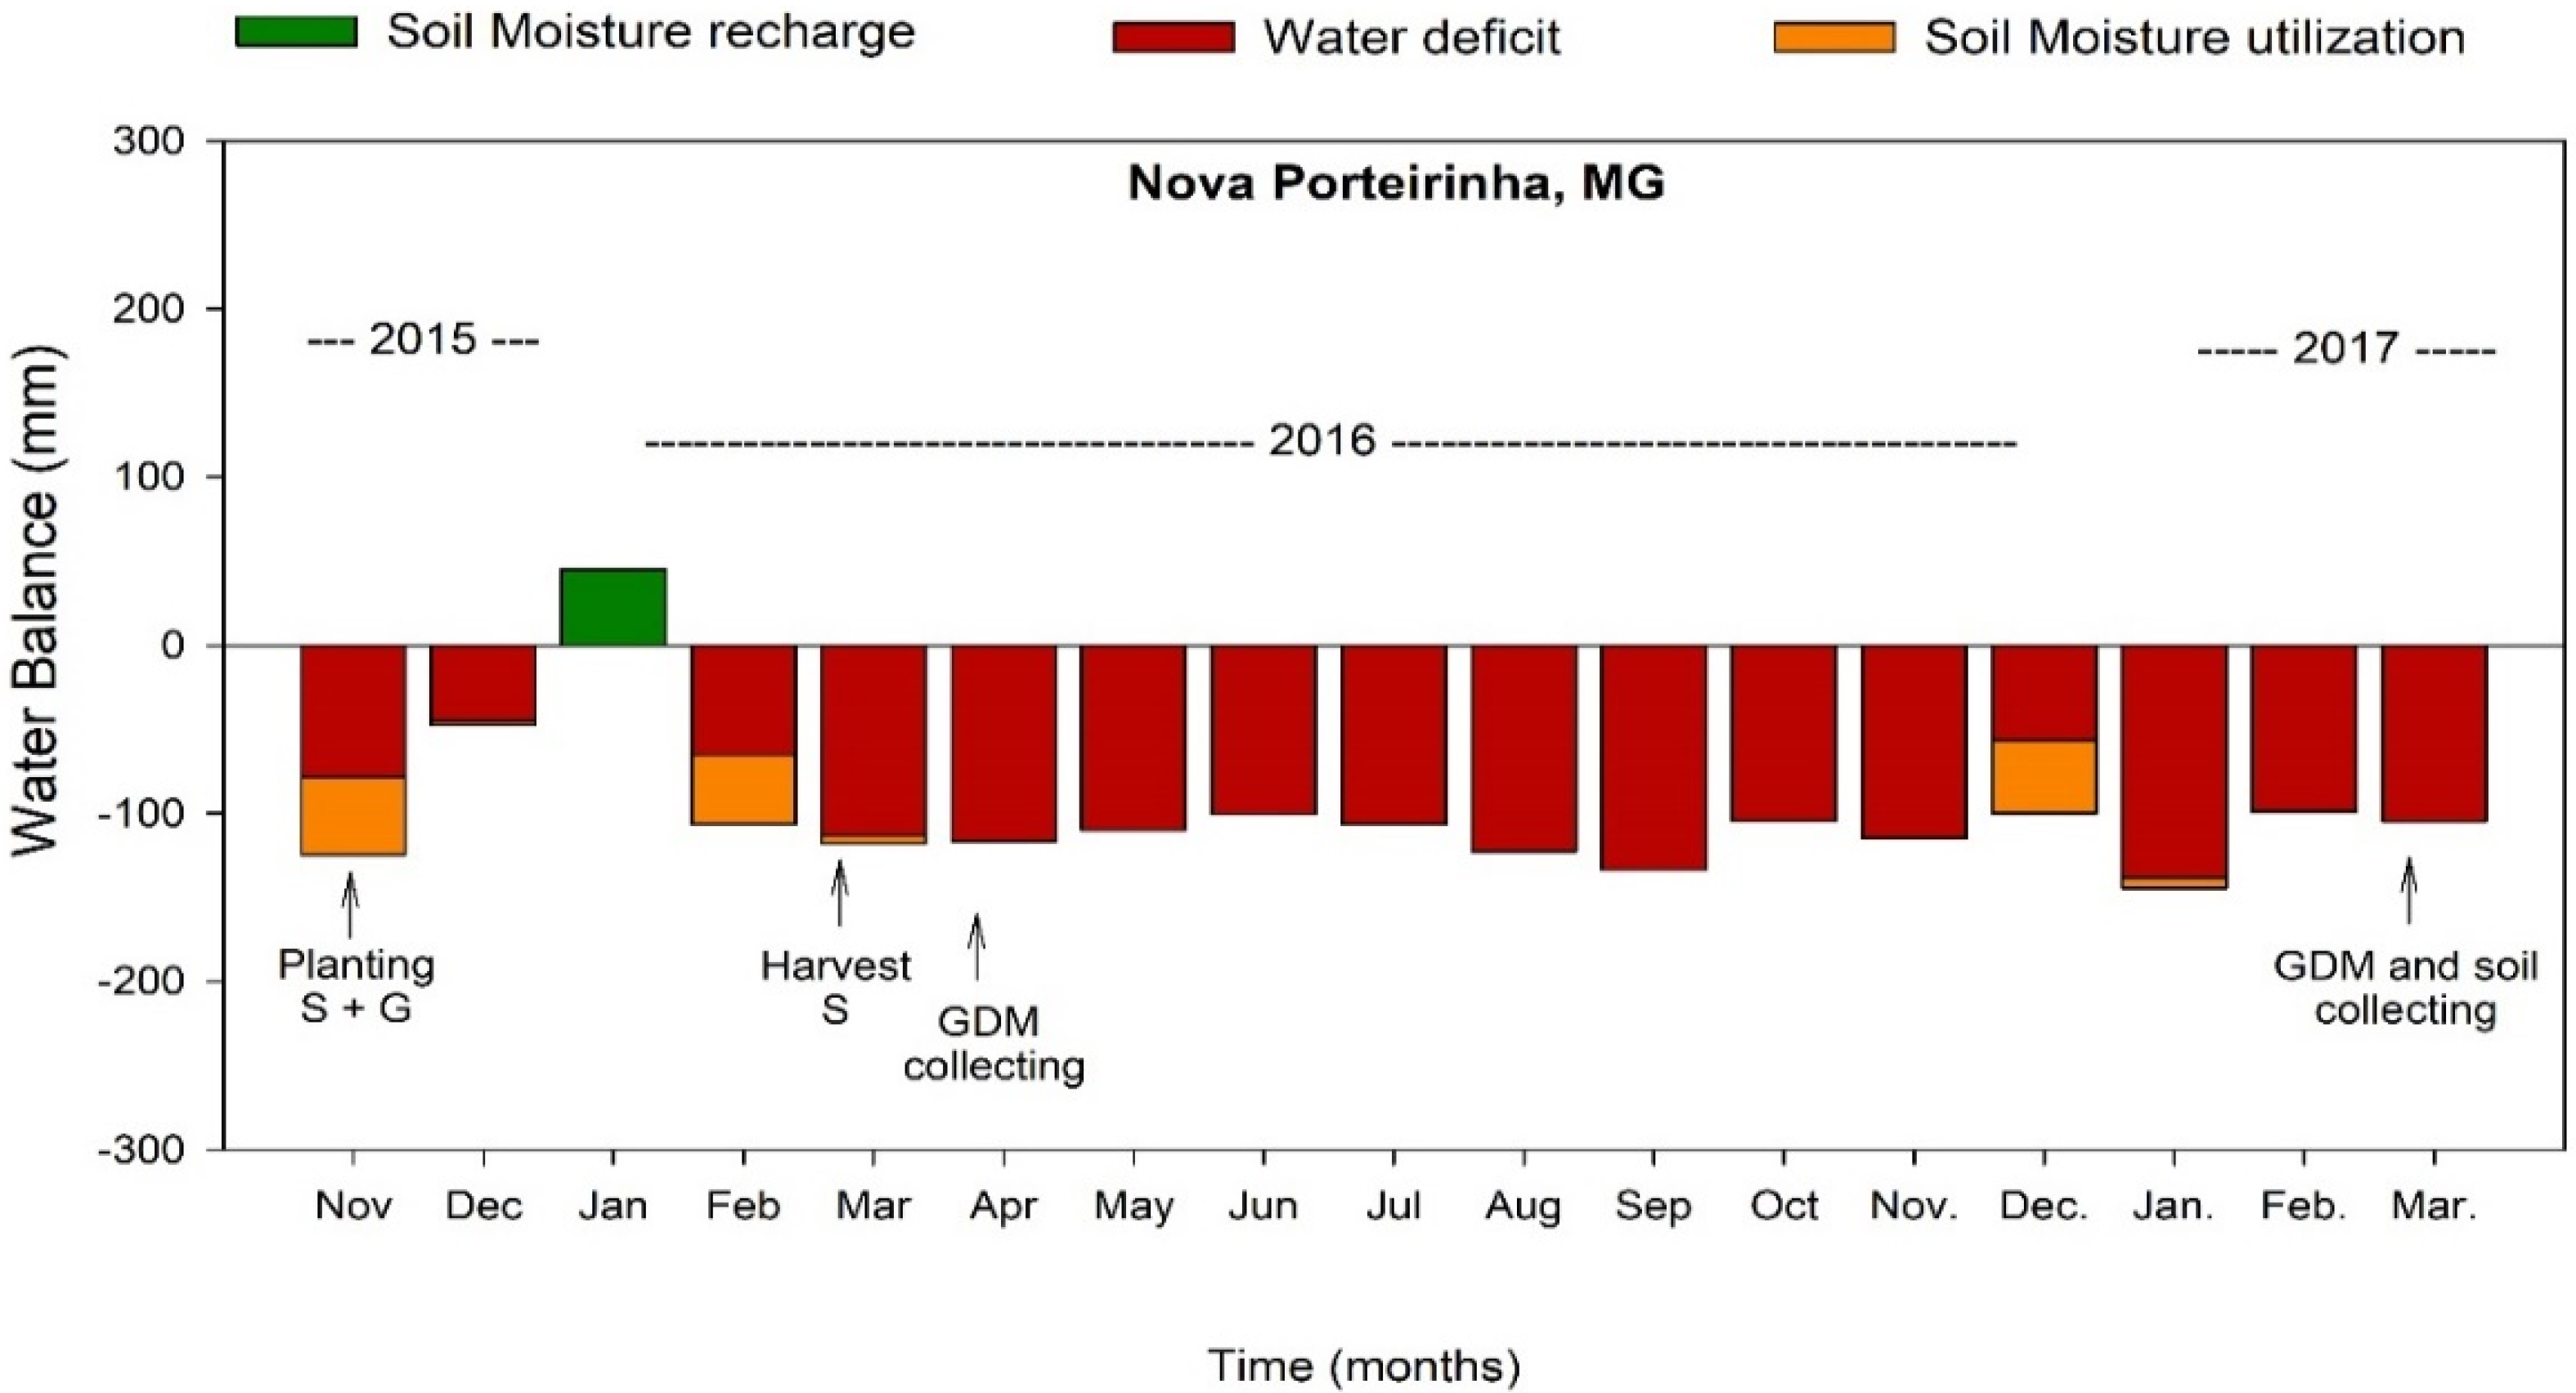
Figure 1. Water balance during the crop-years of 2015/2016 (crop-year 1) and 2016/2017 (crop-year 2) in Nova Porteirinha, MG, Brazil. The bar represents the mean of the month. GDM: grass dry matter; S: sorghum; G: grasses.
Agriculture 12 01762 g001
Figure 2. Experimental design with sorghum and grass intercrop combinations (Andropogon gayanus—AG; Cenchrus ciliaris cv. aridus—CCA; Cenchrus ciliaris cv. 131—CC; Brachiaria decumbens—BD; Brachiaria brizantha—BB; Brachiaria ruziziensis—BR; Panicum maximum Jacq—PM) with two planting-row spacings (0.4 or 0.8 m). Grass was planted in the interrow of sorghum.
Agriculture 12 01762 g002
Figure 3. Soil organic matter (g kg−1) in systems of production with sorghum and grasses (Andropogon gayanus—AG; Cenchrus ciliaris cv. Aridus—CCA; Cenchrus ciliaris cv. 131—CC; Brachiaria decumbens—BD; Brachiaria brizantha—BB; Brachiaria ruziziensis—BR; Panicum maximum—PM) in row spacings of 0.4 and 0.8 m in different soil layers (0.0–0.2 m). The same lowercase (intercropping) and uppercase letters (row spacing) belong to the same grouping, according to the Scott-Knott test (1% probability). Averages are represented with an equivalent standard deviation of the population.
Agriculture 12 01762 g003
Figure 4. Bulk density (g cm−3) and total porosity (m3 m−3) in systems of production with sorghum + grasses (Andropogon gayanus—AG; Cenchrus ciliaris cv. Aridus—CCA; Cenchrus ciliaris cv. 131—CC; Brachiaria decumbens—BD; Brachiaria brizantha—BB; Brachiaria ruziziensis—BR; Panicum maximum—PM) in the soil layer (0.0–0.2 m). Bars with the same lowercase belong to the same groupings, according to the Scott-Knott test (1% probability). Averages are represented with an equivalent standard deviation of the population.
Agriculture 12 01762 g004
Figure 5. Distribution of systems with sorghum + grasses (Andropogon gayanus—AG; Cenchrus ciliaris cv. Aridus—CCA; Cenchrus ciliaris cv. 131—CC; Brachiaria decumbens—BD; Brachiaria brizantha—BB; Brachiaria ruziziensis—BR; Panicum maximum—PM) in the Clusters 1 and 2. The cluster was classified using the data of grain yield, bulk density, and soil porosity. Bulk density and soil porosity were monitored in the soil layer (0.0–0.2 m).
Agriculture 12 01762 g005
Table 1. Soil characterizations (soil chemistry and physics) in the experimental area in different soil layers (0.0–0.1; 0.1–0.2; 0.2–0.3 m).
Soil Layers
Soil Chemical0.0–0.1 m0.1–0.2 m0.2–0.3 m
pH (H2O)6.5 ± 0.046.7 ± 0.046.7 ± 0.04
Organic matter (g kg−1)6.0 ± 1.04.0 ± 0.674.0 ± 0.33
P (mg dm−3)72.7 ± 6.9957.4 ± 5.5240.0 ± 3.85
K (mg dm−3)143 ± 0.83145.0 ± 0.84148 ± 0.85
Ca (cmolc dm−3)1.9 ± 0.061.7 ± 0.051.6 ± 0.05
Mg (cmolc dm−3)0.8 ± 0.000.8 ± 0.000.8 ± 0.00
Al (cmolc dm−3)0.0 ± 0.000.0 ± 0.000.0 ± 0.00
B (mg dm−3)0.2 ± 0.000.2 ± 0.000.2 ± 0.00
Zn (mg dm−3)7.9 ± 0.955.0 ± 0.604.0 ± 0.48
Fe (mg dm−3)55.6 ± 1.1161.5 ± 1.2262.0 ± 1.23
Mn (mg dm−3)24.0 ± 1.2918.8 ± 1.0118.0 ± 0.96
Cu (mg dm−3)1.3 ± 0.061.0 ± 0.041.1 ± 0.05
Soil physical
Total porosity (m3 m−3)0.49 ± 0.010.43 ± 0.010.44 ± 0.01
Macroporosity (m3 m−3)0.23 ± 0.000.22 ± 0.000.24 ± 0.00
Microporosity (m3 m−3)0.25 ± 0.010.21 ± 0.010.19 ± 0.01
Bulk density (kg m−3)1.40 ± 0.011.40 ± 0.011.45 ± 0.01
pH in H2O; organic matter (colorimetric method); contents of phosphorus (P, extraction in Mehlich I); potassium (K, extraction in HCl 0.05 mol L−1 + H2SO4 0.0125 mol L−1); calcium; magnesium; aluminum (Ca, Mg, Al, extraction in KCl 1 mol L−1); boron (B, BaCl2·2H2O 0.0125%; hot water), zinc, iron, manganese and copper (Zn, Fe, Mn, Cu, extraction in DTPA 0.005 mol L−1 + TEA 0.1 mol L−1 + CaCl2 0.01 mol L−1 at pH 7.3). Mean +/− standard deviation (n = 6).
Table 2. Difference (increase/decrease) of grain yield (Mg ha−1) in systems of production with sorghum and grasses (Andropogon gayanus—AG; Cenchrus ciliaris cv. Aridus—CCA; Cenchrus ciliaris cv. 131—CC; Brachiaria decumbens—BD; Brachiaria brizantha—BB; Brachiaria ruziziensis—BR; Panicum maximum—PM) in row spacings of 0.4 and 0.8 m in Crop Year 1.
Systems of ProductionDifference of Grain Yield (Mg ha−1)
0.4 m0.8 m
Sorghum + AG−1.76 (−57%)+0.86 (+39%)
Sorghum + CCA +0.23 (+7%)−0.54 (−24%)
Sorghum + CC−0.95 (−31%)−0.58 (−26%)
Sorghum + BD−1.94 (−63%)−0.23 (−10%)
Sorghum + BB−0.93 (−30%)−0.22 (−10%)
Sorghum + BR−0.89 (−29%)+0.86 (+39%)
Sorghum + PM−1.77 (−57%)−1.85 (−84%)
The difference is represented by the average yield in sole sorghum and sorghum with grasses (average).
Table 3. Production of grains and grass dry matter (Mg ha−1) in the systems of production with sorghum and grasses (Andropogon gayanus—AG; Cenchrus ciliaris cv. Aridus—CCA; Cenchrus ciliaris cv. 131—CC; Brachiaria decumbens—BD; Brachiaria brizantha—BB; Brachiaria ruziziensis—BR; Panicum maximum—PM) in row spacings of 0.4 and 0.8 m in the Crop Years 1 and 2.
Systems of ProductionGrain Yield (Mg ha−1)
0.4 m0.8 m
Crop-year 1
Sorghum3.07 ± 0.12 aA2.19 ± 0.10 bB
Sorghum + AG1.31 ± 0.05 cB3.05 ± 0.14 aA
Sorghum + CCA3.30 ± 0.13 aA1.65 ± 0.08 dB
Sorghum + CC2.12 ± 0.09 bA1.61 ± 0.07 dB
Sorghum + BD1.13 ± 0.05 dB1.96 ± 0.09 cA
Sorghum + BB2.14 ± 0.09 bA1.97 ± 0.09 cB
Sorghum + BR2.18 ± 0.09 bB3.05 ± 0.14 aA
Sorghum + PM1.30 ± 0.05 cA0.34 ± 0.02 eB
Average2.06 ± 0.08 *1.97 ± 0.09 *
Grass Dry Matter, DM (Mg ha−1)
Crop-Year 1Crop-Year 2
0.4 m0.8 m0.4 m0.8 m
Sorghum----
Sorghum + AG2.00 ± 0.13 cA1.34 ± 0.09 cB0.40 ± 0.03 cA0.27 ± 0.02 cA
Sorghum + CCA0.80 ± 0.05 dA0.53 ± 0.04 dB0.16 ± 0.01 dA0.17 ± 0.01 cA
Sorghum + CC5.26 ± 0.35 aA3.51 ± 0.23 aB0.23 ± 0.02 cA0.15 ± 0.01 cA
Sorghum + BD1.14 ± 0.08 dA0.76 ± 0.05 dA0.76 ± 0.05 bA0.50 ± 0.03 bB
Sorghum + BB3.77 ± 0.25 bA2.51 ± 0.17 bB1.05 ± 0.07 aA0.70 ± 0.04 aB
Sorghum + BR3.98 ± 0.26 aA2.65 ± 0.18 bB0.80 ± 0.05 bA0.53 ± 0.03 bB
Sorghum + PM4.69 ± 0.31 aA3.12 ± 0.21 aB0.94 ± 0.06 aA0.63 ± 0.04 aB
Average3.09 ± 0.20 *2.06 ± 0.14 *0.62 ± 0.04 *0.42 ± 0.03 *
ANOVA
Grain yieldDM (year 1)DM (year 2)
psystem≤0.01≤0.01≤0.01
prow spacing≤0.01≤0.01≤0.01
pinteraction≤0.01≤0.01≤0.01
Averages with the same lowercase (intercropping; lines) and uppercase letters (row spacing; columns) belong to the same grouping according to the Scott–Knott test (1% probability). * Significant difference between the average in control and systems of sorghum and grasses. Averages are represented with an equivalent standard deviation of the population.
Table 4. Macroporosity and microporosity (m3 m−3) in production systems with sorghum and grasses (Andropogon gayanus—AG; Cenchrus ciliaris cv. Aridus—CCA; Cenchrus ciliaris cv. 131—CC; Brachiaria decumbens—BD; Brachiaria brizantha—BB; Brachiaria ruziziensis—BR; Panicum maximum—PM) in row spacings of 0.4 and 0.8 m in different soil layers (0.0–0.2 m).
Systems of Production0.4 m0.8 m
Macroporosity (m3 m−3)
Sorghum0.11 ± 0.002 bA0.11 ± 0.002 bA
Sorghum + AG0.12 ± 0.003 bA0.08 ± 0.002 bB
Sorghum + CCA0.11 ± 0.002 bA0.12 ± 0.003 aA
Sorghum + BB0.11 ± 0.002 bA0.14 ± 0.003 aB
Sorghum + CC0.12 ± 0.003 bA0.14 ± 0.003 aA
Sorghum + BD0.16 ± 0.004 aA0.13 ± 0.003 aA
Sorghum + BR0.11 ± 0.002 bA0.11 ± 0.002 bA
Sorghum + PM0.16 ± 0.004 aA0.11 ± 0.002 bB
Microporosity (m3 m−3)
Sorghum0.26 ± 0.004 bA0.29 ± 0.003 aA
Sorghum + AG0.30 ± 0.004 bB0.34 ± 0.004 aA
Sorghum + CCA0.30 ± 0.004 bA0.25 ± 0.003 aA
Sorghum + BB0.36 ± 0.005 aA0.28 ± 0.003 aB
Sorghum + CC0.31 ± 0.005 bA0.29 ± 0.003 aA
Sorghum + BD0.27 ± 0.004 bA0.31 ± 0.003 aA
Sorghum + BR0.27 ± 0.004 bA0.29 ± 0.003 aA
Sorghum + PM0.26 ± 0.004 bB0.31 ± 0.003 aA
ANOVA
MacroporosityMicroporosity
psystem≤0.01≤0.01
prow spacing≤0.01≤0.01
pinteraction≤0.01≤0.01
Averages with the same lowercase (intercropping; lines), and uppercase letters (row spacing; columns) belong to the same grouping, according to the Scott-Knott test (1% probability). Averages are represented with an equivalent standard deviation of the population.
Table 5. Averages of sorghum yield, grass dry matter, bulk density, and soil porosity within clusters (Clusters 1 and 2) in the systems with sorghum and grasses.
VariablesAverage
Cluster 1Cluster 2
Sorghum yield (Mg ha−1)2.33 ± 0.21 A1.84 ± 0.75 B
Dry matter (Mg ha−1)1.42 ± 0.83 B4.32 ± 0.37 A
Bulk density (g cm−3)1.60 ± 0.01 A1.58 ± 0.02 A
Soil porosity (m3 m−3)0.42 ± 0.02 A0.42 ± 0.02 A
Cluster information
Sum of squares1.162.11
Number of members 34
Averages with the same uppercase letters (row spacing; columns) belong to the same grouping, according to the Scott-Knott test (1% probability). Sum of squares within the cluster. The averages of variables within clusters were compared by the t-test (Student; p ≤ 0.05). Bulk density and soil porosity were monitored in the soil layer (0.0–0.2 m).
Publisher’s Note: MDPI stays neutral with regard to jurisdictional claims in published maps and institutional affiliations.