

The U.S. Fresh Fruit and Vegetable Industry: An Overview of Production and Trade

Abstract
1. Introduction
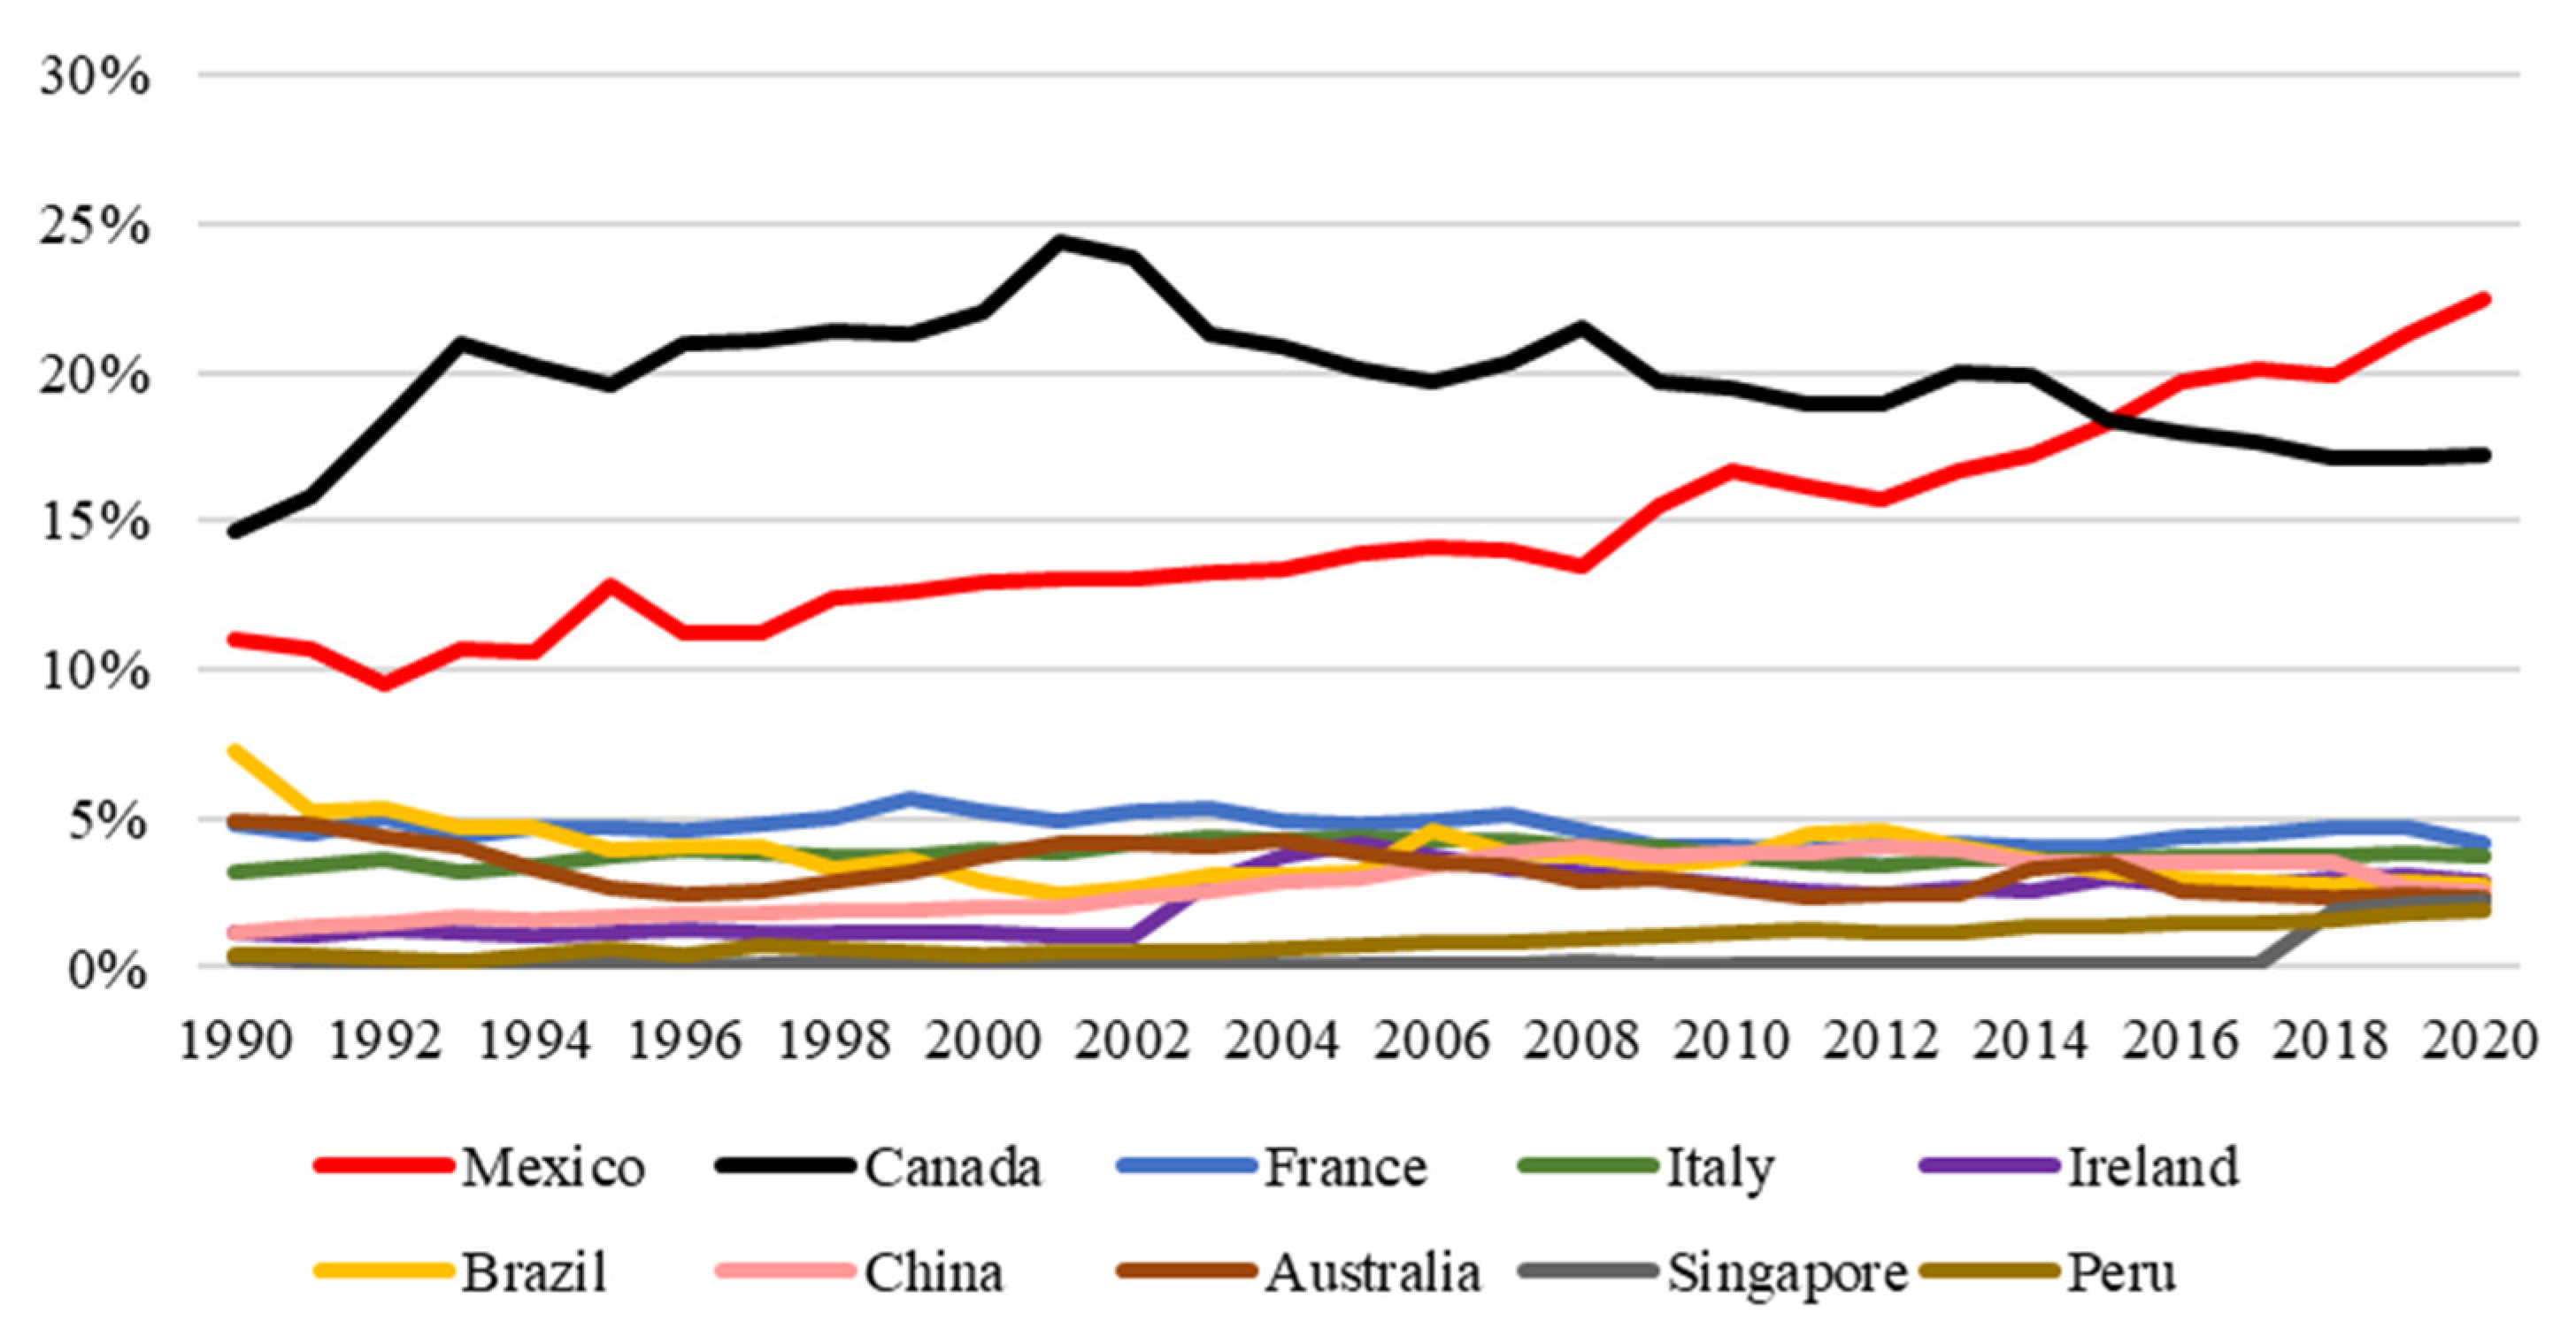
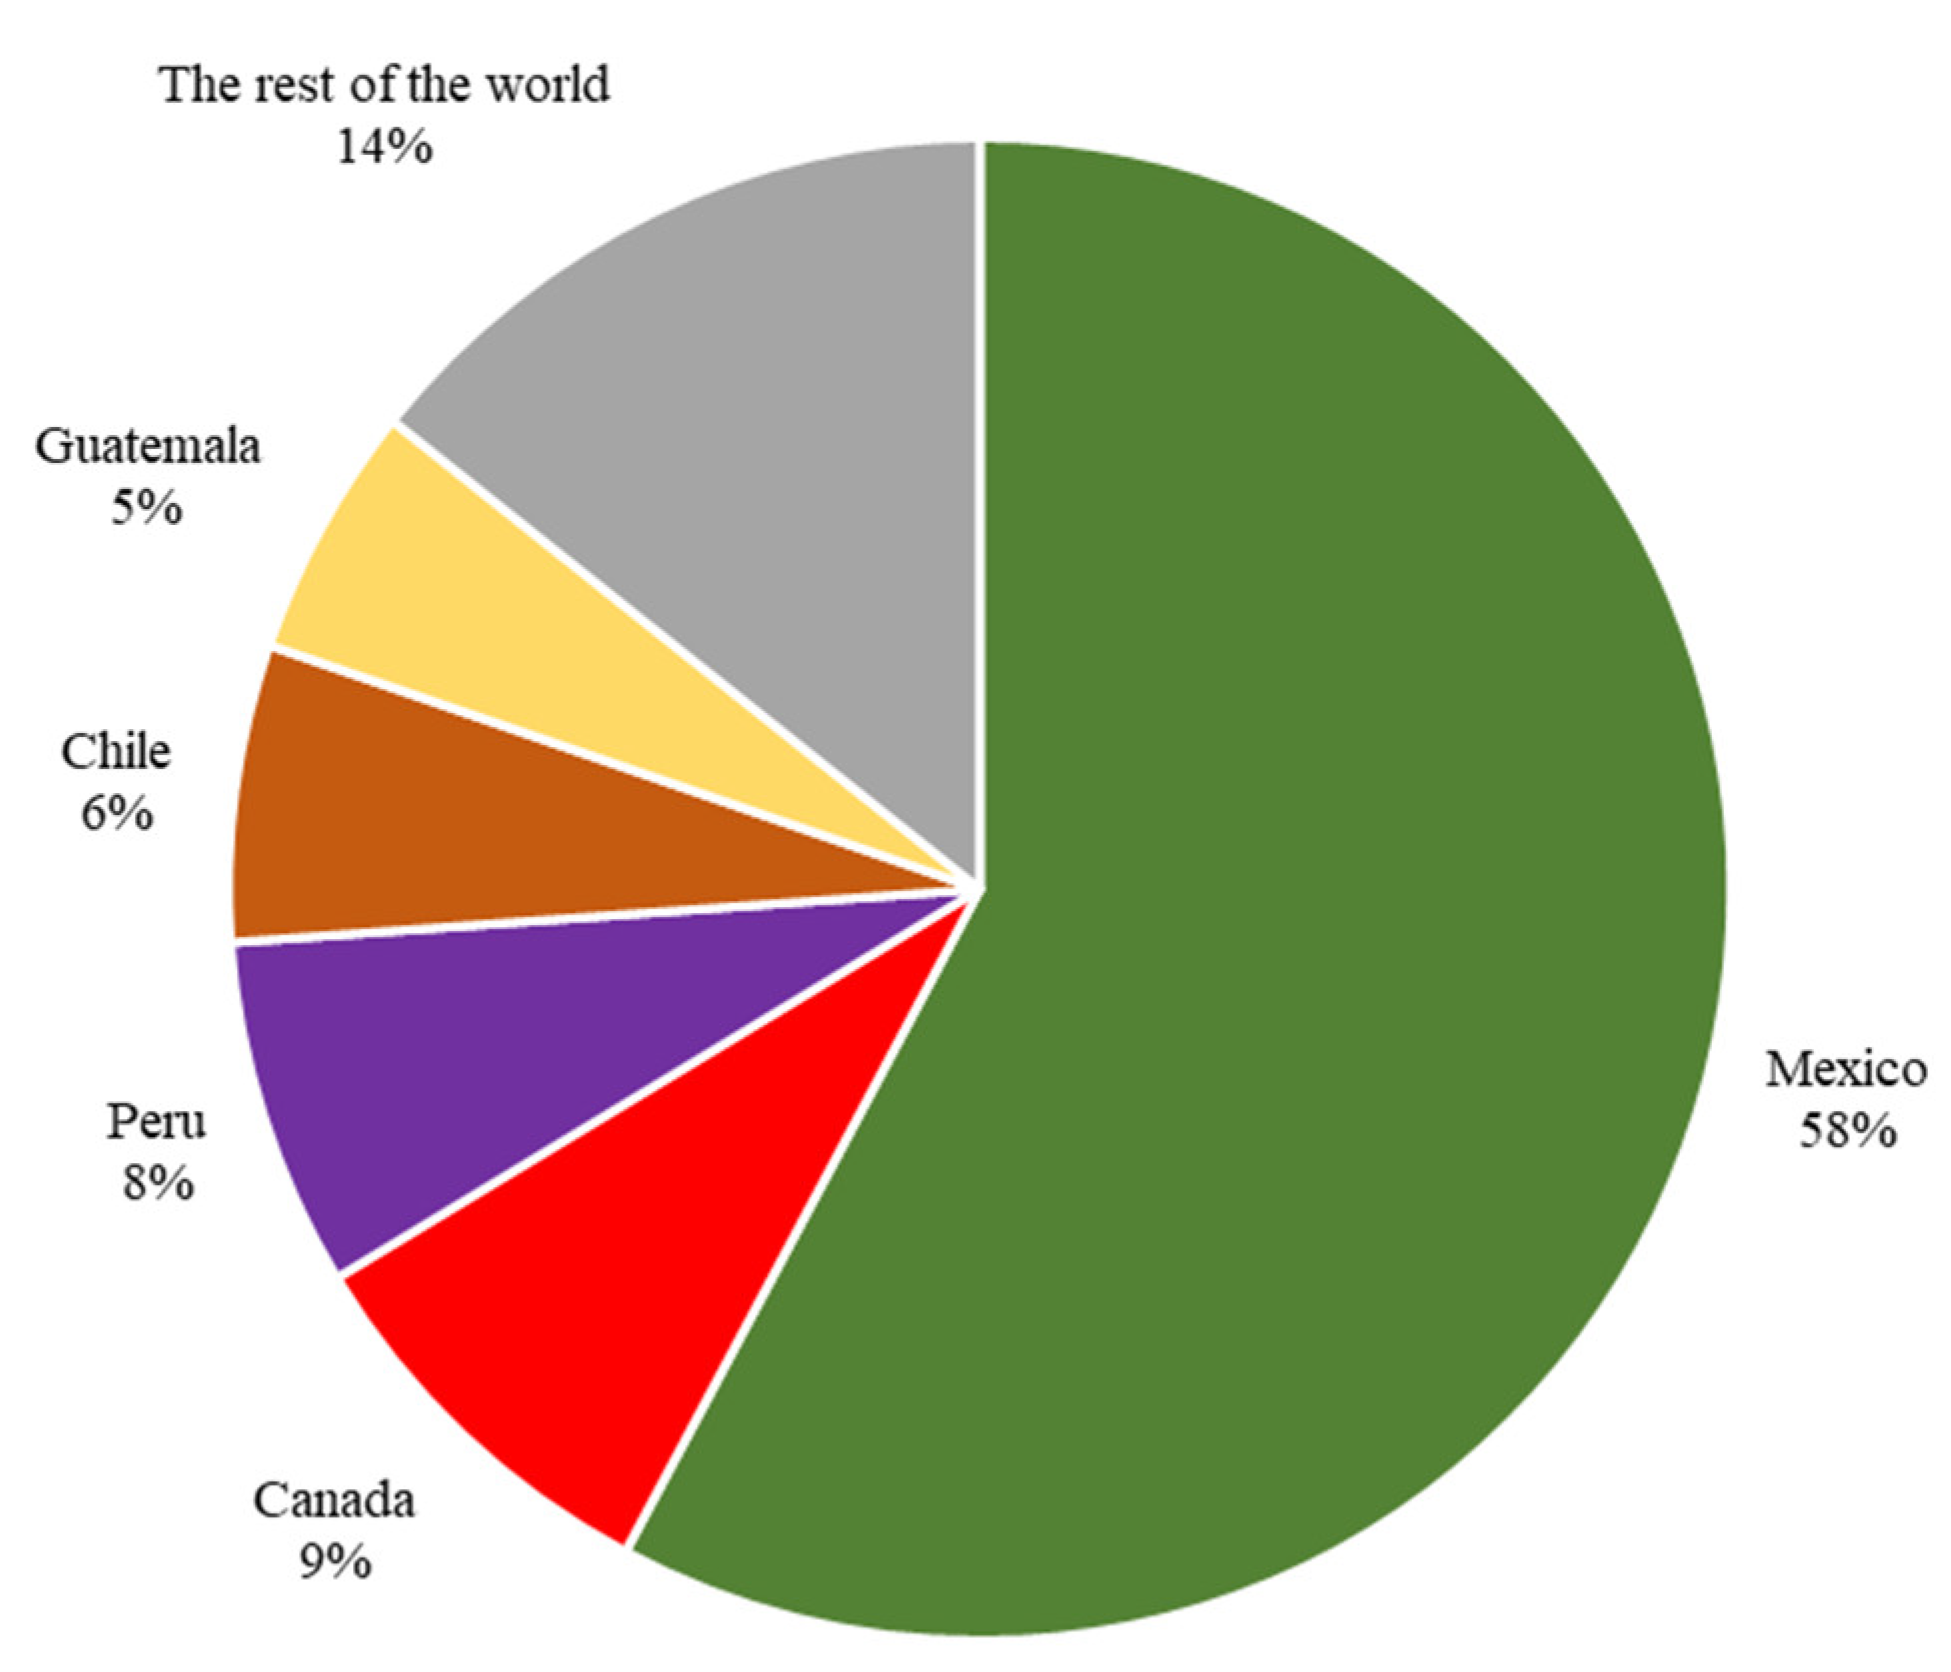
2. Major U.S. Produce Trade Partners
3. U.S. Production and Imports from Mexico
3.1. Growth of Imports from Mexico
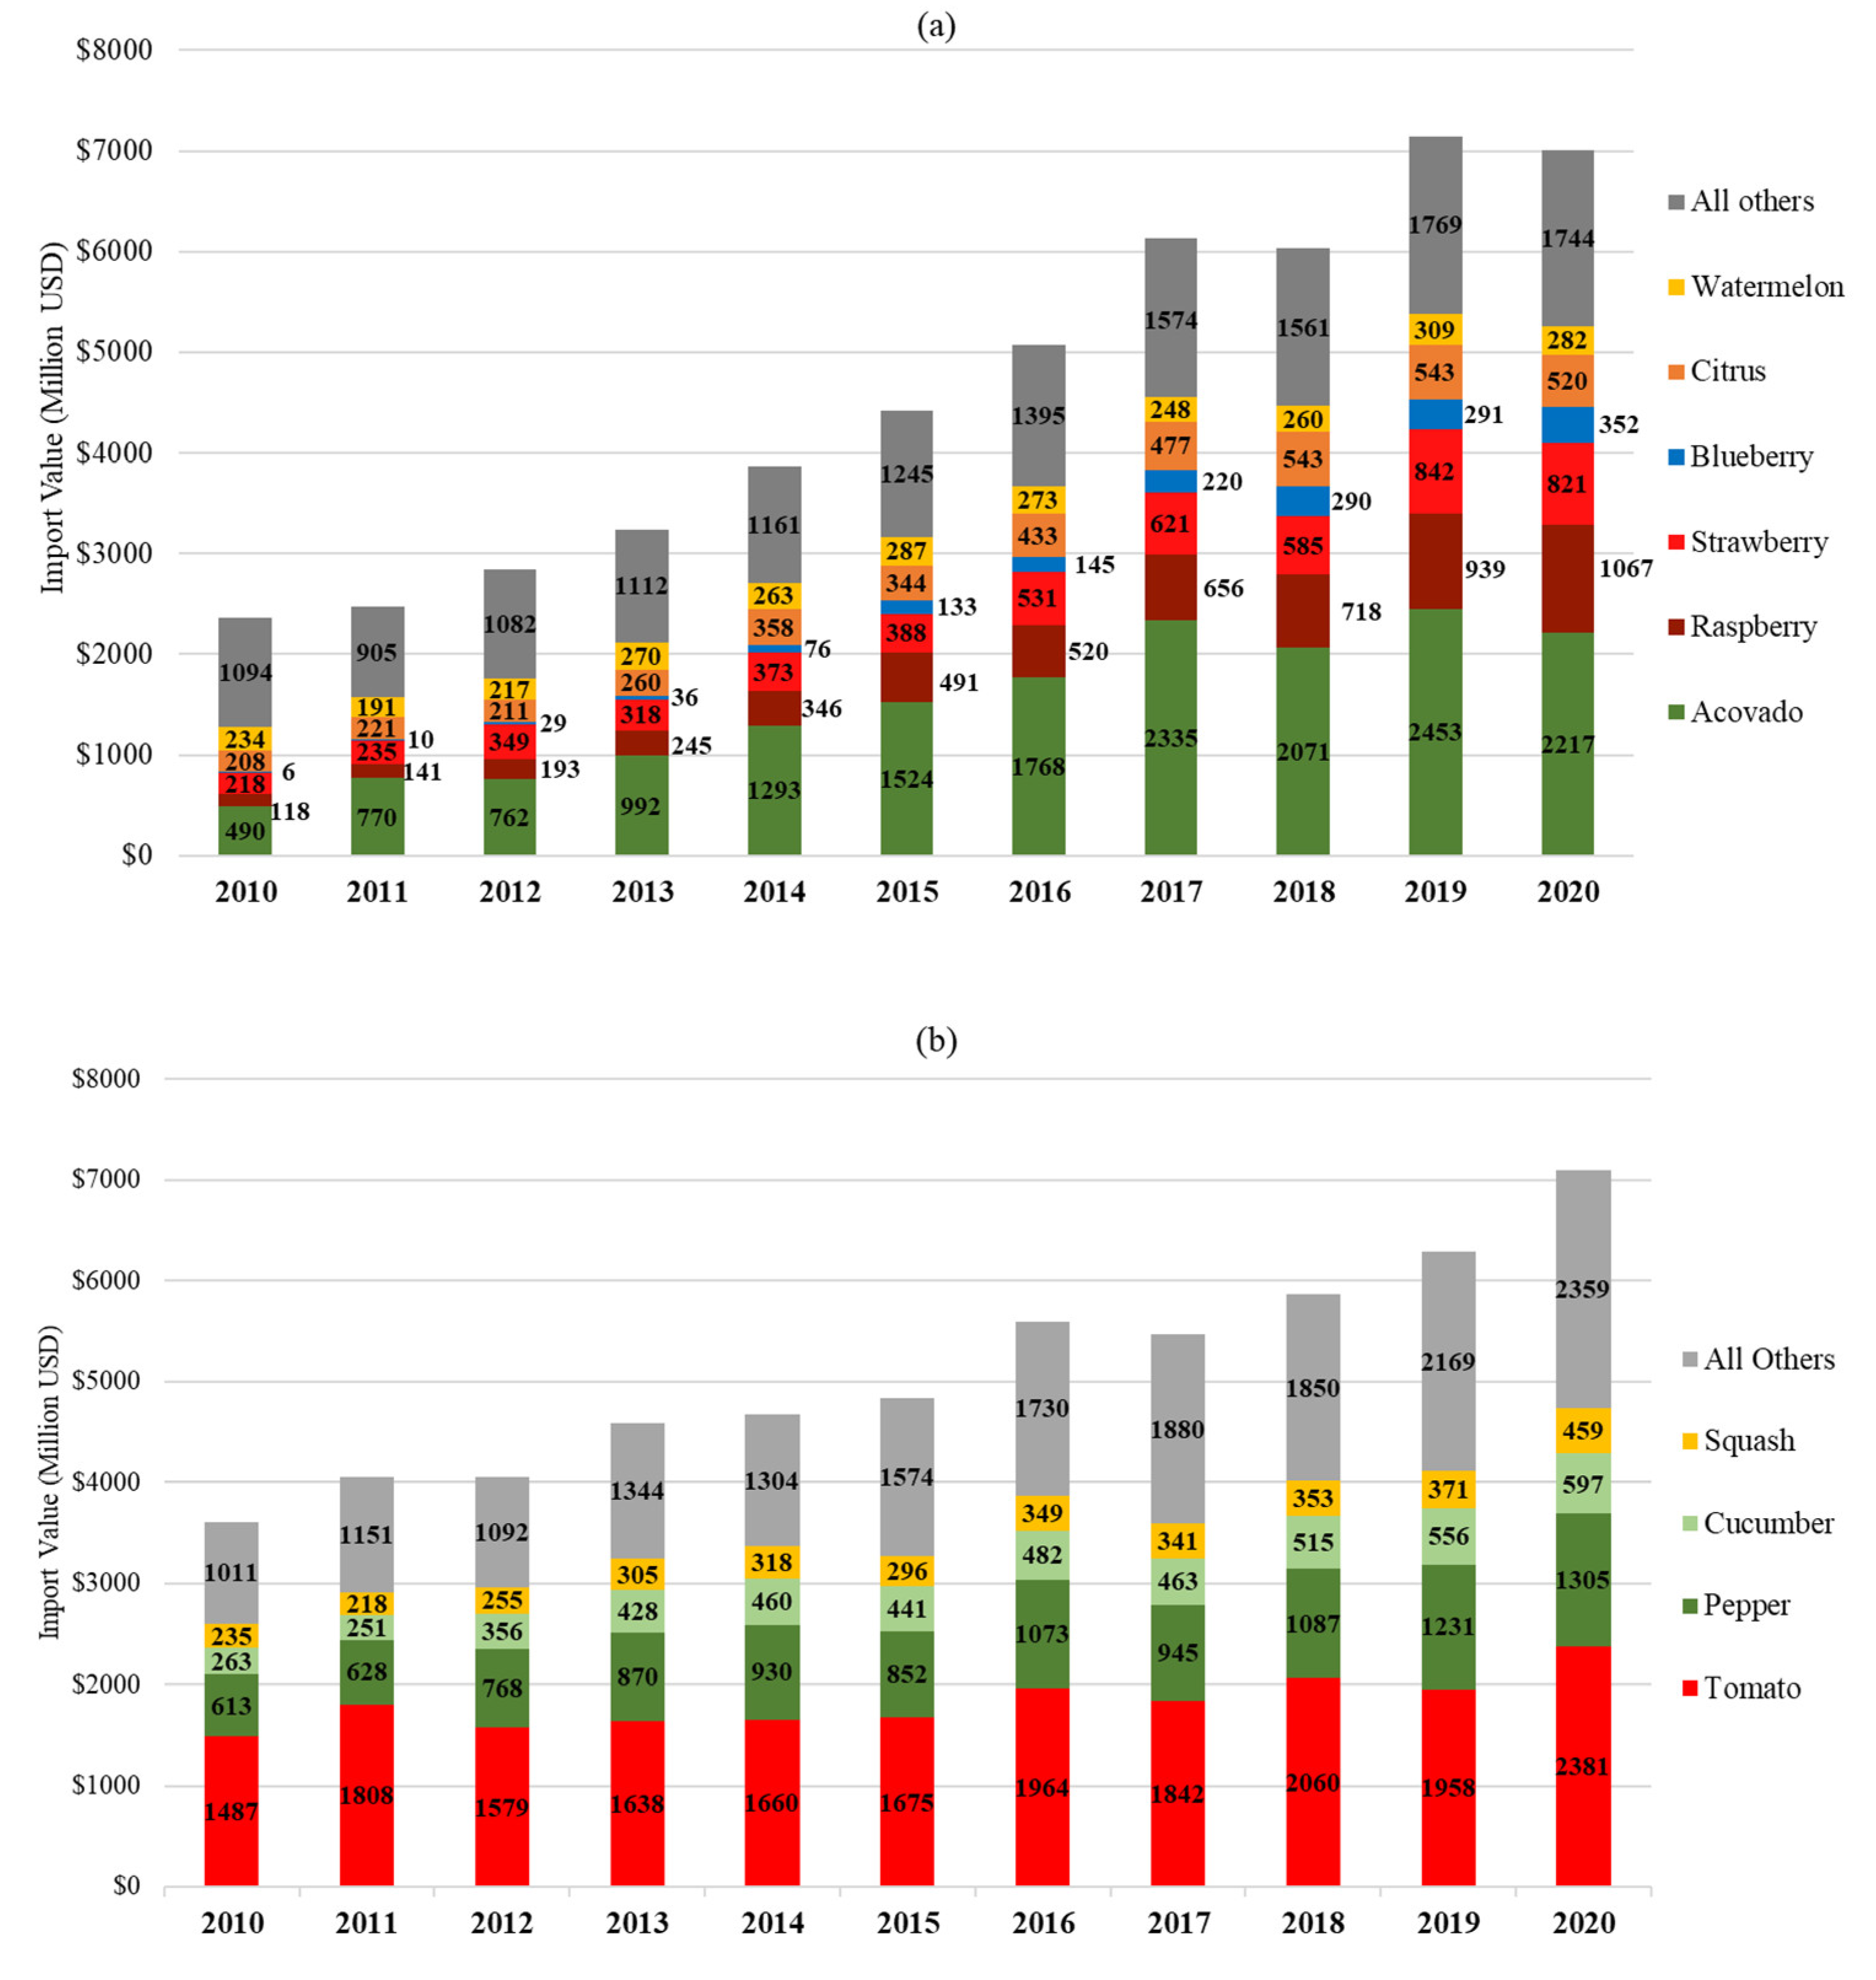
3.2. Fresh Fruit Production and Imports
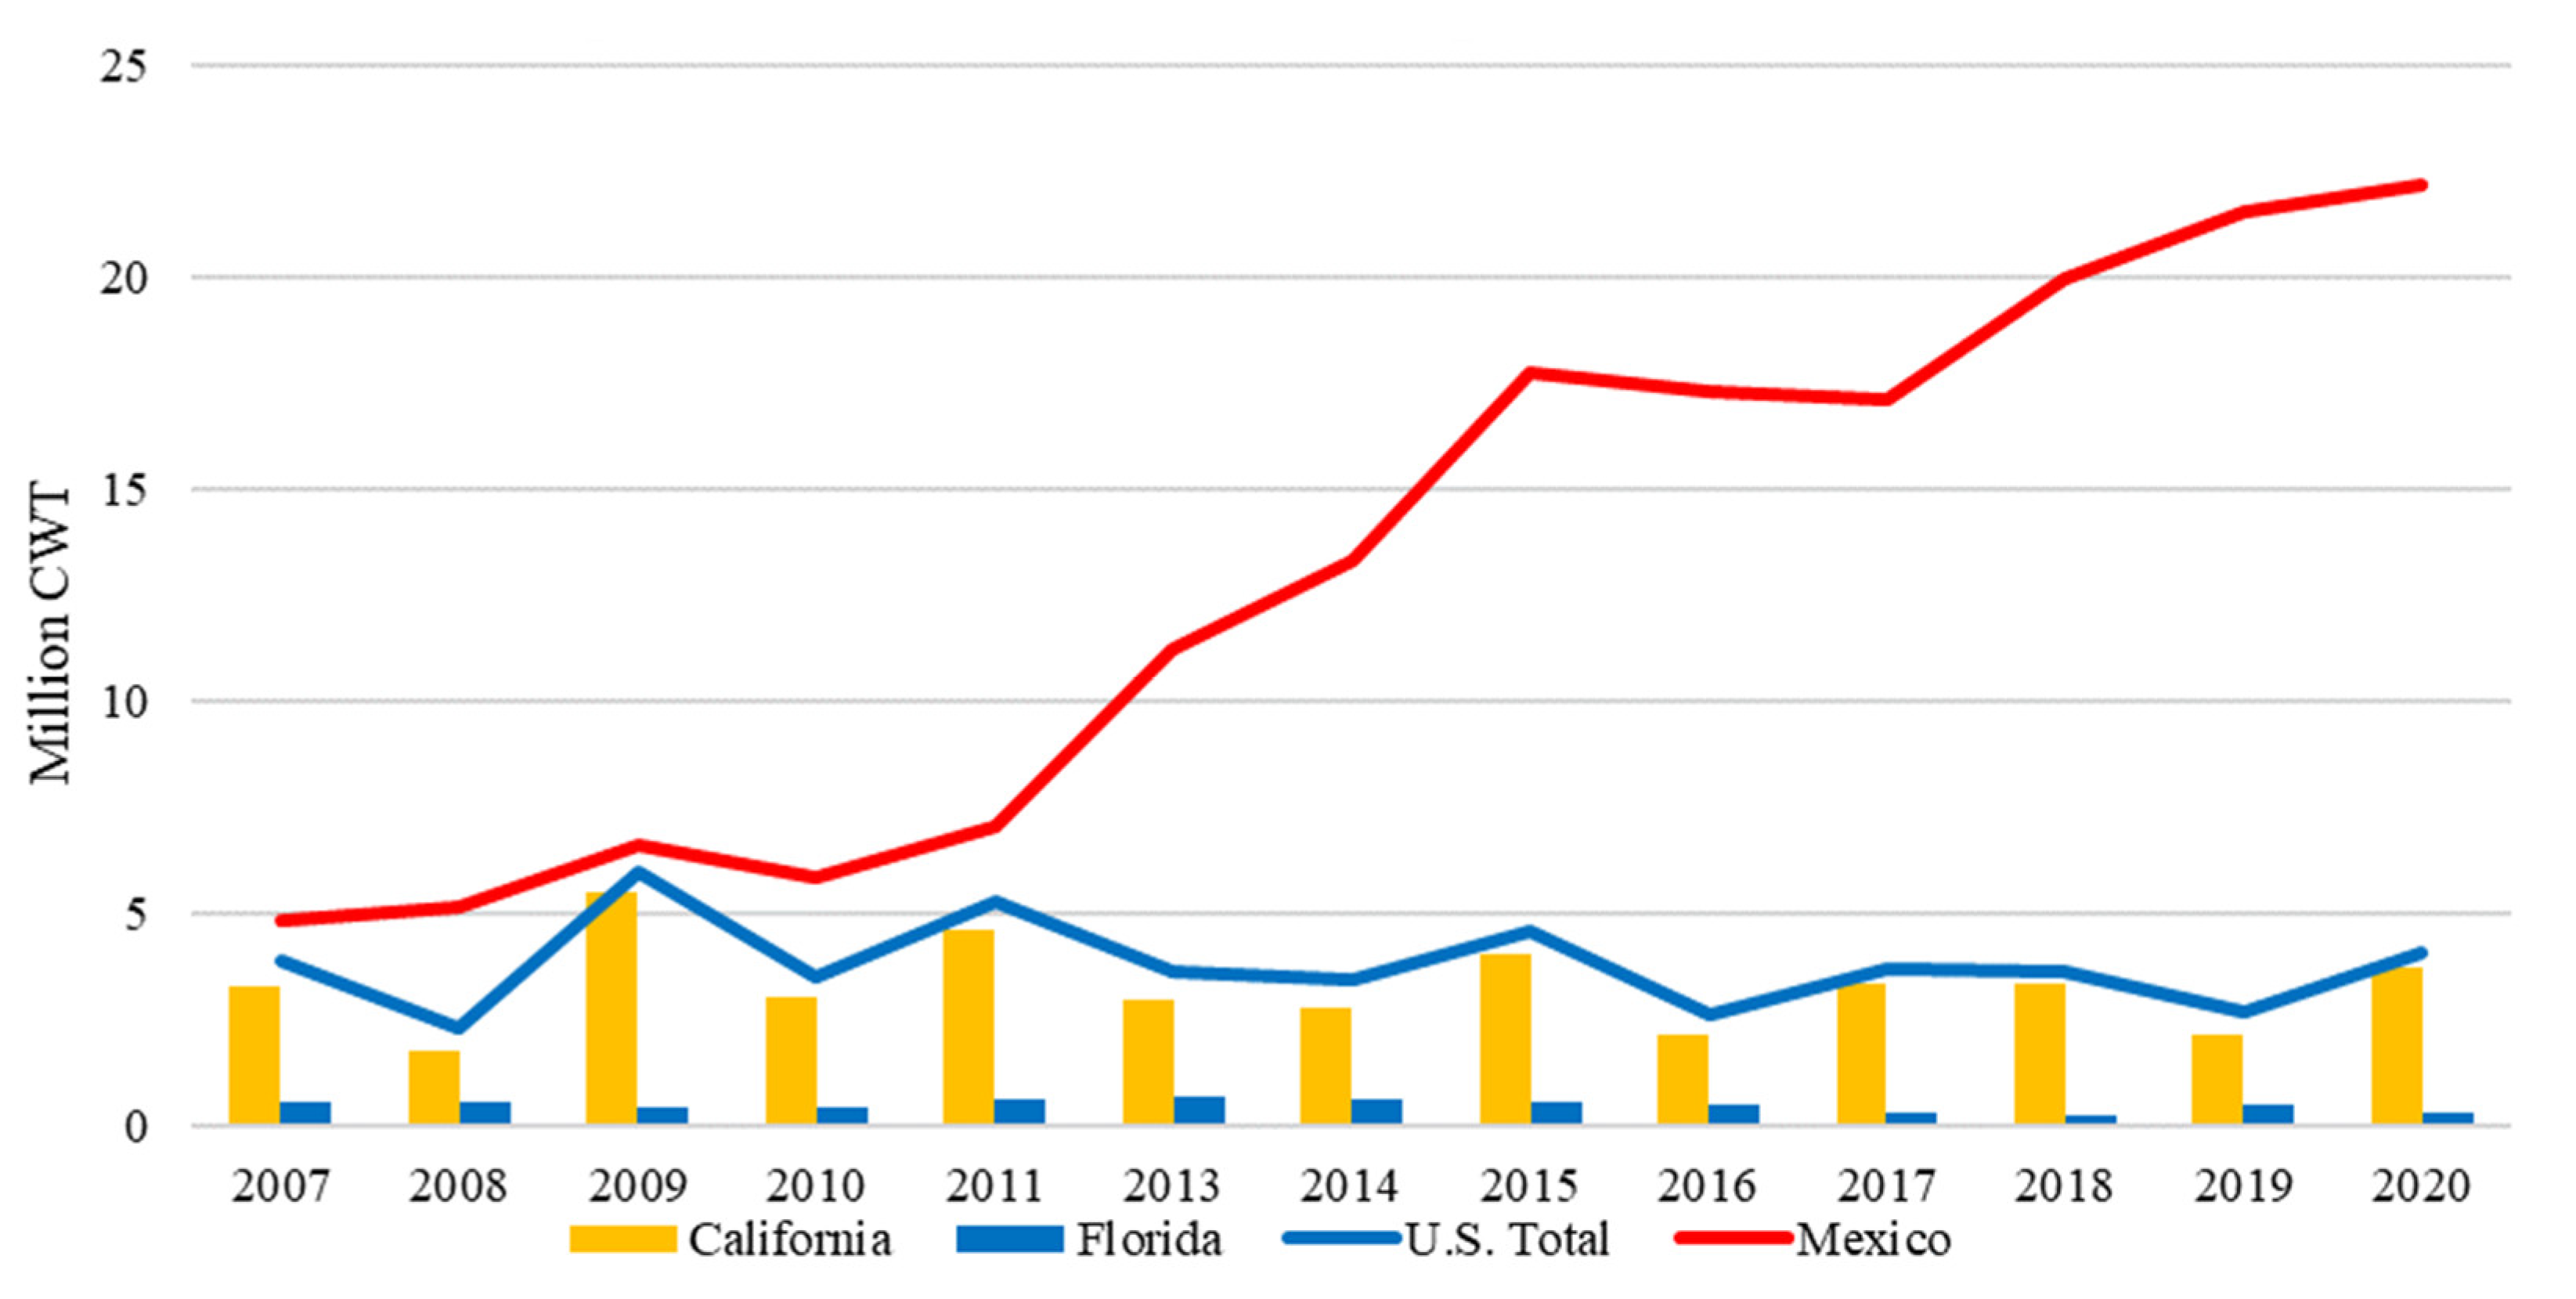
3.2.1. Avocado
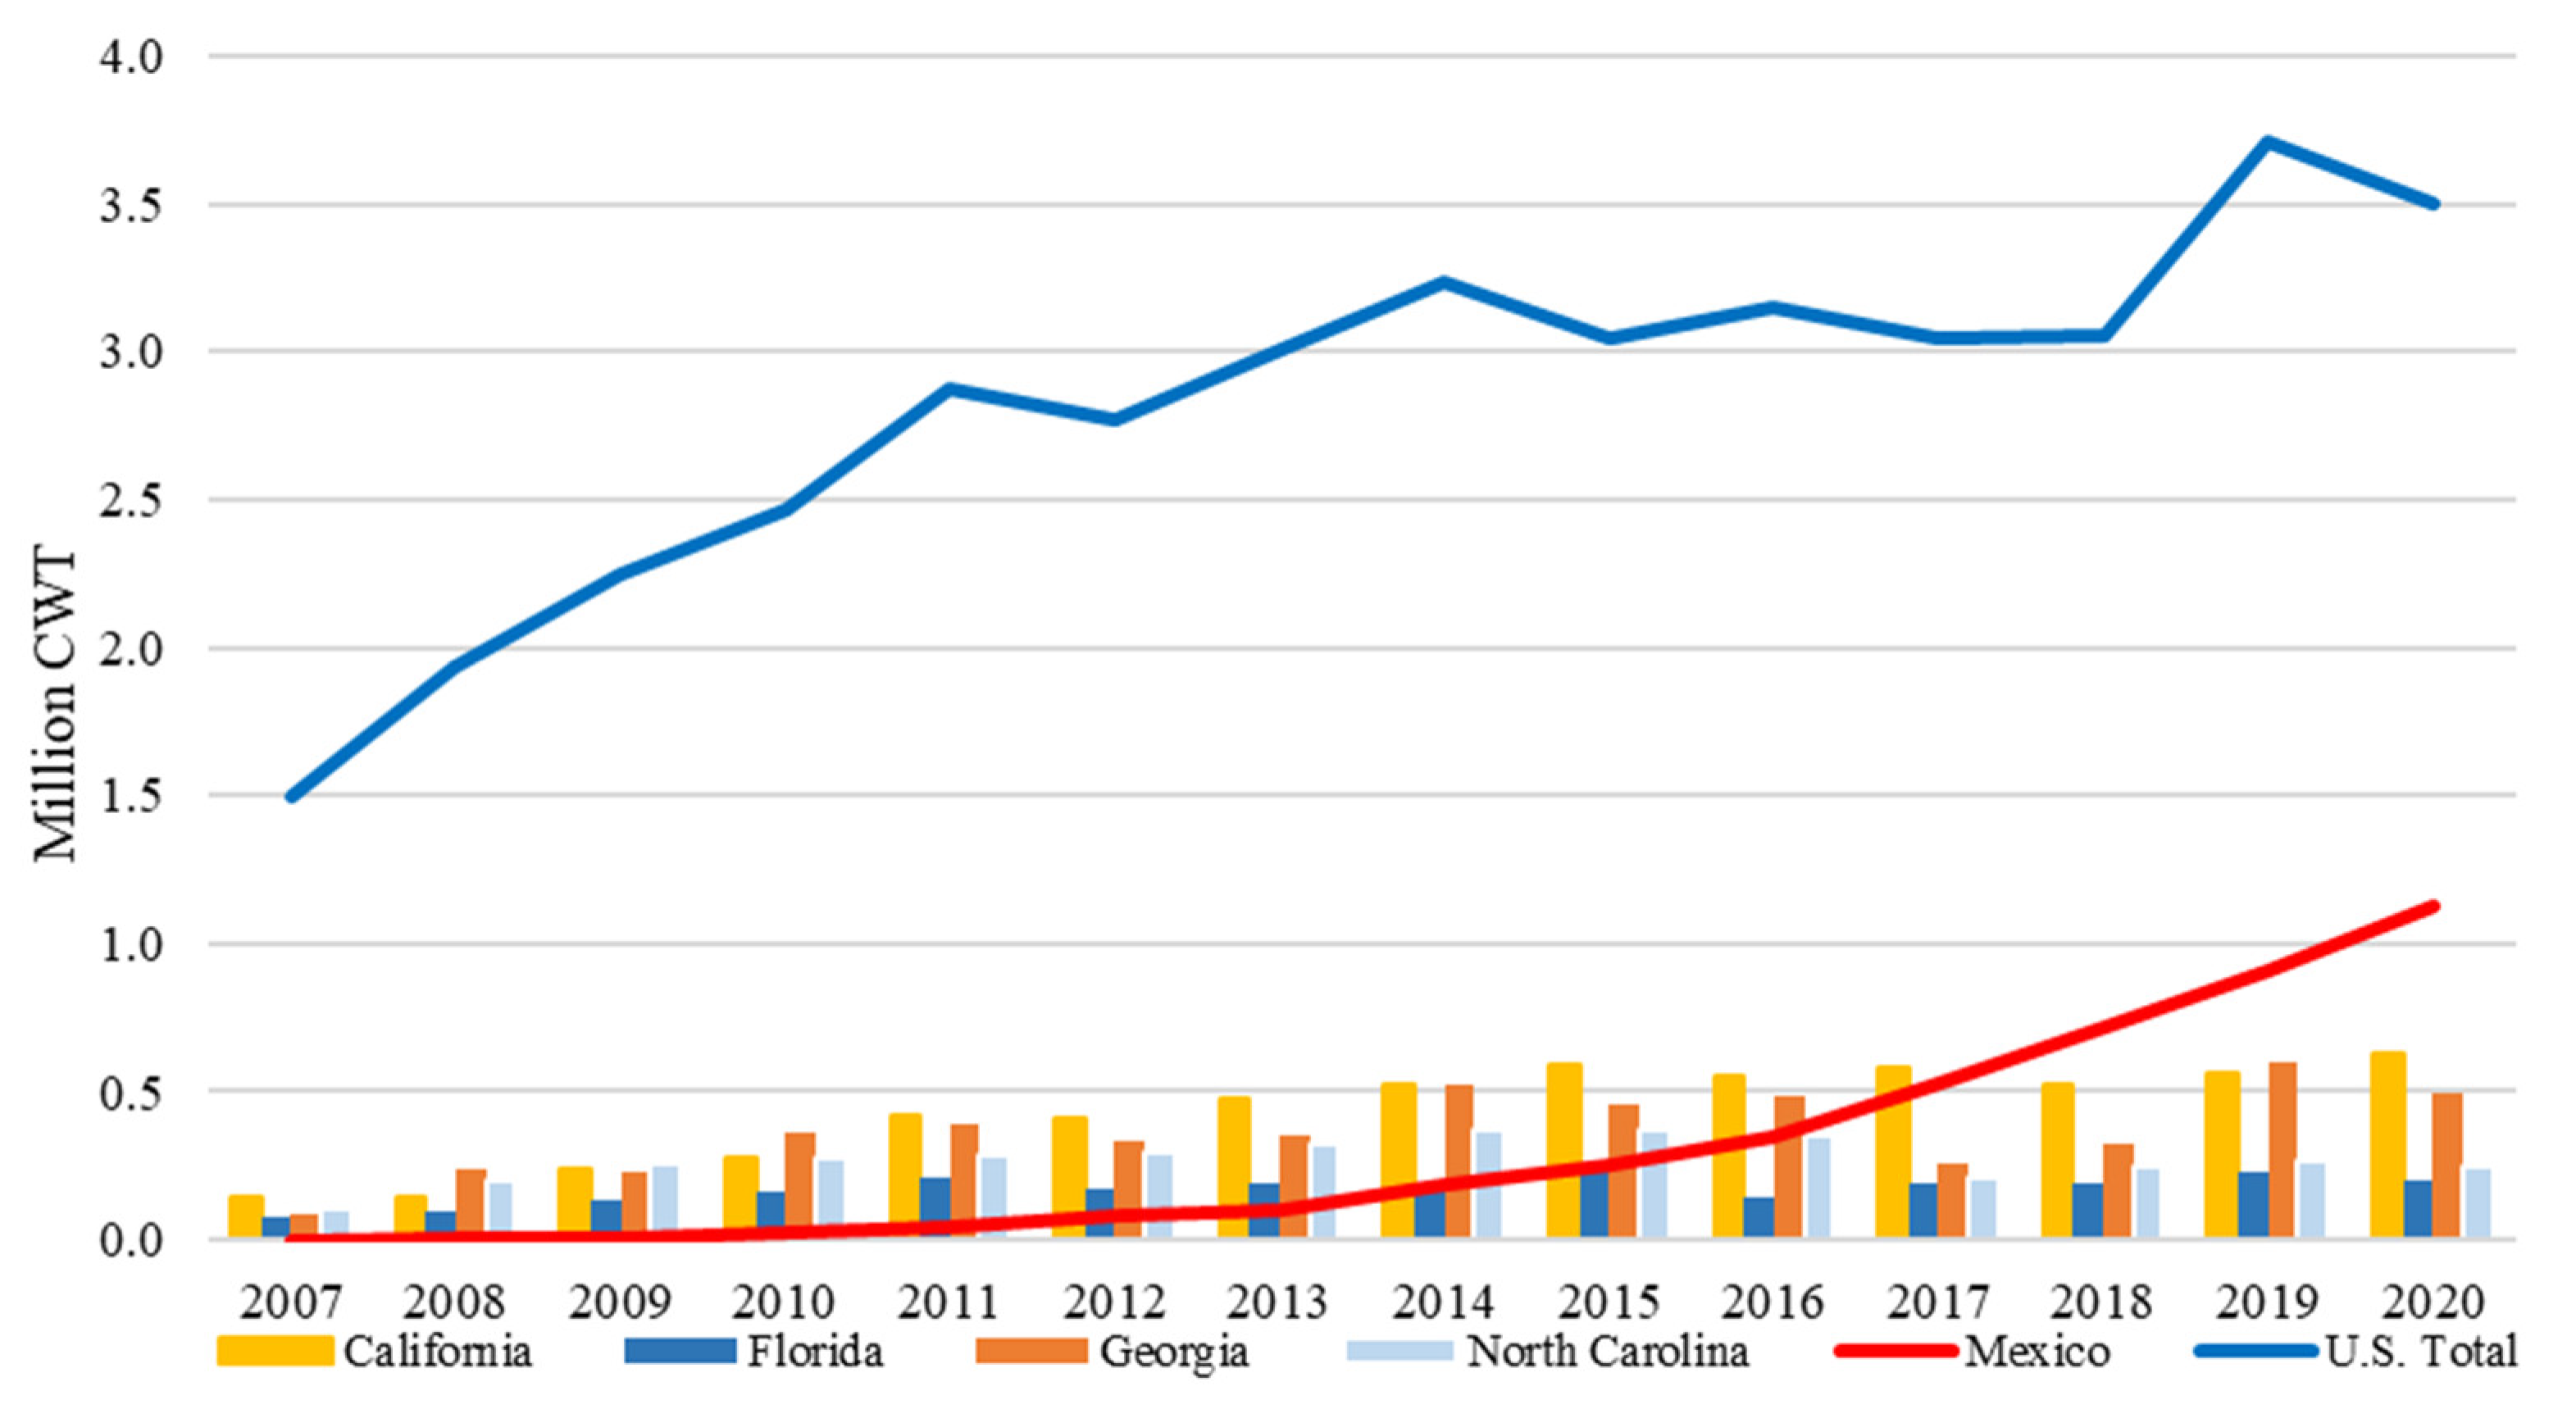
3.2.2. Berries: Raspberry, Strawberry, and Blueberry
3.2.3. Citrus
3.2.4. Watermelon
3.3. Fresh Vegetable Production and Imports
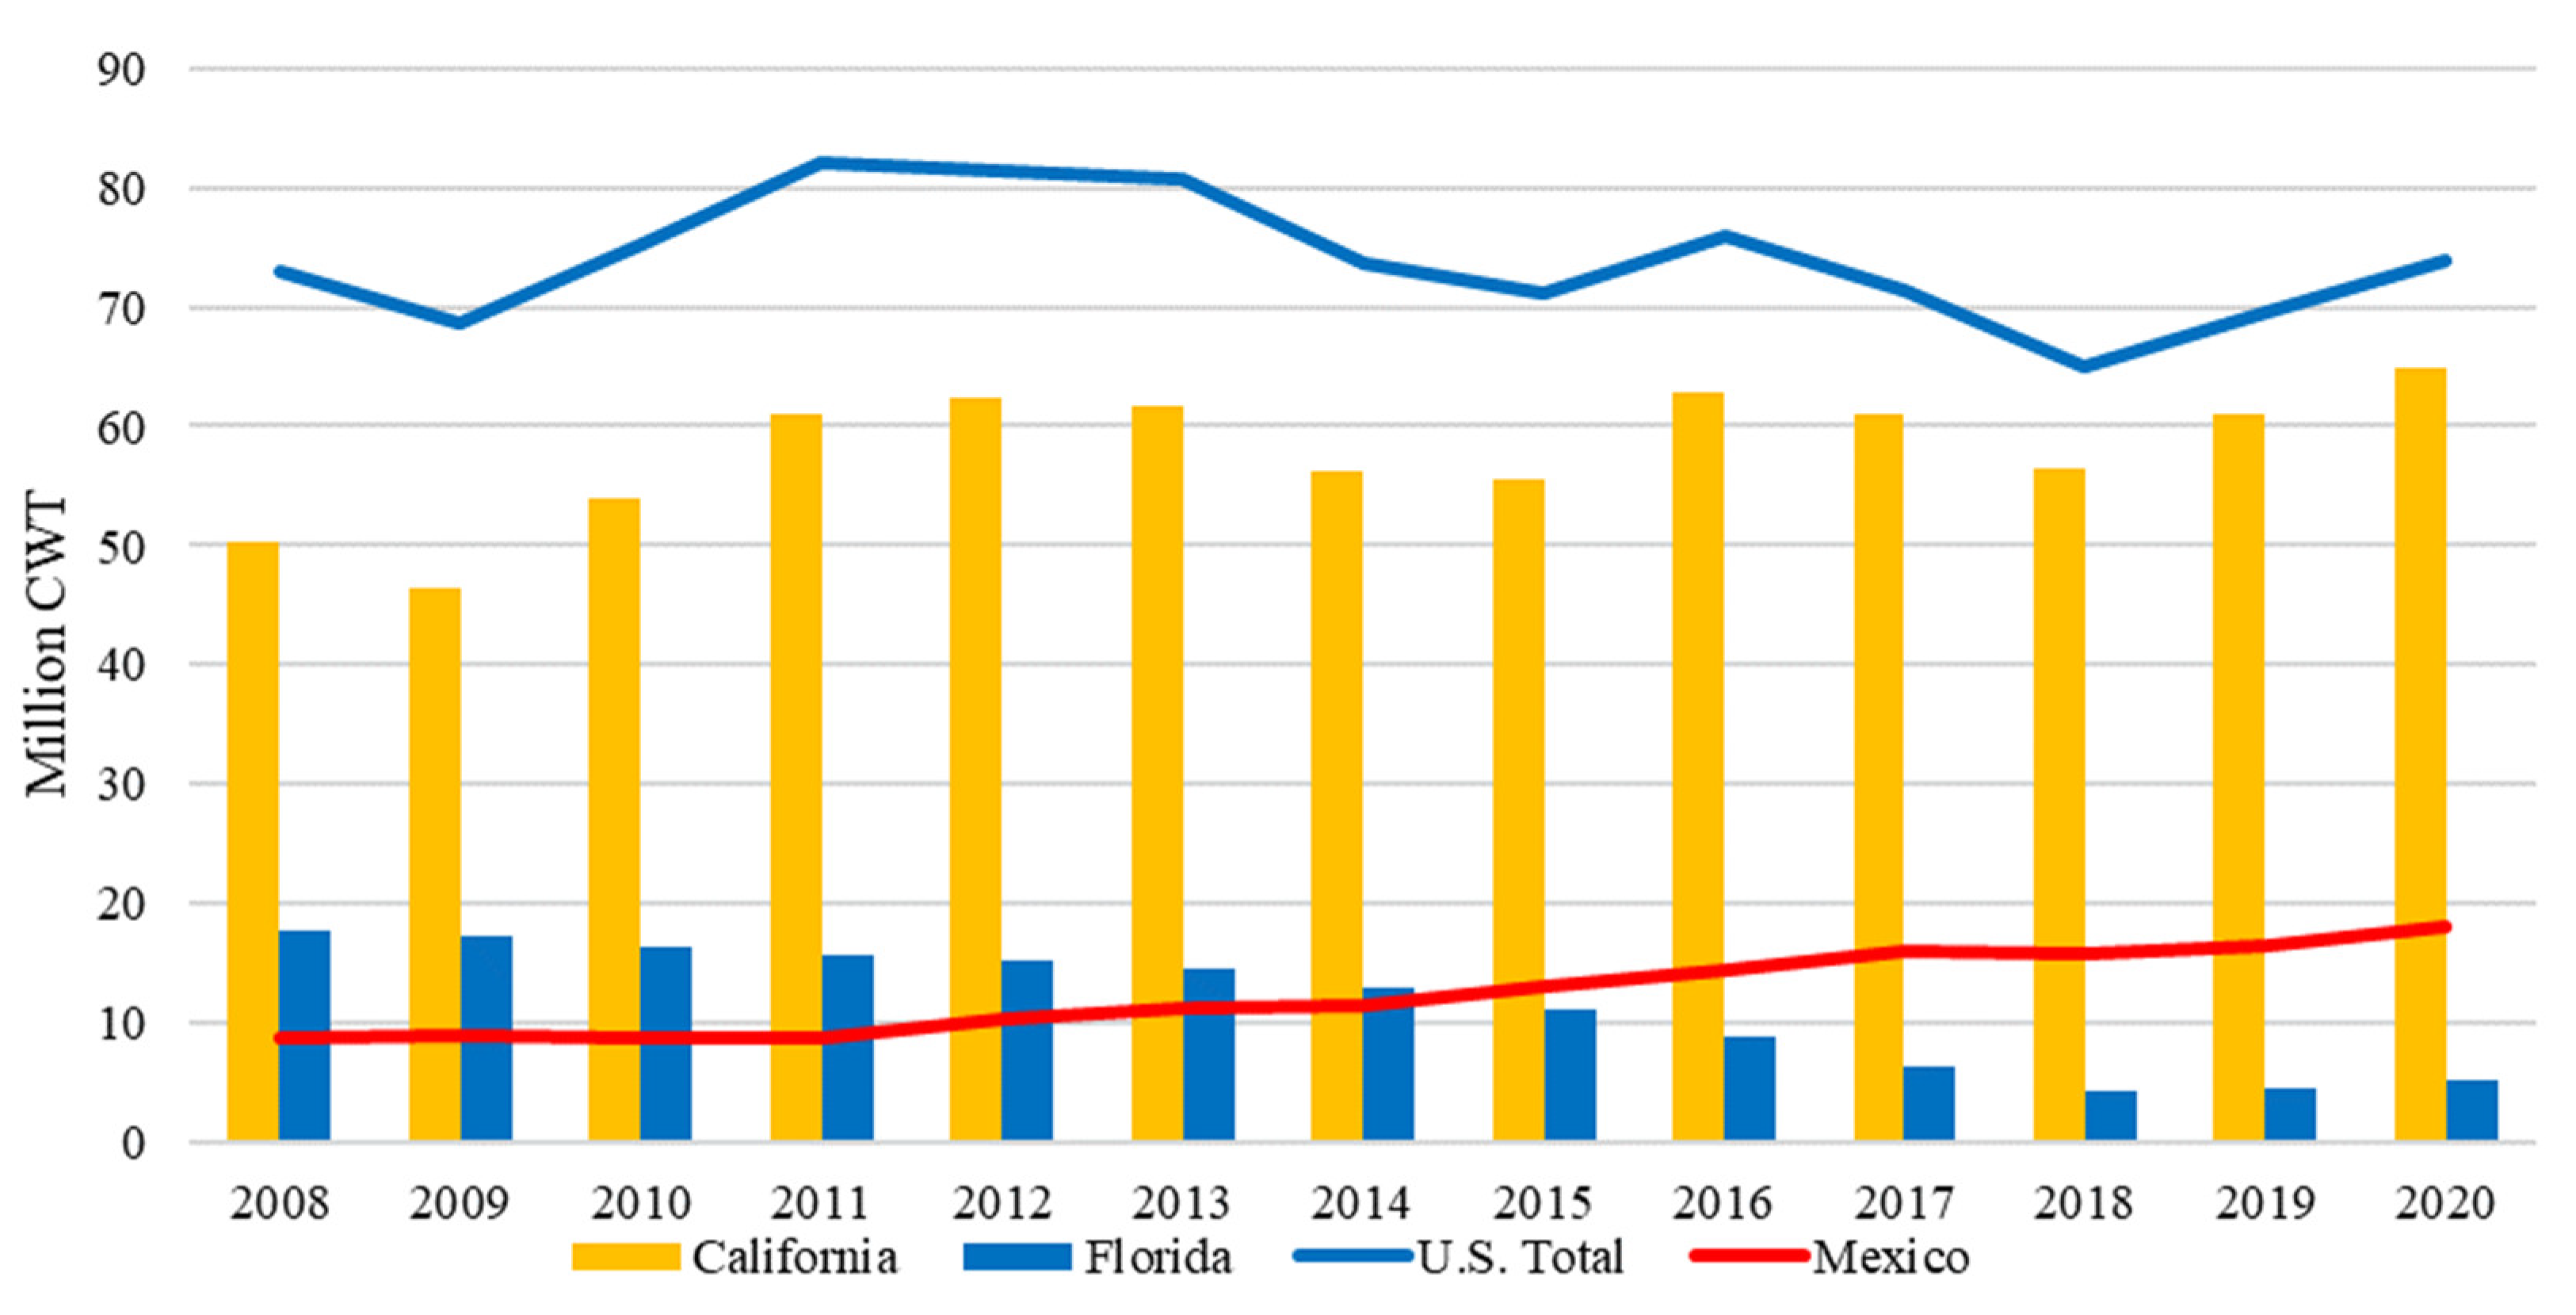
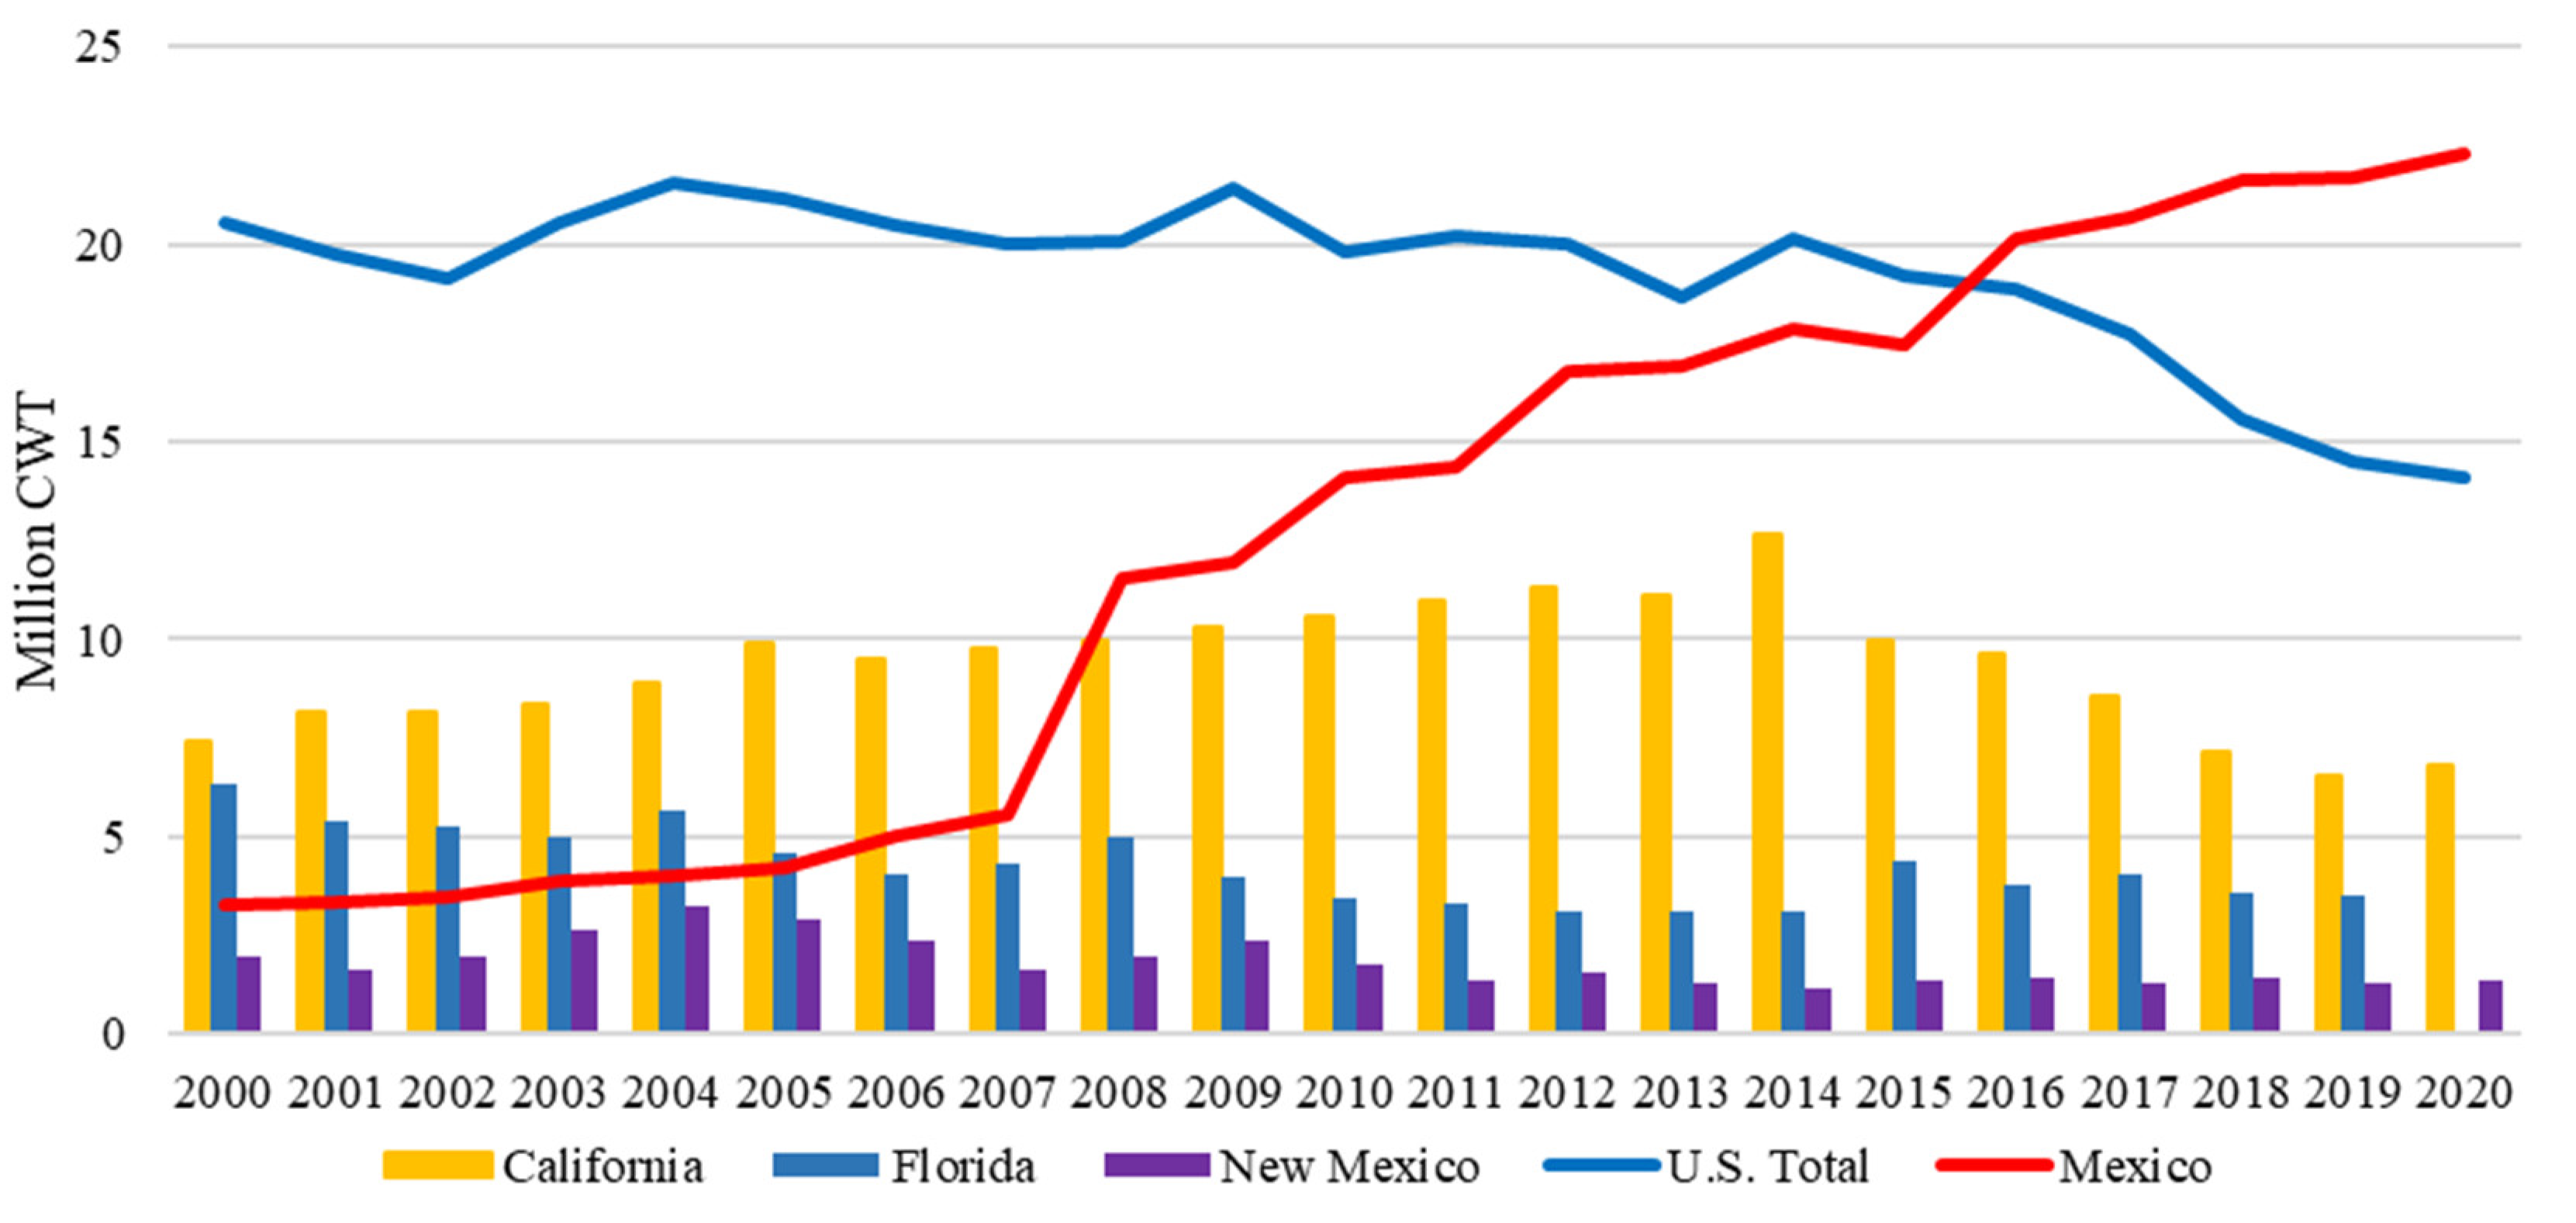
3.3.1. Tomato
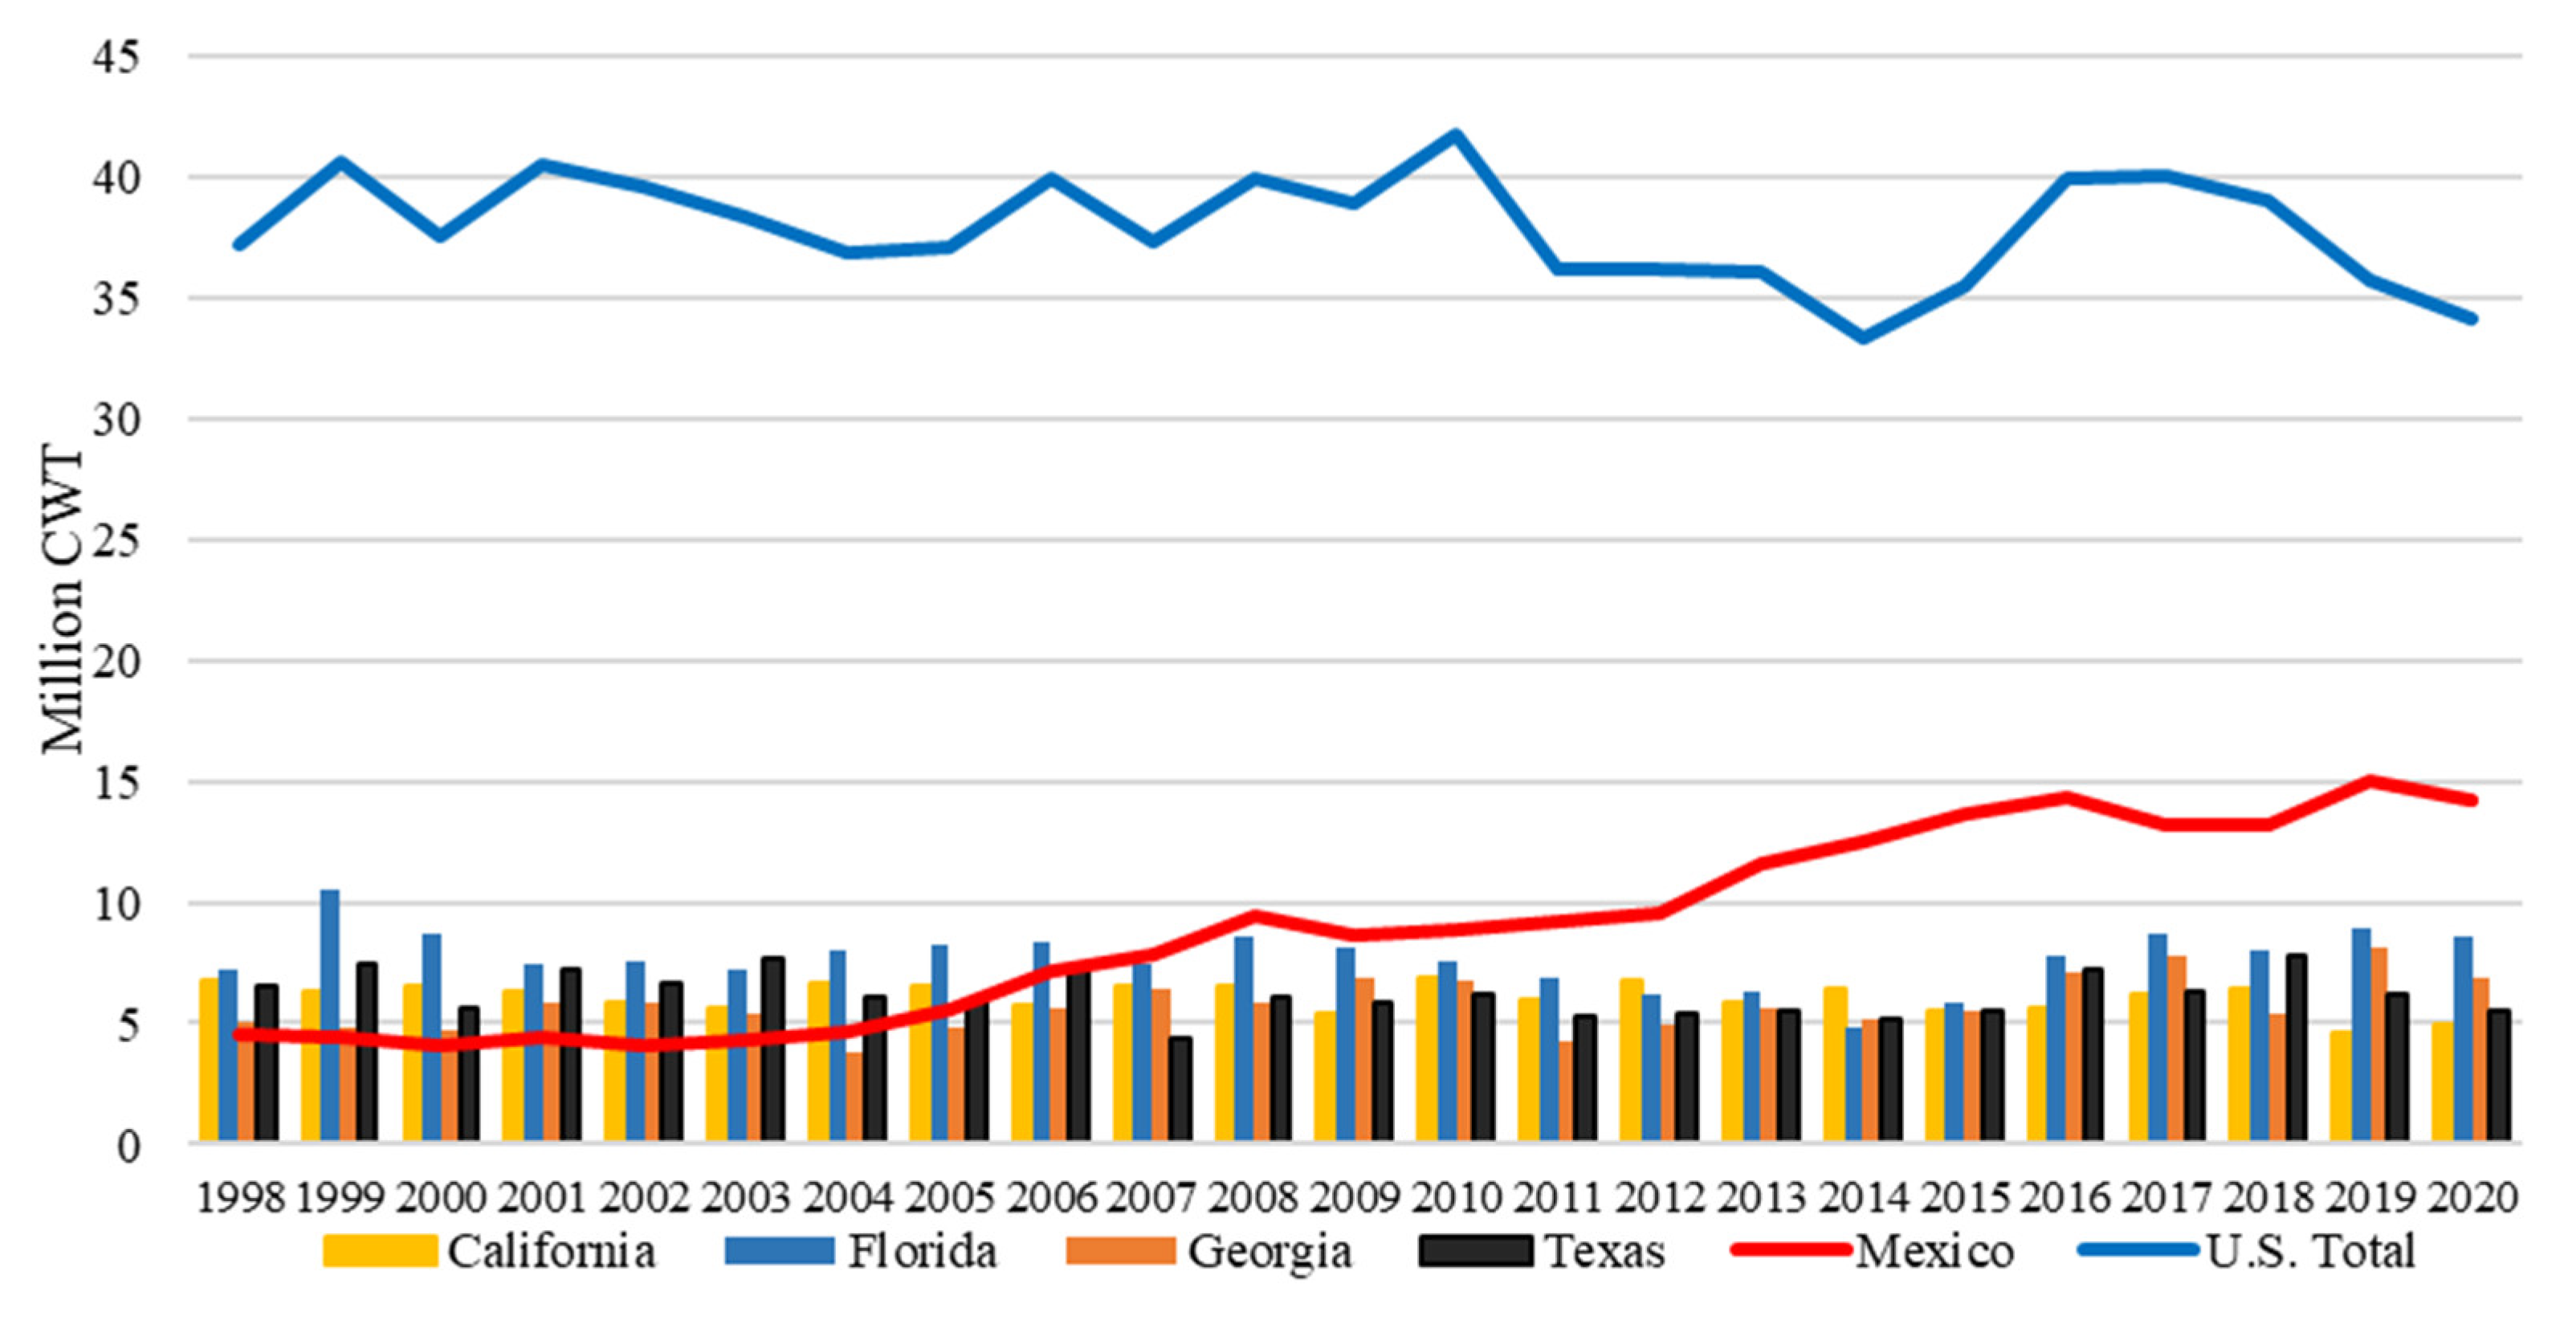
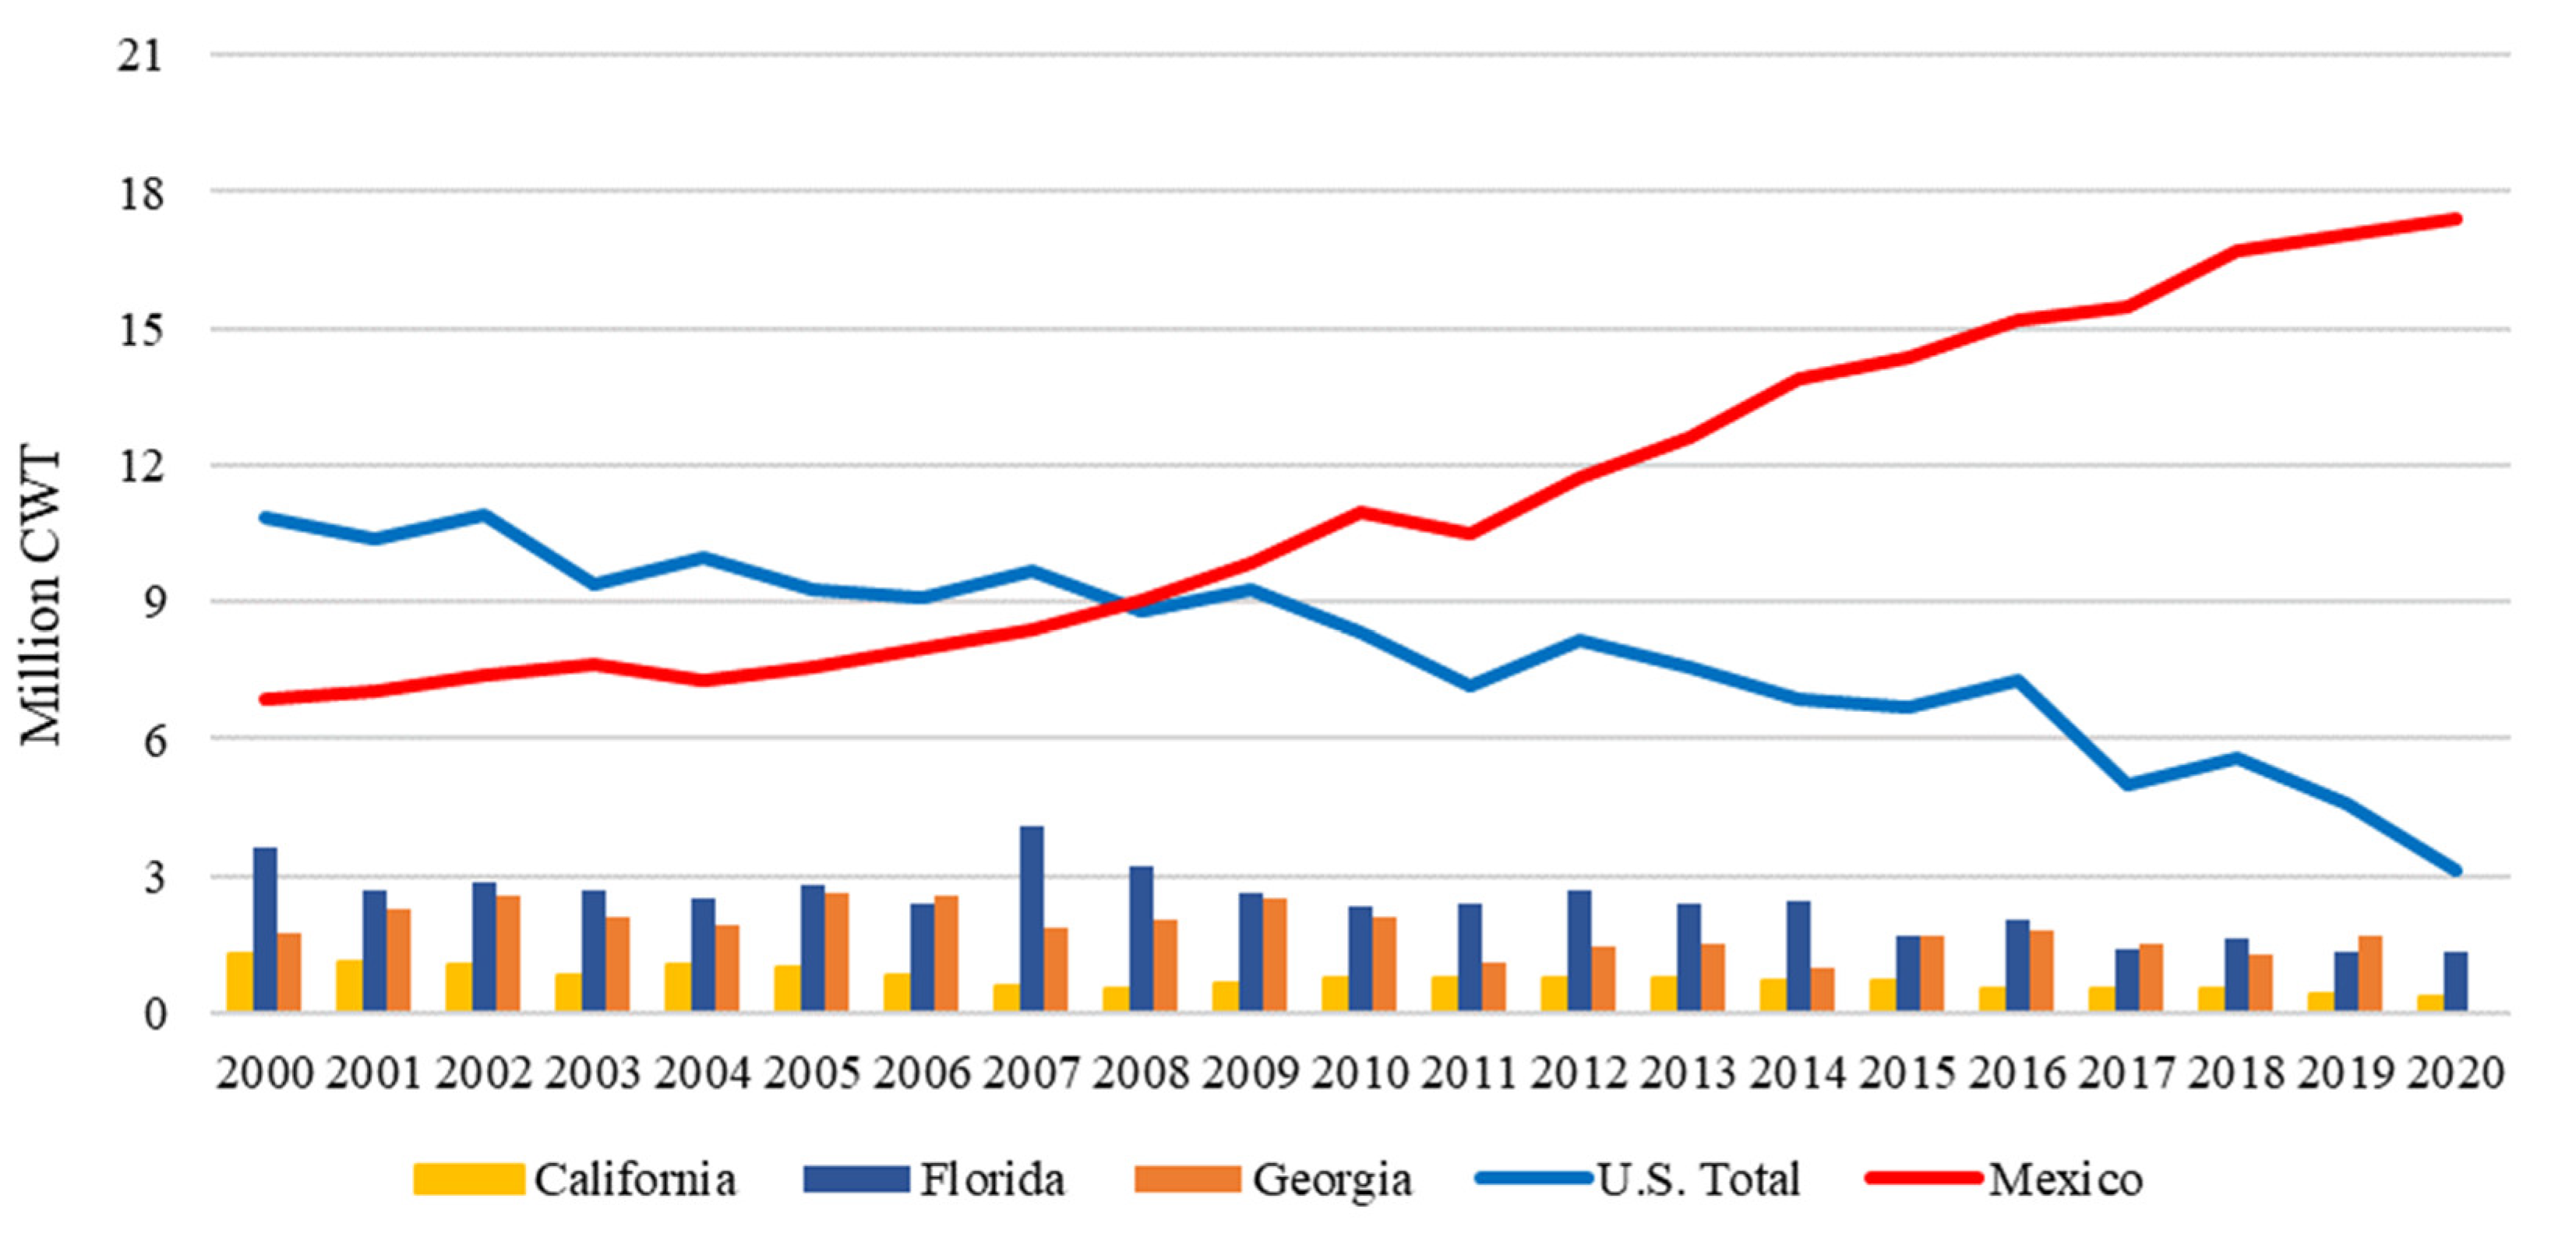
3.3.2. Peppers
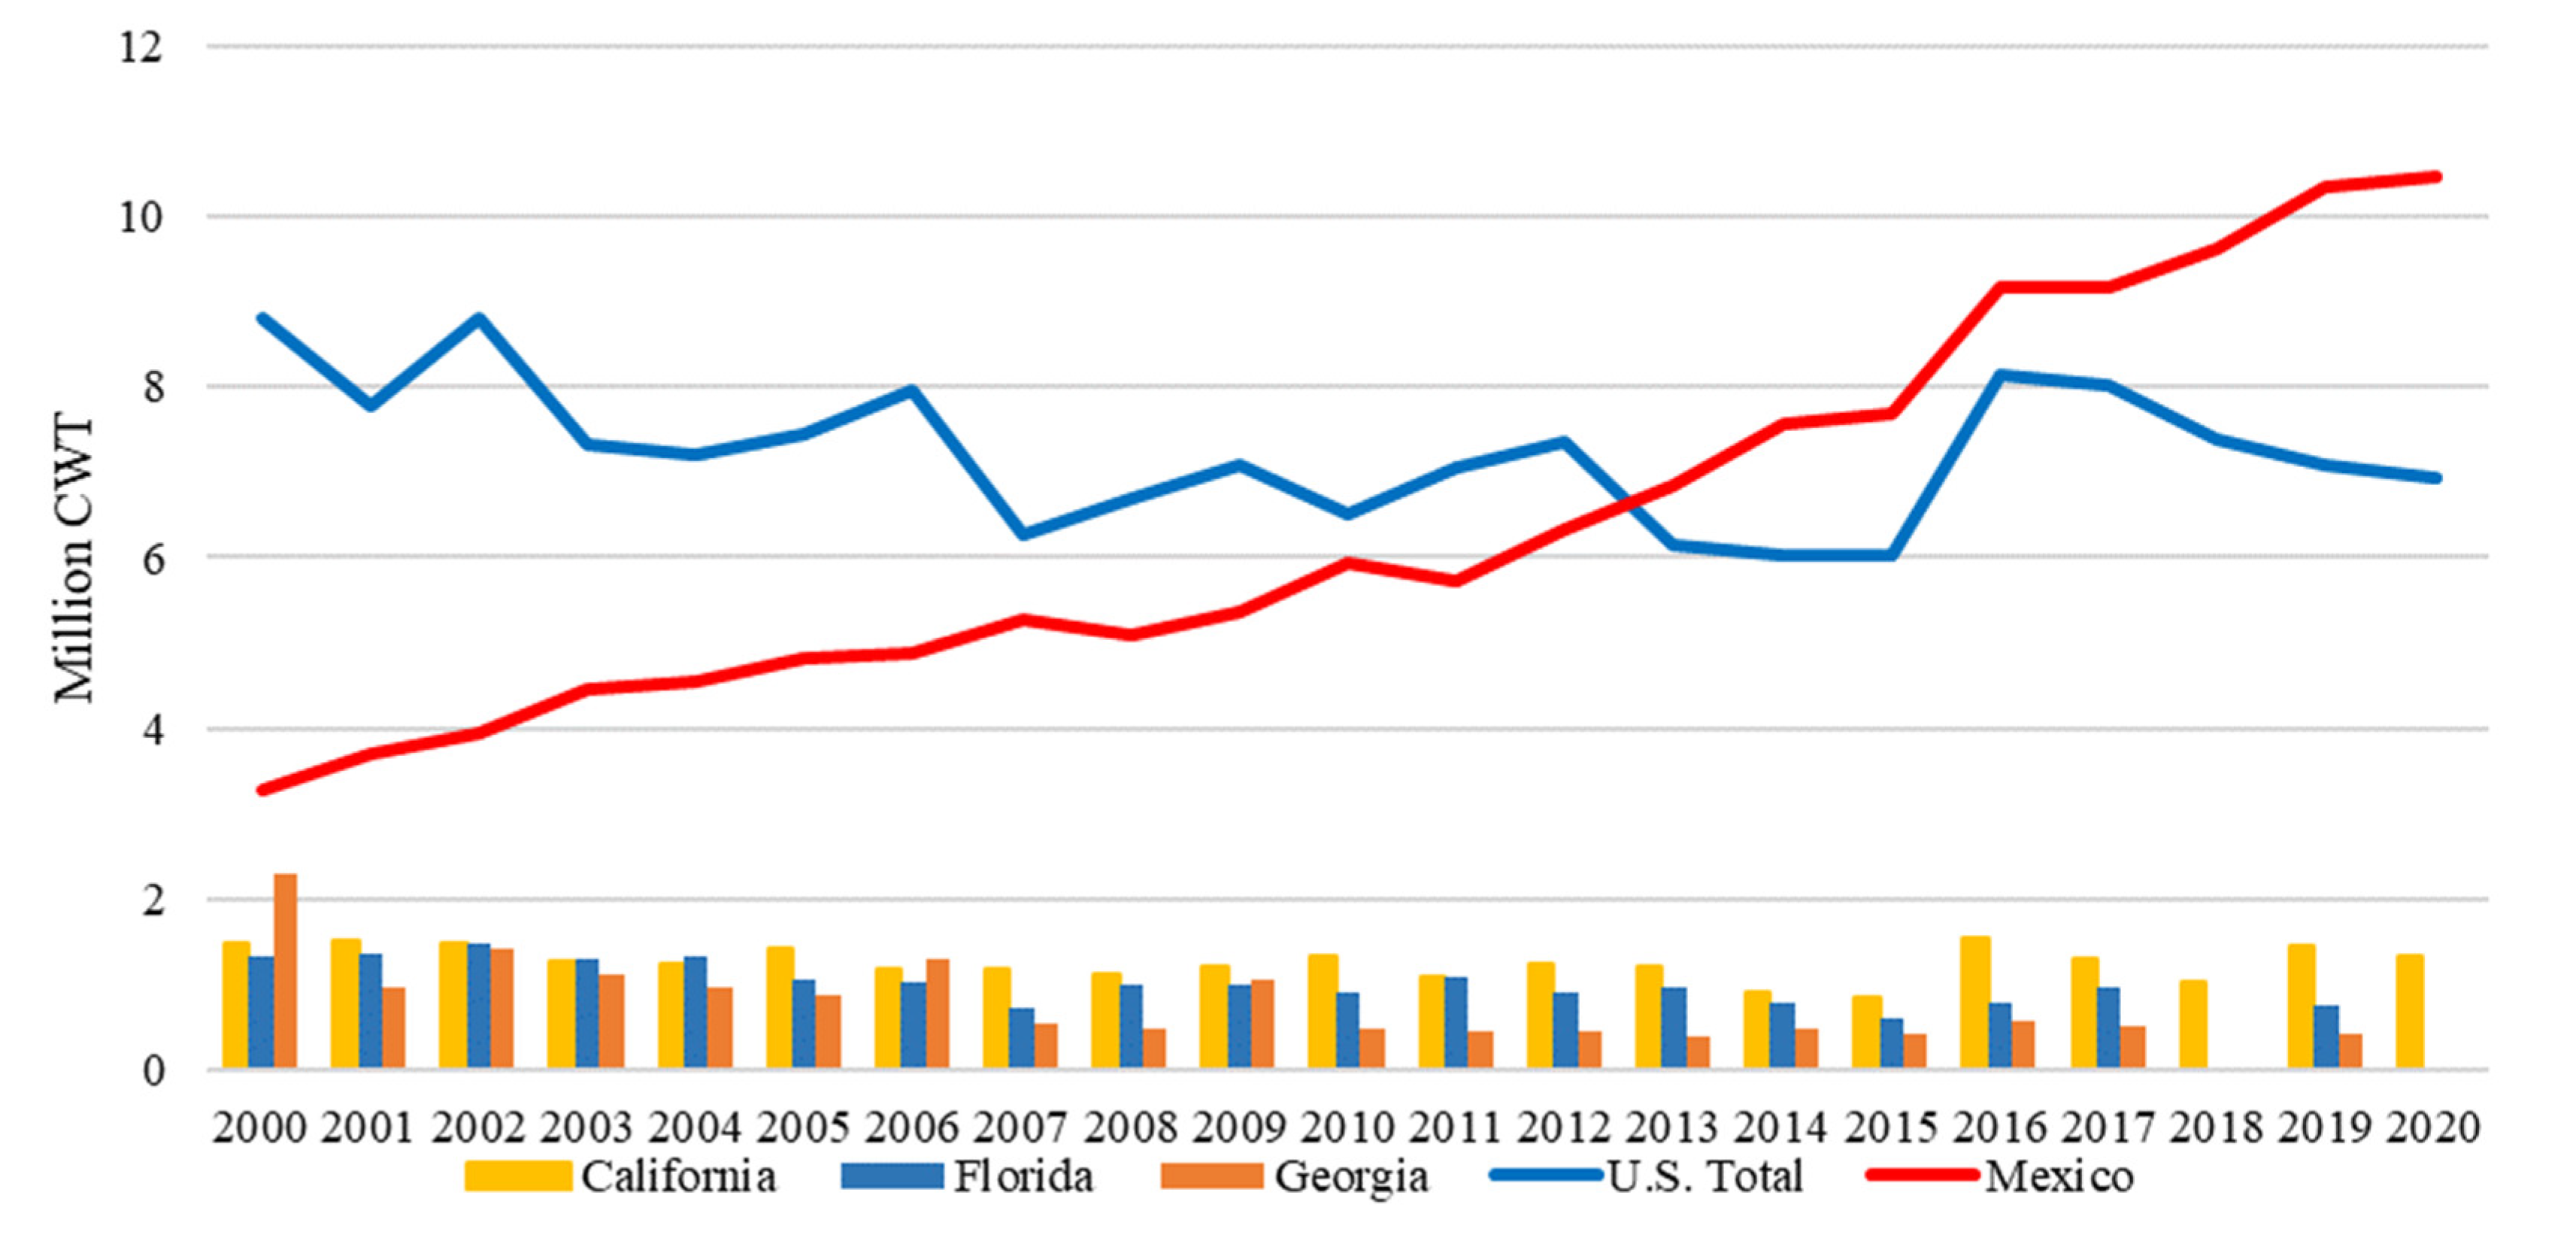
3.3.3. Cucumber
3.3.4. Squash
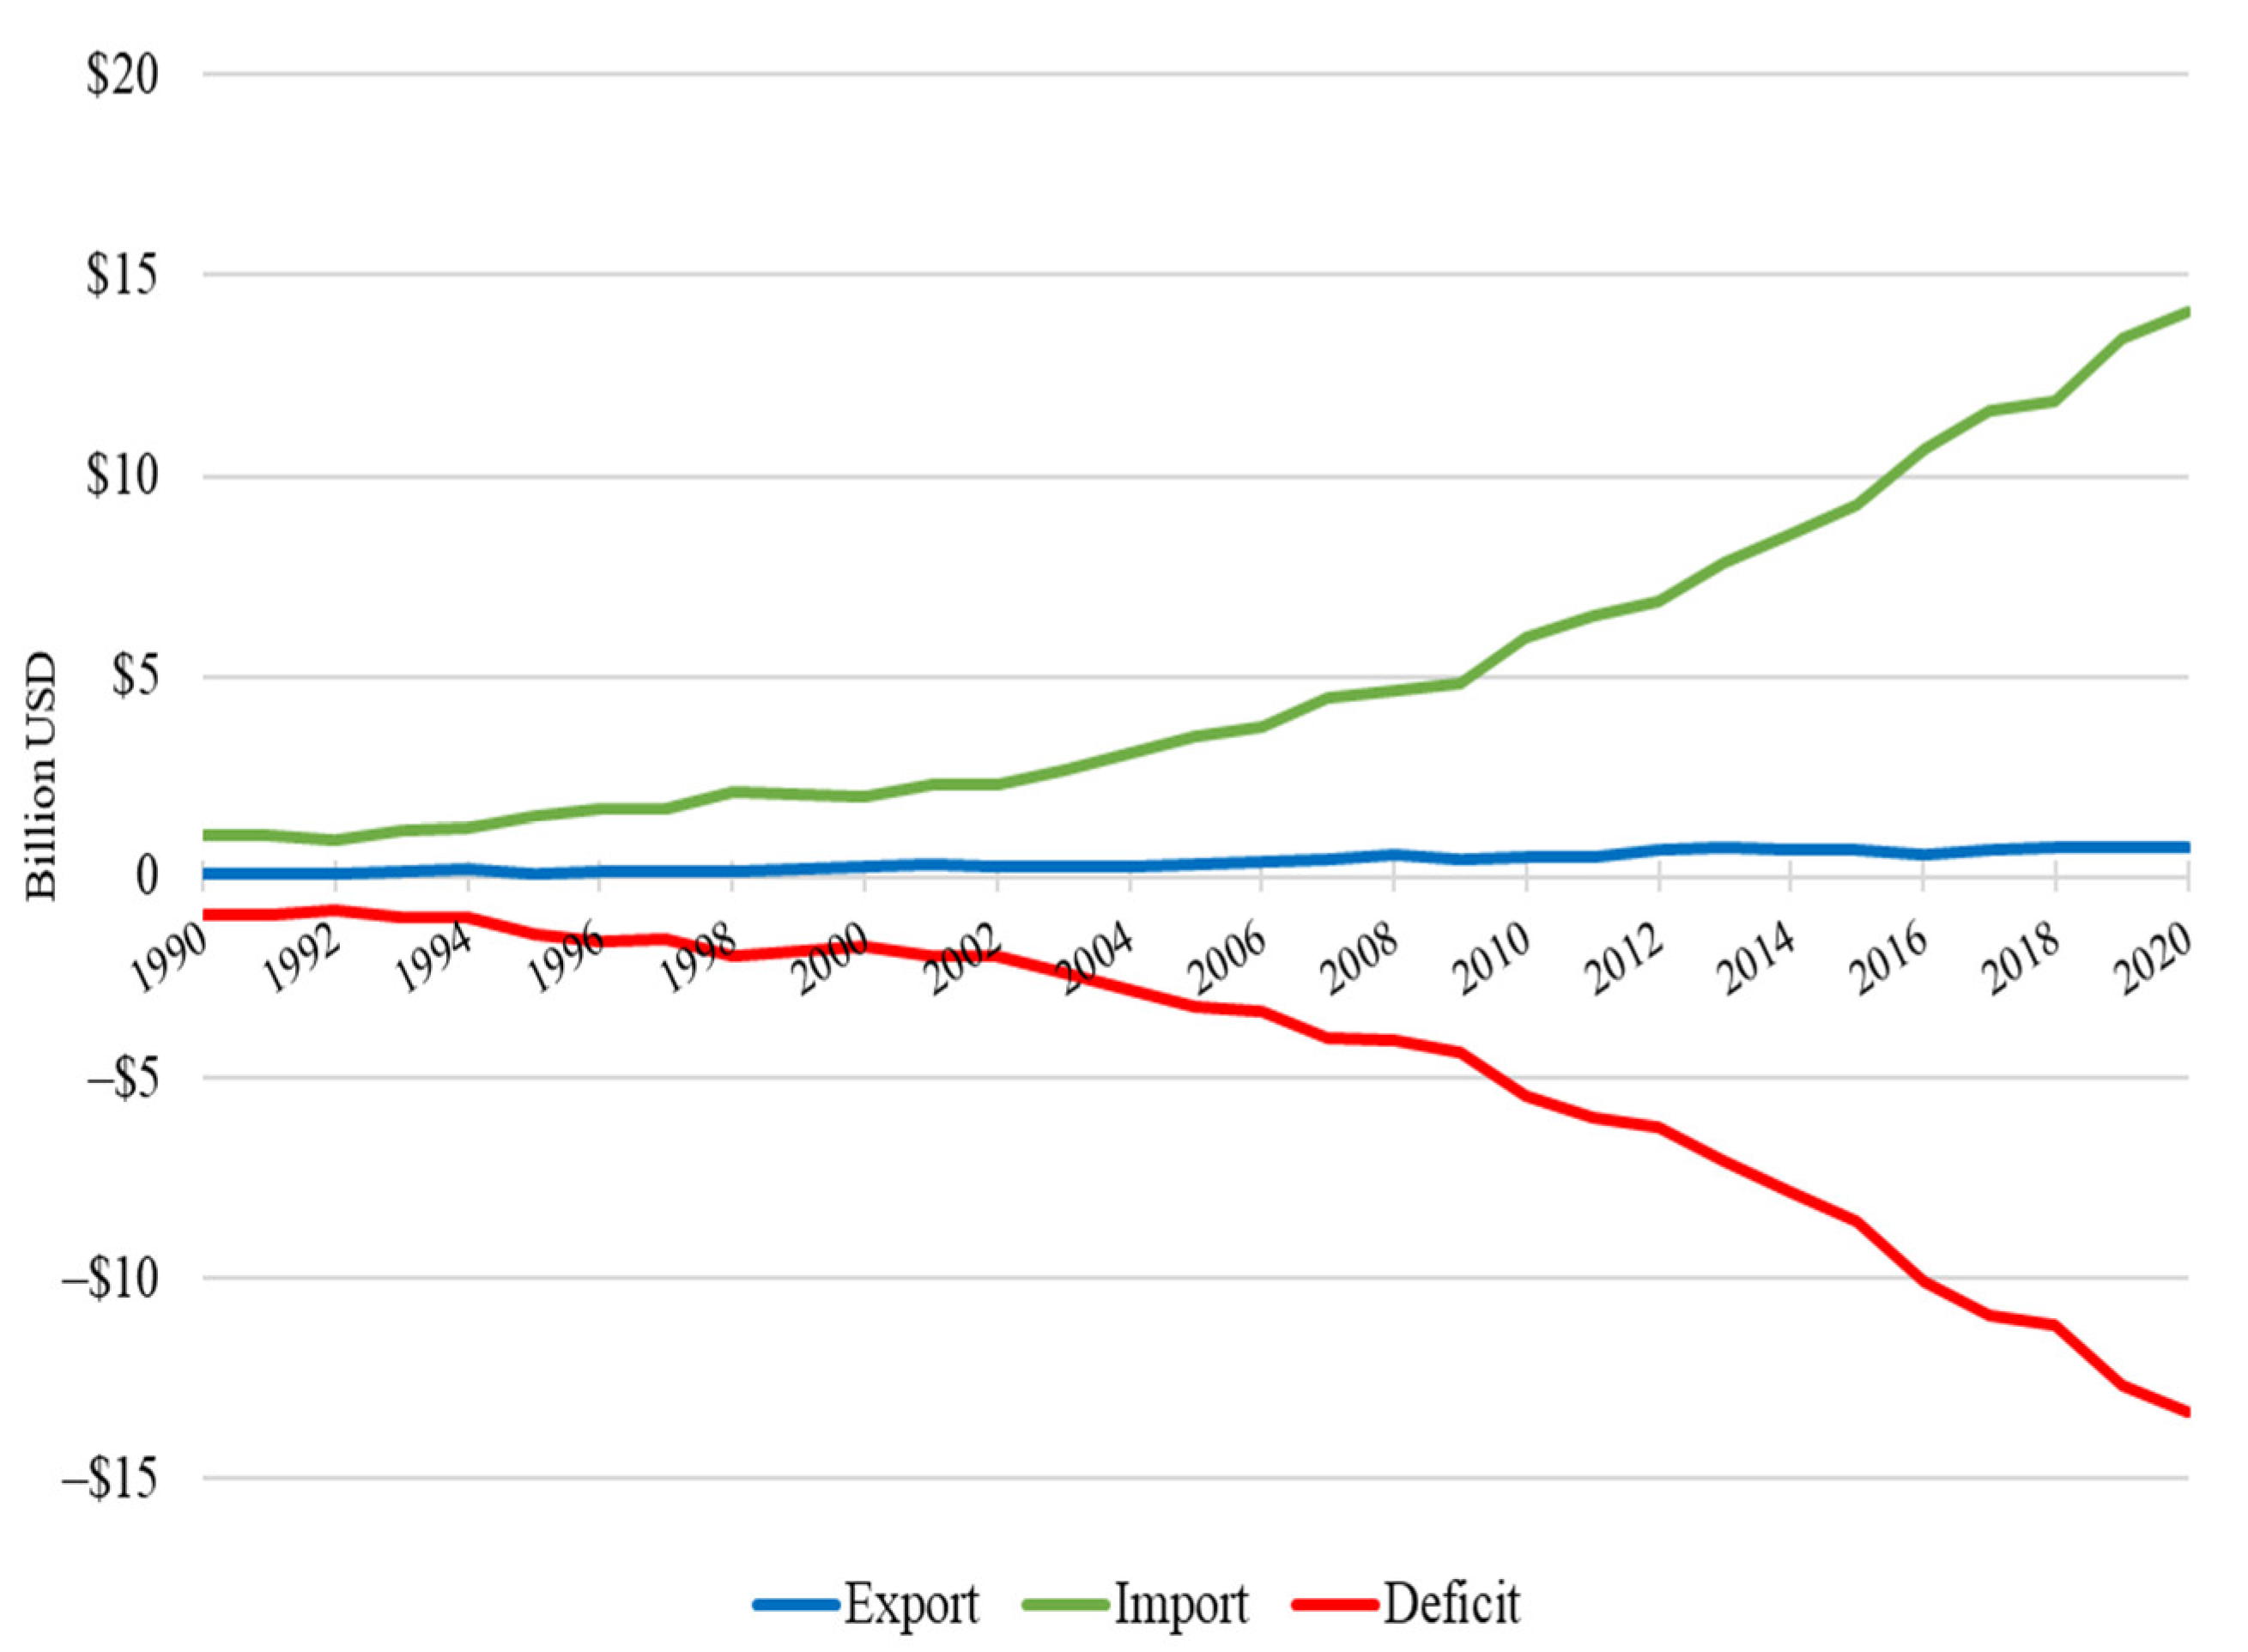
3.4. Trade Performance of Mexican Fruit and Vegetable Imports
4. Factors Driving the Surge of Imports from Mexico
5. Conclusions
Author Contributions
Funding
Institutional Review Board Statement
Data Availability Statement
Conflicts of Interest
Appendix A

| (a) Avocado | ||||||||||||
| Jan | Feb | Mar | Apr | May | Jun | Jul | Aug | Sep | Oct | Nov | Dec | |
| Mexico | X | X | X | X | X | X | X | X | X | X | X | X |
| California | X | X | X | X | X | X | X | X | X | X | X | X |
| Florida | X | X | X | X | X | X | X | X | X | |||
| (b) Raspberry | ||||||||||||
| Jan | Feb | Mar | Apr | May | Jun | Jul | Aug | Sep | Oct | Nov | Dec | |
| Mexico | X | X | X | X | X | X | X | X | X | |||
| California | X | X | X | X | X | |||||||
| (c) Strawberry | ||||||||||||
| Jan | Feb | Mar | Apr | May | Jun | Jul | Aug | Sep | Oct | Nov | Dec | |
| Mexico | X | X | X | X | X | X | X | |||||
| California | X | X | X | X | X | X | X | |||||
| Florida | X | X | X | X | X | X | ||||||
| (d) Blueberry | ||||||||||||
| Jan | Feb | Mar | Apr | May | Jun | Jul | Aug | Sep | Oct | Nov | Dec | |
| Mexico | X | X | X | X | X | X | X | X | X | X | ||
| California | X | X | ||||||||||
| Florida | X | X | ||||||||||
| Georgia | X | X | X | X | X | X | ||||||
| N. Carolina | X | X | X | X | ||||||||
| Michigan | X | X | X | X | ||||||||
| Oregon | X | X | X | X | ||||||||
| Washington | X | X | X | X | X | |||||||
| (e) Citrus | ||||||||||||
| Jan | Feb | Mar | Apr | May | Jun | Jul | Aug | Sep | Oct | Nov | Dec | |
| Mexico | LO | LO | LO | LO | LO | GL | GL | GL | GL | GL | GLO | LO |
| California | LOT | LOT | GLOT | GLOT | GLO | GLO | GLO | GLO | GLO | GLOT | LOT | LOT |
| Florida | GOT | GOT | GOT | GOT | GO | GO | GO | G | GOT | GOT | GOT | |
| (f) Watermelon | ||||||||||||
| Jan | Feb | Mar | Apr | May | Jun | Jul | Aug | Sep | Oct | Nov | Dec | |
| Mexico | X | X | X | X | X | X | ||||||
| California | X | X | X | X | X | X | ||||||
| Florida | X | X | X | X | ||||||||
| Georgia | X | X | ||||||||||
| Texas | X | X | X | X | ||||||||
| (a) Tomato | ||||||||||||
| Jan | Feb | Mar | Apr | May | Jun | Jul | Aug | Sep | Oct | Nov | Dec | |
| Mexico | X | X | X | X | X | X | X | X | X | X | X | |
| California | X | X | X | X | X | X | X | X | X | |||
| Florida | X | X | X | X | X | X | X | X | ||||
| (b) Peppers (Bell and Chili) | ||||||||||||
| Jan | Feb | Mar | Apr | May | Jun | Jul | Aug | Sep | Oct | Nov | Dec | |
| Mexico | BC | BC | BC | BC | C | C | C | C | C | C | BC | BC |
| California | C | C | C | C | BC | BC | BC | BC | ||||
| Florida | B | B | B | B | B | B | B | B | B | |||
| N. Mexico | C | C | C | C | C | C | C | |||||
| (c) Cucumber | ||||||||||||
| Jan | Feb | Mar | Apr | May | Jun | Jul | Aug | Sep | Oct | Nov | Dec | |
| Mexico | X | X | X | X | X | X | X | |||||
| California | X | X | X | X | X | X | X | X | ||||
| Florida | X | X | X | X | X | X | X | X | ||||
| Georgia | X | X | X | X | X | |||||||
| N. Carolina | X | X | X | X | X | |||||||
| Michigan | X | X | X | X | ||||||||
| (d) Squash | ||||||||||||
| Jan | Feb | Mar | Apr | May | Jun | Jul | Aug | Sep | Oct | Nov | Dec | |
| Mexico | X | X | X | X | X | X | X | X | ||||
| California | X | X | X | X | ||||||||
| Florida | X | X | X | X | X | X | X | X | X | |||
| Georgia | X | X | X | X | X | X | X | |||||
| Michigan | X | X | X | X | ||||||||
| Oregon | X | X | X | |||||||||
References
- USDA National Agricultural Statistics Service (USDA NASS). 2017 Census of Agriculture: United States Summary and State Data. Census Agric. 2019, 1, 6–10; 611–614. [Google Scholar]
- Huang, K.-M.; Sant’Anna, A.C.; Etienne, X. How did COVID-19 impact US household foods? an analysis six months in. PLoS ONE 2021, 16, e0256921. [Google Scholar] [CrossRef] [PubMed]
- USDA National Agricultural Statistics Service (USDA NASS). 2017 Census of Agriculture:Specialty Crops. Census Agric. 2019, 2, 1–15. [Google Scholar]
- Guan, Z.; Wu, F.; Roka, F.; Whidden, A. Agricultural Labor and Immigration Reform. Choices 2015, 30, 1–9. [Google Scholar] [CrossRef]
- Biswas, T.; Wu, F.; Guan, Z. Labor Shortages in the Florida Strawberry Industry. EDIS 2018, FE1041, 1–3. [Google Scholar]
- Charlton, D.; Taylor, J.E.; Vougioukas, S.; Rutledge, Z. Can Wages Rise Quickly Enough to Keep Workers in the Fields? Choices 2019, 34, 1–7. [Google Scholar] [CrossRef]
- Beal Cohen, A.A.; Judge, J.; Muneepeerakul, R.; Rangarajan, A.; Guan, Z. A model of crop diversification under labor shocks. PLoS ONE 2020, 15, e0229774. [Google Scholar] [CrossRef]
- Guan, Z.; Wu, F.; Whidden, A. Florida strawberry production costs and trends. EDIS 2020, FE1013, 1–4. [Google Scholar] [CrossRef]
- Canales, E.; Andrango, G.; Williams, A. Mexico’s Agricultural Sector: Production Potential and Implications for Trade. Choices 2019, 34, 1–12. [Google Scholar] [CrossRef]
- Zahniser, S.; Taylor, J.E.; Hertz, T.; Charlton, D. Farm Labor Markets in the United States and Mexico Pose Challenges for US Agriculture. USDA Econ. Res. Serv. Econ. Inf. Bull. 2018, 201, 1–40. [Google Scholar]
- USDA Foreign Agricultural Service (USDA FAS). Global Agricultural Trade System Online. Available online: https://apps.fas.usda.gov/GATS/default.aspx (accessed on 12 May 2022).
- USDA Animal and Plant Health Inspection Service (USDA APHIS). Mexican Hass Avocado Import Program. Fed. Regist. Rules Regul. 2016, 81, 33581–33588. [Google Scholar]
- Suh, D.H.; Guan, Z.; Khachatryan, H. The impact of Mexican competition on the US strawberry industry. Int. Food Agribus. Manag. Rev. 2017, 20, 591–604. [Google Scholar] [CrossRef]
- Guan, Z.; Wu, F.; Whidden, A.J. Top challenges facing the Florida strawberry industry: Insights from a comprehensive industry survey. EDIS 2015, FE972, 1–3. [Google Scholar]
- Wu, F.; Guan, Z. An Overview of the Mexican Blueberry Industry. EDIS 2021, FE1106. [Google Scholar] [CrossRef]
- Luckstead, J.; Devadoss, S. Trends and Issues Facing the US Citrus Industry. Choices 2021, 36, 1–10. [Google Scholar] [CrossRef]
- Li, S.; Wu, F.; Guan, Z.; Luo, T. How trade affects the US produce industry: The case of fresh tomatoes. Int. Food Agribus. Manag. Rev. 2021, 25, 121–133. [Google Scholar] [CrossRef]
- Wu, F.; Guan, Z.; Suh, D.H. The Effects of Tomato Suspension Agreements on Market Price Dynamics and Farm Revenue. Appl. Econ. Perspect. Policy 2018, 40, 316–332. [Google Scholar] [CrossRef]
- Guan, Z.; Suh, D.H.; Wu, F. Tomato Suspension Agreements and the Effects on Market Prices and Farm Revenue. EDIS 2018, FE1025, 1–4. [Google Scholar] [CrossRef]
- United States International Trade Commission (USITC). Cucumbers: Effect of Imports on U.S. Seasonal Markets, with a Focus on the U.S. Southeast. USITC Investig. Rep. 2021, 5268, 17–173. [Google Scholar]
- United States International Trade Commission (USITC). Squash: Effect of Imports on U.S. Seasonal Markets, with a Focus on the U.S. Southeast. USITC Investig. Rep. 2021, 5269, 17–127. [Google Scholar]
- Biswas, T.; Guan, Z.; Wu, F. An overview of the US bell pepper industry. EDIS 2018, FE1028, 1–4. [Google Scholar]
- Pawlak, K.; Smutka, L.; Kotyza, P. Agricultural Potential of the EU Countries: How Far Are They from the USA? Agriculture 2021, 11, 282. [Google Scholar] [CrossRef]
- Pawlak, K. Competitiveness of the EU Agri-Food Sector on the US Market: Worth Reviving Transatlantic Trade? Agriculture 2022, 12, 23. [Google Scholar] [CrossRef]
- Congressional Research Service. Agricultural Provisions of the U.S.-Mexico-Canada Agreement. Congr. Res. Serv. Rep. 2020, R45661, 1–19. [Google Scholar]
- Zahniser, S. United States-Mexico-Canada Agreement (USMCA) Approaches the Starting Block, Offers Growth Opportunities for Agriculture. USDA Econ. Res. Serv. Amber Waves 2020, 2020, 1. [Google Scholar]
- Lee, Y.; Kennedy, P.L. Trade creation and diversion under NAFTA: The North American strawberry market. In Proceedings of the Agricultural and Applied Economics Association (AAEA) Conferences, 2016 Annual Meeting, Boston, MA, USA, 31 July –2 August 2016; pp. 1–32. [Google Scholar] [CrossRef]
- United States International Trade Commission (USITC). Fresh Tomatoes from Mexico. USITC Investig. Rep. 2019, 5003, 1–41. [Google Scholar]
- Congressional Research Service. Seasonal Fruit and Vegetable Competition in U.S.-Mexico Trade. Congr. Res. Serv. Rep. 2020, IF11701, 1–3. [Google Scholar]
- Congressional Research Service. U.S.-Mexico Economic Relations: Trends, Issues, and Implications. Congr. Res. Serv. Rep. 2020, RL32934, 1–26. [Google Scholar]
- Congressional Research Service. U.S. Food and Agricultural Imports: Safeguards and Selected Issues. Congr. Res. Serv. Rep. 2020, R46440, 1–38. [Google Scholar]
- United States International Trade Commission (USITC). Fresh, Chilled, or Frozen Blueberries. USITC Investig. Rep. 2021, 5164, 1. [Google Scholar]
- United States International Trade Commission (USITC). Raspberries for Processing: Conditions of Competition between U.S. and Foreign Suppliers, with a Focus on Washington State. USITC Investig. Rep. 2021, 5194, 151–168. [Google Scholar]
- USDA Economic Research Service Webpage. U.S. Avocado Demand Is Climbing Steadily. Available online: https://www.ers.usda.gov/data-products/chart-gallery/gallery/chart-detail/?chartId=98071 (accessed on 1 July 2022).
- USDA National Agriculutral Statistics Service (USDA NASS). Fruits and Tree Nuts: Blooming, Harvesting, and Marketing Dates. Agric. Handb. 2006, 729, 62–84. [Google Scholar]
- Osuna-García, J.A.; Doyon, G.; Salazar-García, S.; Goenaga, R.; González-Durán, I.J. Effect of harvest date and ripening degree on quality and shelf life of Hass avocado in Mexico. Fruits 2010, 65, 367–375. [Google Scholar] [CrossRef]
- USDA National Agricultural Statistics Service (USDA NASS). Quick Stats. Available online: https://quickstats.nass.usda.gov/ (accessed on 12 May 2022).
- González-Ramírez, M.G.; Santoyo-Cortés, V.H.; Arana-Coronado, J.J.; Muñoz-Rodríguez, M. The insertion of Mexico into the global value chain of berries. World Dev. Perspect. 2020, 20, 100240. [Google Scholar] [CrossRef]
- U.S. General Accounting Office (GAO). U.S.-Mexico Trade: Extent to Which Mexican Horticultural Exports Complement U.S. Production. GAO Brief. Rep. Chairm. Comm. Agric. House Represent. 1991, NSIAD-91-94BR, 10–30. [Google Scholar]
- Wu, F.; Guan, Z.; Whidden, A. An Overview of the US and Mexico Strawberry Industries. EDIS 2018, FE971, 1–4. [Google Scholar]
- Evans, E.A.; Ballen, F.H. An Overview of US Blueberry Production, Trade, and Consumption, with Special Reference to Florida. EDIS 2019, FE952, 1–8. [Google Scholar] [CrossRef]
- Osoyo, A.; Elms, R. Citrus Annual: Mexico. USDA Foreign Agric. Serv. Rep. 2020, MX2020-0075, 1–14. [Google Scholar]
- Li, S.; Wu, F.; Duan, Y.; Singerman, A.; Guan, Z. Citrus greening: Management strategies and their economic impact. HortScience 2020, 55, 604–612. [Google Scholar] [CrossRef]
- Espinoza-Arellano, J.d.J.; Fuller, S.; Malaga, J. Analysis of forces affecting competitive position of Mexico in supplying US winter melon market. Int. Food Agribus. Manag. Rev. 1998, 1, 495–507. [Google Scholar] [CrossRef]
- USDA National Agriculutral Statistics Service (USDA NASS). Vegetables Usual Planting and Harvesting Dates. Agric. Handb. 2007, 507, 42–86. [Google Scholar]
- Blue Book Services. Know Your Commodity Guide: Chile Peppers. Available online: https://www.producebluebook.com/know-your-commodity/chile-peppers/ (accessed on 1 July 2022).
- Lighthizer, R.E.; Ross, W.L., Jr.; Perdue, S. Report on Seasonal and Perishable Products in U.S. Commerce. Off. United States Trade Represent. Rep. 2020, 2020, 1–27. [Google Scholar]
- Zahniser, S.; Angadjivand, S.; Hertz, T.; Kuberka, L.; Santos, A. NAFTA at 20: North America’s free trade area and its impact on agriculture. A Rep. USDA Econ. Res. Serv. 2015, WRS-15-01, 1–7. [Google Scholar]
- Organisation for Economic Co-operation and Development (OECD). Exchange Rates: National Currency Units/US Dollars. Available online: https://data.oecd.org/conversion/exchange-rates.htm (accessed on 1 March 2022).
- Escalante, C.L.; Luo, T. Sustaining a healthy farm labor force: Issues for policy consideration. Choices 2017, 32, 1–9. [Google Scholar]
- Richards, T.J. Immigration reform and farm labor markets. Am. J. Agric. Econ. 2018, 100, 1050–1071. [Google Scholar] [CrossRef]
- Roka, F.M.; Guan, Z. Farm labor management trends in Florida, USA-challenges and opportunities. Int. J. Agric. Manag. 2018, 7, 79–87. [Google Scholar] [CrossRef]
- Wei, X.; Önel, G.; Guan, Z.; Roka, F. Substitution between immigrant and native farmworkers in the United States: Does legal status matter? IZA J. Dev. Migr. 2019, 10, 1–27. [Google Scholar] [CrossRef]
- Qushim, B.; Guan, Z.; Roka, F. The H-2A Program and Immigration Reform in the United States. EDIS 2018, FE1029, 1–5. [Google Scholar] [CrossRef]
- U.S. Department of Labor Office of Foreign Labor Certification (DOL OFLC). OFLC Programs and Disclosures. Available online: https://www.dol.gov/agencies/eta/foreign-labor/performance (accessed on 1 September 2022).
- Roka, F.M.; Simnitt, S.; Farnsworth, D. Pre-employment costs associated with H-2A agricultural workers and the effects of the ‘60-minute rule’. Int. Food Agribus. Manag. Rev. 2017, 20, 335–346. [Google Scholar] [CrossRef]
- Luckstead, J.; Devadoss, S. The Importance of H-2A Guest Workers in Agriculture. Choices 2019, 34, 1–8. [Google Scholar] [CrossRef]
- Bier, D. H-2A Visas for Agriculture: The Complex Process for Farmers to Hire Agricultural Guest Workers. Cato Inst. Immigr. Res. Policy Brief 2020, 17, 1–36. [Google Scholar]
- Charlton, D.; Castillo, M. Potential Impacts of a Pandemic on the US Farm Labor Market. Appl. Econ. Perspect. Policy 2020, 43, 39–57. [Google Scholar] [CrossRef]
- Farnsworth, D.U.S. COVID-19 Policy Affecting Agricultural Labor. Choices 2020, 35, 1–6. [Google Scholar] [CrossRef]
- Wu, F.; Guan, Z.; Garcia-Nazariega, M. Comparison of Labor Costs between Florida and Mexican Strawberry Industries. EDIS 2017, FE1023, 1–5. [Google Scholar] [CrossRef]
- USDA National Agricultural Statistics Service (NASS). Farm Labor (March 2022). Available online: https://www.ers.usda.gov/topics/farm-economy/farm-labor/ (accessed on 3 October 2022).
- Data México. Workers in Farming Activities. Available online: https://datamexico.org/en/profile/occupation/trabajadores-en-actividades-agricolas-y-ganaderas?growthSalary=salaryOption&quarters5=20204&quarters6=20204 (accessed on 1 July 2022).
- Wu, F.; Soto-Caro, A.; Guan, Z. Government Support in Mexican Agriculture: The Agri-Food Productivity and Competitiveness Program. EDIS 2021, FE1107, 1–7. [Google Scholar] [CrossRef]
- Wu, F.; Qushim, B.; Calle, M.; Guan, Z. Government Support in Mexican Agriculture. Choices 2018, 33, 1–11. [Google Scholar] [CrossRef]
- Guan, Z.; Biswas, T.; Wu, F. The US Tomato Industry: An Overview of Production and Trade. EDIS 2018, FE1027, 1–4. [Google Scholar]
- Pratt, L.; Ortega, J.M. Protected agriculture in Mexico: Building the methodology for the first certified agricultural green bond. Inter-Ameriacn Dev. Bank Tech. Note 2019, IDB-TN-1668, 13–25. [Google Scholar] [CrossRef]
- Servicio de Información Agroalimentaria y Pesquera (SIAP). Anuario Estadístico de la Producción Agrícola (Statistical Yearbook of Agricultural Production). Available online: https://nube.siap.gob.mx/cierreagricola/ (accessed on 10 October 2022).
- Office of the United States Trade Representative (USTR). United States-Mexico-Canada Trade Fact Sheet. Available online: https://ustr.gov/trade-agreements/free-trade-agreements/united-states-mexico-canada-agreement/fact-sheets/strengthening (accessed on 10 October 2022).


| Year | Avocado | Raspberry | Strawberry | Blueberry | Citrus | Watermelon | Tomato | Pepper | Cucumber | Squash |
|---|---|---|---|---|---|---|---|---|---|---|
| 2000 | 17 (19) | 25 (65) | 96 (90) | 0 (0) | 53 (26) | 93 (94) | 81 (64) | 100 (100) | 90 (85) | 98 (99) |
| 2001 | 17 (22) | 21 (47) | 98 (95) | 0 (0) | 55 (31) | 92 (93) | 82 (67) | 100 (99) | 87 (83) | 97 (99) |
| 2002 | 23 (29) | 29 (51) | 97 (95) | 0 (0) | 62 (33) | 90 (87) | 84 (69) | 100 (100) | 85 (81) | 97 (99) |
| 2003 | 25 (33) | 34 (60) | 98 (96) | 0 (0) | 57 (31) | 88 (91) | 84 (73) | 98 (94) | 85 (80) | 94 (97) |
| 2004 | 27 (38) | 36 (59) | 99 (98) | 0 (0) | 64 (45) | 86 (91) | 84 (71) | 97 (94) | 78 (80) | 92 (96) |
| 2005 | 51 (67) | 33 (56) | 99 (98) | 0 (0) | 63 (39) | 84 (90) | 84 (73) | 100 (99) | 79 (77) | 92 (95) |
| 2006 | 57 (73) | 50 (73) | 99 (99) | 0 (0) | 62 (38) | 86 (87) | 85 (74) | 99 (99) | 82 (78) | 92 (96) |
| 2007 | 63 (80) | 61 (79) | 99 (99) | 0 (0) | 60 (39) | 86 (89) | 89 (79) | 99 (98) | 83 (80) | 93 (96) |
| 2008 | 74 (86) | 75 (81) | 99 (99) | 0 (0) | 65 (43) | 90 (94) | 88 (80) | 85 (70) | 83 (72) | 94 (96) |
| 2009 | 70 (81) | 87 (91) | 99 (99) | 1 (1) | 64 (40) | 86 (93) | 88 (80) | 83 (68) | 83 (71) | 95 (96) |
| 2010 | 77 (85) | 93 (97) | 100 (99) | 1 (2) | 61 (41) | 89 (94) | 90 (83) | 84 (67) | 85 (71) | 96 (97) |
| 2011 | 77 (84) | 95 (98) | 100 (99) | 2 (3) | 60 (43) | 89 (90) | 89 (85) | 84 (67) | 80 (65) | 95 (96) |
| 2012 | 86 (89) | 96 (99) | 100 (100) | 4 (7) | 63 (42) | 87 (91) | 90 (85) | 85 (72) | 81 (72) | 96 (97) |
| 2013 | 89 (91) | 95 (99) | 100 (100) | 5 (8) | 64 (41) | 89 (92) | 90 (83) | 85 (72) | 79 (70) | 95 (96) |
| 2014 | 83 (85) | 96 (99) | 100 (100) | 8 (14) | 63 (47) | 87 (88) | 90 (84) | 84 (73) | 81 (73) | 94 (96) |
| 2015 | 93 (93) | 99 (100) | 99 (99) | 9 (21) | 61 (40) | 88 (89) | 91 (86) | 83 (69) | 81 (72) | 94 (95) |
| 2016 | 91 (92) | 98 (99) | 99 (99) | 11 (18) | 62 (46) | 84 (83) | 91 (87) | 83 (73) | 79 (70) | 95 (96) |
| 2017 | 86 (88) | 99 (100) | 99 (99) | 17 (26) | 61 (44) | 83 (81) | 90 (85) | 85 (71) | 80 (68) | 94 (95) |
| 2018 | 87 (88) | 99 (100) | 99 (99) | 18 (26) | 55 (42) | 83 (82) | 91 (87) | 86 (73) | 80 (67) | 95 (96) |
| 2019 | 88 (89) | 99 (100) | 99 (99) | 19 (23) | 58 (44) | 87 (84) | 91 (85) | 85 (73) | 80 (67) | 95 (96) |
| 2020 | 90 (91) | 99 (100) | 99 (99) | 23 (28) | 56 (38) | 85 (83) | 91 (85) | 84 (73) | 79 (66) | 96 (97) |
Publisher’s Note: MDPI stays neutral with regard to jurisdictional claims in published maps and institutional affiliations. |
© 2022 by the authors. Licensee MDPI, Basel, Switzerland. This article is an open access article distributed under the terms and conditions of the Creative Commons Attribution (CC BY) license (https://creativecommons.org/licenses/by/4.0/).
Share and Cite
Huang, K.-M.; Guan, Z.; Hammami, A. The U.S. Fresh Fruit and Vegetable Industry: An Overview of Production and Trade. Agriculture 2022, 12, 1719. https://doi.org/10.3390/agriculture12101719
Huang K-M, Guan Z, Hammami A. The U.S. Fresh Fruit and Vegetable Industry: An Overview of Production and Trade. Agriculture. 2022; 12(10):1719. https://doi.org/10.3390/agriculture12101719
Chicago/Turabian StyleHuang, Kuan-Ming, Zhengfei Guan, and AbdelMalek Hammami. 2022. "The U.S. Fresh Fruit and Vegetable Industry: An Overview of Production and Trade" Agriculture 12, no. 10: 1719. https://doi.org/10.3390/agriculture12101719
APA StyleHuang, K.-M., Guan, Z., & Hammami, A. (2022). The U.S. Fresh Fruit and Vegetable Industry: An Overview of Production and Trade. Agriculture, 12(10), 1719. https://doi.org/10.3390/agriculture12101719