Article

Traditional and Conditional QTL Analysis of Kernel Size- and Shape-Related Traits in Wheat (Triticum aestivum L.)

1
Chengdu Institute of Biology, Chinese Academy of Sciences, Chengdu 610041, China
2
University of Chinese Academy of Sciences, Beijing 100049, China
3
The Innovative Academy of Seed Design, Chinese Academy of Sciences, Beijing 100101, China
*
Authors to whom correspondence should be addressed.
Agriculture 2022, 12(10), 1718; https://doi.org/10.3390/agriculture12101718
Submission received: 17 September 2022 / Revised: 8 October 2022 / Accepted: 15 October 2022 / Published: 18 October 2022
(This article belongs to the Special Issue Molecular Markers and Marker-Assisted Breeding in Wheat)

Abstract

:
Optimal kernel size and shape were critical in improving the wheat yield potential and processing quality. A traditional and conditional QTL analysis for kernel-related traits was performed using 152 recombinant inbred lines derived from a cross between Zhongkemai 138 (ZKM138) and Kechengmai 2, whose kernel size showed significant differences. A total of 48 traditional QTLs (LOD: 3.69–14.20) were identified, with twenty-six QTLs distributed across five genomic regions. Each had at least one major stable QTL for kernel-related traits. We deduced from the co-location and conditional QTL analysis results that R3D and R4B.1 primarily controlled kernel shape, while R4D, R6A, and R6D2 primarily contributed to kernel size and the final thousand-kernel weight, potentially providing the genetic basis for the ZKM138’s high TKW and large-kernel performance. R4D may be involved with Rht2, and the possible regulatory effects of the other four QTL clusters are more likely to be influenced by unknown genes. The KASP markers validated their effect on kernel-related traits, and they were used to analyze the transmissibility and distribution of superior genotypes in ZKM138 derivatives and global wheat cultivars, respectively. These findings may serve as a reference for future genetic improvement of the ideal kernel morphology.

1. Introduction

Wheat (Triticum aestivum L.) is one of the world’s most important crops, accounting for 20% of global calorie and protein consumption (FAO, http://www.fao.org/faostat/ (accessed on 1 May 2022)). According to the prediction, a continuous increase of at least 60% in wheat production is still required to meet the rising population’s demand by 2050 [1]. As a result, wheat breeders face a significant challenge in constantly increasing yield potential, particularly by introducing superior genes to genetically improve critical yield-related traits.
Because of its relatively higher heritability, thousand-kernel weight (TKW), one of three well-known yield components, is also one of the most important selection criteria for high-yield genetic improvement during the early stages of breeding [2]. Globally, it increased by about 2.19 g per decade during wheat varietal improvement from 1940 to 2000, playing an important role in yield increase [3]. TKW itself is also composed of several sub-components and has a strong correlation with kernel dimensions such as kernel length (KL), kernel width (KW), and kernel diameter (KD) [4,5,6,7,8,9,10].
Increases in these kernel morphological parameters can promote kernel size and seed sink capacity, as well as seeding vigor, and thus promote final yield potential [11,12], which may be supported by a common genetic basis with weight traits. Several TKW-related genes have been discovered to regulate these parameters. TaGS5-3A, for example, was shown to be a positive regulator of three kernel size components (KL, KW, and KD) and could increase kernel size to obtain higher kernel weight [13]. Additionally, as comprehensive and complex quantitative traits, TKW-related QTLs are also frequently co-located with kernel morphology-related QTLs [14]. Thus, the close relationship between final kernel weight performance and its kernel sub-components is supported by this common genetic basis. These genetic loci, however, do not always affect TKW by regulating all kernel parameters. TaGW2, a well-known TKW-regulating gene, has been found to primarily affect KW [15], while TaGASR7-A1 [16] and TaGS-D1 [17] have been shown to mainly have a significant effect on kernel length and weight. Additionally, the regulation of a single seed parameter will generally results in the variation of kernel shape characteristics such as the ratio of KL to KW (LWR) and kernel roundness (KRD), which are commonly used parameters describing kernel shape.
Kernel shape influences not only yield performance but also quality characteristics such as milling and breaking quality [18]. Previous research has found that large, spherical grains are better for milling [5,19,20]. Furthermore, the kernel length was found to have a negative relationship with the test weight [21], which is a key indicator in wheat grading and is used to evaluate the commercial value of wheat [22,23], and thus influence how grains pack [24]. As a result of the association of kernel morphological parameters with both yield-related traits (such as TKW) and quality-related traits (such as milling rate), artificial selection for kernel-related traits (KRTs), particularly in early generations using marker-assisted selection (MAS), may contribute to yield and end-use quality improvement in wheat breeding programs.
With the advancement of wheat genome research, multiple molecular markers for wheat genetic mapping and molecular breeding have been developed, including the early RFLP, EST, and SSR markers and the current widely used SNP markers. Several wheat SNP arrays, such as 660K, 90K, 55K, 50K, and so on [14,25,26,27,28,29], have been developed to efficiently construct high density genetic maps and identify crucial QTLs. These SNP-linked loci generally need to be transferred as KASP or CAPS markers to be more easily validated and applied in common labs, which have been of great assistance in wheat genetic improvement. Until now, kernel-related QTLs have been extensively studied and discovered across all 21 wheat chromosomes [4,5,6,7,8,9,10,14,30]. Because of the tight correlation between these KRTs, co-location was very common but not always, indicating the existence of loci for controlling only one or several specific traits. As a result, it inspires us to use these loci, which control only a single or few seed traits, for targeted selection and genetic improvement of ideal kernel morphology with optimum kernel size and shape, even without affecting grain weight performance, in order to obtain better commercial wheat grains. This is due to the need to clarify the specific contribution of each locus to different grain traits and final grain weight, which generally necessitates specific validation of the gene function following cloning.
The reason–cause conditional QTL analysis can characterize the contribution of each relevant trait to the expression of a single QTL, which can provide valuable information for gene function prediction and candidate gene screening, as well as dissect the relationship of multiple related traits at the individual QTL level in advance [6,31,32,33,34,35,36].
Based on a genetic linkage map constructed using the Wheat55K SNP array, a recombinant inbred line (RIL) population derived from two parents with a significant difference in kernel performance was used to detect traditional and conditional QTL analysis for kernel-related traits [29]. The following were the primary goals: (1) identifying stable and robust QTL controlling kernel-related traits; (2) analyzing the critical genetic basis underlying the contribution of kernel components to kernel size shape at the QTL level; (3) providing molecular markers to efficiently track the target loci for fine mapping and molecular breeding.

2. Materials and Methods

2.1. Plant Materials and Field Trials

An F6:7 recombinant inbred line (RIL) population of 152 lines derived from a cross between varieties Zhongkemai 138 (ZKM138) and Kechengmai 2 (KC2) (indicated as ZK-RILs) was used in this study to investigate the genetic basis of kernel-related traits. ZKM138 was a high TKW and large-kernel variety. The significant difference in kernel characteristics between parents (Figure 1) could be attributed to the different genetic background.
ZK-RILs and their parents were evaluated in a total of eight environments (year location) in Chengdu and Deyang in 2016–2017, 2017–2018, 2018–2019, and 2019–2020, and designated as E1, E2, E3, E4, E5, E6, E7, and E8, respectively. For each of the eight environments, the materials were planted in two replicated blocks. Each block had two rows that were 1.5–2 m long and 0.25 m apart, with 20–40 seeds planted evenly in each row. In each of the trials, all of the recommended agronomic practices were implemented.

2.2. Phenotypic Evaluation and Statistical Analysis

In this study, nine kernel-related traits were evaluated: thousand-grain weight (TKW), kernel length (KL), kernel width (KW), kernel diameter (KD), kernel surface area (KA), kernel perimeter (KP), the ratio of KL to KW (LWR), kernel roundness (KRD), and the form-density factor (FFD). At physiological maturity, three to six representative plants in the center of the rows were randomly sampled in each block for phenotypic evaluation. KL, KW, KD, KA, KP, KRD, and TKW were evaluated using the WSeen SC-G Instrument Analysis System (Zhejiang, China). LWR = KL/KW was used to calculate the kernel length-width ratio (LWR). To describe variations in grain structure (density) and shape deviation from a cylindrical form, the form-density factor (FFD) was calculated as FFD = TKW/(KL × KW) [37]. KL, KW, and KD, three basic components for kernel size and shape, were designated as kernel components (KCs) in this study; two traits, KA and KP, representing kernel size, were designated as kernel size related traits (KSizeRTs); and three parameters describing kernel shape, LWR, KRD, and FFD, were designated as kernel shape-related traits (KShapeRTs).
GenStat 19th software was used to perform statistical analysis on the set of predicted genotype means (Best Linear Unbiased Predictors, BLUP) for all measured traits (VSN International, Hemel Hempstead, UK). For further analysis, nine datasets were used, including E1-E8 data and BLUP data (B). Pearson correlation was used to analyze the relationship between the traits, and the results were presented using TBtools [38].

2.3. QTL Analysis

The software QGAStation 2.0 [31] (http://ibi.zju.edu.cn/software/qga/ (accessed on 1 March 2021)) was used to calculate the conditional phenotypic values T1|T2, where T1|T2 indicated that the net genetic variation of T1 was independent of T2, e.g., KA|KW: kernel surface area being conditioned on kernel width, indicating that the effect of KW on KA was removed. In order to discuss the contributions of three basic kernel components (KL, KW and KD) to kernel size (KA and KP) and shape (LWR, KRD and FFD), 15 conditional phenotype value data of KSizeRTs|KCs (KA|KL, KA|KW, KA|KD, KP|KL, KP|KW and KP|KD) and KShapeRTs|KCs (LWR|KL, LWR|KW, LWR|KD, KRD|KL, KRD|KW, KRD|KD, FFD|KL, FFD|KW and FFD|KD) were calculated and used to conditional QTL analysis in this study. The measured and the conditional phenotype values were used for QTL analysis which were designated as traditional QTL analysis and conditional QTL analysis, respectively.
The genetic map of ZK-RILs used in this study to detect the QTL was built using 11,454 SNP markers from the Wheat55K SNP array and 15 KASP markers. This origin map contained 11,469 loci in total. In this study, 1471 markers were chosen to represent each bin and were used for QTL mapping. The current map spans 2154.65 cM and has an average density of one marker per 1.46 cM across 27 linkages on 21 chromosomes (chromosomes 1D, 3A and 6D contained three linkages). The previous study provided additional information in detail of this map [29].
The traditional phenotype values of KCs (KL, KW, and KD), KSizeRTs (KA and KP), and KShapeRTs (LWR, KRD, and FFD), as well as the conditional phenotype values for KSizeRTs|KCs and KShapeRTs|KCs in all datasets, were used to detect QTL by inclusive composite interval mapping (ICIM) performed by IciMapping 4.1 [39] The walking speed for all QTL was set to 1.0 cM, and the p-value inclusion threshold was set to 0.001. After 1000 permutation tests (p = 0.05), the LOD score of 3.42 was selected to declare the presence of a putative QTL. Furthermore, the major QTL was defined as a QTL with a LOD value greater than 5.0 and a phenotypic variance contribution greater than 10% (on average); the stable QTL was defined as a QTL that could be detected in at least three environments. QTL sharing the confidence interval were considered to be a “cosegregation” QTL in the clustered genomic region among different traits.

2.4. Development of Kompetitive Allele-Specific PCR (KASP) Markers

KASP markers (Table S1) were developed on websites https://galaxy.triticeaetoolbox.org/ (accessed on 1 May 2022) to validate the target loci in this study, based on the SNP information from the comparison of the re-sequencing data (data not shown) of ZKM138 and KCM2. The SNP information, including position and polymorphism between these two parents were collected to develop markers. Primer synthesis was conducted by Tsingke Biotechnology Co., Ltd. (Chengdu, China, https://tsingke.com.cn/ (accessed on 1 March 2021)). The amplification for KASP markers were carried out with KASP-TF V4.0 2× Master Mix (LGC Genomics, Hoddeson, UK) according to the manufacturer’s instructions. The reaction conditions and systems of the polymerase chain reaction (PCR) system were conducted according to a previous report [40].

3. Results

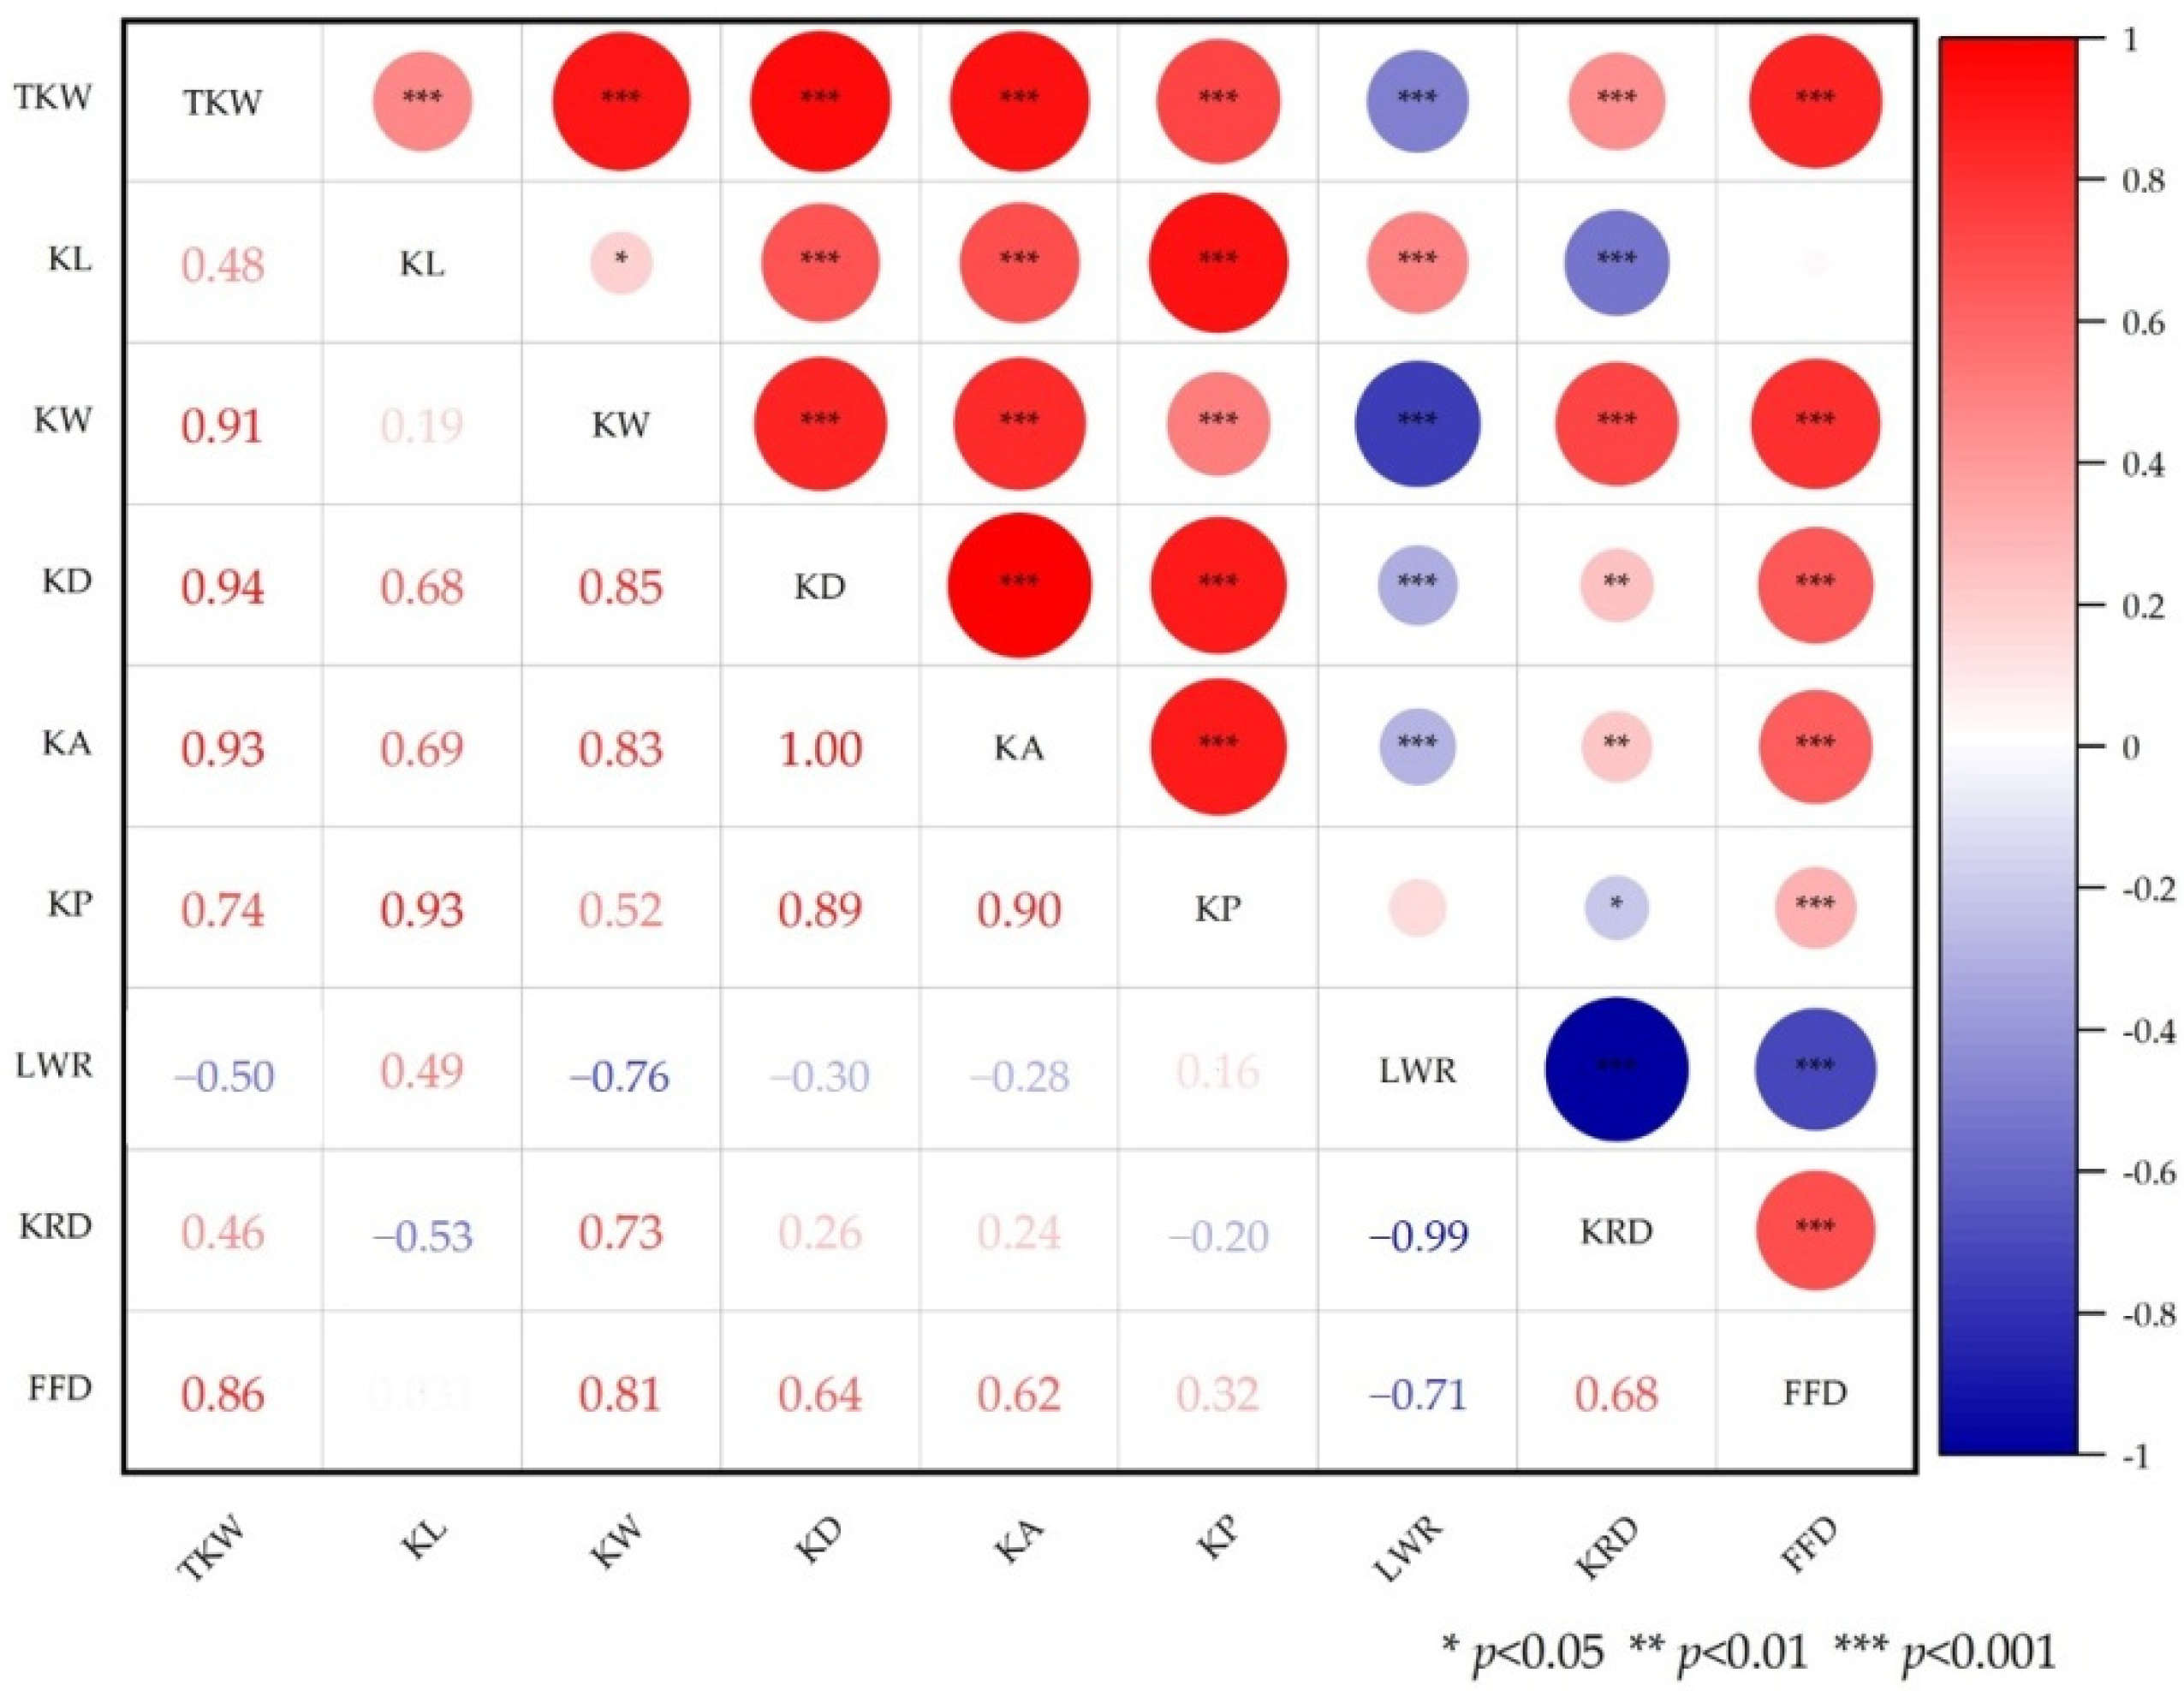
3.1. Phenotypic Evaluation and Correlation Analysis

In all environments, ZKM138 performed significantly bigger kernel components (KL, KW and KD) and kernel size (KA and KP) than those of KCM2 as expected, while it showed relatively similar LWR and KRD with KCM2, indicating that two parents produced obvious differences in kernel size but similar kernel shape (Figure 1; Table S2). In the ZK-RIL population (Figure 2, Table S2), all kernel-related traits exhibited approximately continuous variation and transgressive segregation in both high and low sides, indicating that alleles with positive effects were contributed by both parents. Additionally, the absolute values of skewness and kurtosis were almost <1 (Table S2), indicating that the phenotypic data were approximately normally distributed in this population. Heritability ranged from 60.92 to 87.87% (Table S2), indicating the genetic factors were the major controllers for these traits.
The correlation among these kernel-related traits and their connection with TKW were presented in Figure 2. Three KCs were found to have a positive correlation with one another. KW, on the other hand, had a significantly higher correlation coefficient with KD (r = 0.85, p < 0.001) and a relatively lower correlation coefficient with KL (r = 0.19, p < 0.05), indicating a possible genetic basis for distinct kernel dimensional formation. For these KSizeRTs or KShapeRTs, they also performed the significant correlation between each other. Among them, FFD was positively correlated with KRD (r = 0.68) but negatively correlated with LWR (r = −0.71).
For the correlation between KCs and KSizeRTs, the obvious stronger connection between KL and KP (r = 0.93) as well as between KD and KA (r = 1.00) was observed than other pairwise traits, implying that KL and KD might have a significant contribution to KP and KA, respectively. For the correlation between KCs and KShapeRTs, the more significant correlation between KW and the KShapeRTs (LWR, KRD and FFD) was observed (r = −0.76 for KW-LWR, 0.73 for KW-KRD and 0.81 for KW-FFD) than KL- or KD-KShapeRTs. It was indicated that KW might affect kernel shape more, while KL and KD seemed to have higher impact on kernel size in this population. Additionally, the relatively low correlation coefficients between KSizeRTs and KShapeRTs were noticed, indicating their possible independent genetic basis.
Furthermore, with the exception of LWR, all of the other seven kernel traits showed a positive correlation with final TKW. TKW-KD (r = 0.94) and TKW-KW (r = 0.91) correlation coefficients were clearly higher than TKW-KL (r = 0.48), indicating that KD or KW contributed more to TKW formation than KL and that the regulating systems of these three KCs on TKW were also possibly relatively independent. Among the KSizeRTs, KA had a higher correlation coefficient with TKW than KP, and among the KShapeRTs, FFD had the highest correlation coefficient with TKW, suggesting that they might be the most important predictive parameters for TKW.

3.2. Traditional QTL Analysis

For traditional QTL detection, a total of 48 QTLs for the eight kernel characteristics (Table 1) were detected by IciMapping 4.1, distributed on 13 chromosomes, i.e., chromosomes 1A, 1B, 2A, 3B, 3D, 4A, 4B, 4D, 5D, 6A, 6D, 7A and 7B, with QTL phenotypic variations ranging from 4.53% to 14.77% and a LOD value of 3.69–14.20. Among these 48 QTLs, 20 could be detected at least three different environments and thus were stable QTLs. A total of 17 QTLs were major QTL, and 14 of them were major stable QTLs.

3.2.1. The Traditional QTL for Kernel Components (KCs)

Fourteen traditional QTL for three KCs were identified in this study (four for KL, five for KW and six for KD), and six and ten of them were major and stable QTL, respectively (Table 1). Among them, two stable QTL for KL, QKl.cib-3D and QKl.cib-6D2 explained 12.38% and 10.21% of the KL variation, with a LOD value of 8.14 and 6.86, respectively, and thus were major and stable QTLs (defined as major stable QTL). At both of these loci, ZKM138-derived alleles had favorable effect on all the corresponding KCs. For KW, two major stable QTLs (QKw.cib-4B and QKw.cib-4D) explained 11.77% and 13.88% of the KW variation, with a LOD value of 6.72 and 7.32, respectively. The ZKM138-derived alleles increased KW at the locus of QKw.cib-4D while decreasing KW at the locus of QKw.cib-4B. The major stable QTLs for KD, QKd.cib-4D and QKd.cib-6A, could be repeatedly identified in all datasets, with the PVE of 11.62% and 11.82% and LOD value of 5.29 and 6.28, respectively. At these two loci, the superior alleles increasing KD were both contributed by the large-kernel parent, ZKM138. Additionally, it is noticeable that the major stable QTL QKd.cib-6A were co-located with two stable QTLs for KL and KW (QKl.cib-6A and QKw.cib-6A.2) in the AX-110955892—AX-110396610 interval on chromosome 6A. Additionally, in the region around Rht2 on chromosome 4D, two major stable QTLs for KW and KD, QKw.cib-4D and QKd.cib-4D, were clustered. At these both loci, ZKM138-derived alleles had favorable effect on all the corresponding KCs.

3.2.2. The Traditional QTL for Kernel Size Related Traits (KSzieRTs)

Ten QTLs were identified for KA and KP, including two major QTLs and six stable QTLs (Table 1). For KA, two major stable QTLs and three minor QTLs were detected, while four identified QTLs for KP were all stable QTL. Among them, besides QKp.cib-4D and QKp.cib-6A, two clustered with QKa.cib-4D and QKa.cib-6A, respectively, as well as QKp.cib-6D2, which could be stably significant in six datasets, all had the superior alleles increasing KP being derived from ZKM138. In addition, another stable QTL for KP, QKp.cib-3D, harbored the superior alleles from KCM2.

3.2.3. The Traditional QTL for Kernel Shape-Related Traits (KShapeRTs)

In total, 25 QTLs were detected for three KShapeRTs (8 for LWR, 10 for KRD and 7 for FFD) (Table 1). The clusters on chromosomes 4B and 4D harbored loci simultaneously affecting LWR, KRD and FFD, and the involved six QTLs (QLwr.cib-4B.1, QLwr.cib-4D, QKrd.cib-4B.1, QKrd.cib-4D.1, QFfd.cib-4B and QFfd.cib-4D) were all major stable QTLs. The ZKM138-derived alleles could increase LWR but decrease KRD and FFD at the locus on 4B, while decreasing LWR but increasing KRD and FFD at the locus on 4D. Additionally, besides two loci on 4B and 4D, another three out of eight QTLs for LWR were also co-located with QTLs for KRD, including another loci which clustered two major stable QTLs on chromosome 3D (QLwr.cib-3D and QKrd.cib-3D), and the alleles presented the opposite effect on these two traits.

3.3. Conditional QTL Analysis

3.3.1. The Conditional QTL Mapping for KSizeRTs Independent of a Given KC

When the effect of KCs was removed, a total of 31 loci were found for two KSizeRTs, 13 for KP and 18 for KA (Table S3). Three of the thirteen and six of the eighteen loci were also detected by traditional QTL mapping (Table 2 and Table S3).
In particular, when KA was applied to all KCs, two traditional QTLs, QKa.cib-1A and QKa.cib-4A, were not detected, indicating that these two QTLs were most likely affected by all three kernel components. Only when the KL effect was removed could QKa.cib-4B and QKa.cib-4D be detected, corresponding to Locus 2 and 3 (Table S3), respectively, indicating that they were primarily contributed by KW and KD. Furthermore, only when the influence of KW on KA was not considered could QKa.cib-6A only be detected, corresponding to Locus 4 (Table S3), with its additive effect being decreased by 57.60%, indicating that QKa.cib-6A was mainly controlled by KL and KD, and also moderately contributed by KW. Furthermore, the remaining ten loci identified by conditional QTL mapping for KA were newly discovered, indicating that they might be repressed by KCs (Table S3).
For KP, QKp.cib-3D, corresponding to Locus 14, 22 and 29 in Table S3, could be detected whatever the exclusion of any KCs. The change percentage, however, was different; that is, the magnitude of the change was KL > KD > KW, implying that KL is the most likely contributor to KP formation at this locus. When the KW and KD effects were eliminated, QKp.cib-4D could not be identified. Both QKp.cib-6A and QKp.cib-6D2 could be detected only when KP was conditioned on KW (Locus 25 and 26), but the additive effect of QKp.cib-6D2 was similar, indicating that KL and KD were the major contributors for KP constituted at both loci, and that KW partially affected KP at the locus of QKp.cib-6A but had almost no influence on KP at the locus of QKp.cib-6D2. The corresponding KCs may suppress the other 12 newly discovered loci by conditional QTL mapping (Table S3).

3.3.2. The Conditional QTL Mapping for KShapeRTs Independent of a Given KC

When the effect of KCs was removed, a total of 58 loci were identified for three KShapeRTs, 20 for LWR, 23 for KRD, and 15 for FFD (Table 2 and Table S3). Additionally, 67.24% (39/58) of these loci could be identified by traditional QTL mapping.
When LWR was conditioned on KCs, three QTLs, QLwr.cib-4B.2, QLwr.cib-4D, and QLwr.cib-7A, could no longer be detected. When the influence of KL and KW were both excluded, two major stable QTLs, QLwr.cib-3D (corresponding to Locus 33 and 37) and QLwr.cib-4B.1 (corresponding to Locus 39 and 47), and a minor QTL, QLwr.cib-6A (corresponding to Locus 42 and 49), could be detected, implying that individual KL or KW are not the full determinants of LWR at these three loci. However, KL and KW were the main controllers for QLwr.cib-2A (corresponding to Locus 32 and 43) and QLwr.cib-5D (corresponding to Locus 41), respectively.
When KRD was conditioned on any KC, QKrd.cib-4B.2, QKrd.cib-4D.2, QKrd.cib-5D.1, and QKrd.cib-5D.2 were not detected. When the influence of three KCs was excluded, QKrd.cib-3D and QKrd.cib-4B.1 could be identified, but the change percentage of additive effect was different. For QKrd.cib-3D, corresponding to Locus 52, 59 and 66 in Table S3, KW might be the primary controller, given the largest change range when KRD was independent of a given KW; and for QKrd.cib-4B.1, corresponding to Locus 53, 60 and 67 in Table S3, KL might be the primary contributor.
Only QFfd.cib-7B could not be detected when FFD was conditioned on KCs. The major stable QTLs, QFfd.cib-3B (corresponding to Locus 75 and 85), QFfd.cib-4B (corresponding to Locus 76 and 87) and QFfd.cib-4D (corresponding to Locus 77 and 88), and QFfd.cib-6A (corresponding to Locus 79), were most likely controlled by KD and KW, while QFfd.cib-2A (corresponding to Locus 80 and 84) was primarily contributed by KL.

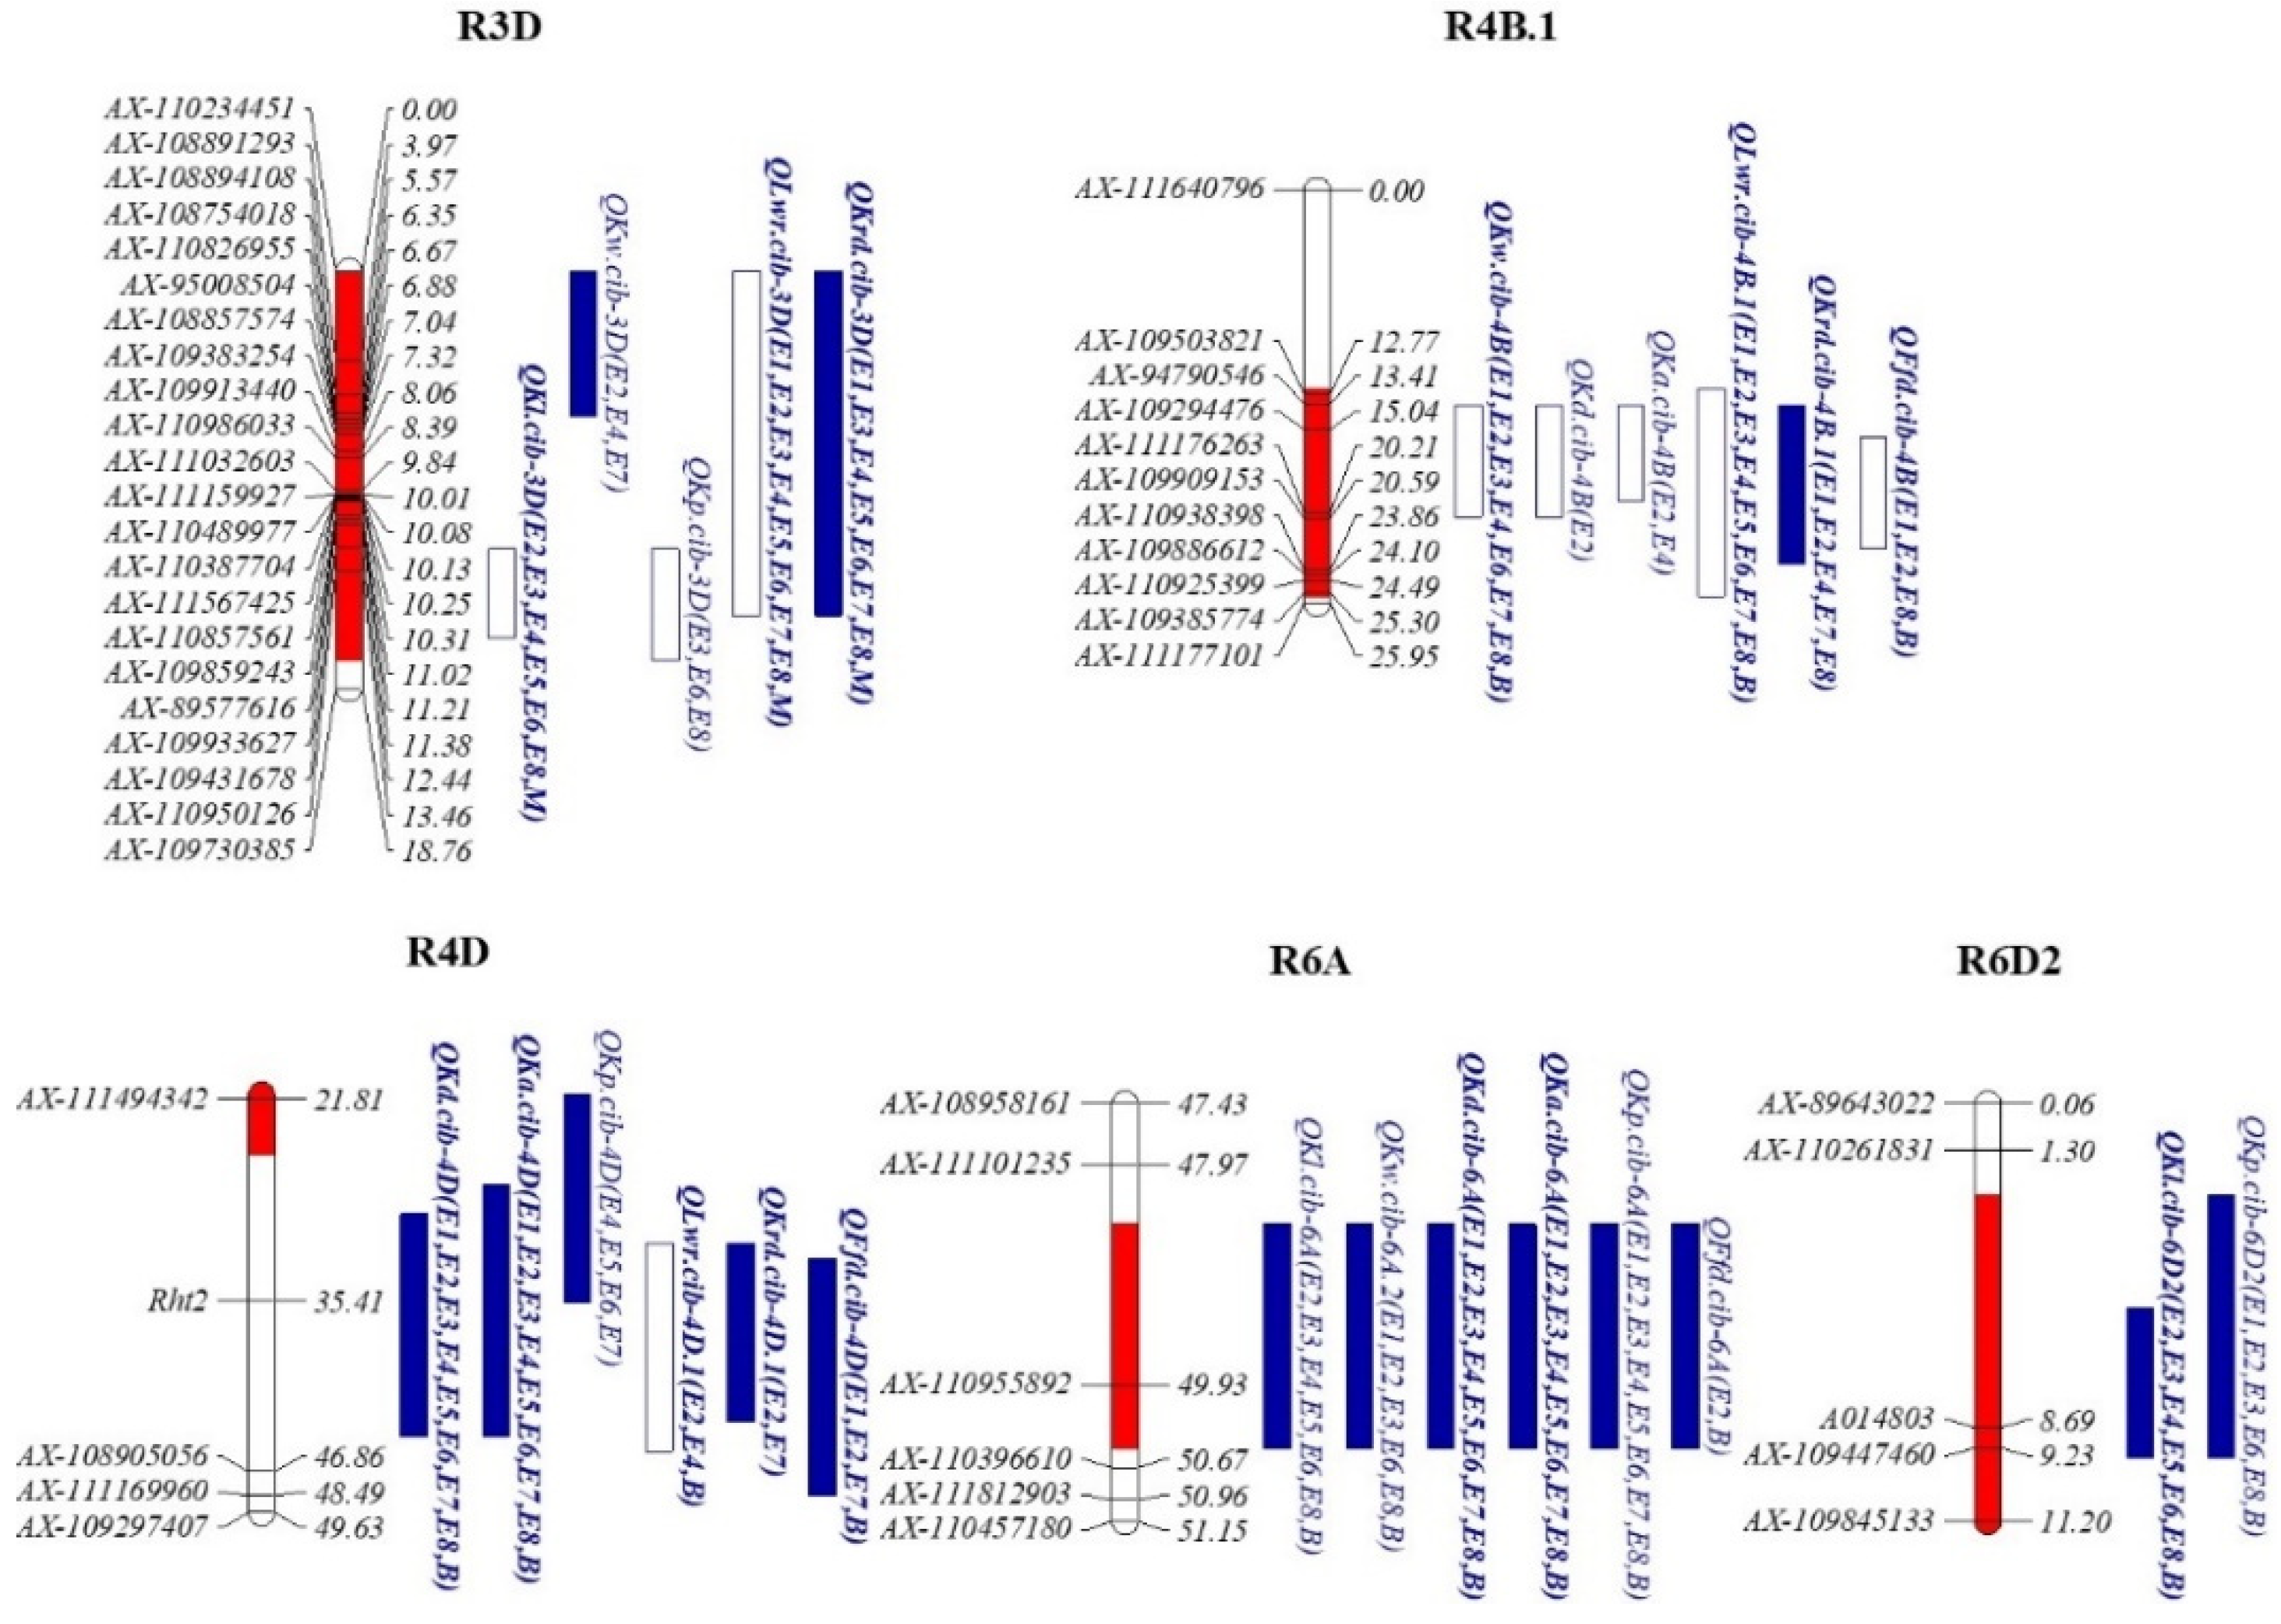
3.4. QTL Hot Regions for KRTs

According to the traditional QTL mapping results, 11 genomic regions on chromosomes 1A, 2D, 3B, 4A, 4B, 4D, 5D, 6A, and 6D had two or more QTLs (Figure 3; Table 3). Only five of them, R3D, R4B.1, R4D, R6A, and R6D2, involved 26 QTLs and each had at least one major stable QTL, possibly contributing more genetic controlling to the kernel characteristics.
R3D included two KC QTLs (QKl.cib-3D and QKw.cib-3D), one KSMT QTL (QKp.cib-3D), and two KMRT QTLs (QLwr.cib-3D and QKrd.cib-3D). It was noticeable that the positive additive effect of QKl.cib-3D and QKw.cib-3D in this region were derived from different parents, that is, ZKM138-derived alleles decreased KL but increased KW in this region; thus, the LWR and KRD were decreased and increased accordingly, indicating that this region may relate to the possible coordinated development of KL and KW, and thus, this region was the crucial genetic basis for kernel shape. The major stable QTL for KW (QKw.cib-4B) was also clustered with three major stable QTL for KShapeRTs (QLwr.cib-4B.1, QKrd.cib-4B.1, and QFfd.cib-4B) for R4B.1, and ZKM138-derived allele decreased KW and KRD. R4B.1, like R3D, is a critical region that primarily controls grain morphology. The difference is that R4B.1 may influence kernel morphology by regulating kernel width, whereas R3D may simultaneously control the balance of kernel length and width. R4D involved three major stable QTLs that were detectable in all datasets, including two KC QTLs (QKw.cib-4D and QKd.cib-4D) and one KA QTL (QKa.cib-4D). The superior alleles that stably increased kernel size were ZKM138-derived alleles.
The stable QTLs for R6A included all measured KCs (KL, KW, and KD) and KSRTs (KA and KP), including three QTLs that were significant across all datasets (QKd.cib-6A, QKa.cib-6A and QKp.cib-6A). QKd.cib-6A and QKa.cib-6A were major stable QTLs among them. Interestingly, ZKM138-derived alleles increased all of the corresponding traits in this region, which could explain ZKM138’s high TKW and large-kernel performance. Only the major stable QTL for KL (QKl.cib-6D2) and a stable QTL for KP (QKp.cib-6D2) were clustered for R6D2, which were detected in all nine and six datasets, respectively, and ZKM138-derived alleles also increased KL and KP, indicating that this region may regulate kernel size primarily through affect the kernel length.
In contrast to R3D and R4B.1, which contributed significantly to kernel shape, R4D, R6A, and R6D2 were more likely the regions that primarily controlled kernel size.

3.5. Validation of the Target Loci by Markers

Based on the candidate genomic information from the re-sequencing results for ZKM138 and KCM2, we developed the linked KASP markers (Table S1) KASP3D32 and KASP4B61 for R3D and R4B.1, respectively, to track the crucial region providing genetic basis to kernel characteristics. Additionally, according to previous reports, R6A may harbor a reported QTL for TKW [14], with KASP6A-2121 as its corresponding linked marker. We checked whether KASP3D32, KASP4B61, and KASP6A-2121 could be flanking markers or be located in the confidence interval of the QTLs after integrating them into the genetic map and re-QTL mapping for these measured traits. These five markers, when combined with the flanking markers of R4D and R6D2, namely Rht2 and KASP14803, were used to genotype the ZK-RILs and validate the effect of five crucial regions on the kernel traits.
According to Table 4, “A” genotype indicated the ZKM138-genotypes, and “B” genotype indicated the KCM2-genotypes. In R3D, lines with the KCM2-genotype had significantly longer and narrower kernels, as well as higher LWR than lines with the ZKM138-genotype. For R4B.1, lines with the KCM2-genotype had a wider kernel and a higher KRD than lines with the ZKM138-genotype. Additionally, there is no noticeable difference in TKW between two genotypes classified by two regions. However, when the genotypes were classified by three markers representing R4D, R6A, and R6D2, they showed a significant difference in TKW and almost kernel size traits, but no difference in kernel LWR and KRD, as expected. Additionally, ZKM138-genotypes showed the highest TKW and biggest kernel for all three regions.

3.6. The Transmissibility and Distribution of R3D, R4B.1 and R6D2

ZKM138 has been an important backbone parent during our lab’s breeding process and derived several varieties and stable lines. As previously stated, R3D, R4B.1, and R6D2 were three notable regions with stable robust and putative crucial kernel-related QTLs that were consistently detected across all environments, which more likely harbored unknown and also undiscussed genes for KRTs. The transmissibility of elite genotypes among 89 derivatives of ZKM138 (Table 5) was further analyzed using associated developed KASP markers to assess their potential for breeding selection.
As shown in Table 5, the R6D2 markers for kernel size and TKW had a high transmissibility of 96.51%, indicating that the elite contribution of ZKM138 to kernel traits was strongly passively selected during our breeding process. TKW was unaffected by two regions, R3D and R4B.1, which primarily affect kernel shape, with ZKM138-derived alleles possibly increasing and decreasing LWR, respectively. However, they had high transmissibility of 100% and 92.94%, respectively, indicating that these two regions might have no obvious negative effect on wheat, and could even be related to other undiscovered “concomitant” traits that might be the selective parameters during the artificial selection process, allowing them both to be screened and reserved in the derivatives with such a high percentage.
In addition, to further determine whether the distribution and application of the genotypes and their corresponding markers for R3D, R4B.1 and R6D2 in this study, we used these three markers (KASP3D32, KASP4B61, and KASP14803) to investigate the distribution of this genotype in 325 global wheat varieties (Table S4). Additionally, the “A” genotype varieties accounted for 65.90%, 59.21%, and 77.50% of the total (Table 5). These allele distribution results among these materials could be used as a reference in the future to select material used for genetic improvement of yield via MAS.

4. Discussion

A large number of QTL mapping studies for both kernel size- and shape-related traits have been conducted to determine the underlying genetic relationship between kernel morphology and kernel-dimension components at the QTL level [4,5,6,7,8,9,10]. In most studies, the genetic associations of two QTLs for pairwise correlated traits were determined primarily based on whether these QTLs were co-located [6]. The majority of co-located QTLs in this study also generally controlled the strongly related traits. The co-located loci for the well-known negatively correlated traits LWR and KRD, for example, were found in multiple genomic regions, including R2A, R3D, R4B.1, R4B.2, R4D, and R5D (Table 3), while the co-located loci for the strongly positively correlated KA and KD were found in R1A, R4A, R4B, R4D, and R6A. These co-located loci might provide strong support for the KA-KD (r = 1.00) and LWR-KRD (r = −0.99) correlations (Figure 2).
However, if based only on the co-location results, it was difficult to determine the precise and comprehensive correlation between these related traits [6,32]. The multivariate conditional analysis was proposed to dissect the contribution of the causal traits (here referred to as component traits) to a complex result trait and their relationship at the QTL level [41]. A comparison of traditional and conditional QTLs in this study enables us to understand the genetic control system between the kernel morphological traits and their related components at the individual QTL level. When performing conditional QTL analysis on KA conditioned on KL (KA|KL), for example, there were four possible outcomes: (1) a QTL detected by the traditional method could be identified with a similar or even equal additive effect, indicating that this QTL for KA expressed independently for the given trait KL; (2) a QTL detected by the traditional QTL mapping could be detected with either a greatly reduced or a greatly increased additive effect, suggesting that this QTL for KA was partially, but not completely, correlated with KL; (3) a traditional QTL detected could not be identified totally, indicating that this QTL for KA was entirely contributed by KL; (4) a new QTL determined significant by the conditional mapping, which means that the expression of the QTL for KA was completely suppressed by KL, and thus, the effects could only be identified by eliminating the influence of KL [6]. These kernel morphological traits were complex traits composed of sub-components and influenced primarily by their components. Given that QTLs for different KCs were frequently found to be co-located with these major stable QTLs for KSizeRTs and KShapeRTs in this study, the actual contribution of each causal trait to these interested loci was assessed using conditional QTL analysis in this study (Table 1, Table 3 and Table S3). We observed that almost the expression of all the major stable QTLs either for kernel size or for kernel shape were not simultaneously due to the variation in all the three KCs here, i.e., KL, KW and KD (Table 1, Table 3 and Table S3), indicating that the contribution of individual KCs was different for each QTL and might have distinguished controlling mechanisms. Even though QLwr.cib-3D and QKrd.cib-3D were co-located with QKl.cib-3D and QKw.cib-3D, it appeared that KL and KW were the major traits affecting kernel shape at this region. According to the conditional QTL analysis, we could see that QLwr.cib-3D was also completely contributed by KD (Table 2), which was not detected as a co-located QTL for KD here, implying that the conditional QTL analysis could provide more information to uncover the complex regulation among different traits at individual loci [6]. Unlike R3D, for R4B, another region mainly affecting kernel shape in this study, two QTLs for KW and KD, QKw.cib-4B and QKd.cib-4B, were clustered, and the less contribution of KL to kernel shape-related QTLs (QLwr.cib-4B.1, QKrd.cib-4B.1 and QFfd.cib-4B) were indeed observed by conditional analysis as expected (Table 2). However, there were still differences in three KShapeRTs QTLs; that is, the variation of KW were the only major contributor to the QLwr.cib-4B.1, QKrd.cib-4B.1, but KW and KD were two contributors to QFfd.cib-4B.
Similarly, for the three regions that primarily control kernel size, R4D, R6A, and R6D, we could deduce that KW and KD were the primary controllers for QKa.cib-4D and QKp.cib-4D, and that KL and KD primarily affected QKp.cib-6D2. Interestingly, even though all three KCs affected QKa.cib-6A and QKp.cib-6A in R6A, the contributions of KL and KD were greater than those of KW. Previous research at this locus found a major stable QTL for TKW (QTgw.cib-6A) and other stable QTLs for multiple KRTs, including KW, KL, KD, KA, and KP, using RILs derived from the public parent ZKM138 and Chuanmai44 (BC-RILs) [14]. When its flanking markers KASP6A-2121 were used to genotype both BC-RILs and ZK-RILS, the TKW and relative KRTs of ZKM138 genotypes were significantly higher than those of the other genotype (Table 4), indicating that they were consistent QTLs harboring the putative new genes, which has be demonstrated and discussed in the previous study [14]. In this study, we discovered that KL, rather than KW, contributed more to kernel size, in contrast to its nearby TaGW2 [15], which has a greater influence on KW and less influence on KL; thus, we provide new evidence and insight to aid in the cloning and functional research of this putative new gene.
In the long-term wheat selection and breeding process, the increase in kernel size was a main character of domestication syndrome [5,42,43], whereas kernel shape was a relatively recent breeding target because its influence on milling performance, such as flour quality and yield, was noticed later, and thus, it contributed equally to determining its market value [5]. As a result, a synergistic genetic improvement and optimization of kernel size and shape, i.e., the acquisition of an ideal kernel morphology, may confer wheat with a better overall performance in terms of yield and processing quality [19]. Three QTL clusters were identified that primarily controlled kernel size (R4D, R6A, and R6D2) and two QTL clusters that primarily affected kernel shape (R3D and R4B.1) in this study (Figure 3, Table 3). The superior alleles that increased kernel size and its sub-components for R4D, R6A, and R6D2 were all contributed by the high TKW and large-kernel parent, ZKM138, which might also explain ZKM138’s elite yield performance (Figure 1; Table S2). However, the alleles increasing kernel roundness for R3D and R4B.1, which more closely resemble the kernel performance of modern wheat varieties [5] were derived from ZKM138 and KCM2, respectively, which might also explain the similar kernel shape performance between the two parents (Figure 1, Table S2). Additionally, there were differences in the KCs affecting kernel shape in R3D and R4B.1, indicating that the increasing effect on KRD contributed by ZKM138 in R3D was achieved by decreasing KL while simultaneously increasing KW, whereas the increasing effect on KRD contributed by KCM2 in R4B.1 was achieved primarily by increasing KW, indicating the diversity of these genetic control mechanisms for kernel shape.
Previous studies have found that the genetic diversity present in ancestral wheat species has been reduced through natural evolution and artificial selection, with the long and thin kernel generally becoming wider and shorter in modern cultivars [5]. According to previous opinions, KW contributed more to kernel size and TKW than KL and thus should be improved in accordance with practical wheat breeding [6], which was also consistent with our correlation analysis result (Figure 2), where TKW-KW had a higher correlation coefficient (r = 0.91) than TKW-KL (0.48). Nonetheless, we identified a major stable QTL, QKl.cib-6D2, that might primarily affect TKW via KL. Combining with previous research, this locus, located in the interval around the checking KASP marker KASP14803, demonstrated a pleiotropic effect on test weight and moisture content and might be involved by a candidate gene TraesCS6D02G109500, encoding aleurone layer morphogenesis protein [29], indicating that this putative candidate gene possibly simultaneously affected kernel-weight-related traits but also processing quality related traits, which were primarily determined by KL and in accordance with previous opinion [5]. As a result, the discovery of this locus and the development of its linked KASP marker could provide additional selection to improve kernel size and TKW by regulating KL, as well as the possibility of preserving the diversity of different genetic resources. Surprisingly, the distribution of the elite alleles at this locus in measured global cultivars was relatively high (77.50%) (Table 5), indicating that this locus has been widely, albeit passively, used in modern breeding, but it also demonstrated that the superiority of this locus exists, and thus, it could be retained in such a diverse range of genetic background materials. Of course, about a quarter of the material could still be improved for grain traits by selecting for superior genotypes at this locus, improving the yield potential and processing quality of wheat from various genetic backgrounds and cultivation regions. The flanking linked molecular marker discovered in this study could aid MAS in achieving this goal.
Aside from the QTLs in R6A and R6D2 that have been found to be consistent with previously reported QTLs [14,29], we discovered that the R4D, another critical region that controls kernel size (Table 3) and is involved in TKW variation (Table 4), might be affected by the well-known semi-dwarfing gene Rht2 [44]. The negative effect of Rht2 on TKW and kernel traits has been reported [45,46], which was consistent with the findings of this study; that is, ZKM138 was the allele donor of taller plants and larger kernel at this locus, which could be explained by its reduction effect on cell size [44], and also with the conclusion that the positive effect of this dwarfing gene on yield increasing was primarily through increasing the trade-offing trait of TKW, kernel number rather than TKW [47].
Overall, this study’s comparison of traditional and conditional QTL mapping results provided more information for us to screen and select the major causal traits for targeted improvement of complex target traits by MAS.

5. Conclusions

On chromosomes 3D, 4B, 4D, 6A, and 6D, five critical genomic regions harboring major stable QTLs for KRTs were identified, and the corresponding linked markers were screened and developed for further MAS. By using both traditional and conditional QTL analysis, it was discovered that R3D and R4B.1 primarily affected kernel shape and that R4D, R6A, and R6D2 primarily controlled kernel size and contributed to TKW. At each individual QTL level, the different contributions of the kernel components to kernel size and shape were discussed, and the possible different genetic controlling mechanisms controlling these complex kernel morphological traits were presented, which might provide information for further fine mapping and gene function validation. These newly identified QTLs and their corresponding tracking markers, as well as genotype distribution information among the measured global cultivars, supported us in selecting the appropriate genotypic materials to genetically improve the kernel traits for optimum yield and quality performance.

Supplementary Materials

The following supporting information can be downloaded at: https://www.mdpi.com/article/10.3390/agriculture12101718/s1, Table S1: The primer sequences for KASP markers used in this study; Table S2: Phenotypic values for grain size related traits in the two parents and in the ZK-RIL population; Table S3: The loci detected by conditional QTL analysis in this study.

Author Contributions

Conceptualization, X.F. and T.W.; methodology, X.F.; software, X.F.; validation, X.F., X.L. and S.G.; investigation, Z.X., B.F., Q.Z., G.D. and H.L.; resources, T.W., Z.X., G.D. and H.L.; data curation, X.F.; writing—original draft preparation, X.F.; writing—review and editing, X.F., T.W. and Z.X.; visualization, X.F.; supervision, X.F.; project administration, X.F. and T.W.; funding acquisition, X.F. and T.W. All authors have read and agreed to the published version of the manuscript.

Funding

This research was funded by the Sichuan Science and Technology Program, China, grant number 2022ZDZX0014, the National Science Foundation of China, grant number 31971934 and Youth Innovation Promotion Association of CAS, grant number 2020364.

Institutional Review Board Statement

Not applicable.

Informed Consent Statement

Not applicable.

Data Availability Statement

The authors declare that the data supporting the findings of this study are available within the main text of the manuscript and supplementary materials.

Acknowledgments

We sincerely thank Zhiyong Liu and Miaomiao Li in the Institute of Genetics and Developmental Biology of Chinese Academy of Sciences for providing us with the DNA of global cultivars used in this study.

Conflicts of Interest

The authors declare no conflict of interest. The funders had no role in the design of the study; in the collection, analyses, or interpretation of data; in the writing of the manuscript; or in the decision to publish the results.

References

  1. Ray, D.K.; Mueller, N.D.; West, P.C.; Foley, J.A. Yield trends are insufficient to double global crop production by 2050. PLoS ONE 2013, 8, e66428. [Google Scholar] [CrossRef] [PubMed] [Green Version]
  2. Dholakia, B.; Ammiraju, J.; Singh, H.; Lagu, M.; Röder, M.; Rao, V.; Dhaliwal, H.; Ranjekar, P.; Gupta, V.; Weber, W. Molecular marker analysis of kernel size and shape in bread wheat. Plant Breed. 2003, 122, 392–395. [Google Scholar] [CrossRef]
  3. Wang, L.; Ge, H.; Hao, C.; Dong, Y.; Zhang, X. Identifying loci influencing 1,000-kernel weight in wheat by microsatellite screening for evidence of selection during breeding. PLoS ONE 2012, 7, e29432. [Google Scholar] [CrossRef] [Green Version]
  4. Ramya, P.; Chaubal, A.; Kulkarni, K.; Gupta, L.; Kadoo, N.; Dhaliwal, H.S.; Chhuneja, P.; Lagu, M.; Gupt, V. QTL mapping of 1000-kernel weight, kernel length, and kernel width in bread wheat (Triticum aestivum L.). J. Appl. Genet. 2010, 51, 421–429. [Google Scholar] [CrossRef] [PubMed]
  5. Gegas, V.C.; Nazari, A.; Griffiths, S.; Simmonds, J.; Fish, L.; Orford, S.; Sayers, L.; Doonan, J.H.; Snape, J.W. A Genetic framework for grain size and shape variation in wheat. Plant Cell 2010, 22, 1046–1056. [Google Scholar] [CrossRef] [PubMed] [Green Version]
  6. Cui, F.A.; Ding, A.; Li, J.U.N.; Zhao, C.; Li, X.; Feng, D.; Wang, X.; Wang, L.I.N.; Gao, J.; Wang, H. Wheat kernel dimensions: How do they contribute to kernel weight at an individual QTL level? J. Genet. 2011, 90, 409–425. [Google Scholar] [CrossRef]
  7. Mohler, V.; Albrecht, T.; Castell, A.; Diethelm, M.; Schweizer, G.; Hartl, L. Considering causal genes in the genetic dissection of kernel traits in common wheat. J. Appl. Genet. 2016, 57, 467–476. [Google Scholar] [CrossRef] [PubMed]
  8. Li, T.; Liu, H.; Mai, C.; Yu, G.; Li, H.; Meng, L.; Jian, D.; Yang, L.; Zhou, Y.; Zhang, H. Variation in allelic frequencies at loci associated with kernel weight and their effects on kernel weight-related traits in winter wheat. Crop J. 2019, 7, 30–37. [Google Scholar] [CrossRef]
  9. Xin, F.; Zhu, T.; Wei, S.; Han, Y.; Zhao, Y.; Zhang, D.; Ma, L.; Ding, Q. QTL mapping of kernel traits and validation of a major QTL for kernel length-width ratio using SNP and bulked segregant analysis in wheat. Sci. Rep. 2020, 10, 25. [Google Scholar] [CrossRef] [PubMed] [Green Version]
  10. Qu, X.; Li, C.; Liu, H.; Liu, J.; Luo, W.; Xu, Q.; Tang, H.; Mu, Y.; Deng, M.; Pu, Z. Quick mapping and characterization of a co-located kernel length and thousand-kernel weight-related QTL in wheat. Theor. Appl. Genet. 2022, 135, 2849–2860. [Google Scholar] [CrossRef] [PubMed]
  11. Chastain, T.; Ward, K.; Wysocki, D. Stand establishment response of soft white winter wheat to seedbed residue and seed size. Crop Sci. 1995, 35, 213–218. [Google Scholar] [CrossRef]
  12. Botwright, T.; Condon, A.; Rebetzke, G.; Richards, R. Field evaluation of early vigour for genetic improvement of grain yield in wheat. Aust. J. Agric. Res. 2002, 53, 1137–1145. [Google Scholar] [CrossRef]
  13. Ma, L.; Li, T.; Hao, C.; Wang, Y.; Chen, X.; Zhang, X. TaGS5-3A, a grain size gene selected during wheat improvement for larger kernel and yield. Plant Biotechnol. J. 2016, 14, 1269–1280. [Google Scholar] [CrossRef]
  14. Liu, X.; Xu, Z.; Feng, B.; Zhou, Q.; Ji, G.; Guo, S.; Liao, S.; Lin, D.; Fan, X.; Wang, T. Quantitative trait loci identification and breeding value estimation of grain weight-related traits based on a new wheat 50K single nucleotide polymorphism array-derived genetic map. Front. Plant Sci. 2022, 13, 967432. [Google Scholar] [CrossRef]
  15. Su, Z.; Hao, C.; Wang, L.; Dong, Y.; Zhang, X. Identification and development of a functional marker of TaGW2 associated with grain weight in bread wheat (Triticum aestivum L.). Theor. Appl. Genet. 2011, 122, 211–223. [Google Scholar] [CrossRef] [PubMed]
  16. Dong, L.; Wang, F.; Liu, T.; Dong, Z.; Li, A.; Jing, R.; Mao, L.; Li, Y.; Liu, X.; Zhang, K. Natural variation of TaGASR7-A1 affects grain length in common wheat under multiple cultivation conditions. Mol. Breed. 2014, 34, 937–947. [Google Scholar] [CrossRef]
  17. Zhang, Y.; Liu, J.; Xia, X.; He, Z. TaGS-D1, an ortholog of rice OsGS3, is associated with grain weight and grain length in common wheat. Mol. Breed. 2014, 34, 1097–1107. [Google Scholar] [CrossRef]
  18. Breseghello, F.; Sorrells, M.E. QTL analysis of kernel size and shape in two hexaploid wheat mapping populations. Field Crops Res. 2007, 101, 172–179. [Google Scholar] [CrossRef]
  19. Evers, A.D.; Cox, R.I.; Shaheedullah, M.Z.; Withey, R.P. Predicting milling extraction rate by image analysis of wheat grains. Asp. Appl. Biol. 1990, 25, 417–426. [Google Scholar]
  20. Kumar, A.; Mantovani, E.; Seetan, R.; Soltani, A.; Echeverry-Solarte, M.; Jain, S.; Simsek, S.; Doehlert, D.; Alamri, M.; Elias, E. Dissection of genetic factors underlying wheat kernel shape and size in an elite × nonadapted cross using a high density SNP linkage map. Plant Genome 2016, 9, 81. [Google Scholar] [CrossRef] [PubMed] [Green Version]
  21. Troccoli, A.; Di Fonzo, N. Relationship between kernel size features and test weight in Triticum durum. Cereal Chem. 1999, 76, 45–49. [Google Scholar] [CrossRef]
  22. Schuler, S.F.; Bacon, R.K.; Finney, P.L.; Gbur, E.E. Relationship of test weight and kernel properties to milling and baking quality in soft red winter wheat. Crop Sci. 1995, 35, 949–953. [Google Scholar] [CrossRef]
  23. Cabral, A.L.; Jordan, M.C.; Larson, G.; Somers, D.J.; Humphreys, D.G.; McCartney, C.A. Relationship between QTL for grain shape, grain weight, test weight, milling yield, and plant height in the spring wheat cross RL4452/‘AC Domain’. PLoS ONE 2018, 13, e0190681. [Google Scholar] [CrossRef] [Green Version]
  24. Campbell, K.G.; Bergman, C.J.; Gualberto, D.G.; Anderson, J.A.; Giroux, M.J.; Hareland, G.; Fulcher, R.G.; Sorrells, M.E.; Finney, P.L. Quantitative trait loci associated with kernel traits in a soft × hard wheat cross. Crop Sci. 1999, 39, 1184–1195. [Google Scholar] [CrossRef]
  25. Wang, S.; Wong, D.; Forrest, K.; Allen, A.; Chao, S.; Huang, B.E.; Maccaferri, M.; Salvi, S.; Milner, S.G.; Cattivelli, L. Characterization of polyploid wheat genomic diversity using a high-density 90 000 single nucleotide polymorphism array. Plant Biotechnol. J. 2014, 12, 787–796. [Google Scholar] [CrossRef] [PubMed] [Green Version]
  26. Cui, F.; Zhang, N.; Fan, X.L.; Zhang, W.; Zhao, C.H.; Yang, L.J.; Pan, R.Q.; Chen, M.; Han, J.; Zhao, X.Q. Utilization of a Wheat660K SNP array-derived high-density genetic map for high-resolution mapping of a major QTL for kernel number. Sci. Rep. 2017, 7, 3788. [Google Scholar] [CrossRef] [PubMed] [Green Version]
  27. Liu, J.; Luo, W.; Qin, N.; Ding, P.; Zhang, H.; Yang, C.; Mu, Y.; Tang, H.; Liu, Y.; Li, W. A 55 K SNP array-based genetic map and its utilization in QTL mapping for productive tiller number in common wheat. Theor. Appl. Genet. 2018, 131, 2439–2450. [Google Scholar] [CrossRef] [PubMed]
  28. Sun, C.; Dong, Z.; Zhao, L.; Ren, Y.; Zhang, N.; Chen, F. The Wheat 660K SNP array demonstrates great potential for marker-assisted selection in polyploid wheat. Plant Biotechnol. J. 2020, 18, 1354–1360. [Google Scholar] [CrossRef] [PubMed]
  29. Fan, X.; Liu, X.; Feng, B.; Zhou, Q.; Deng, G.; Long, H.; Cao, J.; Guo, S.; Ji, G.; Xu, Z.; et al. Construction of a novel Wheat 55 K SNP array-derived genetic map and its utilization in QTL mapping for grain yield and quality related traits. Front. Genet. 2022, 13, 978880. [Google Scholar] [CrossRef]
  30. Sun, X.; Wu, K.; Zhao, Y.; Kong, F.; Han, G.; Jiang, H.; Huang, X.; Li, R.; Wang, H.; Li, S. QTL analysis of kernel shape and weight using recombinant inbred lines in wheat. Euphytica 2009, 165, 615–624. [Google Scholar] [CrossRef]
  31. Zhu, J. Analysis of conditional genetic effects and variance components in developmental genetics. Genetics 1995, 141, 1633–1639. [Google Scholar] [CrossRef] [PubMed]
  32. Ye, Z.; Wang, J.; Liu, Q.; Zhang, M.; Zou, K.; Fu, X. Genetic relationships among panicle characteristics of rice (Oryza sativa L.) using unconditional and conditional QTL analyses. J. Plant Biol. 2009, 52, 259–267. [Google Scholar] [CrossRef]
  33. Zhang, X.; Deng, Z.; Wang, Y.; Li, J.; Tian, J. Unconditional and conditional QTL analysis of kernel weight related traits in wheat (Triticum aestivum L.) in multiple genetic backgrounds. Genetica 2014, 142, 371–379. [Google Scholar] [CrossRef] [PubMed]
  34. Li, Q.; Zhang, Y.; Liu, T.; Wang, F.; Liu, K.; Chen, J.; Tian, J. Genetic analysis of kernel weight and kernel size in wheat (Triticum aestivum L.) using unconditional and conditional QTL mapping. Mol. Breed. 2015, 35, 194. [Google Scholar] [CrossRef]
  35. Zhang, H.; Chen, J.; Li, R.; Deng, Z.; Zhang, K.; Liu, B.; Tian, J. Conditional QTL mapping of three yield components in common wheat (Triticum aestivum L.). Crop J. 2016, 4, 220–228. [Google Scholar] [CrossRef] [Green Version]
  36. Li, C.; Tang, H.; Luo, W.; Zhang, X.; Mu, Y.; Deng, M.; Liu, Y.; Jiang, Q.; Chen, G.; Wang, J. A novel, validated, and plant height-independent QTL for spike extension length is associated with yield-related traits in wheat. Theor. Appl. Genet. 2020, 133, 3381–3393. [Google Scholar] [CrossRef] [PubMed]
  37. Giura, A.; Saulescu, N. Chromosomal location of genes controlling grain size in a large grained selection of wheat (Triticum aestivum L.). Euphytica 1996, 89, 77–80. [Google Scholar] [CrossRef]
  38. Chen, C.; Chen, H.; Zhang, Y.; Thomas, H.R.; Frank, M.H.; He, Y.; Xia, R. TBtools: An Integrative Toolkit Developed for Interactive Analyses of Big Biological Data. Mol. Plant 2020, 13, 1194–1202. [Google Scholar] [CrossRef] [PubMed]
  39. Meng, L.; Li, H.; Zhang, L.; Wang, J. QTL IciMapping: Integrated software for genetic linkage map construction and quantitative trait locus mapping in biparental populations. Crop J. 2015, 3, 269–283. [Google Scholar] [CrossRef] [Green Version]
  40. Li, T.; Deng, G.; Tang, Y.; Su, Y.; Wang, J.; Cheng, J.; Yang, Z.; Qiu, X.; Pu, X.; Zhang, H. Identification and validation of a novel locus controlling spikelet number in bread wheat (Triticum aestivum L.). Front. Plant Sci. 2021, 12, 611106. [Google Scholar] [CrossRef] [PubMed]
  41. Wen, Y.X.; Zhu, J. Multivariable conditional analysis for complex trait and its components. Acta Genet. Sin. 2005, 32, 289–296. [Google Scholar] [PubMed]
  42. Fuller, D.Q. Contrasting patterns in crop domestication and domestication rates: Recent archaeobotanical insights from the Old World. Ann. Bot. 2007, 100, 903–924. [Google Scholar] [CrossRef] [PubMed]
  43. Brown, T.A.; Jones, M.K.; Powell, W.; Allaby, R.G. The complex origins of domesticated crops in the Fertile Crescent. Trends Ecol. Evol. 2009, 24, 103–109. [Google Scholar] [CrossRef] [PubMed] [Green Version]
  44. Keyes, G.; Paolillo, D.; Sorrells, M. The effects of dwarfing genes Rht1 and Rht2 on cellular dimensions and rate of leaf elongation in wheat. Ann. Bot. 1989, 64, 683–690. [Google Scholar] [CrossRef]
  45. Manske, G.; Ortiz-Monasterio, J.; Van Ginkel, R.; Rajaram, S.; Vlek, P. Phosphorus use efficiency in tall, semi-dwarf and dwarf near-isogenic lines of spring wheat. Euphytica 2002, 125, 113–119. [Google Scholar] [CrossRef]
  46. Velu, G.; Singh, R.P.; Huerta, J.; Guzmán, C. Genetic impact of Rht dwarfing genes on grain micronutrients concentration in wheat. Field Crops Res. 2017, 214, 373–377. [Google Scholar] [CrossRef] [PubMed]
  47. Rebetzke, G.; Richards, R. Gibberellic acid-sensitive dwarfing genes reduce plant height to increase kernel number and grain yield of wheat. Aust. J. Agric. Res. 2000, 51, 235–246. [Google Scholar] [CrossRef]
Figure 1. Grain size variation between Zhongkemai138 and Kechengmai2.
Agriculture 12 01718 g001
Figure 2. Phenotypic performances, distribution, and correlation coefficients of thousand-grain weight (TKW), kernel length (KL), kernel width (KW), kernel diameter (KD), kernel surface area (KA), kernel perimeter (KP), the ratio of KL and KW (LWR), kernel roundness (KRD) and the form-density factor (FFD) in the ZK-RILs based on the BLUP data. *, ** and *** represent significance at p < 0.05, p < 0.01 and p < 0.001, respectively.
Agriculture 12 01718 g002
Figure 3. Five regions harboring stable major QTLs in this study. The solid rectangle indicates the ZKM138-derived alleles increasing the corresponding traits; the blank rectangle indicates the KCM2-derived alleles increasing the corresponding traits. The QTL in bold indicates the major QTL. The parentheticals following the QTL names indicate the datasets in which they were detected. The red segments highlighted on the chromosomes indicate the putative CI range of this region.
Agriculture 12 01718 g003
Table 1. The QTLs detected by traditional QTL analysis in this study.
TraitsQTLsEnvironmentsLinkagesMarker IntervalsLODPVE(%)AddConfidence Intervals
KL (mm)QKl.cib-3BE2,E3,E4,E5,E6,E8,B3BAX-108855934—AX-1099842204.74 6.45 −0.07 79.50–81.00
QKl.cib-3DE2,E3,E4,E5,E6,E8,B3DAX-110950126—AX-1097303858.14 12.38 −0.10 12.50–16.50
QKl.cib-6AE2,E3,E4,E5,E6,E8,B6AAX-110955892—AX-1103966104.40 6.02 0.07 48.50–50.50
QKl.cib-6D2E2,E3,E4,E5,E6,E8,B6D2AX-110261831—KASP148036.86 10.21 0.09 5.50–9.50
KW (mm)QKw.cib-3DE2,E4,E73DAX-110234451—AX-1087540184.17 6.93 0.05 0–6.50
QKw.cib-4BE1,E2,E3,E4,E6,E7,E8,B4BAX-109294476—AX-1111762636.72 11.77 −0.06 13.50–20.50
QKw.cib-4DE1,E2,E3,E4,E5,E6,E7,E8,B4DRht2—AX-1089050567.32 13.88 0.06 30.50–45.50
QKw.cib-6A.1E76AAX-110423063—AX-1106071113.91 6.02 0.04 26.50–32.50
QKw.cib-6A.2E1,E2,E3,E6,E8,B6AAX-110955892—AX-1103966106.06 9.86 0.05 48.50–50.50
KD (mm)QKd.cib-1AE71AAX-110963581—AX-1088040893.81 5.92 −0.04 0–1.50
QKd.cib-4AE84AAX-109926421—AX-1115085835.12 8.55 0.05 75.50–77.50
QKd.cib-4BE24BAX-109294476—AX-1111762633.86 5.94 −0.04 13.50–20.50
QKd.cib-4DE1,E2,E3,E4,E5,E6,E7,E8,B4DRht2—AX-1089050565.27 11.46 0.06 29.50–44.50
QKd.cib-6AE1,E2,E3,E4,E5,E6,E7,E8,B6AAX-110955892—AX-1103966106.75 12.39 0.06 48.50–50.50
KA (mm2)QKa.cib-1AE41AAX-110963581—AX-1088040894.73 6.78 −0.34 0–2.50
QKa.cib-4AE84AAX-109926421—AX-1115085834.87 8.21 0.34 75.50–77.50
QKa.cib-4BE2,E44BAX-94790546—AX-1111762634.01 5.84 −0.32 13.50–19.50
QKa.cib-4DE1,E2,E3,E4,E5,E6,E7,E8,B4DRht2—AX-1089050565.29 11.62 0.43 27.50–44.50
QKa.cib-6AE1,E2,E3,E4,E5,E6,E7,E8,B6AAX-110955892—AX-1103966106.28 11.82 0.41 48.50–50.50
KP (mm)QKp.cib-3DE3,E6,E83DAX-110950126—AX-1097303853.92 6.58 −0.16 12.50–17.50
QKp.cib-4DE4,E5,E6,E74DAX-111494342—Rht23.93 8.74 0.18 21.50–35.50
QKp.cib-6AE1,E2,E3,E4,E5,E6,E7,E8,B6AAX-110955892—AX-1103966105.59 9.54 0.18 48.50–50.50
QKp.cib-6D2E1,E2,E3,E6,E8,B6D2AX-110261831—KASP148034.45 7.58 0.16 2.50–9.50
LWRQLwr.cib-2AE1,E72AAX-111042596—AX-1104335403.87 7.31 −0.03 1.50–3.50
QLwr.cib-3DE1,E2,E3,E4,E5,E6,E7,E8,B3DAX-110234451—AX-1109501266.70 12.13 −0.04 0–15.50
QLwr.cib-4B.1E1,E2,E3,E4,E5,E6,E7,E8,B4BAX-111640796—AX-1111762635.85 11.34 0.04 12.50–25.50
QLwr.cib-4B.2E24BAX-108828132—AX-1101039114.06 6.51 0.03 28.50–29.50
QLwr.cib-4DE2,E4,B4DRht2—AX-1089050565.40 10.29 −0.04 31.50–45.50
QLwr.cib-5DE4,E5,B5DAX-89591395—AX-1110199794.91 6.95 −0.03 96.50–97.50
QLwr.cib-6AE56AAX-110561762—KASP1360314.20 14.63 0.05 1.50–2.50
QLwr.cib-7AE27AAX-110529210—AX-1109255304.12 7.00 0.03 94.50–99.50
KRDQKrd.cib-2AE42AAX-111042596—AX-1104335403.96 7.58 0.01 0–3.50
QKrd.cib-3DE1,E3,E4,E5,E6,E7,E8,B3DAX-110234451—AX-1088912937.82 14.77 0.01 0–15.50
QKrd.cib-4B.1E1,E2,E4,E7,E84BAX-109909153—AX-1109383986.62 12.03 −0.01 13.50–23.50
QKrd.cib-4B.2E2,E34BAX-94425728—AX-1101039114.34 6.71 −0.01 26.50–29.50
QKrd.cib-4D.1E2,E74DRht2—AX-1089050566.63 11.28 0.01 31.50–43.50
QKrd.cib-4D.2E54DAX-89617545—AX-1087427473.91 5.60 0.01 70.50–77.50
QKrd.cib-5AE6,E8,B5AAX-110587222—AX-1106446273.69 7.58 −0.01 0–10.50
QKrd.cib-5D.1E55DAX-111512534—AX-896330414.04 7.53 −0.01 58.50–60.50
QKrd.cib-5D.2E3,E5,E65DAX-89591395—AX-1110199793.95 8.27 0.01 96.50–98.50
QKrd.cib-7AE27AAX-110529210—AX-1109255304.13 7.14 −0.01 94.50–99.50
FFDQFfd.cib-2AE82AAX-110562886—AX-1109190816.58 9.04 0.05 8.50–9.50
QFfd.cib-2DE82DAX-109998182—AX-1093306663.90 4.53 −0.04 68.50–70.50
QFfd.cib-3BE43BAX-109911340—AX-1115369103.79 8.95 0.03 75.50–77.50
QFfd.cib-4BE1,E2,E8,B4BAX-109294476—AX-1111762636.57 10.57 −0.05 15.50–22.50
QFfd.cib-4DE1,E2,E7,B4DRht2—AX-1089050565.09 11.28 0.05 32.50–48.50
QFfd.cib-6AE2,B6AAX-110955892—AX-1103966104.30 6.76 0.04 48.50–50.50
QFfd.cib-7BE87BAX-94611818—AX-1099762835.72 9.27 0.05 77.50–83.50
Note: The QTL in bold type are defined as major QTL; the QTL underlined are defined as stable QTL; the positive additive effect indicates the ZKM138-derived alleles increasing the corresponding traits; the negative additive effectindicates the KCM2-derived alleles increasing the corresponding traits. B indicates the QTL that is significant in the BLUP dataset.
Table 2. The additive effect of QTLs independent of a given KC.
QTLsChange Percentage of Additive Effect (%) when Conditioned on KLChange Percentage of Additive Effect (%) when Conditioned on KWChange Percentage of Additive Effect (%) when Conditioned on KD
QKa.cib-1A///
QKa.cib-4A///
QKa.cib-4B−12.54//
QKa.cib-4D−22.17//
QKa.cib-6A/−57.60/
QKp.cib-3D−131.3624.2−45.58
QKp.cib-4D−53.4//
QKp.cib-6A/−28.08/
QKp.cib-6D2/0/
QLwr.cib-2A/−18.7121.94
QLwr.cib-3D−19.7−32.74/
QLwr.cib-4B.10−36.340
QLwr.cib-4B.2///
QLwr.cib-4D0//
QLwr.cib-5D−12.94//
QLwr.cib-6A−150.73−63/
QLwr.cib-7A///
QKrd.cib-2A/14.2922.22
QKrd.cib-3D0−35.440
QKrd.cib-4B.1073.490
QKrd.cib-4B.2///
QKrd.cib-4D.10.27−168.22−14.02
QKrd.cib-4D.2///
QKrd.cib-5A/−22.970
QKrd.cib-5D.1///
QKrd.cib-5D.2///
QKrd.cib-7A//−8
QFfd.cib-2A/−39.31−38.73
QFfd.cib-2D//−80.72
QFfd.cib-3B2.9//
QFfd.cib-4B−4.47−46.648.09
QFfd.cib-4D−2.09/−34.41
QFfd.cib-6A1.54//
QFfd.cib-7B///
Note: / indicates that the loci could not be detected by conditional QTL analysis.
Table 3. Eleven genomic regions harboring two or more QTLs in this study.
Genomic RegionsChromosomesMarkers IntervalsIntervals (cM)Physical Location (bp)Involved QTLs
R1A1AAX-110963581—AX-1088040890–2.500–14,167,187QKd.cib-1A (1, −), QKa.cib-1A (1, −)
R2D2DAX-111042596—AX-1104335400–3.50317,84,518–358,91,228QLwr.cib-2A (2, −), QKrd.cib-2A (1, +)
R3B3BAX-109911340—AX-10998422077.50–81.50818,890,758–820,411,093QKl.cib-3B (7, −), QFfd.cib-3B
R3D3DAX-110234451—AX-1097303850–17.500–452,409,067QKl.cib-3D (7, −), QKw.cib-3D (3, +), QKp.cib-3D (3, −), QLwr.cib-3D (9, −), QKrd.cib-3D (8, +)
R4A4AAX-109926421—AX-11150858375.50–77.50684,899,178–685,743,278QKd.cib-4A (1, +),QKa.cib-4A (1, +)
R4B.14BAX-111640796—AX-11117626312.50–25.5012,536,661–41,550,962QKw.cib-4B (8, −), QKd.cib-4B (1, −), QKa.cib-4B (2, −), QLwr.cib-4B.1 (9, +), QKrd.cib-4B.1 (5, −), QFfd.cib-4B (4, −)
R4B.24BAX-94425728—AX-11010391126.50–29.50103,527,224–361,732,573QKrd.cib-4B.2 (2, −), QLwr.cib-4B.2 (1, +),
R4D4DRht2—AX-10890505627.50–48.5018,781,000–54,131,805QKw.cib-4D (9, +), QKd.cib-4D (9, +), QKa.cib-4D (9, +), QKp.cib-4D (4, +), QLwr.cib-4D.1 (3, −), QKrd.cib-4D.1 (2, +), QFfd.cib-4D (4, +)
R5D5DAX-89591395—AX-11101997996.50–98.50290,069,021–304,497,167QLwr.cib-5D (3, −), QKrd.cib-5D.2 (3, +)
R6A6AAX-110955892—AX-11039661048.50–50.50268,089,973–322,766,933QKl.cib-6A (7, +), QKw.cib-6A.2(6, +), QKd.cib-6A (9, +), QKa.cib-6A (9, +), QKp.cib-6A (9, +), QFfd.cib-6A (2, +),
R6D26D2AX-110261831—KASP148032.50–9.5075,878,004–89,262,056QKl.cib-6D2 (9, +), QKp.cib-6D2 (6, +)
Note: The QTLs in bold are the major QTLs. The underlined QTLs are the stable QTLs which could be repeatedly detected at least three different environments by IciMapping 4.1. The number in the parentheses indicate the sum of datasets in which the corresponding QTLs are significant. The “+” in the parentheses indicates that ZKM138 allele increases the corresponding traits. The “−” in the parenthesis indicates that KCM2 allele increases the corresponding traits.
Table 4. The validation of the crucial regions for TKW and kernel-related traits.
TraitsGenotypes R3DR4B.1R4DR6AR6D2
NumbersAverageSignificanceNumbersAverageSignificanceNumbersAverageSignificanceNumbersAverageSignificanceNumbersAverageSignificance
TKW (g)A6148.18 7347.10 9748.42***8948.40**7448.30*
B7147.15 6848.14 5045.72 5846.29 6346.57
KL (mm)A616.89**736.91 976.97*897.18*747.00**
B717.02 686.90 506.90 586.91 636.88
KW (mm)A613.44**733.36**973.43**893.42**743.41
B713.37 683.44 503.34 583.36 633.38
KD (mm)A614.89 734.87 974.91***894.91**744.90*
B714.88 684.89 504.82 584.84 634.84
KA (mm2)A6119.07 7318.97 9719.20***8919.21**7419.18*
B7119.01 6819.08 5018.56 5818.69 6318.74
KP (mm)A6117.64 7317.77 9717.78**8917.79*7417.81**
B7117.80 6817.66 5017.53 5817.58 6317.55
LWRA612.03***732.12***972.07 892.07 742.09
B712.12 682.04 502.10 582.09 632.07
KRDA610.50***730.48***970.50 890.50 740.49
B710.48 680.50 500.49 580.49 630.50
FFDA612.03**731.99**972.03**892.03*742.02
B711.99 682.03 501.98 581.99 632.00
Note: The genotype A and B indicates that the genotype same with ZKM138 and KCM2, respectively. *, ** and *** indicates the significance between two genotypes at 0.05, 0.01 and 0.001 level, respectively.
Table 5. The genotype distribution of R3D, R4B.1 and R6D2 in the derivatives of ZKM138 and global varieties.
Genotypes of ZKM138-DerivativesKASP3D32KASP4B61KASP14803 Genotypes of Global VarietiesKASP3D32KASP4B61KASP14803
Numbers of genotypeA857983Numbers of genotypeA201135248
B063B1049372
Percentage of genotypes (%)A100.0092.9496.51Percentage of genotypes (%)A65.9059.2177.50
B06.063.01B34.1040.7922.50
Note: KASP3D32, KASP4B61 and KASP14803 were used to validate and represent the genotype of R3D, R4B.1 and R6D2 in this study. The genotype A and B indicates that the genotype same with ZKM138 and KCM2, respectively.
Publisher’s Note: MDPI stays neutral with regard to jurisdictional claims in published maps and institutional affiliations.

