Article

China and Countries along the “Belt and Road”: Agricultural Trade Volatility Decomposition and Food Security

1
College of Economics and Management, Northeast Forestry University, Harbin 150040, China
2
Center for Global Change and Earth Observations, Michigan State University, East Lansing, MI 48824, USA
3
College of Economics and Management, Harbin Institute of Technology, Harbin 150001, China
*
Author to whom correspondence should be addressed.
Agriculture 2022, 12(11), 1850; https://doi.org/10.3390/agriculture12111850
Submission received: 26 September 2022 / Revised: 28 October 2022 / Accepted: 30 October 2022 / Published: 4 November 2022

Abstract

:
Agricultural products are essential for human survival, and strengthening agricultural trade cooperation between China and countries along the “Belt and Road” (B&R) can promote food security, but there are few studies on bilateral trade fluctuation factors in the literature. This paper uses the modified multi-country multi-product CMS (constant market share) model and the two-country multi-product CMS model to decompose the fluctuation of agricultural trade between China and B&R countries by stage, region, and agricultural product type. The results show that in recent years, in the fluctuation of China’s exports to B&R countries, in overall agricultural products, the demand effect plays a major hindering role, accounting for −9.2%; in the region, Southeast Asia has the largest share of trade, which is mainly pulled by the joint demand effect, structural effect and competitiveness effect; in specific agricultural products, animal, fruit and vegetable, and food processing products are mainly pulled by competitiveness. In the fluctuation of B&R countries’ export to China, in overall agricultural products, the demand effect pulls the largest share, accounting for 72.55%; in the region, Southeast Asia is mainly driven by the joint pull of demand effect, structural effect. and competitiveness effect; in specific agricultural products, animal, fruit and vegetable, and food processing products are mainly driven by the pull of demand effect. The findings of this paper can provide a basis for making decisions on food security cooperation between China and B&R countries.

1. Introduction

Agricultural products are the material on which human beings depend. Currently, the world is experiencing major risks such as the pandemic of COVID-19, the Russia–Ukraine conflict, and global warming. Improving the efficiency of global agricultural resources allocation, enhancing global food safety, and contributing to the global response to major uncertainty risks and sustainable development in the future. China is the world’s largest importer and second largest exporter of agricultural products, and China’s agricultural trade cooperation has a significant impact on global food security. “Belt and Road Initiative” (BRI) is China’s global strategic deployment, with the core concept of building a community of human destiny and promoting sustainable development of the world economy. At present, the center of gravity of China’s agricultural import channels has been shifting to the regions along the “Belt and Road”, and the initiative of grain import has been strengthened [1]. Promoting the growth of agricultural trade between China and B&R countries will be an important direction to enhance China’s food security and maintain the stability of the international agricultural market. So, what is the current situation of agricultural trade between China and B&R countries? What are the reasons to promote the growth of bilateral trade? In particular, how can China and B&R countries resist the risks to ensure food security in the context of the current multiple major emergencies? Therefore, it is of great practical significance to study the fluctuation factors of agricultural trade between China and B&R countries.
The current domestic and international literature studying trade volatility focuses on the choice of methodology and the study sample. First, the choice of research methods. Current methods for analyzing international trade volatility have measured short-term trade volatility methods, mainly considering price fluctuation factors that lead to changes in import and export trade, such as ARCH (autoregressive conditional heteroscedasticity) models [2,3], Error-correction models [4], GARCH (generalized autoregressive conditional heteroscedasticity) and VAR(vector autoregression) [5], NARDL(vector autoregressive distributed lag) model [6], trade elasticity model [7], Asset Pricing Model [8], and other methods. There is also the CMS, which incorporates the competitiveness theory into the framework of trade movements and is able to analyze commodity import and export movements from a long-term perspective [9], and captures the direct factors of export fluctuations by decomposing the trade volume year by year to explore the dynamic adaptation of supply and demand, avoiding the degree of subjectivity and arbitrariness in the selection of indicators in the econometric model [10]. This paper focuses on analyzing the fluctuation of agricultural trade between China and B&R countries for more than 20 years since China’s accession to the WTO (World Trade Organization) and discusses the food security cooperation between China and B&R countries, so the CMS model is chosen as the method to analyze the trade fluctuation in this paper.
The basic assumption of the CMS model is that if a country’s export competitiveness of a commodity remains constant, the export share of that commodity in the international market also remains constant. The CMS model was first proposed by Tyszynski (1951) [11] and applied to the study of global trade, and was subsequently extended and refined by Jepma (1986) [12] and Milana (1988) [13], among others. CMS models mainly take two forms: two-country multi-product models and multi-country multi-product models. Some scholars currently use a multi-country multi-product model to study export trade separately [14,15], but rarely involve import trade. Some other scholars use a two-country multi-product model to study bilateral trade in imports and exports [16,17], but assume multi-country as a single country and ignore the impact of market effects on trade volatility among multiple countries.
This paper differs from existing approaches by applying both CMS models to two aspects of a problem in order to reduce the neglect of inter-country market and competitiveness effects based on single-country assumptions and to be able to reflect more valuable information. Since the research object of this paper is the fluctuation of agricultural trade between China and B&R countries, from the perspective of China’s exports to B&R countries, B&R countries involve a total of 65 countries divided into six regions, then China’s exports to B&R countries are multi-country and multi-product types, then the multi-country and multi-product type CMS model is used. If we study the fluctuation of China’s imports to B&R countries, according to the basic assumptions of the CMS model, we mainly study the competitiveness of export markets, so we switch the perspective and study China’s agricultural imports to B&R countries indirectly from the perspective of the agricultural exports of B&R countries to China on the basis that the trade volume of China’s imports to B&R countries is equal to the export volume of B&R countries to China. Since China is a single exporting country from the perspective of B&R countries, the multi-country multi-product CMS model cannot be used to study the export effects, and the two-country multi-product model is used to study the fluctuation of B&R countries’ export agriculture to China as a whole.
Second, the selection of research samples. At present, many scholars use CMS models to study China’s agricultural trade volatility, partly focusing on specific agricultural products, such as: aquatic products [18,19], cereals [9], grains [20], pork [21], apples [22], corn [23], etc. There are also studies focusing on China and major countries or regions in the world, such as BRICS countries [24,25], Japan [26], Latin American countries [27], ASEAN [28], RCEP [29], and the United States [30], etc. In addition, since the “Belt and Road” initiative was put forward, scholars in China have studied the overall agricultural trade fluctuations between China and some countries and regions along B&R countries, such as Vietnam [31], Eastern European countries [17], and SCO(Shanghai Cooperation Organization) member countries [32], the existing research results provide a reference for this paper, but there is little literature that takes all B&R countries as a research sample and categorizes the regions and agricultural products to explore the trade volatility factors between China and B&R countries.
This paper differs from the existing research results in the following aspects:
(1)
In terms of methodology, based on the assumptions of CMS model construction, it combines the modified multi-country multi-product CMS model and the two-country multi-product CMS model to measure the trade volatility factors, which is conducive to reflecting more valuable information.
(2)
In terms of sample, we do not restrict to a specific agricultural product and some regions, but take all agricultural products and all B&R countries as the research objects, and categorize the agricultural products and regions to explore the trade volatility factors, which make the research sample size more comprehensive and detailed, and helps to draw more comprehensive conclusions.
(3)
In terms of time chain, the three important time points and the latest data on China’s accession to the WTO, the global financial crisis, and the “Belt and Road” initiative are selected as the decomposition objects, with a view to providing a basis for food security cooperation between China and the B&R countries in the context of China’s response to global emergencies.

2. Data Description, Trend Characteristics and Research Methodology

2.1. Description of Study Subjects and Data

(1)
Definition of the research area. Since “Belt and Road Initiative” is an open international economic cooperation region, the academic community has not yet precisely defined the distribution range, this paper refers to the definition method of Han Dong and Li Guangsi (2020) [33], and divides B&R countries into 6 regions and 60 countries: ① Mongolia Russia, including Mongolia and Russia; ② Central Asia, including Kazakhstan, Kyrgyzstan, Tajikistan, Uzbekistan, Turkmenistan 5 countries; ③ Southeast Asia, including Vietnam, Laos, Cambodia, Thailand, Malaysia, Singapore, Indonesia, Brunei, Philippines, Myanmar, Timor-Leste 11 countries; ④ South Asia, including India, Pakistan, Bangladesh, Afghanistan, Nepal, Bhutan, Sri Lanka, Maldives 8 countries. ⑤ West Asia Middle East, including Turkey, Iran, Syria, Iraq, Saudi Arabia, Qatar, Bahrain, Kuwait, Lebanon, Oman, Yemen, Jordan, Israel, Palestine, Armenia, Georgia, Azerbaijan, Egypt 18 countries; ⑥ Central and Eastern Europe, including Poland, Czech Republic, Slovakia, Hungary, Slovenia, Croatia, Romania, Bulgaria Serbia, Montenegro, Bosnia and Herzegovina, Albania, Estonia, Lithuania, Latvia, Ukraine 16 countries.
(2)
The scoping of agricultural products. Based on the WTO Agreement on Trade in Agricultural Products, chapters 1–24 of the International Convention on the Harmonized Commodity Description and Coding System (HS) are defined as agricultural products, and with reference to the method of Yusheng Chen et al. (2022) [34], agricultural products 1–5, 6–15, and 16–24 are classified as animal, fruit and vegetable, and food processing products, respectively. To ensure data consistency, the HS1996 commodity classification approach was used in this paper, and the data were obtained from the UN COMTRADE database. The specific database links are as follows: Download trade data | UN Comtrade: International Trade Statistics.

2.2. Trends in Agricultural Trade between China and B&R Countries

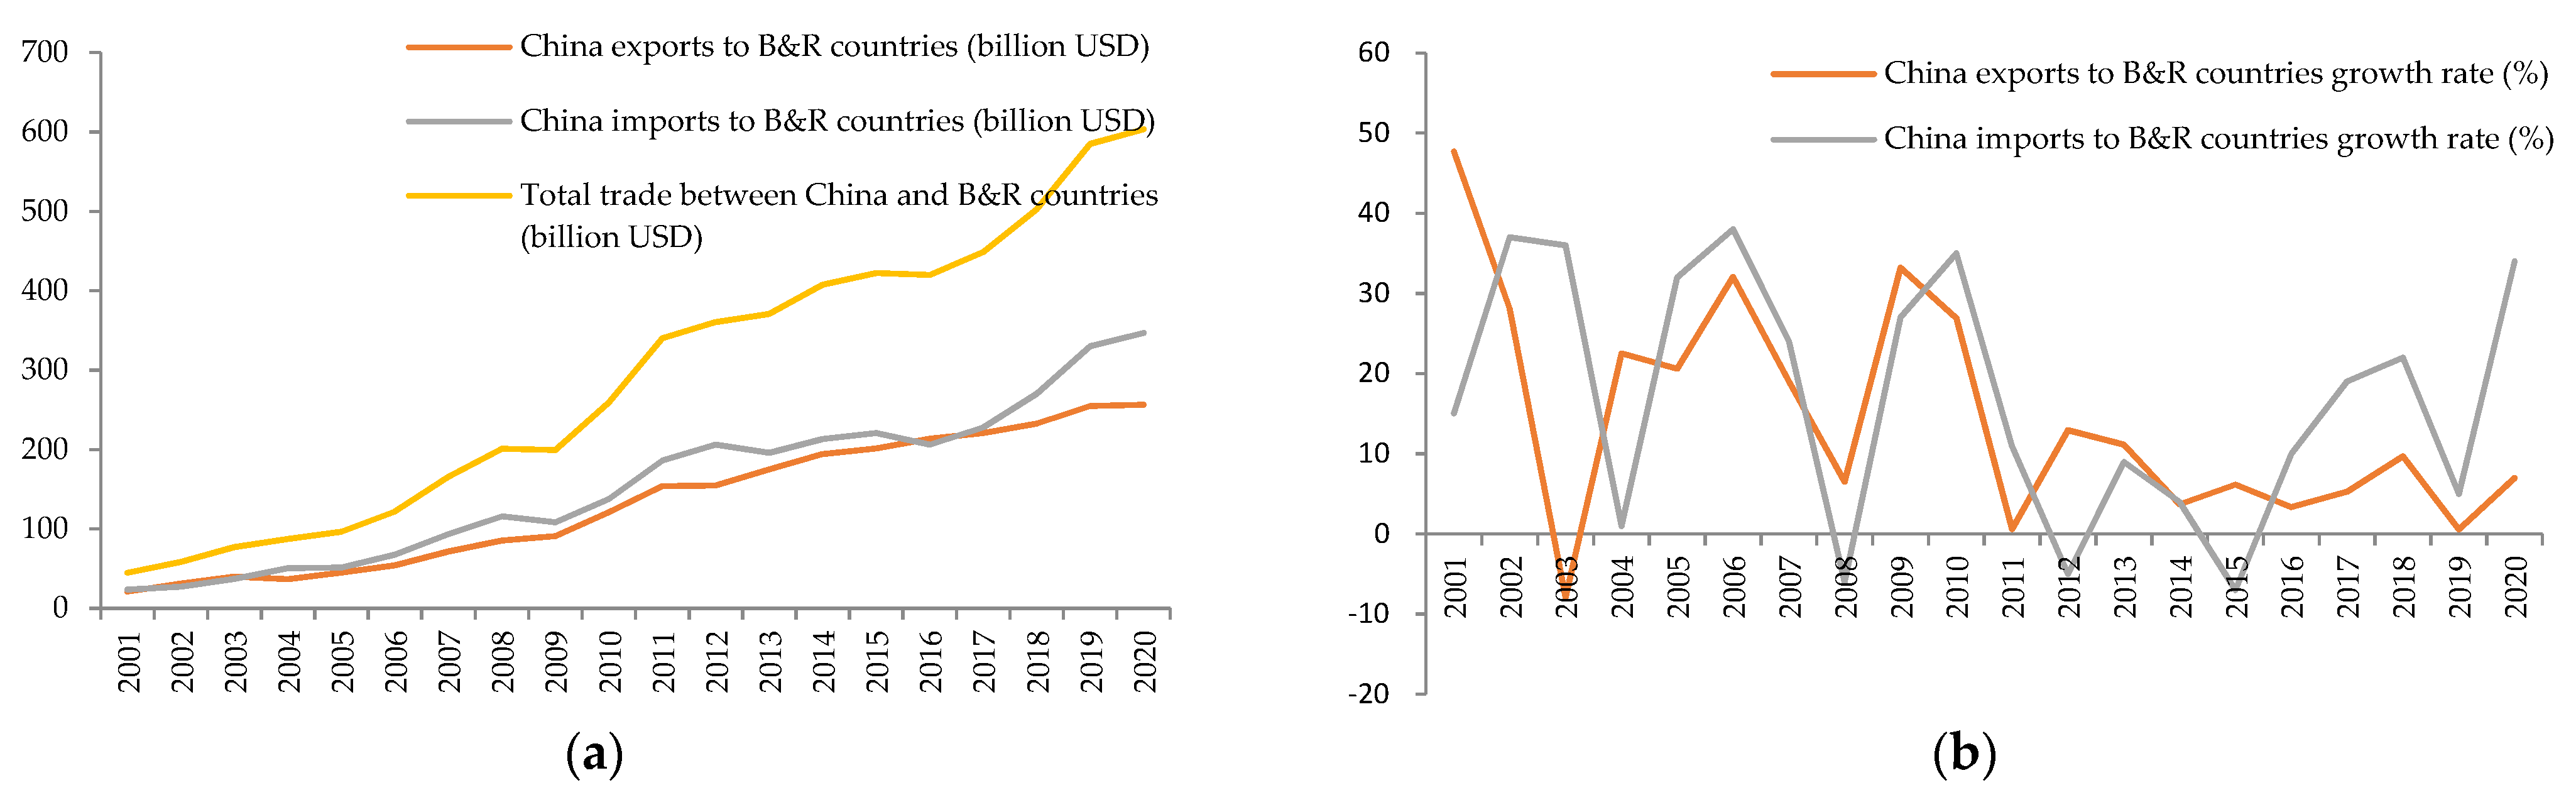
2.2.1. Trade Scale Trend

As shown in Figure 1, the overall scale of China’s import and export trade in agricultural products with B&R countries has been growing continuously, in which China’s import to B&R countries increased from USD 23.68 billion in 2001 to USD 256.5 billion in 2020, and China’s export to B&R countries has increased from USD 23.68 billion in 2001 to USD 347.03 billion in 2020. Except for the years 2008, 2012, and 2015, when the growth rate of China’s imports was negative, all other years were positive and the growth rate had a tendency to increase continuously. The growth rate of China’s exports has been greater than zero in general but has a tendency to decrease.

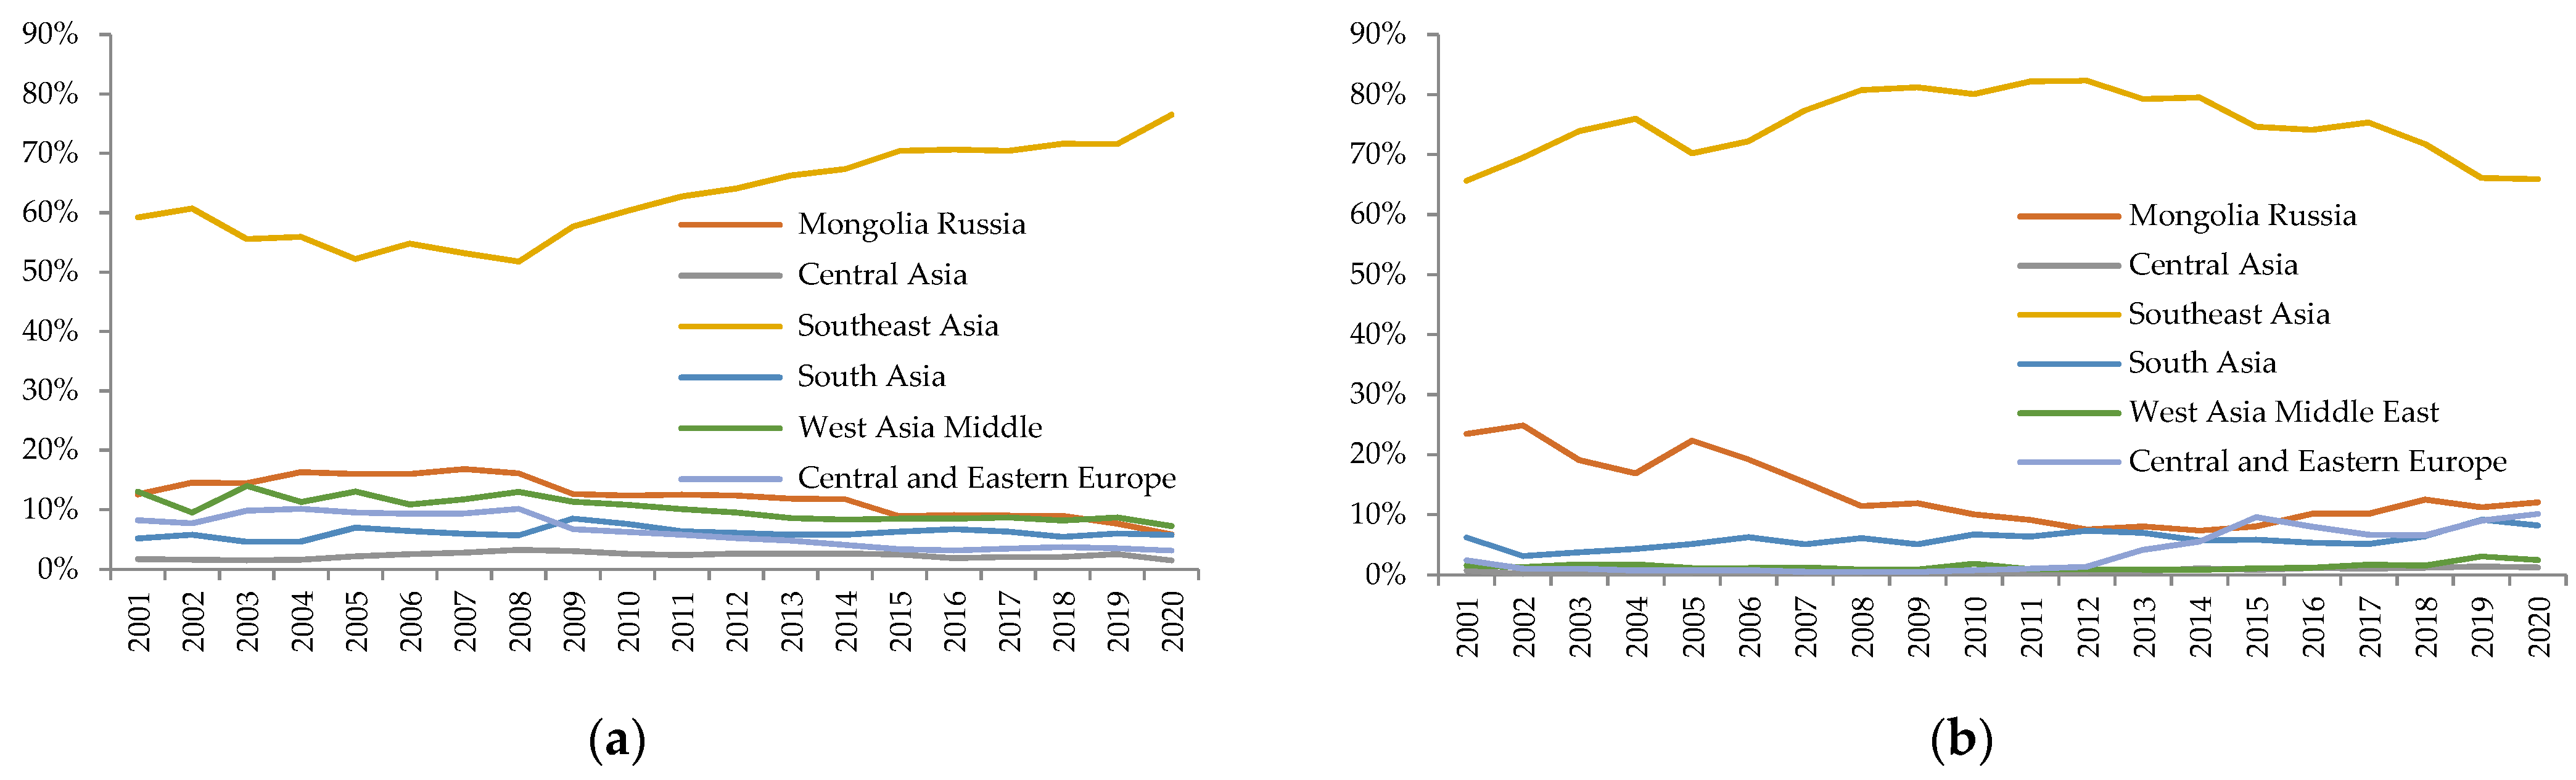
2.2.2. Market Distribution Trend

As shown in Figure 2, China’s import and export trade of agricultural products with B&R countries is mainly concentrated in Southeast Asia. China’s export regions along B&R countries have a tendency to be more concentrated in Southeast Asia, from 59% in 2001 to 77% in 2020, while the proportion of other regions has a relatively decreasing trend. China’s import regions along B&R countries are gradually dispersed, the proportion of imports from Southeast Asia is gradually decreasing, from 82% in 2012 to 66% in 2020, Mongolia and Russia, Central and Eastern Europe, and South Asia, the proportion of the region is gradually increasing.

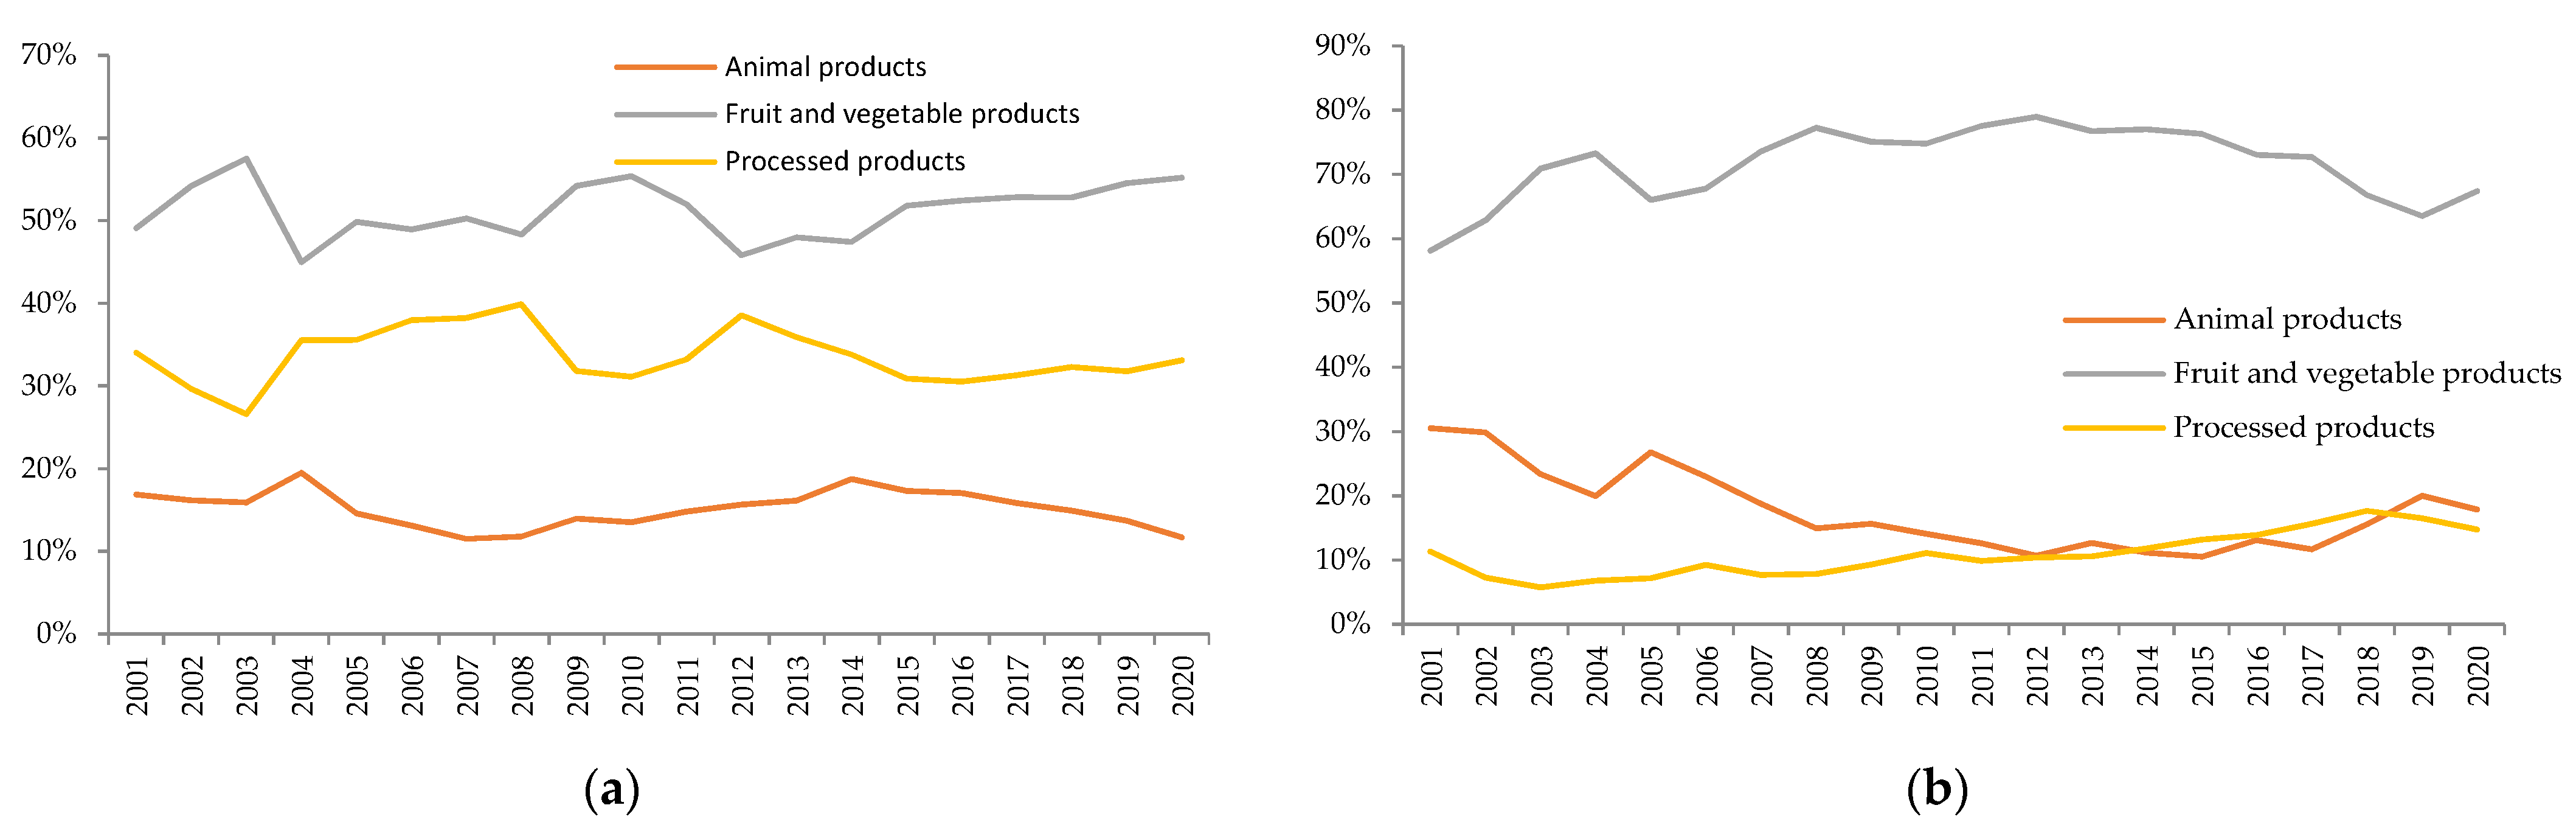
2.2.3. Trends in the Distribution of Agricultural Products Types

As shown in Figure 3, China’s trade with B&R countries accounted for the largest share of fruit and vegetable products. China’s exports of fruit and vegetable products have an increasing trend, from 47% in 2014 to 55% in 2020, and processed agricultural products are relatively stable, while animal products have a decreasing trend, from 19% in 2014 to 12% in 2020. China’s imports of fruit and vegetable and processed agricultural products have an increasing trend from 11% and 12% in 2014 to 18% and 15% in 2020, respectively, while animal products have a decreasing trend from 77% in 2014 to 67% in 2020.

2.3. Research Methodology

2.3.1. Modified Multi-Country, Multi-Product CMS Model

The revised multi-country multi-product CMS model is as follows:
X 2 X 1 = rX 1 + 1 2 i = 1 m ( r i r ) X i 1 + 1 2 j = 1 n ( r j r ) X j 1 + 1 2 i = 1 m ( X i 2 X i 1 r i X i 1 ) + 1 2 j = 1 n ( X j 2 X j 1 r j X j 1 )
In Equation (1),   X 2 X 1 represents the change in China′s export of agricultural products to B&R countries from the cut−off point to the starting year. i stands for Category i agricultural products exported by China. m is the number of agricultural products. X i represents China’s category i agricultural exports. j represents the j target market of China’s agricultural products export n is the number of target markets, X j   represents the export volume of China’s j -market. r represents the import growth rate of agricultural products from B&R countries.   r i   represents the import growth rate of a category i   agricultural products from B&R countries in the same period. r j represents the import growth rate of agricultural products in j -market of B&R countries in the same period. rX 1 is the demand effect DE1, and the larger its value is, the greater the impact of market demand expansion in B&R countries on China′s agricultural exports. 1 2 i = 1 m ( r i r ) X i 1 + 1 2 j = 1 n ( r j r ) X j 1 is structural effect SE1. Where, 1 2 i = 1 m ( r i r ) X i 1 is the product structure effect PSE1, and represents the influence of changes in agricultural product structure demand of B&R countries on China’s agricultural product export. 1 2 j = 1 n ( r j r ) X j 1 is the market structure effect MSE1, indicating the influence of the change of market demand structure in B&R countries on China′s agricultural export. 1 2 i = 1 m ( X i 2 X i 1 r i X i 1 ) + 1 2 j = 1 n ( X j 2 X j 1 r j X j 1 ) for the competitiveness effect CE1, where, 1 2 i = 1 m ( X i 2 X i 1 r i X i 1 ) is the effect of product competitiveness PCE1, indicating the influence of changes in the competitiveness of China’s agricultural products on its export, 1 2 j = 1 n ( X j 2 X j 1 r j X j 1 ) is the market competitiveness effect MCE1, and represents the impact of changes in the competitiveness of China’s agricultural products in the markets of B&R countries on its export.

2.3.2. CMS Model of Multi-Product in Two Countries

The multi-product CMS model of the two countries is as follows:
Δ q = i S i 0 Δ Q i + i Δ S i Q i 0 + i Δ S i Δ Q i
(Demand effect DE2) (Competitiveness effect CE2) (Second order effect SE2).
In Equation (2), the structural effect DE2 means that China’s demand for agricultural products leads to a change in the agricultural exports of B&R countries. The competitiveness effect CE2 indicates that the competitiveness of agricultural product exports of B&R countries leads to a change in export value. Second-order effect SE2 indicates that the interaction between China’s agricultural demand and the export competitiveness of B&R countries leads to the change of agricultural exports of B&R countries.
Δ q = S 0 Δ Q + i S i 0 Δ Q i S 0 Δ Q + Δ SQ 0 + i Δ S i Q i 0 Δ SQ 0 + Q 1 Q 0 1 i Δ S i Δ Q i + i Δ S i Δ Q i Q 1 Q 0 1 i Δ S i Δ Q i
(Scale demand effect SDE2) (Product demand effect PDE2) (Scale competitiveness effect SCE2) (Product competitiveness effect PCE2) (Scale second-order effect SSE2) (Product second-order effect PSE2)
In Equation (3), the Demand effect DE2 is decomposed into Scale demand effect SDE2 and Product demand effect PDE2. The growth effect refers to the change in the agricultural product export volume of B&R countries caused by the change in China’s agricultural product demand, and the product effect refers to the change in the agricultural product export volume of B&R countries. The competitiveness effect CE2 is decomposed into the scale competitiveness effect SCE2 and the product competitiveness effect PCE2. Scale competitiveness effect SCE2 indicates the change in export value due to the change in the overall competitiveness of agricultural exports of B&R countries; the product competitiveness effect PCE2 indicates the change in export value due to the change in product competitiveness of B&R countries. The second-order effect SE2 is decomposed into scale second-order effect SSE2 and product second-order effect PSE2, where the scale second-order effect SSE2 represents the change in export value due to the cross effect of the change in export competitiveness of B&R countries and the change in the scale of China’s agricultural imports; the product second-order effect PSE2 represents the change in export value due to the cross effect of the change in agricultural export competitiveness of B&R countries and the change in the structure of China’s agricultural imports.
In Equations (2) and (3), q represents the export of agricultural products from B&R countries to China. Q represents the amount of China’s agricultural imports. Q i represents the import amount of Category i agricultural products of China. S represents the proportion of agricultural exports of B&R countries in China’s agricultural imports. S i represents the proportion of category i agricultural exports of B&R countries to China’s category i agricultural imports. 0 indicates the base year. 1 represents the final year. Δ is the change between the end of the period and the base period.
In order to further analyze the trade changes before and after the three important time points after China’s accession to the WTO, the global financial crisis, and the “Belt and Road” initiative, this paper selects the agricultural trade data between China and B&R countries from 2001 to 2020. Briefly, 2008, 2009, 2010, and 2013 as the boundary, and divide the period of 2001–2019 into four time periods: 2001–2007, 2008–2009, 2010–2013, and 2014–2020. In analyzing the regions and types of agricultural products, in order to highlight the key information, this paper is divided into two phases before and after the ”Belt and Road” initiative was proposed in 2013.

3. Results

3.1. Holistic Analysis

3.1.1. Empirical Results of China’s Agricultural Exports to B&R Countries

According to Table 1, from the four time periods as a whole, the demand effect DE1 plays a weaker and weaker role in promoting China’s exports, and the structural effect SE1 and competitiveness effect CE1 play an increasing role. In terms of demand effect DE1, from 2001 to 2007, the demand effect of agricultural products from B&R countries was the main driving force for China’s agricultural exports, accounting for 48.48%, but after the global economic crisis broke out in 2008, the demand for agricultural products from B&R countries shrank sharply and became the main hindering factor for China’s agricultural exports, after the economic crisis recovered, the demand effect became the main driving factor for China’s agricultural exports from 2010 to 2013, accounting for 76.12%. while the “Belt and Road” initiative has been proposed so far, the demand effect of B&R countries is again the main factor hindering China’s agricultural exports, accounting for −9.20%.
In terms of structural effect SE1, the structural effect that affected China’s exports before the financial crisis is weak, accounting for −0.78%, among which the product structure effect plays a positive pulling role and the market structure effect plays a negative hindering role. After the financial crisis, the structural effect is one of the reasons for China’s export growth, accounting for 29.02%, among which the product structure effect plays a major role accounting for 31.18%, while the market effect still negatively hinders China’s exports. 2010–2013, the role of structural effect on China’s exports is still weak, accounting for −1.14%. After the “Belt and Road” initiative, the role of the structural effect increased, accounting for 33.84%, with the market structure effect exceeding the product structure effect for the first time, accounting for 19.95% of the market structure effect and 13.89% of the product structure effect.
In terms of the competitiveness effect CE1, the competitiveness effect has been promoting China’s exports for four periods, among which the market competitiveness effect and the product competitiveness effect play roughly the same role. Especially after the “Belt and Road” initiative was proposed, the contribution of competitiveness effect is more than 2/3, and during the financial crisis, the competitiveness effect is the biggest driving force to promote China’s exports. 2001–2007, the competitiveness effect is the contribution of 52.37% to promote China’s exports. During the financial crisis in 2008, the competitiveness effect was the biggest contribution of 232.49% to promote China’s exports. During the financial crisis in 2008, the competitiveness effect contributed the most, accounting for 232.49%, and especially after the “Belt and Road” initiative, the competitiveness effect still contributed the most, accounting for 75.41%.

3.1.2. Empirical Results of B&R Countries Export Agricultural to China

According to Table 2, from the overall perspective of the four time periods, the Chinese agricultural demand effect DE2 has the largest role in boosting the exports of B&R countries, while the competitiveness effect CE2 and the second-order effect SE2 have gradually increased after the “Belt and Road” initiative.
In terms of demand effect DE2, after China’s accession to the WTO, China’s demand effect is the biggest driving force to pull the exports of B&R countries, accounting for 111.41%, among which China’s demand scale effect plays a decisive role, accounting for 80.66%, indicating that China’s demand for agricultural products from B&R countries is mainly based on rigid demand. After the outbreak of the financial crisis, the decrease in demand for Chinese agricultural products is the biggest factor hindering the agricultural exports of B&R countries, accounting for 138.91%, which plays a major role in hindering the decrease in the scale of demand for Chinese agricultural products, although the product effect of Chinese demand is pulling the exports of B&R countries, the effect is smaller compared to the scale effect of demand. In both phases, 2010–2013 and 2014–2020, China’s agricultural demand effect pulls the exports of B&R countries, among which the scale demand effect plays a decisive role, accounting for 212.93% and 105.48% respectively, but the role of product demand effect has been a negative impediment, −97.42% and −32.93%, respectively.
In terms of the competitiveness effect CE2, when the global financial crisis hit, the competitiveness effect was the main factor promoting the export growth of B&R countries, and the positive pulling effect has increased in recent years. 2001–2007, the competitiveness effect played a small role, accounting for 1.16%, but in 2008, the financial crisis, the competitiveness effect was the main factor to promote the exports of B&R countries, positively pulling exports of USD 0.37 billion, of which the scale competitiveness effect played the largest role, accounting for USD 0.24 billion. 2010–2013, the scale effect of B&R countries again negatively hindered exports, accounting for −12.39%, of which the scale competitiveness effect plays a leading role, accounting for −33.30%, and the product competitiveness effect plays a facilitating role, accounting for 20.91%, but the overall competitiveness effect is still negative. After the “Belt and Road” initiative, the competitiveness effect positively boosts the exports of B&R countries, among which the scale competitiveness effect is the main promotion effect, accounting for 15.58%, but the product competitiveness effect is in turn a hindrance effect, accounting for −0.25%.
In terms of the second-order effect SE2, the second-order effect is a hindrance in the three phases of 2001–2007, 2008–2009, and 2010–2013, and is promoted in 2014–2020, indicating that there is a mismatch between the effect of export competitiveness of the B&R countries and the effect of China’s import demand in the early stage, but with the “Belt and Road” initiative, the combined force of export competitiveness of B&R countries and China’s agricultural demand gradually promotes the exports of B&R countries, in which the second-order effect of products plays a major role.

3.2. Regional Distribution Analysis

3.2.1. Empirical Results of China’s Exports Agricultural to Regions along B&R Countries

According to Table 3, before the “Belt and Road” initiative, China’s exports to the six regions of Mongolia Russia, Central Asia, Southeast Asia, South Asia, West Asia, the Middle East, and Central and Eastern Europe were positively pulled by the demand effect DE1, structural effect SE1 and competitiveness effect CE1 as a whole; after the “Belt and Road “initiative, China’s exports to Southeast Asia were positively pulled by the demand effect DE1, structural effect SE1 and competitiveness effect CE1, but the regions of Mongolia Russia, Central Asia, South Asia, and Central and Eastern Europe were negatively hindered by the competitiveness effect CE1.
Demand effect DE1, before the “Belt and Road” initiative, the demand effect of Mongolia Russia, Central Asia, Southeast Asia, South Asia, West Asia, the Middle East, Central and Eastern Europe six regions are positive to pull China’s exports, including Mongolia Russia, Central Asia, West Asia, the Middle East, and Central and Eastern Europe demand effect contribution rate of more than 50%. After the “Belt and Road” initiative, the demand effect of Mongolia Russia, South Asia, West Asia, and the Middle East absolute amount of USD −0.62 billion, USD −0.23 billion, and USD −0.43 billion, hindering China’s exports, but the demand effect of Central Asia, Southeast Asia, and Central and Eastern Europe region still pull China’s exports, absolute amount of USD 0.16 billion, USD 2.75 billion, and USD 0.18 billion.
Structural effect SE1, before the “Belt and Road” initiative, the structural effect of Mongolia Russia, Central Asia, Southeast Asia, South Asia, West Asia, the Middle East, Central and Eastern Europe six regions are positive to pull China’s exports, but the impact is limited, the maximum contribution accounted for no more than 30%. After the “Belt and Road” initiative, the structural effect of Mongolia Russia, Southeast Asia, South Asia, West Asia and the Middle East, Central and Eastern Europe region to promote China’s main driving force, only the structural effect of Central Asia to hinder China’s exports, the negative pull of USD 0.16 billion.
Competitiveness effect CE1, before the “Belt and Road” initiative, in addition to Central and Eastern Europe, Mongolia Russia, Central Asia, Southeast Asia, South Asia, West Asia and the Middle East and other regions competitiveness effect are positive to pull China’s exports, of which Southeast Asia, South Asia competitiveness effect is the main driving force, the contribution rate of more than 60%. After the “Belt and Road” initiative, only Southeast Asia, West Asia, and the Middle East competitiveness effect for the promotion of the role, respectively, USD 2.261 billion, USD 0.32 billion, Central Asia, South Asia, Central and Eastern Europe competitiveness effect is the main factor hindering China’s exports, the contribution rate of nearly 100%.

3.2.2. Empirical Results of Regions along B&R Countries Export Agricultural to China

According to Table 4, the demand effect DE2 in Mongolia Russia, Central Asia, Southeast Asia, South Asia, West Asia-Middle East, and Central and Eastern Europe has been promoting exports to China, but the overall contribution share tends to decrease, and the competitiveness effect CE2 generally turns from a negative impediment to China’s exports to a positive pull, and the contribution share is increasing.
Demand effect DE2, before the “Belt and Road” initiative, the demand effect of Mongolia and Russia, Central Asia, Southeast Asia, South Asia, West Asia, the Middle East, and Central and Eastern Europe play a major role in promoting the demand effect, accounting for more than 54%. After the “Belt and Road” initiative, the demand effect still promotes all regional exports, but the contribution rate of the demand effect of Mongolia Russia, Central Asia, South Asia, West Asia, and the Middle East, Central and Eastern Europe have all dropped to less than 50%, only Southeast Asia is still the main role in promoting, with a contribution rate of 125.37%.
Competitiveness effect CE2, before the “Belt and Road” initiative, the competitiveness effect of Mongolia Russia, Central Asia, Southeast Asia, West Asia, and the Middle East hindered exports to China, while South Asia and Central and Eastern Europe played a small role in promoting, but the contribution rate was no more than 3%. After the “Belt and Road” initiative, the competitiveness effects of Mongolia and Russia, Central Asia, South Asia, West Asia and the Middle East, and Central and Eastern Europe have been promoted, and the contribution rate has increased significantly compared with that before the initiative, 44.29%, 82.07%, 34.67%, 38.54%, and 61.83%, respectively, while only the competitiveness effects of Southeast Asia hinders exports to China, with a contribution rate of −26.05%.
Second-order effect SE2, most regions have opposite second-order effects before and after the “Belt and Road” initiative. Before the initiative, the second-order effects in Mongolia Russia, Southeast Asia, and the Middle East in West Asia acted as a hindrance, and after the initiative, the three regions acted as a facilitator; before the initiative, the second-order effects in Central Asia acted as a facilitator, and after the initiative, they acted as a hindrance, while the second-order effects in South Asia and Central and Eastern Europe have always acted as a facilitator.

3.3. Product Type Distribution Analysis

3.3.1. Empirical Results on the Types of China Exports Agricultural to B&R Countries

According to Table 5, China’s exports of animal, fruit and vegetable, and processed agricultural products to B&R countries are gradually affected by the competitiveness effect CE1 and structural effect SE1, and gradually decreased by the demand effect DE1.
Demand effect DE1, before the “Belt and Road” initiative, the demand effect promoted China’s exports of animal, fruit and vegetable, and processed products with a contribution rate of more than 40%, but after the “Belt and Road” initiative, the demand effect of animal, fruit and vegetable products was negative, with an absolute amount of USD −0.27 billion and USD −0.52 billion, respectively, hindering China’s exports. However, after the “Belt and Road” initiative, the demand effect of animal and fruit and vegetable products is negative, with the absolute amount of USD −0.27 billion and USD −0.52 billion, respectively, which hinders China’s exports.
Structural effect SE1, before the “Belt and Road” initiative, the contribution rate of structural effect to promote China’s exports of animal, fruit and vegetable, and processed products were less than 6%, but after the initiative, the contribution rate of structural effect to promote all three types of agricultural products increased, 60.36%, 35.91%, and 8.81% respectively.
Competitiveness effect CE1, before the “Belt and Road” initiative, the competitiveness effect promoted China’s exports of animal, fruit and vegetable, and processed products with a contribution rate of more than 46%, but after the initiative, animal products hindered China’s exports with an absolute amount of USD −0.76 billion, while fruit and vegetable, and processed products promoted China’s exports with a contribution rate of 74.49% and 81.34%, respectively.

3.3.2. Empirical Results on the Types of B&R Countries Export Agricultural to China

According to Table 6, the demand effect DE2 has been promoting the export of animal, fruit and vegetable, and processed products to B&R countries, but the contribution rate gradually decreases, and the competitiveness effect CE2 has changed the role of exporting animal, fruit and vegetable, and processed products to B&R countries from negative hindrance to positive promotion, and the contribution rate gradually increases.
Demand effect DE2, before the “Belt and Road” initiative, the demand effect promoted the export of animal, fruit and vegetable, processed products B&R countries of the biggest pull, a contribution rate of more than 92%, but after the initiative, the three types of agricultural products demand effect is still positive, but the contribution rate has decreased, not more than 83%.
Competitiveness effect CE2, before the “Belt and Road” initiative, the absolute value of the competitiveness effect to promote the export of animal, fruit and vegetable, and processed products from B&R countries were all negative, which played a hindering role in the export of B&R countries, but after the Initiative, the competitiveness effect of all three types of agricultural products was positive, with 31.14%, 6.52%. However, after the initiative, the competitiveness effect of all three categories of agricultural products is positive, with 31.14%, 6.52%, and 15.71%, respectively.
The second-order effect of SE2, before the “Belt and Road” initiative, the second-order effect hinders the export of animal, fruit and vegetable products from B&R countries, but promotes the export of processed products from B&R countries. “After the “Belt and Road” initiative, the second-order effects promote the export of three types of agricultural products from B&R countries.

4. Discussion

4.1. Comparison of the Results of This Paper with the Existing Literature

The findings of this paper are consistent with the existing literature, e.g., Yue-Yuan Yang and Chi-Ming Huang (2019) conclude that the market demand-induced effect is the main factor for the growth of China’s agricultural exports to Vietnam, followed by the market structure effect, while the market competitiveness effect limits the growth of China’s agricultural exports to Vietnam; the market demand induced effect is also the main factor for the growth of Vietnam’s agricultural exports to China, followed by the market demand induced effect is also the main factor for the growth of Vietnam’s agricultural exports to China, followed by the market competitiveness effect, while the market structure effect is low in comparison [31]. According to Guo Yanjing and Xiao Haifeng (2021), in terms of China’s agricultural exports, the increase in demand for agricultural imports from SCO member countries is the primary factor leading to the growth of China’s agricultural exports, and both the structural effect and the competitiveness effect have a positive contribution to the growth of China’s agricultural exports, but the adaptability of the agricultural export structure has gradually decreased in recent years, leading to a gradual decrease in the role of the structural effect. As for agricultural exports, the increase in import demand for Chinese agricultural products is the main factor to promote the growth of agricultural exports of SCO member countries, while the unreasonable structure of agricultural exports and the decline of export competitiveness jointly hinder the growth of agricultural exports [32]. Yao, Chen-Min, and Xu, Xing-Kai (2021) found that the demand effect is the main factor promoting export growth in the first three stages of China’s agricultural exports, and the fourth stage becomes the structural interaction effect, while the commodity effect hinders export growth; in the case of Eastern European countries’ agricultural exports, the overall competitiveness advantage is the dominant factor driving export growth in the fourth stage, and the growth effect and commodity effect also play a positive pulling role [17]. All the above literature proves that the demand effect is the main factor affecting the exports of China and some countries or regions along the route, which is consistent with the findings of this paper.
However, the findings of this paper differ from the existing literature in the following ways:
(1)
In terms of methodology, combining the modified multi-country multi-product CMS model with the two-country multi-product CMS model to measure trade volatility factors can maximize the useful information on market structure effects and factor decomposition of import trade influences, e.g., Cao and Tong (2018), Feng and Li (2022) both used a multi-country multi-product CMS model to analyze United States exports and Chinese exports of agricultural products from the RCEP region, but did not analyze the factor decomposition of import trade fluctuations and did not further analyze the factors affecting import trade by combining the principle of bilateral equivalence of import and export trade [14,15]. Liu and Xiao (2018), Yao and Xu (2021) used a two-country multi-product CMS model to analyze the factors of import and export trade volatility between China and Central and Eastern European countries, but Central and Eastern European countries are composed of 16 countries and trade growth is influenced by market effects, but using a two-country multi-product CMS model assumes 16 countries as one country, and the conclusions drawn from the study ignore the market effects. Therefore, according to the actual situation of import and export, the combination of the two analysis methods can yield more valuable information [16,17].
(2)
In terms of the sample of agricultural products, it is not limited to a specific agricultural product, but takes all agricultural products as the research object, and categorizes agricultural products to explore the trade volatility factors, which makes the research sample size more comprehensive and detailed and is conducive to more comprehensive conclusions. For example, aquatic products, cereals, grains, pork, apples, and corn, respectively [9,17,18,19,20,21,22], but the sample size of the study is not broad enough to reflect the overall agricultural trade fluctuation factors, although China’s exports to BRICS countries, Japan, Latin American countries, ASEAN, RCEP, and United States trade fluctuations with overall agricultural products samples, respectively [23,24,25,26,27,28,29], and the sample size of the study area is narrow, which cannot reflect China’s cooperation with B&R countries as a whole the situation.
(3)
In terms of regional samples, it is not limited to some regions, but takes all B&R countries as the research objects, and explores the trade volatility factors among different regions based on the overall sample and classified by regions. The existing literature, which does not classify the overall agricultural products, is again decomposed to explore the factors of specific agricultural trade fluctuations. Yang and Huang (2019), Yao and Xu (2021), Guo and Xiao (2021) explored the overall agricultural trade volatility of Vietnam, Eastern European countries, and SCO members [16,30,31], but took some representatives of B&R countries as examples. However, the trade fluctuation factors of different regions were not analyzed in a disaggregated manner with all countries as the sample.

4.2. Food Security Cooperation between China and B&R Countries

The current global climate change, the Russia–Ukraine conflict, and the spread of COVID-19 have hindered world food production, distribution, and trade. Based on the results of this paper, we propose the future direction of global food security cooperation, taking the trade between China and B&R countries as an example.
First, the conclusion of overall agricultural trade between China and B&R countries shows that the world is experiencing major unexpected events, similar to the global financial crisis in 2008, and according to the results, improving the competitiveness of agricultural products and enhancing the diversified trade structure are the main ways to alleviate trade difficulties. Improving competitiveness mainly includes: protecting and scaling up the use of arable land, ensuring that the total amount of arable land is increased, scaling up the use of arable land and improving mechanization utilization; increasing scientific and technological inputs, enhancing the efficiency of production factors such as seeds, fertilizers and pesticides, and improving the output of agricultural products per unit of arable land; improving the infrastructure of agricultural production, improving the utilization of natural resources, and reducing the labor costs of agricultural production and waste. Enhancing the globally diversified trade structure includes: locating agricultural products with national advantages, expanding agricultural products with comparative advantages in production, exporting advantageous products and importing inferior products; improving the rules of trade cooperation between China and B&R countries, reducing trade tariffs, and reducing the cost of bilateral cooperation.
Second, China and B&R countries by region agricultural trade analysis conclusions, China’s exports, after the “Belt and Road” initiative, China and B&R countries trade in Southeast Asia, Central Asia, Central and Eastern Europe is the demand in pulling China’s exports, Southeast Asia, West Asia Middle East is the competitiveness effect in promoting China’s exports, only the structural effect on the vast majority of regions have a catalytic role. Therefore: China’s exports to Southeast Asia have the largest market share, enhance the potential points, enhance China’s agricultural cooperation with Southeast Asia, is conducive to stabilizing the basic plate of cooperation between China and B&R countries; decentralize China’s exports to B&R countries of agricultural cooperation structure, reduce the systematic risk of exports, to play the comparative advantage of the market. As for China’s imports, China’s demand effect is an important factor to promote the exports of B&R countries, but competitiveness is the main factor hindering exports in Southeast Asia. Therefore, China should combine its own demand with the comparative advantage products of exporting countries, formulate preferential trade policies and stabilize cooperation channels, for example: Southeast Asia, Mongolia, and Russia. Second: actively carry out trade and investment cooperation in agricultural production factors, especially in Southeast Asia, to improve the agricultural productivity of trade partner regions and promote the global supply of agricultural production, which is also beneficial to China’s agricultural import demand.
Third, in terms of the types of agricultural products trade between China and B&R countries, after the “Belt and Road” initiative, the demand effect of B&R countries has a pulling effect on processed products and a hindering effect on animal, fruit and vegetable products; the structural effect of China’s exports promotes all three types of products; the competitiveness effect of China’s exports promotes fruit and vegetable products and processed products. The structural effect of China’s exports promotes all three types of products; the competitiveness effect of China’s exports promotes agricultural products of fruits and vegetables and processed products. Therefore, China should expand the production capacity of processed products and gradually upgrade animal, fruit and vegetable products to processed products to promote exports; optimize the market structure of the three types of products to B&R countries to highlight the market advantages of China’s exports; enhance the investment in science and technology of animal agricultural products to improve the competitiveness of animal agricultural products. In terms of China’s imports, China’s demand effect is still the main factor to promote the export of animal, fruit and vegetable, and processed products from B&R countries, and after the “Belt and Road” initiative, the competitiveness effect of the three types of agricultural products from B&R countries also pulls the export of B&R countries. Therefore: China should expand domestic demand for consumption and promote the demand market of agricultural products to B&R countries on the premise of complementary production advantages; China should enhance the production capacity cooperation projects with the advantageous agricultural industries of B&R countries, play the advantages of fixed production factors such as climate, arable land and water resources in different bilateral regions, and promote the mobile production factors such as bilateral seeds and technologies to improve the competitiveness of agricultural products.

4.3. Research Shortcomings and Possible Future Research Directions of This Paper

First, the research sample, the “Belt and Road” region is only subdivided into six regions, not specific to countries, which can be further analyzed to the main countries of China’s trade in the future, and more specific conclusions can be drawn; the sample of agricultural product types is divided into only three categories, without further specific classification, which can be analyzed more carefully in the future to analyze the trade fluctuation factors of different agricultural products, which is beneficial to provide a basis for specific agricultural trade.
Second, the study of the time chain only splits the time chain into two parts in order to highlight the factors of trade fluctuation between China and B&R countries before and after the “Belt and Road” initiative, but does not analyze the factors of trade fluctuation at different points of time in detail, and misses some valuable information. Future studies can divide the time chain into more stages and explore in detail the fluctuation factors of agricultural trade between China and B&R countries at different times.
Third, in terms of research methodology, this paper uses a quadratic decomposition of the CMS model, and the resulting decomposition findings are still not specific enough. Further derivations can be made in the future to explore the factors influencing the volatility of agricultural trade between China and B&R countries using a third-order or more specific approach.

5. Conclusions

This paper decomposes the fluctuations of China’s agricultural trade with B&R countries using the modified multi-country multi-product CMS model and the two-country multi-product CMS model. The results show that the demand effect DE1 of China’s exports to B&R countries gradually decreases, while the structural effect SE1 and the competitiveness effect CE1 gradually increase. The demand effect DE2 of B&R countries exporting agricultural products to China has been playing a major role, but it is gradually weakening, and the competitiveness effect CE2 and the second-order effect SE2 are gradually increasing. Southeast Asia has the largest share of trade between China and B&R countries. China’s exports to Southeast Asia are jointly driven by the demand effect DE1, structural effect SE1, and competitiveness effect CE1, among which the role of structural effect SE1 tends to increase, from 1.66% to 23.34%, and the competitiveness effect CE1 tends to weaken, from 62.19% to 34.58%. Among the regions along B&R countries, Southeast Asian exports to China are mainly driven by the demand effect DE2 and hindered by the competitiveness effect CE2, in which the role of demand effect DE2 gradually increases, from 109.17% to 125.37%, and the role of competitiveness effect CE2 gradually decreases, from −0.65% to −26.05%. Among the product categories of China’s trade with B&R countries, the largest share of growth in the trade of fruit and vegetable products. After the Belt and Road Initiative, the competitiveness effect CE1 of China’s exports to B&R countries plays a decisive role in animal, fruit and vegetable, and processed products, which promote the role of fruit and vegetable, processed products accounted for 74.49%, 81.34% respectively, and hinder the role of animal products, accounting for 118.62%. Meanwhile, the structural effect SE1 plays a pulling role for animals, fruit and vegetable, and processed products. The demand effect DE2 pulls the main role of animals, fruit and vegetables, and processed products in China’s exports to B&R countries, and the competitiveness effect CE2 gradually increases. This paper uses two methods of analysis that can be derived from the role of the structural effect of China’s exports and the factors of China’s import fluctuations, which is conducive to understanding China’s cooperation with B&R countries from both import and export aspects, and by classifying China’s trade with various regions and products in the B&R countries, it is conducive to providing a basis for China’s decision to strengthen food security cooperation in specific regions and products in B&R countries.

Author Contributions

Conceptualization, L.Z. and G.T.; methodology, L.Z. and G.T.; software, L.Z.; validation, L.Z. and L.H.; formal analysis, L.Z.; investigation, L.Z.; resources, L.Z.; data curation, L.Z.; writing—original draft preparation, L.Z., G.T., J.Q. and L.H.; writing—review and editing, L.Z., G.T., J.Q. and L.H.; visualization, L.Z., G.T., J.Q. and L.H.; supervision, G.T. and J.Q.; project administration, G.T.; funding acquisition, L.H. All authors have read and agreed to the published version of the manuscript.

Funding

The research was funded by Heilongjiang Provincial Philosophy and Social Science Office, grant number 18JLD310.

Institutional Review Board Statement

Not applicable.

Informed Consent Statement

Not applicable.

Data Availability Statement

The data presented in this study are available on request from the corresponding author.

Acknowledgments

The authors would like to thank the anonymous reviewers for their constructive comments and valuable suggestions on this article.

Conflicts of Interest

The authors declare no conflict of interest.

References

  1. Du, C.X.; Gao, M.; Han, L. A study on the impact of supply-side import-side changes on China’s food security. China Rural Econ. 2021, 1, 15–30. [Google Scholar]
  2. Daumantas, B. Salmon price volatility: A weight-class-specific multivariate approach. Aquac. Econ. Manag. 2016, 20, 24–53. [Google Scholar]
  3. Zhang, Y.; Du, W.T. Price fluctuations of fish resources trade between China and ASEAN: An example of frozen mackerel export prices. J. Natural Res. 2020, 35, 2191–2204. [Google Scholar] [CrossRef]
  4. Mohammad, R.H.; Madan, M.D.; Carole, R.E. Forecasting monthly catfish pond bank and feed prices. Aquac. Econ. Manag. 2019, 23, 86–110. [Google Scholar]
  5. Hugo, F.P.; Pilar, G.R. Asymmetric Price Volatility Transmission in the Spanish Fresh Wild Fish Supply Chain. Marine Res. Econ. 2020, 35, 65–81. [Google Scholar]
  6. Tian, M.H.; Wang, F.; Feng, Q.R. Research on the impact of international wood forest products price fluctuations on the volume of China’s wood forest products import and export trade. J. Agric. Fore. Econ. Manag. 2022, 21, 67–77. [Google Scholar]
  7. Song, Y.D.; Li, C.X. Study on the spillover effects of trade fluctuations of Chinese dairy imports. Agric. Econ. Issues 2022, 07, 64–80. [Google Scholar]
  8. Ewald, C.O.; Haugom, E.; Kanthan, L.; Lien, G.; Salehi, P.; Størdal, S. Salmon futures and the Fish Pool market in the context of the CAPM and a three-factor model. Aquac. Econ. Manag. 2022, 26, 171–191. [Google Scholar] [CrossRef]
  9. Sun, Z.L.; Li, X.D. Trade size, trade structure, trade competitiveness and changes in China’s grain trade-an empirical analysis based on a modified CMS model. Int. Econ. Trade Explor. 2015, 31, 34–46. [Google Scholar]
  10. Zhang, S.J.; Ding, X.Q. Growth patterns of inter-provincial transfer out in China: Drivers, multi-layer decomposition and competitiveness dissection. Quantitative Econ. Tech. Econ. Res. 2020, 37, 99–118. [Google Scholar]
  11. Tyszynski, H. World Trade in Manufactured Commodities, 1899–19501. Manch. School 1951, 19, 272–304. [Google Scholar] [CrossRef]
  12. Jepma, C.J. Extensions and Application Possibilities of the Constant Market Shares Analysis. The Case of the Developing Countries’ Export. Doctoral Dissertation, University Groningen, Groningue, The Netherlands, 1986. [Google Scholar]
  13. Milana, C. Constant-market-shares analysis and index number theory. Eur. J. Political Econ. 1988, 4, 453–478. [Google Scholar] [CrossRef]
  14. Cao, X.P.; Tong, J.X. Dynamic decomposition of the causes of United States agricultural export volatility. J.S. China Agric. Univ. 2018, 17, 92–103. [Google Scholar]
  15. Feng, Z.X.; Li, C. Analysis of China’s competitive advantages and drivers of agricultural exports in the context of RCEP. J. Xi’an Jiaotong Univ. 2022, 42, 53–64. [Google Scholar]
  16. Liu, C.P.; Xiao, H.F. Research on the causes of growth of agricultural trade between China and 16 Central and Eastern European countries—An empirical analysis based on CMS model. Agric. Technol. Econ. 2018, 9, 135–144. [Google Scholar]
  17. Yao, C.M.; Xu, X.K.; Wang, Y. Dynamic decomposition of the causes of agricultural trade growth between China and Eastern European countries. Stat. Deci. 2021, 37, 155–159. [Google Scholar]
  18. Zhang, J.Q.; Lin, L. Analysis of growth factors of bilateral trade of aquatic products between China and ASEAN. Bus. Res. 2014, 73–80. [Google Scholar]
  19. Yang, Z.H.; Zhang, J.B.; Yang, C.X.; Lu, Z.H.; Chen, X.J. Analysis of factors influencing trade fluctuations of Chinese cephalopod exports. Marine Lake Marsh Bull. 2021, 43, 139–146. [Google Scholar]
  20. Li, L.; Mu, Y.Y. A study on the decomposition of China-Australia grain trade and its influencing factors based on CMS model. Inter. Econ. Trade Explor. 2015, 31, 20–30. [Google Scholar]
  21. Cui, C.X.; Wang, K.; Gao, F. Research on the influencing factors of China’s pork export volatility. Stat. Deci. 2015, 21, 127–130. [Google Scholar]
  22. Wang, D.; Gao, D.; Bao, L.M. Analysis of the reasons for the decline of international competitiveness of China’s apple products. Agric. Technol. Econ. 2017, 9, 58–65. [Google Scholar]
  23. Guo, X.P.; Liu, S. Study on W-shaped fluctuations and trade effects of China’s corn import and export. Econ. Vertical 2021, 7, 102–109. [Google Scholar]
  24. Li, P. Research on dynamic fluctuation of China’s export trade growth to BRICS countries—Factor decomposition and measurement based on CMS model. Inter. Trade Issues 2015, 5, 82–91. [Google Scholar]
  25. Zhang, G.M.; Zong, Y.X. Analysis of factors influencing China’s agricultural export trade to other BRICS countries. Stat. Deci. 2019, 35, 149–153. [Google Scholar]
  26. Xiao, Y.; Zheng, X.D. Research on the characteristics and causes of the growth of China-Japan agricultural trade. J. Hunan Univ. 2016, 30, 79–85. [Google Scholar]
  27. Liu, C.P. Analysis of the causes of agricultural trade fluctuations between China and Latin American countries. J. S. China Agric. Univ. 2017, 16, 132–140. [Google Scholar]
  28. Chen, J.; Hou, C.L.; Song, Y. A study on the factors influencing China’s agricultural exports to ASEAN. Inter. Trade Issues 2017, 11, 36–47. [Google Scholar]
  29. Ge, M.; Gao, Y.D. Study on the fluctuation factors of China’s agricultural exports to RCEP. Stat. Inf. Forum 2021, 36, 41–51. [Google Scholar]
  30. Liu, S.Y.; Li, D.H. Analysis of the causes of tea export trade volatility in China to the United States market—Based on the modified CMS model. Tea Sci. 2021, 41, 876–888. [Google Scholar]
  31. Yang, Y.Y.; Huang, Z.M. Study on the factors influencing the growth of China-Vietnam agricultural trade under the “Belt and Road” initiative: An analysis based on the modified CMS model. World Agric. 2019, 8, 4–10. [Google Scholar]
  32. Guo, Y.J.; Xiao, H.F. Analysis of factors influencing the fluctuation of agricultural trade between China and SCO member states in the context of “Belt and Road”. J. Xinjiang Univ. 2021, 49, 48–57. [Google Scholar]
  33. Han, D.; Li, G.S. Evolution of food trade patterns and influence mechanisms between China and countries along the “Belt and Road”-based on social network science perspective. Agric. Econ. Issues 2020, 8, 24–40. [Google Scholar]
  34. Chen, Y.S. Effects of Chinese agricultural exports and trade prospects in RCEP FTA: An empirical analysis based on stochastic model and market segmentation. China Circ. Econ. 2022, 36, 56–66. [Google Scholar]
Figure 1. (a) Evolution of trade volume between China and B&R countries; (b) evolution of trade growth rate between China and B&R countries. Data Source: UN COMTRADE database.
Agriculture 12 01850 g001
Figure 2. (a) China exports agricultural to B&R countries regional distribution; (b) China imports agricultural to B&R countries regional distribution. Data Source: UN COMTRADE database.
Agriculture 12 01850 g002
Figure 3. (a) China exports agricultural to B&R countries product distribution; (b) China imports agricultural to B&R countries product distribution. Data Source: UN COMTRADE database.
Agriculture 12 01850 g003
Table 1. China’s agricultural exports to B&R countries fluctuates decomposition.
Influencing Factor2001–20072008–20092010–20132014–2020
Export Value (b. USD)Contribution (%)Export Value (b. USD)Contribution (%)Export Value (b. USD)Contribution (%)Export Value (b. USD)Contribution (%)
Change in export volume5.07 100.000.56 100.005.36 100.006.23 100.00
1. Demand effect DE12.4648.48−0.92−165.534.0876.12−0.57−9.20
2. Structure effort SE1−0.04−0.780.1629.02−0.06−1.142.1133.84
Market structure effort MSE1−0.06 −1.11−0.01 −2.160.02 0.351.24 19.95
Product structure effort PSE10.02 0.330.17 31.18−0.08 −1.480.87 13.89
3. Competitive effort CE12.6552.371.30232.491.3324.774.7075.41
Market competitive effort MCE11.37 26.940.73 130.910.61 11.352.16 34.71
Product competitive effort PCE11.29 25.430.57 101.580.72 13.422.53 40.70
Table 2. B&R countries export agricultural to China fluctuations decomposition.
Influencing Factor2001–20072008–20092010–20132014–2020
Export Value (b. USD)Contribution (%)Export Value (b. USD)Contribution (%)Export Value (b. USD)Contribution (%)Export Value (b. USD)Contribution (%)
Change in export volume6.98 100.00−0.72 100.005.82 100.0013.37 100.00
1. Demand efforts DE27.78111.41−1.01138.916.72115.519.7072.55
Scale demand effect SDE25.63 80.66−1.15 158.3412.38 212.9314.10 105.48
Product demand effect PDE22.15 30.760.14 −19.43−5.67 −97.42−4.40 −32.93
2. Competitive effort CE20.081.160.37−50.67−0.72−12.392.0515.33
Scale competitiveness effect SCE20.40 5.730.24 −32.86−1.94 −33.302.08 15.58
Product competitiveness effect PCE2−0.32 −4.570.13 −17.811.22 20.91−0.03 −0.25
3. Second-order efforts SE2−0.88−12.58−0.0911.78−0.18−3.121.6212.12
Second-order effect of scale SSE2−1.71 −24.420.01 −1.12−0.12 −1.970.37 2.74
Product second-order effect PSE20.83 11.85−0.09 12.89−0.07 −1.151.26 9.39
Table 3. Regional distribution of China exports agricultural to B&R countries.
RegionInfluencing Factor2001–20132014–2020
Export Value
(b. USD)
Contribution (%)Export Value
(b. USD)
Contribution (%)
Mongolia RussiaChange in export volume1.81100.00−0.78100.00
Demand efforts DE11.05 58.24−0.62 78.87
Structure effort SE10.22 12.340.04 −5.11
Competitive effort CE10.53 29.42−0.21 26.23
Central AsiaChange in export volume0.42100.00−0.14100.00
Demand efforts DE10.21 50.400.16 −118.80
Structure effort SE10.12 28.45−0.16 115.64
Competitive effort CE10.09 21.16−0.14 103.16
Southeast AsiaChange in export volume10.34100.006.54100.00
Demand efforts DE13.95 38.172.75 42.08
Structure effort SE10.17 1.661.53 23.34
Competitive effort CE16.22 60.172.26 34.58
South AsiaChange in export volume0.91100.000.35100.00
Demand efforts DE10.23 25.20−0.23 −66.22
Structure effort SE10.02 1.990.91 256.81
Competitive effort CE10.66 72.81−0.32 −90.63
West Asia MiddleChange in export volume1.23100.000.24100.00
Demand efforts DE10.75 60.62−0.43 −179.51
Structure effort SE10.02 1.520.34 144.68
Competitive effort CE10.47 37.860.32 134.83
Central and Eastern EuropeChange in export volume0.67100.000.01100.00
Demand efforts DE10.64 95.680.18 1492.2
Structure effort SE10.13 19.410.01 76.02
Competitive effort CE1−0.10 −15.1−0.17 −1468.22
Table 4. Regional distribution of B&R countries exports agricultural to China.
RegionInfluencing Factor2001–20132014–2020
Export Value
(b. USD)
Contribution (%)Export Value
(b. USD)
Contribution (%)
Mongolia RussiaChange in export volume1.02100.002.61100.00
Demand efforts DE22.13 208.270.98 37.50
Competitive effort CE2−0.22 −21.491.16 44.29
Second-order efforts SE2−0.89 −86.770.48 18.21
Central AsiaChange in export volume0.11100.000.19100.00
Demand efforts DE20.06 54.160.09 49.11
Competitive effort CE20.00 −2.840.16 82.07
Second-order efforts SE20.05 48.68−0.06 −31.18
Southeast AsiaChange in export volume13.98100.005.91100.00
Demand efforts DE215.27 109.177.41 125.37
Competitive effort CE2−0.09 −0.65−1.54 −26.05
Second-order efforts SE2−1.19 −8.530.04 0.68
South AsiaChange in export volume1.22100.001.63100.00
Demand efforts DE20.73 59.850.50 30.42
Competitive effort CE20.03 2.280.57 34.67
Second-order efforts SE20.46 37.870.57 34.91
West Asia MiddleChange in export volume0.14100.000.68100.00
Demand efforts DE20.28 200.690.14 20.02
Competitive effort CE2−0.01 −10.180.26 38.54
Second-order efforts SE2−0.13 −90.510.28 41.44
Central and Eastern EuropeChange in export volume0.76100.002.34100.00
Demand efforts DE20.62 81.130.58 24.85
Competitive effort CE20.02 2.121.45 61.83
Second-order efforts SE20.13 16.750.31 13.32
Table 5. Empirical results of the distribution of China exports agricultural to B&R countries.
CategoryInfluencing Factor2001−20132014−2020
Export Value
(b. USD)
Contribution (%)Export Value
(b. USD)
Contribution (%)
Animal productsChange in export volume2.46100.00−0.64100.00
Demand efforts DE11.25 50.68−0.27 41.74
Structure effort SE10.07 2.620.39 −60.36
Competitive effort CE11.15 46.70−0.76 118.62
Fruit and vegetable productsChange in export volume7.35100.004.95100.00
Demand efforts DE13.00 40.84−0.52 −10.40
Structure effort SE10.39 5.271.78 35.91
Competitive effort CE13.96 53.883.69 74.49
Processed productsChange in export volume5.56100.001.92100.00
Demand efforts DE12.25 40.390.19 9.85
Structure effort SE1−0.01 −0.200.17 8.81
Competitive effort CE13.33 59.821.56 81.34
Table 6. Empirical results of the distribution of B&R countries export agricultural to China.
CategoryInfluencing Factor2001–20132014–2020
Export Value
(b. USD)
Contribution (%)Export Value
(b. USD)
Contribution (%)
Animal productsChange in export volume1.76100.003.82100.00
Demand efforts DE22.81 159.851.79 46.86
Competitive effort CE2−0.20 −11.441.19 31.14
Second-order efforts SE2−0.85 −48.410.84 22.00
Fruit and vegetable productsChange in export volume13.67100.006.96100.00
Demand efforts DE214.60 106.795.77 82.90
Competitive effort CE2−0.05 −0.350.45 6.52
Second-order efforts SE2−0.88 −6.430.74 10.59
Processed productsChange in export volume1.81100.002.59100.00
Demand efforts DE21.68 92.792.14 82.58
Competitive effort CE2−0.03 −1.900.41 15.71
Second-order efforts SE20.17 9.110.04 1.71
Publisher’s Note: MDPI stays neutral with regard to jurisdictional claims in published maps and institutional affiliations.

