Article

Impacts of Green Production Behaviors on the Income Effect of Rice Farmers from the Perspective of Outsourcing Services: Evidence from the Rice Region in Northwest China

1
School of Agricultural, Ningxia University, Yinchuan 750021, China
2
School of Economics and Management, Ningxia University, Yinchuan 750021, China
*
Author to whom correspondence should be addressed.
Agriculture 2022, 12(10), 1682; https://doi.org/10.3390/agriculture12101682
Submission received: 11 August 2022 / Revised: 4 October 2022 / Accepted: 11 October 2022 / Published: 13 October 2022

Abstract

:
Along with the increasingly prominent contradiction between agricultural development and a healthy ecological environment, the adoption of agriculture green production (AGP) methods has become an important measure to reduce excessive pesticide application, avoid ecological environmental pollution and promote sustainable agricultural development. However, few studies have explored the impact of green production behaviors on the revenue effect from the perspective of outsourcing services, and existing studies have not subdivided outsourcing into multiple categories to examine their impact. In this study, the first-hand data of 447 rice farmers in Ningxia and Shaanxi in northwest China were collected. By using the endogenous switching regression model (ESR), we focuses on the influence of rice farmers’ AGP behaviors on their income effect, and analyzed whether outsourcing service categories can promote rice farmers’ AGP behaviors and income. The results showed that outsourcing services significantly promoted AGP behaviors and the income of rice farmers. Specifically, outsourcing pesticide application showed the greatest effect on the reduction of pesticide usage, rice harvesting after a safe interval after pesticide application, and the income of rice farmers; weeding and harvesting outsourcing had less effect. These indicate that outsourcing services can improve environmental and economic benefits by reducing pesticide input costs, to promote rice farmers to engage in AGP behaviors. Moreover, green production behaviors help to increase the income of rice farmers. If rice farmers who have not implemented AGP conduct physical control behaviors, their income will increase by 23.110%; the reduction of pesticide application ranks the second, and their income will increase by 5.970%. The implementation of rice harvesting at the safe intervals after pesticide application had the lowest degree of improvement, and the farmers’ income will increase by 4.505%. The study provides data for promoting outsourcing services and AGP in developing countries. Therefore, the government should further improve outsourcing services and AGP policies to maximize the income of rice farmers in low- and middle-income areas.

1. Introduction

In China, there are about 158 million rice farmers, accounting for 64.0% of the total number of farmers, so improving the income of rice farmers has become an important part of agricultural economic development [1]. However, excessive application of pesticides in rice production is often regarded as a key means to improve the income of rice farmers, which makes the contradiction between agricultural development and a healthy ecological environment increasingly prominent [2,3]. Huang et al. (2021) investigated the impact of pest control ability on pesticide overuse and pointed out that the pesticide overuse rate in rice production of China was as high as 57%, 2.5–3.7 times that of developed countries [4]. Excessive use of pesticides not only aggravates the three-dimensional pollution of water, soil, gas, and the ecosystem, but also increases the probability of people getting various chronic diseases. Therefore, how to effectively solve the environmental pollution, safety and health problems caused by excessive application of pesticides has become a top priority in improving quality of rice and increasing farmers’ income in China’s agricultural green development, which would further promote the transformation and high-quality development of agricultural green production (AGP).
Agricultural green production has become an effective way to improve the income of rice farmers and solve the problems of food security and damage to the ecological environment in China. It is a kind of sustainable production strategy for saving resources and protecting the agricultural ecological environment through reducing the chemical input before, during, and after production [5,6,7,8,9,10]. Among the strategies for this production mode are the reduction of pesticide usage and adoption of biological fertilizer. The usage of pesticides is reduced or even replaced to achieve the purpose of safe production by using physical control methods such as insecticidal lamps, sex attractants, and biological pesticides, combined with a series of green control technologies like tending and harvesting rice at the safe intervals of pesticides [11,12].
To curb the excessive use of chemical pesticides and improve AGP behaviors, the Chinese government has released a series of policy documents. For instance, the No. 1 Document of the Central Committee of 2021 proposed to continuously promote the reduction and efficiency improvement of chemical fertilizers and pesticides and promote the green prevention and control technology for crops. In the same year, the Ministry of Agriculture and Rural Affairs issued the Opinions on Promoting Green Development of Agriculture aiming to reduce the use of chemical fertilizers and pesticides and promote the high-quality development of agriculture. However, the effect of this policy on the rice planting practice is not obvious, mainly because rice farmers’ awareness of AGP is insufficient, which leads to excessive pesticide application. Outsourcing services provide solutions for rice farmers to prevent pesticide abuse due to lack of knowledge and skills. By 2021, the outsourcing rate of agricultural services in China reached 41.9%, an increase of 8.9% over 2015 [13,14]. Outsourcing services refers to transferring some agricultural production processes to third-party service organizations by taking advantage of the professionalism and separability of agricultural production processes, which could replace the manual production with more advanced mechanized equipment. It is regarded as an important management strategy to improve agricultural production efficiency [15,16]. Therefore, this study explored the impact of rice farmers’ green production behavior on their income from the perspective of outsourcing services, which has important practical significance and theoretical value.
Previous studies have proved that AGP has an important impact on farmers’ income. The adoption of AGP practices can increase agricultural net income by saving the cost of pesticide use and increasing crop yield [17,18,19]. For example, Biru et al. (2020) pointed out that adopting AGP technology can help reduce farmers’ poverty and add economic benefits [20]. Pratama et al. (2019) took Indonesian cocoa farms as an example and found that AGP practices increased crop yield and thus farmers’ income [21]. Reganold et al. (2016) found that green organic agriculture increased the profit margin by 22–35% compared with conventional agriculture based on a 40-year comparison of green organic and conventional agriculture covering 55 crops in five continents [22]. Green production can increase farmers’ income through the improvement of the comprehensive use of land, technology, and other means of production, and the reduction of the total input cost to the production process [23,24,25,26]. However, most of the existing literature focuses on the growers of cash crops such as vegetables and fruits, while the topic of whether AGP behaviors has an impact on rice farmers’ income still needs further detailed investigation.
In addition, as an important way to reduce farmers’ production costs, promote agricultural production efficiency, and increase farmers’ income, outsourcing services have also attracted attention in some research. Outsourcing services can make up for the shortage of farmers’ time and technology endowment, effectively improve agricultural productivity, increase crop yield, and improve farmers’ production and the operation income [27]. The welfare effects of outsourcing services on cotton farmers in Xinjiang, China and farmers in South Africa has been confirmed [28]. Because there are great differences in constraints and objective functions among different types of crops, the impact of outsourcing services on rice farmers is still unclear. Cai et al. (2021) focused on analyzing the major factors affecting outsourcing services based on the study of rice farmers in Fujian, China [29]. Nonetheless, whether outsourcing services can promote AGP behaviors and income of rice farmers is still unanswered. In addition, outsourcing the service of production processes is helpful to improve the efficiency of agricultural production and improve the welfare of agricultural business entities [30]. Outsourcing services apply in the whole process of rice production, including soil preparation, sowing, pest management and harvesting, etc. Some scholars divide outsourcing services into prenatal agricultural materials supply, mid-production technical services, and post-production sales services, and discuss farmers’ willingness to use outsourcing services [31,32]. However, most of the existing studies only took “whether to take outsourcing behaviors” as a whole variable, or only focused on the pest and disease processes of outsourced services. Few people have paid attention to the influence of outsourcing services during production on AGP behaviors and income. To make up for this defect, this study divided the outsourcing services into those for pesticide application, weeding, and harvesting, to better evaluate whether the specific outsourcing services affect the implementation of AGP behaviors of rice farmers and their income.
Based on the above, this study analyzed the impact of outsourcing services on rice farmers’ AGP behaviors and income. The specific objectives were as follows: (1) Explore how AGP behaviors of rice farmers affected their income. (2) Whether outsourcing services can promote rice farmers’ AGP behaviors and further affect their income was deeply studied. (3) Provide data for the relevant government departments to formulate policies that understand the outsourcing services and the characteristics of green production behaviors of rice farmers. The main contributions of this study were as follows: (1) It confirmed the positive impact of rice farmers’ AGP behaviors on income and supplements the existing evidence on the research of the influencing factors of rice farmers’ income. (2) It analyzed the promotion of outsourcing services on AGP behaviors and income of rice farmers. The conclusion has a certain value for promoting outsourcing service promotion and green production decision of rice farmers. (3) Using the ESR model to analyze the income difference between rice farmers’ choice and non-choice of AGP behaviors, the results are more comparative.

2. Theoretical Analysis Framework

2.1. Theoretical Analysis of the Impact of Outsourcing Services on AGP Behaviors of Rice Farmers

Agricultural outsourcing takes advantage of the specialization and separability of agricultural production processes, transfers part of agricultural production processes to third-party service organizations and replaces manual production with more advanced mechanized equipment [33]. Mechanization of weeding in production helps to reduce chemical input and increase yield [34,35]. Mechanized outsourcing services can accurately grasp the time and frequency of pesticide application, which is helpful to reduce the requirements of agricultural production on farmers’ production skills. Farmers hand over the harvesting process to specialized service organizations, to save production costs and improve the utilization efficiency of agricultural production factors [28,36]. Based on this, this study divided the production outsourcing services into pesticide application, weeding, and harvesting.
Outsourcing service organizations have a strong ability to collect and identify factor information, and can use professional knowledge to apply pesticides scientifically, thus reducing the possibility of excessive application [37]. The rice farmers with higher awareness of outsourcing services will choose whether to use them based on their own knowledge and the principle of maximizing family interests. Rice farmers receive training and guidance in agricultural production from outsourcing institutions, which can help them understand agricultural technology and production information, thus having a relatively objective and rational cognition of agricultural production links and prompting rice farmers to choose outsourcing services. When rice farmers choose outsourcing services, part of the original cost of purchasing chemical inputs will be converted into service fees to be paid to outsourcing organizations, which will have a “crowding out” effect on chemical input costs and help rice farmers to implement AGP behaviors [38]. In addition, rice farmers cannot guarantee the harvesting of rice at a safe interval after pesticide appliction during field management due to the increase of non-agricultural employment opportunities, which makes it easier to increase chemical input to avoid the risk of yield reduction [39]. Outsourcing services can help alleviate the threat of labor migration to the delay of rice management, ensure the timeliness of rice field production to achieve the optimal allocation of resources, and achieve a higher probability of AGP.

2.2. Mechanism of the Effect of AGP Behaviors on Rice Farmers’ Income from the Perspective of Outsourcing Services

The AGP behaviors of rice farmers regarding pesticide application refers to avoiding or reducing the application of various pesticides (pesticides and herbicides), adopting biological control methods combined with tending the crop, improving the comprehensive prevention and control of diseases and insect pests in safe intervals during rice harvesting, and finally ensuring that rice is free of pesticide residues during sales [40]. The income of rice farmers in agricultural production mainly comes from agricultural operations, therefore, changes in production input and factor allocation have a significant impact on the income of rice farmers. The changes in factor allocation mainly include changes in pesticide use and capital input structure. The use of AGP behaviors by rice farmers during pesticide application can reduce the total cost of pesticide input and realize a cost saving and increase income. The price of AGP technology is generally higher than that of ordinary agricultural products. Harvesting rice at safe intervals after pesticide application is the key to ensure that rice is free of pesticide residues, which is helpful to improve the rice quality and safety, and thereby increase the selling price of rice and affect the income of rice farmers. The adoption of physical control measures by rice farmers will affect rice quality and can result in higher sales profits through the market mechanism of high quality with better price, thus increasing the income of rice farmers. Therefore, based on the research of Luo et al., Ma et al. and Hu et al. [41,42,43], combined with the actual production situation in the investigation area, this study selected “whether there is the behavior of reducing pesticide application”, ”whether there is the behavior of harvesting rice at safe intervals after pesticide application” and ”whether there is the behavior of physical control” as the variables indicative of green production in the process of pesticide application.
When rice farmers have a complete or a fairly rich knowledge of their environment, they will analyze the costs and benefits before taking action [44], and use their own knowledge and experience to maximize pursuit of their interests as much as possible. Therefore, the decisions of rice farmers engaged in AGP depends on their subjective perception judgment and value evaluation after weighing and comparing the costs and benefits. The resultant high effect on income can improve the sustainability of their AGP behaviors. The conflict between production reality and the rational pursuit of rice farmers who are eager to implement AGP by reducing pesticide application, means they cannot achieve the goal due to the limitations of their own production level and cognitive ability [45]. However, outsourcing services provides a solution for rice farmers to avoid the overuse of chemical inputs due to lack of knowledge and skills and helps them understand AGP knowledge to obtain tangible and intangible resources [29,33]. When rice farmers have a rich knowledge about AGP, they will improve their awareness of green production and form value judgments on green production, so as to choose outsourcing services to promote AGP under the trend of production interests. At the same time, rice farmers choosing outsourcing services can replace the direct investment in production, which could realize the scale economies through farmland-scale operations, thus reducing chemical input and production costs but increasing their income [46].
Based on the above analysis, this study built a flow diagram of the impact of AGP behaviors of rice farmers on income from the perspective of outsourcing services (Figure 1). The theory of “economic man” clearly clarifies the path and mechanism of decision-making for the rice farmers, that is, external conditions → value evaluation → investment decision → income effect. This indicates that rice farmers evaluate the promotion of AGP behaviors on income according to their own situation from three considerations: reducing pesticide application, harvesting rice at safe intervals after pesticide application, and physical control behaviors. In addition, rice farmers choose outsourcing services through value evaluation, including three key explanatory variables: pesticide application outsourcing, weeding outsourcing, and harvesting outsourcing, which affect rice farmers’ AGP behaviors and income.

3. Materials and Methods

3.1. Study Area and Data Source

The selected areas in this study are located in Pingluo County in Ningxia and Yangxian County of Shaanxi Province, China (see Figure 2). The temperature difference between day and night in the rice growing season in Northwest China is 11~16 °C, which is the largest in China. The productivity of single-cropping rice is 700~950 kg/mu, ranking first in China. The reasons for choosing the areas were as follows: (1) Planting conditions are superior. Ningxia Hui Autonomous Region is in the middle and upper reaches of the Yellow River in northwest China. The special climate has made Pingluo a land of fish and rice in northwest China since ancient times. It has the reputation of “the Oasis Beyond the Great Wall”. Shaanxi Province is in the middle reaches of the Yellow River in northwest China. In this area, the daily average temperature is 23 °C, the daily average solar radiation is more than 16 MJ/m2, and the average relative humidity is 80.67%. All three indexes meet the climatic and ecological conditions for producing high-quality rice. (2) Rice yield ranks at the forefront for northwest rice region. In 2019, the total rice output in Ningxia was 550,900 t, ranking third in the northwest rice region. The total rice output in Shaanxi was 803,700 t, ranking second in the Northwest Rice Region. (3) The development of green organic rice is relatively mature. Pingluo County is the main rice producing area in Ningxia, which belongs to a temperate arid climate, with annual sunshine hours of 3072 h and annual average precipitation of 184 mm. Pingluo County produced 121,000 t of rice in 2019, accounting for 21.96% of Ningxia’s total rice output. The mechanization level of rice production in Pingluo County is over 98%, and 90% of rice farmers grow green organic rice in fertile fields every year. The main product of “Ningxia Rice” reflects the geographical indication of agricultural products in China. High-quality rice is one of the major characteristic industries in Pingluo County, Ningxia. Yangxian County, located in the Hanzhong Basin, is an important rice producing area in Shaanxi Province. In 2019, the total rice output was 140,000 t, and the main product of “Yangxian Black Rice” was a regional public brand. It is worth mentioning that the Ningxia’s regional economy is relatively backward, and rice is the main source of farmers’ income in Pingluo County of Ningxia. The rice yield in Shaanxi Province is relatively high, but the economy in this area is relatively developed, and rice farmers have various sources of income.
The data for this study came from survey data on the green production of rice in Ningxia Province and Shaanxi Province conducted by the research group in October 2021. Drawing lessons from the research methods of Inacio et al. [47] and Ahmad et al. [48], two sample counties, Pingluo County in Ningxia, and Yangxian County in Shaanxi Province, were selected for multi-stage stratified sampling. Multi-stage stratified sampling refers to the process being carried out in stages. First, the population is divided into several sub-populations (i.e., first-order units), and then the first-order units are divided into several smaller units (i.e., second-order units), which are divided in turn and selected as investigation units according to the principle of randomness. Considering the convenience of data collection, it was distributed proportionally according to multi-level stratification. Based on this, 455 rice farmers were identified as the research sample. Five towns with three villages in each town were randomly selected in each county, where 10 towns with 30 villages were included. Furthermore, 15 rice farmers in each village were selected for interviews to understand their specific situation. The questionnaire was designed by three PHD candidates and experts in the field of AGP practices of farmers. Based on the “China Rural Statistical Yearbook-2019” issued by the National Bureau of Statistics of China [49], the main evaluation criteria were the personal characteristics, family characteristics, green production and outsourcing of rice farmers. To ensure the rationality of the questionnaire, the research group conducted a preliminary test in the surrounding villages of Pingluo County and Yangxian County before the formal investigation. After that, two professors, three PhD candidates, and seven master students in related research fields, were invited to revise and supplement some interview questions. The formal questionnaire was finally formed after the discussions, which included the characteristics of rice farmers, the basic situation of families, the outsourcing services for each production process, the degree of green rice production, and the income from rice planting.
It should be noted that most of the subjects in this study were villagers who only speak local dialects. To maximally avoid the errors caused by language differences, the research group recruited local graduate students. Moreover, all researchers received unified professional training and simulated interviews to avoid misunderstanding in face-to-face communication before the formal investigation. The contact information of rice farmers was reserved after the questionnaire was completed, to check the information during the follow-up inspection. Finally, the collated data were inputted into a special database. A total of 455 questionnaires were distributed in this survey. After eliminating the samples with invalid and missing key variables, 447 valid questionnaires were obtained, accounting for 98.24% of the total samples. Among them, there were 238 and 209 samples from Pingluo County, Ningxia and Yangxian County, Shaanxi, accounting for 53.24% and 46.76% of the total, respectively.

3.2. Variable Selection

In this study, the implementation of AGP behaviors in 2020 and the net income of rice farmers were taken as explanatory variables. Three kinds of AGP behaviors were selected in the process of rice planting: reducing pesticide application, harvesting rice at safe intervals after pesticide application, and physical control behaviors. When rice farmers adopted one of the AGP behaviors, the variable was 1, otherwise it was 0. In addition, the net profit of rice sales of rice farmers in 2020 was selected to measure the income effect. Rice production costs mainly include seed production, pesticide (insecticide, herbicide), labor, and so on. Rice production income was the net profit value of actual sales income minus production cost.
The core explanatory variable was the outsourcing service of rice farmers in production. An outsourcing service is to contract a certain process of agricultural production to others, to liberate the labor force. Outsourcing of production processes can improve the cost efficiency of rice production by replacing family labor, and then increase the income of rice farmers [29]. Based on the research results of Zhang et.al. [34] and Freddy [50], this study also selected the outsourcing service of pesticide application, weeding and harvesting. If the sampled rice farmers chose a certain process to outsource during rice production, the variable value of that process was assigned to 1, otherwise it was assigned to 0.
In addition, as the key subject of AGP, farmers’ decision-making behavior, is influenced by many factors, previous studies have mainly discussed the influence of the individual [51], the family [52] and cognitive characteristics [53] on AGP and income. This study selected rice farmers’ characteristics, family characteristics, rice farmers’ cognition and regional dummy variables as dimensions, and set 12 indicators as other explanatory variables. Among them, the characteristics of farmers included four variables: age, gender, education level, and party members. Family characteristics included five variables: planting number, planting time, laborers, rice planting area, and land fragmentation. Rice farmers’ cognition included two variables: safety risk cognition and AGP cognition. Considering the differences in rice farmers’ cognition, the questionnaire was combined with a Likert five-level scale, and the value was between 1 and 5. The regional dummy variable was whether it was in Ningxia. A question in the questionnaire to measure the regional dummy variable of rice farmers was set as follows: “Is your rice planting area in Ningxia?” If the rice farmer answered “yes”, the value was assigned to 1; otherwise, the value was assigned to 0.
Finally, this study also selected instrumental variables to deal with endogenous problems. In this study, whether there are diseases and insect pests in rice and regional altitude were taken as the tool variables to the AGP model. In the process of rice planting, the value of diseases and insect pests was 1, otherwise it was 0. The altitude of the rice area was logarithmic. The main reasons for choosing these two kinds of instrumental variables were as follows: (1) Whether there are diseases and insect pests and the altitude of the region only affects the AGP behaviors of rice farmers, but not the final rice income. (2) Regional altitude can affect the growth and development of rice and the status of diseases and insect pests by affecting the temperature. When the incidence of rice diseases and insect pests is high, rice farmers tend to take pesticide application behaviors to resist the risk of yield loss.

3.3. Data Collection and Analysis

To test the stability and reliability of the collected data, SPSS27 software was used to analyze the reliability and validity of the data. Reliability analysis was used to measure whether the answer results of the samples were true and reliable. By adopting the same method to repeatedly measure the same object, the results were consistent. Cronbach’s Alpha above 0.7 indicates that the questionnaire data has good reliability [54,55]. Validity analysis focused on the validity of the information measured by the questionnaire, and confirmatory factor analysis (CFA) was used to judge whether the results were reasonable or not. A Clonbach coefficient of 0.778 can be considered as indicating good internal consistency. The KMO sample adequacy measure and the Bartlett sphericity test for the 22 observed variables show that the KMO value was above 0.8 and the significance level was less than 0.001, which shows that the questionnaire had good convergence validity. Based on this, we used the statistical software Stata15.1 to carry out empirical analysis of the data for each variable. The descriptive statistical data for each variable in this study are shown in Table 1.

3.4. Research Method

In this study, the endogenous switching regression model (ESR) was used to test the influence of green production on the income of rice farmers. Proposed by Lee [56] and Maddala [57], it is a modification of the Heckman selection model, which can only study the relationship between two variables and has sample selection bias. It is used mainly to avoid observable and unobservable factors and solve the selectivity bias and endogenous problems. It can comprehensively consider the selectivity deviation of choosing rice farmers with AGP and the heterogeneity of the two groups of people who choose them and can obtain effective consistent estimators. In the first stage, the endogenous switching regression model can effectively estimate the impact of outsourcing on the AGP decision of rice farmers, and in the second stage, it can effectively estimate the impact of outsourcing on the income of rice farmers who choose AGP or not, which is an ideal research method suitable for this study.
In this study, rice income is the product of the sum of rice yield and rice price subtracted by the rice input cost, and the effect on rice income of rice farmers is an output function influenced by many factors. The specific equation expression is shown in (1):
y = f ( G , O , X , θ ) + ε
In Equation (1), y represents the rice income of rice farmers; G means AGP of rice farmers, G = 1 means that rice farmers implement AGP, G = 0 indicates that rice farmers do not implement AGP. O indicates the outsourcing service of each process that affects the income of rice farmers, mainly including pesticide application outsourcing, weeding outsourcing and harvesting outsourcing; X indicates that the family and regional dummy variables affecting rice farmers’ income, mainly including personal characteristics, family characteristics, rice farmers’ cognition and regional dummy variables; θ represents the parameter vector to be estimated; ε is a random error term, and the distribution of the random error term satisfies E ( ε ) = 0 .

3.4.1. Econometric Model

The expected output of rice farmers’ income from rice can be defined as E ( y ) = f ( G , O , X , θ ) . Based on this, this paper takes rice farmers’ income from rice as the explanatory variable and analyzes the influence of rice farmers’ AGP behaviors on rice income. The choice of behavior by the rice farmers accords with the hypothesis of the rational economic man, so different degrees of AGP are carried out from the perspective of outsourcing services to maximize their effect. Assuming that the potential income of the rice farmer   i   from implementing AGP is G i a * , the potential benefit of not implementing AGP is   G i n   * . Then the conditions for rice farmer   i   to implement AGP are as follows: the potential revenue   G i a *   obtained by rice farmer with AGP is greater than the potential revenue   G i n *   obtained by rice farmer without AGP. It can be seen that   G *   can not be directly observed, but it can be expressed as an observable exogenous variable function, that is, the equation expression of rice farmers’ green production model is (2):
G * = Z i + μ   with   G i = { 1 , G i * > 0 0 , G i * 0
In Equation (2), G * represents the unobservable variable of AGP of rice farmers; G i   represents the observable variable of AGP of rice farmers; Z i represents other exogenous variables affecting AGP of rice farmers; represents the parameter vector to be estimated, μ i represents the random error term.
Based on the above analysis, to measure the influence of AGP on the rice income of rice farmers, the following rice income model equation of rice farmers is constructed as (3):
L n Y i = β G i + γ O i + δ X i = ε i
In Equation (3), L n Y i   represents the logarithm of rice income of rice farmers; G i represents the AGP of rice farmers; O i   represents the impact of outsourcing services on AGP of rice farmers; X i represents the household head characteristics, rice farmers’ cognition, family characteristics and regional dummy variables that affect rice farmers’ rice income; β , γ , δ represents the coefficient to be estimated; ε i represents the random error term. From Equation (2), it can be seen that the AGP behaviors variable G i of rice farmers is an endogenous variable. If the ordinary least square method is used to estimate the effect of AGP on rice income of rice farmers, the result analysis is biased. Unobservable variables may affect the random error terms of Equations (2) and (3), which leads to the correlation of error terms in simultaneous equations. If the existence of selectivity bias is ignored, the estimation results will be biased. Although propensity-score matching (PSM) can solve the problem of selectivity bias, propensity-score matching can only deal with the bias of observable variables. Endogenous switching regression model (ESR) can effectively solve the problem of sample selection bias caused by observable variables and unobservable variables.
The equation expressions of rice income models corresponding to whether rice farmers implement AGP or not can be seen in the Equation (4a) and (4b), respectively:
L n Y i a = γ a O i a + δ a X i a + σ μ a λ i a + ε i a ,   i f   G i = 1
L n Y i b = γ b O i b + δ b X i b + σ μ b λ i b + ε i b ,   i f   G i = 0
In Equation (4a,b), L n Y i a and L n Y i b represent the variables of the income and yield of rice farmers who implement AGP or not; O i a and O i b represent the impact of outsourcing services of rice farmers who implement AGP or not; X i a and X i b represent other head-of-household feature vectors, household vectors, cognitive vectors and regional virtual vectors, which affect the rice income and yield of rice farmers who implement AGP or not; ε i a and   ε i b represent the random perturbation terms of the two models. In order to solve the problem of sample selection bias caused by unobservable variables, Mills ratios, λ i a and λ i b , and covariances σ μ a = c o v ( μ i , i a ) and   σ μ b = c o v ( μ i , i b )   are introduced into selected and unselected rice-farmer models, respectively, and Equations (2) and (4a,b) are estimated simultaneously by simultaneous equations using maximum likelihood estimation method.

3.4.2. Average Treatment Effect

By comparing the rice income expectations of rice farmers who implement AGP or not under real and counterfactual scenarios, the average treatment effect of AGP on the income was estimated.
The equation expression of expected income of rice farmers implementing AGP can be seen in Equation (5):
E [ Y i a | G i = 1 ] = γ a O i a + δ a X i a + σ μ a λ i a
The equation expression of expected income of rice farmers who have not implemented green production can be seen in Equation (6):
E [ Y i b | G i = 1 ] = γ b O i b + δ b X i b + σ μ b λ i b
Considering the two counterfactual hypotheses of implementing AGP or not, the equation expression of the expected value of rice income and output of rice farmers implementing AGP in making non-implementing decisions is shown in (7):
E [ Y i b | G i = 0 ] = γ n O i a + δ n X i a + σ μ n λ i a
The equation expression of the expected income of rice farmers who do not implement AGP can be seen in Equation (8):
E [ Y i a | G i = 0 ] = γ a O i b + δ a X i b + σ μ a λ i b
According to Equations (5) and (6), the equation expression of the treatment effect on the income of rice farmers who implement AGP is shown in Equation (9):
A T T i = E [ Y i a | G i = 1 ] E [ Y i b | G i = 1 ] = O i a ( γ a γ b ) + X i a ( δ a δ b ) + λ i a ( σ μ a σ μ b )
According to Equations (7) and (8), the equation expression of the treatment effect on the income of rice farmers who do not implement AGP is shown in Equation (10):
A T U i = E [ Y i a | G i = 0 ] E [ Y i b | G i = 0 ] = O i b ( γ a γ b ) + X i b ( δ a δ b ) + λ i b ( σ μ a σ μ b )
Therefore, the average value of   A T T i   and   A T U i   was used to estimate the average treatment effect of AGP on rice income and output.

4. Results

4.1. Sample Descriptive Statistics

The average difference between samples is helpful to analyze the difference between rice farmers who implement green production or those that do not. In this study, the AGP of rice farmers was divided into three aspects: the behaviors of reducing pesticide application, the behaviors of ensuring rice harvest at safe intervals after pesticide application, and the behaviors of adopting physical controls. The significance tests showed that there were significant differences between the rice farmers with AGP behaviors compared to those that do not.

4.1.1. Descriptive Statistics and Average Difference of Characteristic Variables of Pesticide Reduction Behaviors

As seen in Table 2, the variables are significant at the level of 1% except those of education, party members, number of laborers and altitude, indicating that there were significant differences between rice farmers who implement reduced pesticide application or those that do not. Among them, the average income of rice farmers with reduced pesticide application behaviors was 10.410, which was higher than that of rice farmers without reduced pesticide application behaviors, which indicates that reduced pesticide application behaviors may help to improve the total income of rice farmers, and the results need further empirical verification.

4.1.2. Descriptive Statistics and Average Difference of Characteristic Variables of Safety Interval

It can be seen from Table 3 that the variables are significant at the level of 1% except those of education, party members, number of planters, number of laborers and altitude, indicating that there were significant differences between rice farmers who implement safe interval rice harvesting or those that do not. Among them, the average income of rice farmers who implemented the safe interval rice harvesting behaviors was 9.412, which was higher than that of rice farmers who did not. This indicated that the safe interval rice harvesting behaviors might help to improve the total income effect of rice farmers, and the results needed further empirical verification.

4.1.3. Descriptive Statistics and Average Difference of Characteristic Variables of Physical Control Behaviors

Table 4 shows that the variables were significant at the 5% level except those of weeding outsourcing, age, gender, education, party members, number of planters, Ningxia and altitude, indicating that there were significant differences between rice farmers who implement physical control behaviors and those that do not. Among them, the average income of rice farmers who implemented physical control behaviors was 9.856, which was higher than that of rice farmers who did not. This indicated that physical control behaviors might help to improve the total income effect of rice farmers, and the results needed further empirical verification.

4.2. Estimation Results of AGP Effect on Rice Farmers Behavior

This section reports the estimation results of the influencing factors on the AGP behaviors of rice farmers’ and the income-output model based on the behaviors of reducing pesticide application, harvesting rice at safe intervals after pesticide application, and physical controls. The results in Table 5 show that the estimated value of correlation coefficient ρ μ a   or ρ μ n   between the error term of rice farmers’ AGP implementation model and the error term of non-implemented rice farmers’ AGP model was significant at the significant level of 1%, which indicates that there was sample implementation error between rice farmers’ income and output and AGP behaviors, and the endogenous transformation model has certain adaptability.

4.2.1. Analysis of Estimation Results of Behaviors Effect of Reduced Pesticide Application

The regression results of the first stage of the AGP implementation model of rice farmers’ reduced pesticide application behavior show (see Table 5) that outsourcing of pesticide application and weeding had a positive and significant impact on rice farmers’ behavior of reducing pesticide application. This proved that purchasing outsourcing services could effectively reduce the probability of rice farmers’ excessive use of pesticides [58]. Outsourcing service organizations have strong ability to collect and identify factor information and can use professional knowledge to apply pesticides scientifically to reduce the possibility of agricultural overuse. It was verified that outsourcing services can promote the AGP behaviors of rice farmers. Party members, rice planting area and green production cognition can promote rice farmers’ behavior of reducing pesticide application, indicating that the stronger their own ability, the higher their enthusiasm for participating in AGP. In addition, age, land fragmentation and whether there are diseases and insect pests were negatively significant, which may be because rice farmers were risk averse, and when labor input cannot be guaranteed, agricultural production management will be extensive, which was not conducive to AGP behavior of rice farmers.
In the second stage, the determinants of rice farmers’ income showed that the implementation of reduced pesticide application behaviors was significant. The regression coefficient of the effect of pesticide application outsourcing on the annual income of rice farmers was 0.3318, and it was significantly positive at the level of 5%. It shows that outsourcing services can improve the net income of rice farmers. It was verified that outsourcing services can promote AGP income of rice farmers. Outsourcing improves the production efficiency of rice farmers through specialized division of labor, changes the production cost and output of rice, and then affects the income level of rice farmers [29]. Planting time, number of laborers, rice planting area, and green production cognition, all had significant positive effects on the annual income of rice farmers. Land fragmentation had a significant negative effect on the annual income of rice farmers. Due to the irrational allocation of production factors caused by the small-scale decentralization of land parcels, the interest rate and efficiency of rice farmers were reduced, and then the annual income was reduced.
Using Equations (9) and (10), the average treatment effect of rice farmers’ decision-making on rice yield was calculated, and the results are shown in Table 6 and Figure 3. The treatment effect of reducing pesticide application on rice farmers’ rice income was significant at the level of 1%, and the influence was positive. The average treatment effect (ATT) of rice income and output was 0.5123 in the group of reducing pesticide application. This shows that their rice income effect will decrease from 8.2338 to 7.7265, a decrease of 1.850% if the behaviors of reducing pesticide application were not implemented. The average treatment effect (ATU) of the income and output of rice farmers in the non-reduced pesticide application behaviors group was 0.6110. The results shows that the income effect on rice farmers would increase from 9.6223 to 10.2333, an increase of 5.970% if the behaviors of reducing pesticide application were implemented. Therefore, the implementation of pesticide reduction can significantly increase the income of rice farmers. It was verified that the AGP behaviors of rice farmers can promote income. Reducing pesticide application can optimize the rice production environment, improve the comprehensive utilization rate of land, labor, and other means of production, and save the overall input of rice farmers in the rice production process.

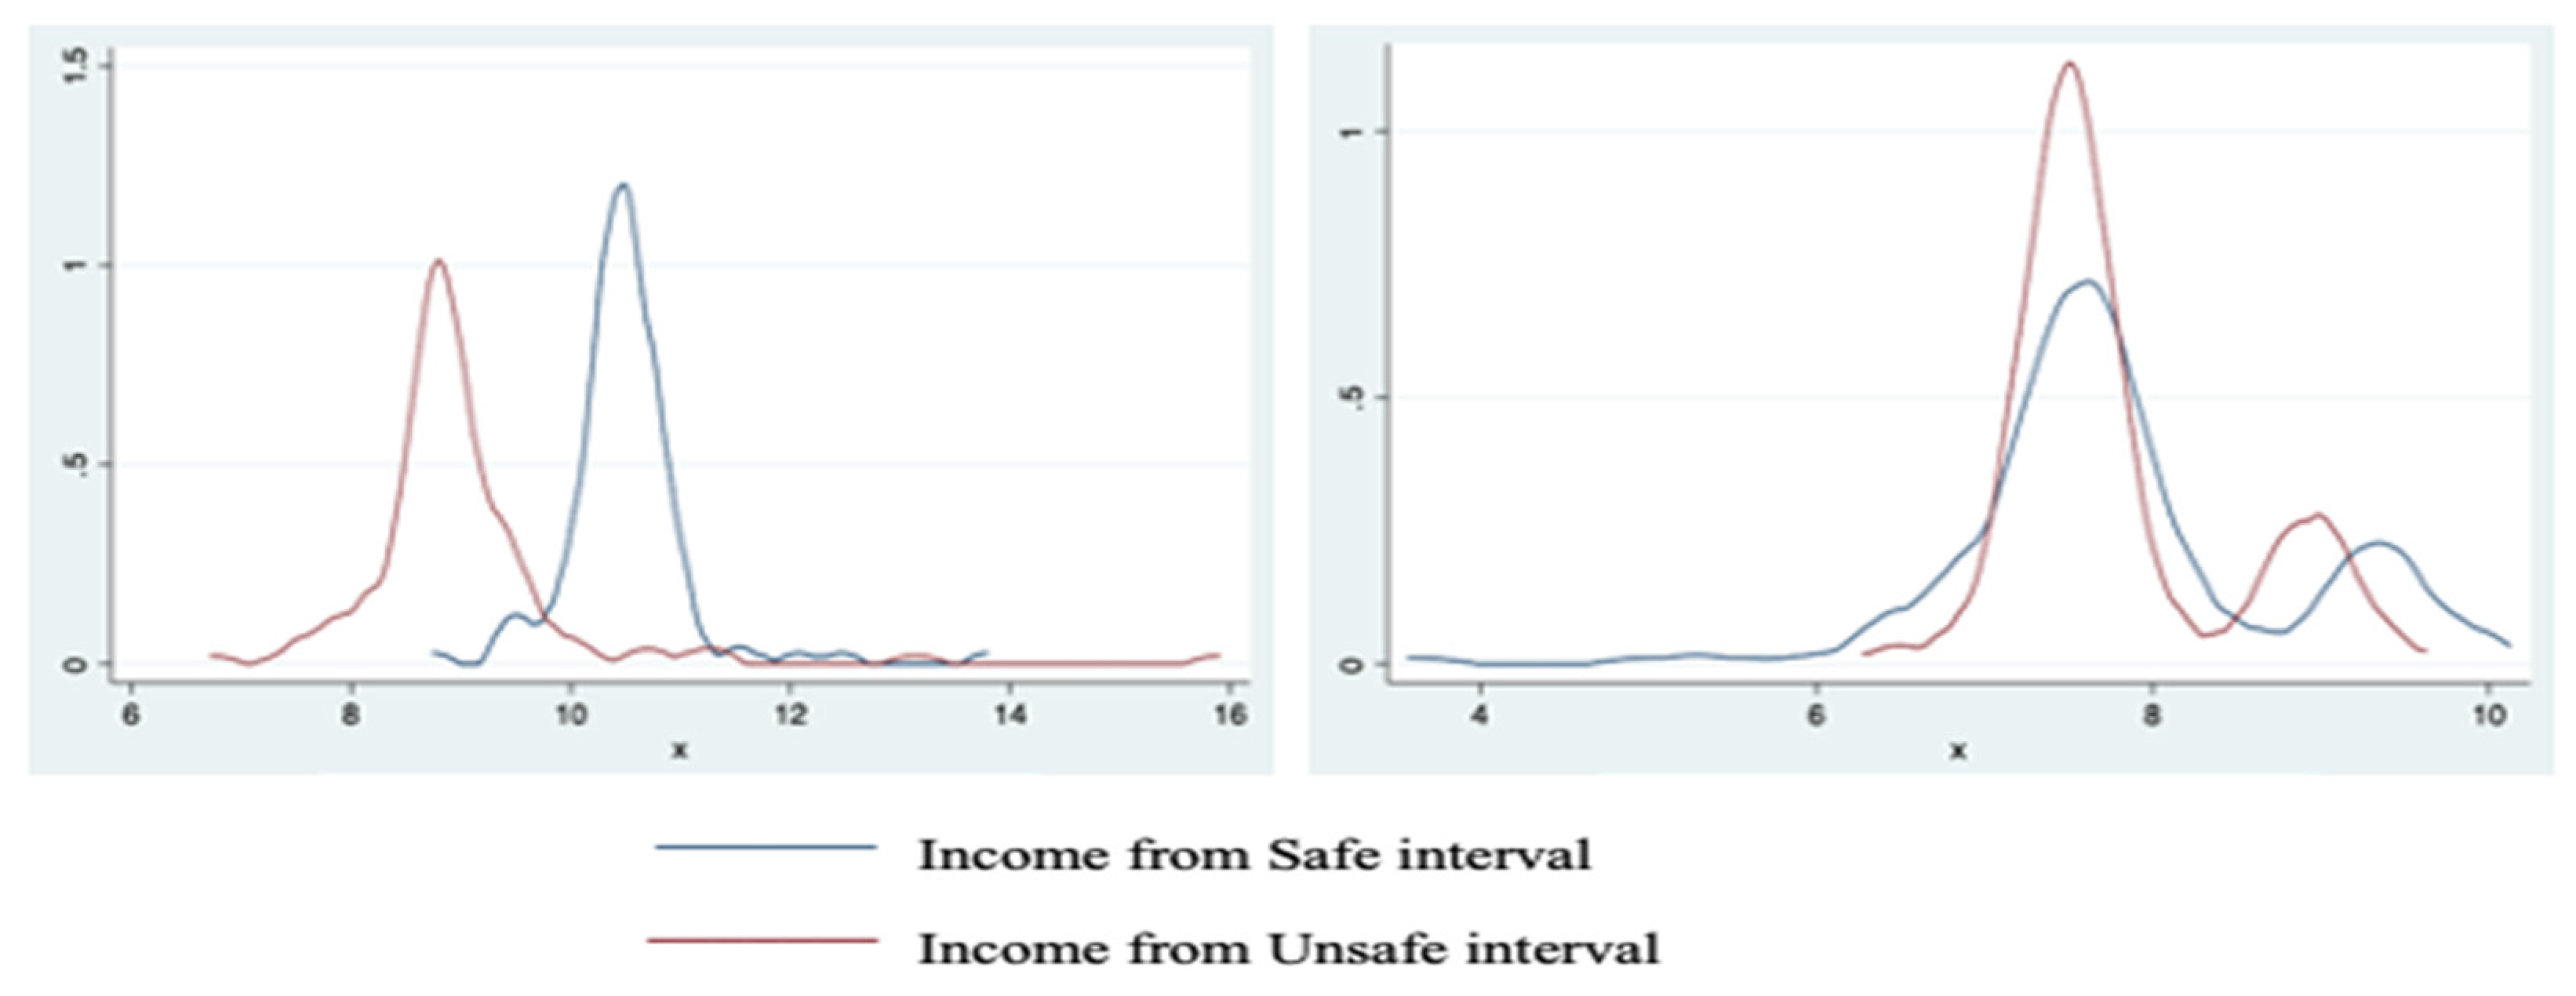
4.2.2. Analysis of Estimation Results of Rice Harvest Behaviors Effect in Safe Interval Period

The regression results of the first stage of the AGP implementation model of rice harvesting behavior in the safe interval after pesticide application for rice farmers show (see Table 7) that outsourcing of pesticide application and harvesting had a positive and significant impact on the behaviors of rice farmers harvesting at safe intervals after pesticide application. As a more advanced factor of production, outsourcing services can make the time interval between pesticide application and harvesting more professional and scientific through specialized division of labor [59], and then have a positive effect on AGP behaviors of rice farmers. That is, outsourcing services can promote AGP behaviors of rice farmers. The coefficients of rice planting area and safety risk perception were positively significant at 1% and 5%, respectively, which indicated that rice planting scale and rice farmers’ risk perception were helpful for rice farmers to implement safe interval rice harvesting behavior. In addition, age, land fragmentation and whether there are diseases and insect pests were negatively significant, which indicates that negative external environmental factors were not conducive to the application of advanced technology and production factors in agricultural production, resulting in poor AGP concept of rice farmers, and then affecting AGP behaviors.
In the second stage, the determinants of rice farmers’ income by implementing behaviors of rice harvesting at safe intervals after pesticide application showed that pesticide application and harvesting outsourcing could significantly increase rice farmers’ annual income. When rice farmers choose outsourcing services, part or all the production links can be handed over to specialized service organizations, which is conducive to improving the utilization efficiency of agricultural production factors and increasing their annual income [27]. That is, outsourcing services can promote the green production income of rice farmers. Rice planting area and green production cognition had a significant positive impact on rice farmers’ annual income. The higher the rice farmers’ awareness of planting area and green production, the richer the experience of planting green rice, which is helpful to improve the quality of rice and improve their income. Land fragmentation had a significant negative impact on the annual income of rice farmers. Because land fragmentation increases labor input, it may be limited by the shortage of household labor force, which leads to poor governance effect, resulting in production reduction, and then reduces rice farmers’ income.
Using Equations (9) and (10), the average treatment effect of rice farmers’ decision-making behaviors of rice harvest at safe intervals after pesticide application on rice yield was calculated, and the results are shown in Table 8 and Figure 4. The treatment effect of safe interval rice harvesting behaviors on rice farmers’ rice income was significant at the level of 1%, and the influence was positive. The average treatment effect (ATT) of rice income and output of rice farmers in the safe interval rice harvesting behaviors group was 1.4574. This shows that for rice farmers who actually implement safe interval rice harvesting behaviors, if they do not implement these behaviors, their rice income effect will decrease from 9.3951 to 7.9377, a decrease of 15.512%. The average treatment effect (ATU) of rice income and output of rice farmers without safe interval rice harvesting behaviors was 0.3935. The results showed that for the rice farmers who did not implement the safe interval rice harvesting behaviors, if they had implemented such behaviors, the rice income effect would increase from 8.6957 to 8.7350, an increase of 4.505%. Therefore, the implementation of safe interval rice harvesting can significantly increase the income of rice farmers. It was verified that the AGP behaviors of rice farmers can promote income. Harvesting rice at safe intervals can ensure that there are no pesticide residues when rice is sold, and then improve the quality of rice to promote income increase.

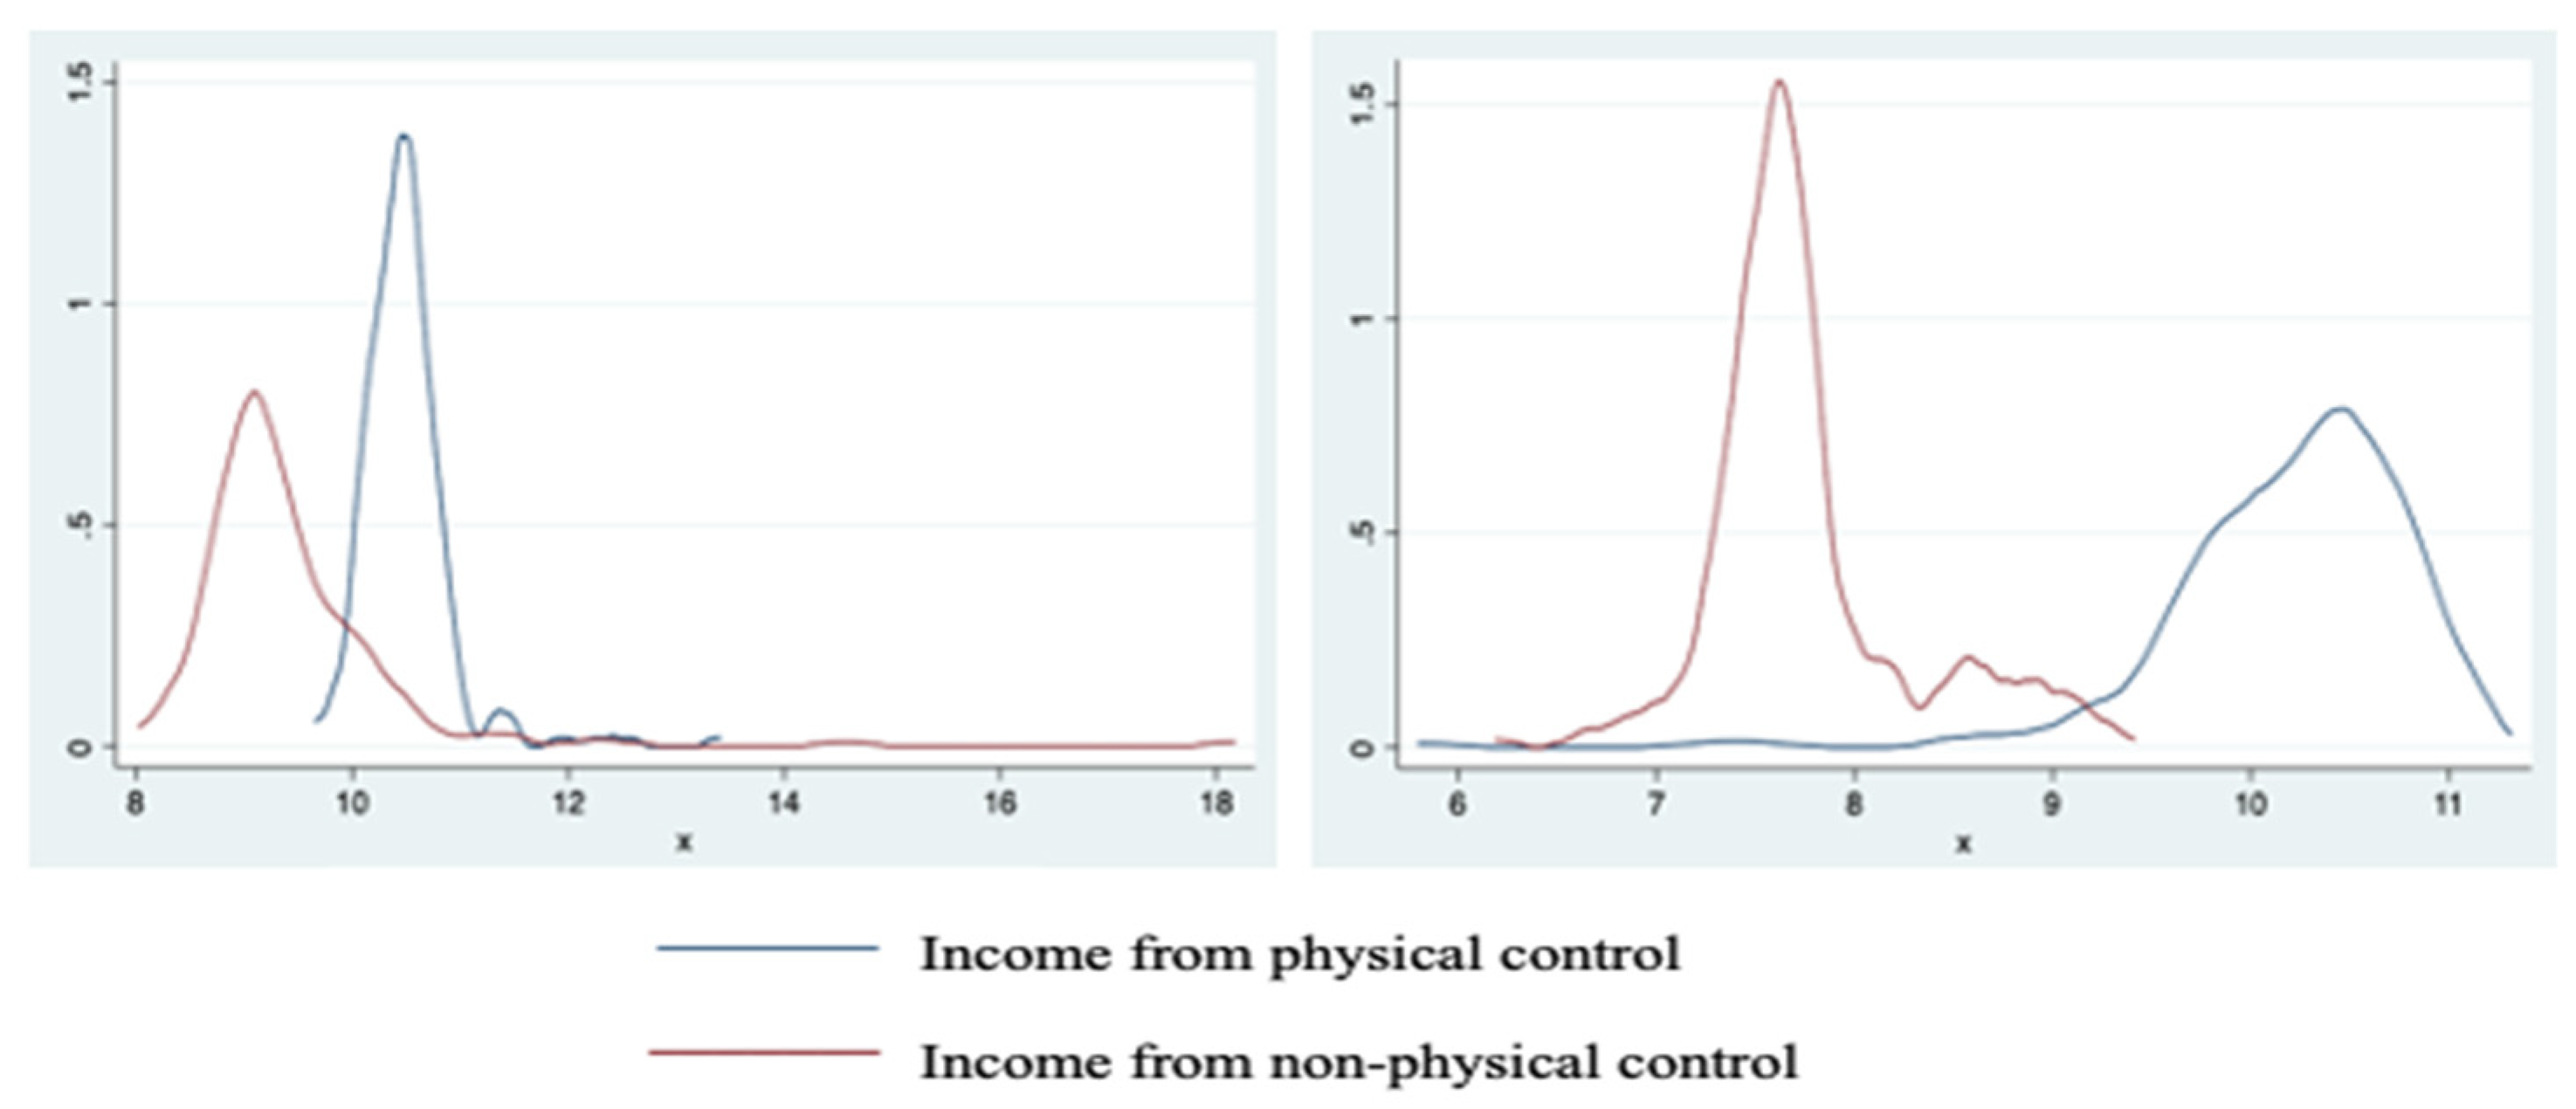
4.2.3. Analysis of Estimation Results of Physical Control Behaviors Effect

The regression results of the green production implementation model of rice farmers’ physical control behaviors is shown in Table 9. Outsourcing of pesticide application, weeding, and harvesting had no significant effect on physical control behaviors of rice farmers. Unverified outsourcing services can promote the AGP behaviors of rice farmers. For physical controls, rice farmers preferred selective traps, insecticidal lamps and other methods, and the overall participation of outsourcing service organizations was small, which leads to no significant impact on the AGP behaviors of rice farmers [60]. The coefficients of planting population and rice planting area were 10% and 1%, respectively, which indicated that the numbers involved in planting labor and rice planting scale were driving whether rice farmers implemented physical control behaviors. In addition, land fragmentation was not conducive to rice farmers’ employment of physical controls. The fragmentation of plots hinders rice farmers from adopting new physical control technologies, which leads to an increase in the cost of AGP behaviors of rice farmers, and then chooses non-green production.
In the second stage, the determinants of rice farmers’ income showed that pesticide application outsourcing, weeding outsourcing and harvesting outsourcing had no significant impact on rice farmers’ physical control behavior. Unverified outsourcing services can promote the green production income of rice farmers. This may be because physical control lacks the accumulation effect of a virtuous circle and has a weak impact on rice yield, resulting in no obvious increase in income. Outsourcing services in physical control can significantly increase rice yield, but at the same time increase its production cost, which cannot promote the income growth of rice farmers. The numbers involved in the labor force and rice planting area had a significant positive impact on the annual income of rice farmers. The relatively abundant labor resources of rice farmers are conducive to the AGP of labor-intensive rice, while the planting area can make rice farmers have a rewarding planting experience and concentrate contiguous rice fields, which is conducive to the development of mechanization, thus improving production efficiency and increasing the annual income of rice farmers. Age had a significant negative impact on the annual income of rice farmers, because rice production still depends on decentralized smallholder farming based on labor time input to a great extent. Aging leads to insufficient labor input of rice farmers, which affects output and reduces annual income of rice farmers.
Using Equations (9) and (10), the average treatment effect of rice farmers’ physical control behaviors decision on rice yield was calculated, and the results are shown in Table 10 and Figure 5. The treatment effect of physical control behaviors on rice farmers’ rice income was significant at the level of 1%, and the influence was positive. The average treatment effect (ATT) of rice income and output of rice farmers in the physical control behaviors group was 1.0442. The results showed that the rice income effect would decrease from 10.5076 to 9.4634, a decrease of 9.938%, if the physical control behaviors were not implemented for the rice farmers who actually implemented the physical control behaviors; the average treatment effect (ATU) of rice income and output of rice farmers without physical control behaviors was 2.3644. The results showed that the income effect of rice farmers who did not implement physical control behaviors would increase from 7.8666 to 10.2310, an increase of 23.110%. Thus, the implementation of physical control behaviors can significantly increase the income of rice farmers. It was verified that the AGP behaviors of rice farmers can promote income. Physical control can achieve sustainable rice production through ecological and natural control, and then improve rice quality and yield to increase rice farmers’ income.

5. Discussion

Based on the survey data of rice farmers in Pingluo County of Ningxia and Yangxian County of Shaanxi Province in Northwest China, this study explored the influence of AGP behaviors of rice farmers on their income from the perspective of outsourcing services using an endogenous transformation model and an average processing effect estimation method. It was found that in the investigated areas, the AGP behaviors of rice farmers, such as reducing pesticide application, harvesting rice at safe intervals after pesticide application, and physical control, had a positive and significant impact on improving rice income. The reason is that the AGP behaviors can improve the income of rice farmers by saving the input cost of chemicals and improving the quality of rice [61,62]. On this basis, the production outsourcing service processes, namely pesticide application, weeding and harvesting outsourcing, were introduced into the research model as core explanatory variables for further in-depth analysis. The results show that these outsourcing services can promote the AGP and income of rice farmers. It can realize the scale operation of specific links to improve planting efficiency, and then promote AGP to reduce production costs, increase yield and improve rice farmers’ income.
Through the descriptive statistical analysis of rice farmers’ income under different decision behaviors, it was shown that rice farmers’ AGP behaviors can reduce production cost input and improve rice quality, thus improving rice farmers’ income. In past studies, the effect of AGP behaviors on income was limited to fertilizer use [63,64,65]. There are few research results on the integration of the behaviors of reducing pesticide application, harvesting rice at safe intervals after pesticide application, and physical control into the AGP. The results of this study show that green production behavior can improve rice farmers’ comprehensive utilization rate of production materials to reduce costs, promote rice farmers to produce high-value products to obtain higher market prices, and then improve income. For rice farmers who did not choose green production behavior, the income effect of rice increased after reducing pesticide application behaviors (ATT = 0.5123). Reducing pesticide application is helpful for rice farmers to reduce the frequency of pesticide application to reduce the ineffective loss in rice production and is helpful for the construction of rice quality and safety to improve the income effect of rice farmers. For the rice farmers who did not implement safe rice harvesting, the effect of rice income was improved after safe rice harvesting (ATT = 1.4574). Harvesting rice at safe intervals can effectively control the application times of rice farmers, ensure the pesticide residues in rice to meet the allowable standards stipulated by the state, reduce the cost, and improve the quality of rice, and then improve the income of rice farmers. For rice farmers who did not implement physical control behaviors, the effect of income was improved after adopting physical control behaviors (ATT = 1.0442). Rice farmers use physical factors and artificial control methods with low cost and no environmental pollution, which can effectively improve economic and social benefits and achieve comprehensive development of the two.
The results are helpful to promote AGP behavior in developing countries such as the northwest part of Asia. For example, the sown area of rice in the southeast of Xiyuan District in Vietnam only accounts for 6.82% of the whole country, and the level of science and technology is relativity low [66]. Rice farmers are backward in pest control and cultivation of excellent rice seeds, resulting in low rice quality in Vietnam. Popularizing AGP could alleviate the increasingly tense state of the earth’s resource constraints and improve the income of rice farmers.
In this study, outsourcing services have an important impact on rice farmers’ AGP behaviors and income. Specifically, outsourcing pesticide application can promote rice farmers’ behaviors of reducing pesticide application and harvesting rice at safe intervals after pesticide application, and significantly improve the income of rice farmers who do so. Because pesticide application outsourcing is a technology-intensive process, low total service and high-intensity technology application embedding can significantly improve rice farmers’ production efficiency [67,68]. Weeding outsourcing can promote rice farmers’ behaviors of reducing pesticide application. Compared with manual weeding, outsourcing services use specialized application technologies such as drones to play a technical substitution effect on the reduction of weeding costs and labor input. Harvesting outsourcing can promote rice farmers to implement behaviors of rice harvesting at safe interval following pesticide application, and significantly improve the income of rice farmers who do so. Because most harvesting processes are jointly outsourced, service organizations can accurately harvest according to crop types and safe intervals to improve the specialization level [69], thereby increasing the income of rice farmers. However, outsourcing services have no significant effect on physical control behaviors and income. The main reason is that physical control is mainly based on insect sexual traps, insecticidal lamps, and other facilities, while outsourcing services are weak in this link, which has no significant impact. There are similarities and differences between this study and those of Baiyegunhi et al. [27] and Doanh et al. [61]. Their research emphasizes that outsourcing agricultural production processes can effectively improve AGP and crop yield under the limited endowment of rice farmers such as time and cognition. This study further divided outsourcing services into pesticide application, weeding and harvesting categories, and the results showed that pesticide outsourcing had the highest impact on all aspects of AGP behaviors and income of rice farmers. This also confirms that outsourcing technology-intensive processes produces higher benefits than labor-intensive harvesting. India is rich in land resources compared with China. The rice planting area and yield in Maharashtra and Jijarat accounts for 5% and 5.2% of the whole country, respectively. Due to drought and low industrialization level, the yield per capita is low [70,71]. These are like the development of rice areas in northwest part of Asia. Developing outsourcing service promotion is helpful to promote the AGP behaviors of rice farmers, realize the scale operation of specific production links, and improve agricultural mechanization to improve the overall income of rice farmers.
In addition, other explanatory variables, such as age, labor force, rice planting area, land fragmentation, farmers’ cognition, etc., significantly affect the AGP and income effect of rice farmers. Older rice farmers are less likely to implement AGP. Aging leads to weak awareness of production safety of agricultural labor force and weakening willingness to adopt green production [72]. The large rice planting area is helpful for rice farmers to improve the utilization efficiency of machinery and reduce the demand for agricultural labor to save resources, thus improving the AGP and income of rice farmers. This conclusion is supported by Van et al. [73], who emphasized that large-scale planting area promotes the increase of rice yield, which will be supplied to supermarkets and other end retailers with stricter requirements on pesticide residues, and the application behaviors will be more standardized. However, land fragmentation makes it difficult for rice farmers to realize the optimal combination of land resources and elements in production and management, thus increasing the production cost of rice farmers [74]. In addition, the cognitive level of rice farmers makes this happen: the more they know about AGP standards of rice production, the more they pay attention to the quality of rice production, and the more they tend to implement green production to increase their income. The Philippines, which is also a developing country, is in southeast Asia, and its hot and rainy climate meets the requirements of rice growth. However, the mechanization level and scientific and technological level of rice planting industry are low, which leads to a shortage of domestic rice yield that cannot meet the market demand [75]. The risk aversion preference of rice farmers in low-income rice areas makes them unable to increase more technical input, and then the AGP level and income are lower. Extending outsourcing services can improve the problem of rice farmers’ lack of labor skills and introduce modern production factors into traditional rice production to promote green production and increase rice farmers’ income.

6. Conclusions and Policy Enlightenment

The purpose of this study was to include outsourcing services in the theoretical analysis framework of green production and its effect on the income of rice farmers, and to deeply explore the influence of AGP behaviors in this framework. First-hand data were collected through field interviews and questionnaires, and an endogenous transformation model was established to conduct empirical analysis on micro-survey data. The main conclusions were drawn as follows:
(1)
Outsourcing services had a positive and significant impact on AGP behaviors and the income of rice farmers. Outsourcing of pesticide application had the most significant promotion effect followed by weeding and harvesting outsourcing, which can promote rice farmers’ behaviors of reducing pesticide application, harvesting rice at safe intervals after pesticide application, and increase income. Because pesticide application outsourcing can reduce chemical input and improve the utilization rate of agricultural resources through the division of labor and cooperation and knowledge resources advantages and increase environmental and economic benefits by reducing pesticide input costs, rice farmers’ production costs are reduced and their AGP behaviors promoted.
(2)
The AGP behaviors of rice farmers had a significant impact on their income. The behaviors of reducing pesticide application, harvesting rice at safe intervals after pesticide application and physical control played a positive role in promoting the income of rice farmers. Among them, if rice farmers who did not implement physical control behaviors did so, their income increased the most, which was 23.110%. The behaviors of reducing pesticide application was second, and the income of rice farmers who had not implemented reducing pesticide application will increase by 5.970% if they did so. If rice farmers who had not implemented safe interval rice harvesting behaviors did so, their income will increase by 4.505%.
The findings of this study are meaningful for policy makers to design effective mechanisms for green production and outsourcing services, because the latter can have a positive impact on AGP and income of rice farmers, especially in the developing countries such as northwest part of Asia. Rice farmers’ behavior of reducing pesticide application, harvesting rice at safe intervals after pesticide application and physical control can improve productive income by saving costs and increasing efficiency, and outsourcing services in pesticide application, weeding and harvesting can promote rice farmers’ green production behavior and increase income. Finally, low-income rice regions in other developing countries, such as the northwest part of Asia, also face the problems of low AGP behaviors and a low level of science and technology in rice production, which lead to low income of rice farmers. The conclusions of this study can help rice farmers in low-income rice regions in other developing countries to implement AGP behaviors and outsourcing services, improve their income and promote environmentally sustainable development.
The research conclusions can provide some policy enlightenments. First, the government should strengthen the support to the outsourcing service market, and improve the effective publicity, training, and promotion of the outsourcing market. It should guide and standardize the professional development of agricultural outsourcing institutions, strengthen the support and assistance for socialized services such as pesticide application, outsourcing and weeding in production, and improve the service level of all processes. Second, the government should increase the financial subsidy support in the outsourcing service market, encourage outsourcing services to provide services for rice farmers by setting awards and subsidies to reduce the purchase cost of rice farmers’ outsourcing services, and focus on supporting rice farmers’ outsourcing services with strong demand and high applicability. Third, the government should regularly train rice farmers in AGP knowledge to guide rice farmers to standardize the use of pesticides. It should adopt various publicity methods, such as distributing manuals, to deepen rice farmers’ awareness of green production and encourage rice farmers to choose AGP behaviors such as biological pesticides and physical control measures.
This study has the following contributions. First, it confirmed the positive impact of rice farmers’ AGP behaviors on their income and supplements the existing evidence on the research of influencing factors on rice farmers’ income. Second, it analyzes the promotion of outsourcing services to rice farmers’ AGP behaviors and income, and the conclusion has certain values for promoting outsourcing services and rice farmers’ green production decision-making.
Finally, we hope to identify the limitations of this study to support further research in the future. First, this study focused on the impact of pesticide application outsourcing, weeding outsourcing and harvesting outsourcing on AGP and income of rice farmers. Future research can further include other variables, such as seedling outsourcing and irrigation outsourcing. Second, this study only focused on analyzing the behavior differences among rice farmers in different regions from cross-sectional data, and future research can try to deeply explore the dynamic changes of AGP behaviors of rice farmers. Third, except rice, the impact of AGP on farmers’ income may vary from crop to crop, such as potato and corn, which needs further detailed investigation.

Author Contributions

Conceptualization, Y.Y.; methodology, R.L. and Y.Y.; software, R.L. and Y.Y.; validation, R.L. and Y.Y.; formal analysis, R.L. and Y.Y.; investigation, R.L. and Y.Y.; resources, Y.Y.; data curation, R.L. and Y.Y.; writing—original draft preparation, R.L.; writing—review and editing, R.L. and Y.Y.; visualization, R.L. and Y.Y.; supervision, Y.Y.. All authors have read and agreed to the published version of the manuscript.

Funding

This research was supported by the Youth Fund for Humanities and Social Sciences Research of the Ministry of Education Grant( No.: 21YJC630158).

Institutional Review Board Statement

Not applicable.

Informed Consent Statement

Not applicable.

Data Availability Statement

The data presented in this study are available on request from the first author.

Acknowledgments

We thank anonymous commentators and editors.

Conflicts of Interest

The authors declare no conflict of interest.

References

  1. Ministry of Agriculture and Rural Affairs of China. Ten-Year Development Plan of National Rice Production Mechanization of Ministry of Agriculture and Rural Affairs. Ministry of Agriculture and Rural Affairs of China: Beijing, China, 2006. (In Chinese) [Google Scholar]
  2. Song, Y.; Wang, C.; Linderholm, H.W.; Fu, Y.; Cai, W.; Xu, J.; Zhuang, L.; Wu, M.; Shi, Y.; Wang, G.; et al. The Negative Impact of Increasing Temperatures on Rice Yields in Southern China. Sci. Total Environ. 2022, 820, 153262. [Google Scholar] [CrossRef] [PubMed]
  3. Jin, J.; Wang, W.; He, R.; Gong, H. Pesticide Use and Risk Perceptions among Small-Scale Farmers in Anqiu County, China. Int. J. Environ. Res. Public Health 2016, 14, 29. [Google Scholar] [CrossRef] [PubMed] [Green Version]
  4. Huang, Y.; Luo, X.; Liu, D.; Du, S.; Yan, A.; Tang, L. Pest Control Ability, Technical Guidance, and Pesticide Overuse: Evidence from Rice Farmers in Rural China. Environ. Sci. Pollut. Res. 2021, 28, 39587–39597. [Google Scholar] [CrossRef]
  5. Chi, Y.; Zhou, W.; Wang, Z.; Hu, Y.; Han, X. The Influence Paths of Agricultural Mechanization on Green Agricultural Development. Sustainability 2021, 13, 12984. [Google Scholar] [CrossRef]
  6. Xu, B.; Chen, W.; Zhang, G.; Wang, J.; Ping, W.; Luo, L.; Chen, J. How to Achieve Green Growth in China’s Agricultural Sector. J. Clean. Prod. 2020, 271, 122770. [Google Scholar] [CrossRef]
  7. Nguyen, H.T.; Le, H.T. The Effect of Agricultural Product Eco-Labelling on Green Purchase Intention. Manag. Sci. Lett. 2020, 10, 2813–2820. [Google Scholar] [CrossRef]
  8. Shen, J.; Zhu, Q.; Jiao, X.; Ying, H.; Wang, H.; Wen, X.; Xu, W.; Li, T.; Cong, W.; Liu, X.; et al. Agriculture Green Development: A Model for China and the World. Front. Agric. Sci. Eng. 2020, 7, 5. [Google Scholar] [CrossRef] [Green Version]
  9. Deng, H.; Jing, X.; Shen, Z. Internet Technology and Green Productivity in Agriculture. Environ. Sci. Pollut. Res. 2022, 6, 1–11. [Google Scholar] [CrossRef]
  10. Li, M.; Zhao, P.; Wu, L.; Chen, K. Effects of Value Perception, Environmental Regulation and Their Interaction on the Improvement of Herdsmen’s Grassland Ecological Policy Satisfaction. Int. J. Environ. Res. Public Health 2021, 18, 3078. [Google Scholar] [CrossRef]
  11. Li, H.; Liu, Y.; Zhao, X.; Zhang, L.; Yuan, K. Estimating Effects of Cooperative Membership on Farmers’ Safe Production Behaviors: Evidence from the Rice Sector in China. Environ. Sci. Pollut. Res. 2021, 28, 25400–25418. [Google Scholar] [CrossRef]
  12. Rodrik, D. Green Industrial Policy. Oxf. Rev. Econ. Policy 2014, 30, 469–491. [Google Scholar] [CrossRef] [Green Version]
  13. Zhu, Y.; Huo, C. The Impact of Agricultural Production Efficiency on Agricultural Carbon Emissions in China. Energies 2022, 15, 4464. [Google Scholar] [CrossRef]
  14. Sun, D.; Rickaille, M.; Xu, Z. Determinants and Impacts of Outsourcing Pest and Disease Management. China Agric. Econ. Rev. 2018, 10, 443–461. [Google Scholar] [CrossRef]
  15. Belton, B.; Win, M.T.; Zhang, X.; Filipski, M. The Rapid Rise of Agricultural Mechanization in Myanmar. Food Policy 2021, 101, 102095. [Google Scholar] [CrossRef]
  16. Qu, X.; Kojima, D.; Nishihara, Y.; Wu, L.; Ando, M. Can Harvest Outsourcing Services Reduce Field Harvest Losses of Rice in China? J. Integr. Agric. 2021, 20, 1396–1406. [Google Scholar] [CrossRef]
  17. Gao, Y.; Zhao, D.; Yu, L.; Yang, H. Influence of a New Agricultural Technology Extension Mode on Farmers’ Technology Adoption Behavior in China. J. Rural Stud. 2020, 76, 173–183. [Google Scholar] [CrossRef]
  18. Li, M.; Liu, Y.; Huang, Y.; Wu, L.; Chen, K. Impacts of Risk Perception and Environmental Regulation on Farmers’ Sustainable Behaviors of Agricultural Green Production in China. Agriculture 2022, 12, 831. [Google Scholar] [CrossRef]
  19. Martin-Guay, M.-O.; Paquette, A.; Dupras, J.; Rivest, D. The New Green Revolution: Sustainable Intensification of Agriculture by Intercropping. Sci. Total Environ. 2018, 615, 767–772. [Google Scholar] [CrossRef] [PubMed]
  20. Biru, W.D.; Zeller, M.; Loos, T.K. The Impact of Agricultural Technologies on Poverty and Vulnerability of Smallholders in Ethiopia: A Panel Data Analysis. Soc. Indic. Res. 2020, 147, 517–544. [Google Scholar] [CrossRef] [Green Version]
  21. Pratama, M.F.; Rauf, R.A.; Antara, M.; Basir-Cyio, M.; Mahfudz, M. Factors Influencing the Efficiency of Cocoa Farms: A Study to Increase Income in Rural Indonesia. PLoS ONE 2019, 14, e0214569. [Google Scholar] [CrossRef] [PubMed]
  22. Reganold, J.P.; Wachter, J.M. Organic Agriculture in the Twenty-First Century. Nat. Plants 2016, 2, 15221. [Google Scholar] [CrossRef] [PubMed]
  23. Rahman, S.; Norton, G.W.; Rashid, M.H.-A. Economic Impacts of Integrated Pest Management on Vegetables Production in Bangladesh. Crop Prot. 2018, 113, 6–14. [Google Scholar] [CrossRef]
  24. Malacrinò, A.; Seng, K.H.; An, C.; Ong, S.; O’Rourke, M.E. Integrated Pest Management for Yard-Long Bean (Vigna unguiculata subsp. Sesquipedalis) in Cambodia. Crop Prot. 2020, 135, 104811. [Google Scholar] [CrossRef]
  25. Midingoyi, S.G.; Kassie, M.; Muriithi, B.; Diiro, G.; Ekesi, S. Do Farmers and the Environment Benefit from Adopting Integrated Pest Management Practices? Evidence from Kenya. J. Agric. Econ. 2019, 70, 452–470. [Google Scholar] [CrossRef]
  26. Githiomi, C.; Muriithi, B.; Irungu, P.; Mwungu, C.M.; Diiro, G.; Affognon, H.; Mburu, J.; Ekesi, S. Economic Analysis of Spillover Effects of an Integrated Pest Management (IPM) Strategy for Suppression of Mango Fruit Fly in Kenya. Food Policy 2019, 84, 121–132. [Google Scholar] [CrossRef]
  27. Baiyegunhi, L.J.S.; Majokweni, Z.P.; Ferrer, S.R.D. Impact of Outsourced Agricultural Extension Program on Smallholder Farmers’ Net Farm Income in Msinga, KwaZulu-Natal, South Africa. Technol. Soc. 2019, 57, 1–7. [Google Scholar] [CrossRef]
  28. Mi, Q.; Li, X.; Gao, J. How to Improve the Welfare of Smallholders through Agricultural Production Outsourcing: Evidence from Cotton Farmers in Xinjiang, Northwest China. J. Clean. Prod. 2020, 256, 120636. [Google Scholar] [CrossRef]
  29. Cai, L.; Wang, L. Analysis on Outsourcing Service Behavior of Rice Pest and Disease Control Based on Heckman Selection Model—A Case Study of Ten Counties in Fujian Province. PLoS ONE 2021, 16, e0254819. [Google Scholar] [CrossRef] [PubMed]
  30. Xue, P.; Han, X.; Wang, Y.; Wang, X. Can Agricultural Machinery Harvesting Services Reduce Cropland Abandonment? Evidence from Rural China. Agriculture 2022, 12, 901. [Google Scholar] [CrossRef]
  31. Ji, C.; Guo, H.; Jin, S.; Yang, J. Outsourcing Agricultural Production: Evidence from Rice Farmers in Zhejiang Province. PLoS ONE 2017, 12, e0170861. [Google Scholar] [CrossRef] [PubMed]
  32. Yekimov, S.; Nianko, V.; Harkusha, S.; Burlitska, O.; Gavrilko, T. The Use of Accounting Outsourcing in Small Agricultural Enterprises. E3S Web Conf. 2021, 285, 1002. [Google Scholar] [CrossRef]
  33. Fang, C.; Xu, Y.; Ji, Y. Part-Time Farming, Diseases and Pest Control Delay and Its External Influence on Pesticide Use in China’s Rice Production. Front. Environ. Sci. 2022, 10, 414–425. [Google Scholar] [CrossRef]
  34. Zhang, X.; Yang, J.; Thomas, R. Mechanization Outsourcing Clusters and Division of Labor in Chinese Agriculture. China Econ. Rev. 2017, 43, 184–195. [Google Scholar] [CrossRef]
  35. Qian, L.; Lu, H.; Gao, Q.; Lu, H. Household-Owned Farm Machinery vs. Outsourced Machinery Services: The Impact of Agricultural Mechanization on the Land Leasing Behavior of Relatively Large-Scale Farmers in China. Land Use Policy 2022, 115, 106008. [Google Scholar] [CrossRef]
  36. Li, J.; Wang, W.; Li, M.; Li, Q.; Liu, Z.; Chen, W.; Wang, Y. Impact of Land Management Scale on the Carbon Emissions of the Planting Industry in China. Land 2022, 11, 816. [Google Scholar] [CrossRef]
  37. Chen, Z.; Li, X.; Xia, X. Measurement and Spatial Convergence Analysis of China’s Agricultural Green Development Index. Environ. Sci. Pollut. Res. 2021, 28, 19694–19709. [Google Scholar] [CrossRef]
  38. Rebelo, J.; Lourenço-Gomes, L.; Gonçalves, T.; Caldas, J. A Hedonic Price Analysis for the Portuguese Wine Market: Does the Distribution Channel Matter? J. Appl. Econ. 2019, 22, 40–59. [Google Scholar] [CrossRef] [Green Version]
  39. Liu, R.; Gao, Z.; Nayga, R.M.; Shi, L.; Oxley, L.; Ma, H. Can “Green Food” Certification Achieve Both Sustainable Practices and Economic Benefits in a Transitional Economy? The Case of Kiwifruit Growers in Henan Province, China. Agribusiness 2020, 36, 675–692. [Google Scholar] [CrossRef]
  40. Song, Y.; Guo, S.; Zhang, M. Assessing Customers’ Perceived Value of the Anti-Haze Cosmetics under Haze Pollution. Sci. Total Environ. 2019, 685, 753–762. [Google Scholar] [CrossRef]
  41. Luo, L.; Qiao, D.; Zhang, R.; Luo, C.; Fu, X.; Liu, Y. Research on the Influence of Education of Farmers’ Cooperatives on the Adoption of Green Prevention and Control Technologies by Members: Evidence from Rural China. Int. J. Environ. Res. Public Health 2022, 19, 6255. [Google Scholar] [CrossRef]
  42. Ma, Y.; Zhan, L.; Yang, H.; Qin, M.; Chai, S.; Cao, Z.; Mou, R.; Chen, M. Dissipation of Two Field-incurred Pesticides and Three Degradation Products in Rice (Oryza sativa L.) from Harvest to Dining Table. J. Sci. Food Agric. 2019, 99, 4602–4608. [Google Scholar] [CrossRef] [PubMed]
  43. Hu, X.; Li, X.; Zhu, R.; Sun, Y.; Wang, Q. The Relationship Network within Spatial Situation: Embeddedness and Spatial Constraints of Farmers’ Behaviors. Land 2022, 11, 485. [Google Scholar] [CrossRef]
  44. Zhao, Q.; Pan, Y.; Xia, X. Internet Can Do Help in the Reduction of Pesticide Use by Farmers: Evidence from Rural China. Environ. Sci. Pollut. Res. 2021, 28, 2063–2073. [Google Scholar] [CrossRef] [PubMed]
  45. Adnan, K.M.M.; Ying, L.; Ayoub, Z.; Sarker, S.A.; Menhas, R.; Chen, F.; Yu, M. Risk Management Strategies to Cope Catastrophic Risks in Agriculture: The Case of Contract Farming, Diversification and Precautionary Savings. Agriculture 2020, 10, 351. [Google Scholar] [CrossRef]
  46. Dai, J.; Li, X.; Cai, H. Market Power, Scale Economy and Productivity: The Case of China’s Food and Tobacco Industry. China Agric. Econ. Rev. 2018, 10, 313–322. [Google Scholar] [CrossRef]
  47. Inacio, M.C.; Didy, O.O.; Titki, D.T.; Idris, I.A.; Bily, A.B. Redefining Conservation Agriculture through Appropriate Use of Herbicides and Fertilisers to Improve Crop Production in Mozambique. Afr. J. Agric. Res. 2022, 18, 136–145. [Google Scholar] [CrossRef]
  48. Ahmad, M.; Bhowmick, K.; Quddoos, M.U.; Beraich, M.; Lahlimi, A.E. A Productivity and Profitability Analysis of Agriculture Practice in Coastal Areas of Punjab. Int. J. Manag. 2020, 11, 1403–1419. [Google Scholar] [CrossRef]
  49. China National Bureau of Statistics. China Statistical Yearbook 2019. In China Rural Statistical Yearbook-2019; China National Bureau of Statistics: Beijing, China, 2019. (In chinese) [Google Scholar]
  50. Alemán, F. Common Bean Response to Tillage Intensity and Weed Control Strategies. Agron. J. 2001, 93, 556–563. [Google Scholar] [CrossRef]
  51. Gao, Y.; Liu, B.; Yu, L.; Yang, H.; Yin, S. Social Capital, Land Tenure and the Adoption of Green Control Techniques by Family Farms: Evidence from Shandong and Henan Provinces of China. Land Use Policy 2019, 89, 104250. [Google Scholar] [CrossRef]
  52. Lu, X.; Qu, Y.; Sun, P.; Yu, W.; Peng, W. Green Transition of Cultivated Land Use in the Yellow River Basin: A Perspective of Green Utilization Efficiency Evaluation. Land 2020, 9, 475. [Google Scholar] [CrossRef]
  53. Kabir, M.H.; Rainis, R.; Azad, J. Are Spatial Factors Important in the Adoption of Eco-Friendly Agricultural Technologies? Evidence on Integrated Pest Management (IPM). J. Geogr. Inf. Syst. 2017, 9, 98–113. [Google Scholar] [CrossRef] [Green Version]
  54. Farani, A.Y.; Mohammadi, Y.; Ghahremani, F. Modeling Farmers’ Responsible Environmental Attitude and Behaviour: A Case from Iran. Environ. Sci. Pollut. Res. 2019, 26, 28146–28161. [Google Scholar] [CrossRef] [PubMed]
  55. Muñoz-Quezada, M.T.; Lucero, B.; Bradman, A.; Baumert, B.; Iglesias, V.; Muñoz, M.P.; Concha, C. Reliability and Factorial Validity of a Questionnaire to Assess Organophosphate Pesticide Exposure to Agricultural Workers in Maule, Chile. Int. J. Environ. Health Res. 2019, 29, 45–59. [Google Scholar] [CrossRef] [PubMed] [Green Version]
  56. Lee, L.-F. Unionism and Wage Rates: A Simultaneous Equations Model with Qualitative and Limited Dependent Variables. Int. Econ. Rev. 1978, 19, 415. [Google Scholar] [CrossRef]
  57. Maddala, G.S. Limited-Dependent and Qualitative Variables in Econometrics; Cambridge University Press: Cambridge, UK, 1983; ISBN 9780511810176. [Google Scholar]
  58. Gao, Y.; Li, P.; Wu, L.; Lu, J.; Yu, L.; Yin, S. Support Policy Preferences of For-Profit Pest Control Firms in China. J. Clean. Prod. 2018, 181, 809–818. [Google Scholar] [CrossRef]
  59. Gao, Y.; Dong, J.; Zhang, X.; Yu, L. Enabling For-Profit Pest Control Firms to Meet Farmers’ Preferences for Cleaner Production: Evidence from Grain Family Farms in the Huang-Huai-Hai Plain, China. J. Clean. Prod. 2019, 227, 141–148. [Google Scholar] [CrossRef]
  60. Zhao, L.; Cai, S. Farmers’IPM Technology Adoption: Based on Empirical Analysis on Wuhu, Anhui Province. Agric. Econ. Probl. 2012, 3, 50–56. [Google Scholar]
  61. Doanh, N.; Thuong, N.; Heo, Y. Impact of Conversion to Organic Tea Cultivation on Household Income in the Mountainous Areas of Northern Vietnam. Sustainability 2018, 10, 4475. [Google Scholar] [CrossRef]
  62. Qiao, Y.; Martin, F.; Cook, S.; He, X.; Halberg, N.; Scott, S.; Pan, X. Certified Organic Agriculture as an Alternative Livelihood Strategy for Small-Scale Farmers in China: A Case Study in Wanzai County, Jiangxi Province. Ecol. Econ. 2018, 145, 301–307. [Google Scholar] [CrossRef]
  63. He, D.-C.; Ma, Y.-L.; Li, Z.-Z.; Zhong, C.-S.; Cheng, Z.-B.; Zhan, J. Crop Rotation Enhances Agricultural Sustainability: From an Empirical Evaluation of Eco-Economic Benefits in Rice Production. Agriculture 2021, 11, 91. [Google Scholar] [CrossRef]
  64. Adnan, N.; Nordin, S.M. How COVID-19 Effect Malaysian Paddy Industry? Adoption of Green Fertilizer a Potential Resolution. Environ. Dev. Sustain. 2021, 23, 8089–8129. [Google Scholar] [CrossRef]
  65. Martey, E.; Kuwornu, J.K.M.; Adjebeng-Danquah, J. Estimating the Effect of Mineral Fertilizer Use on Land Productivity and Income: Evidence from Ghana. Land Use Policy 2019, 85, 463–475. [Google Scholar] [CrossRef]
  66. Chau, N.T.; Ahamed, T. Analyzing Factors that Affect Rice Production Efficiency and Organic Fertilizer Choices in Vietnam. Sustainability 2022, 14, 8842. [Google Scholar] [CrossRef]
  67. Shen, H.; Chen, C.; Liao, X.; Wang, L. Analysis of Outsourcing Behavior of Rice Farmers in Production Links: Based on the Investigation of 21 Counties in 7 Provinces. China’s Rural. Econ. 2015, 5, 44–57. [Google Scholar]
  68. Li, D.; Zhou, H.; Xia, Q. Why is There a Structural Imbalance in the Adoption of Agricultural Productive Services? A Discussion on Heterogeneity of Link Risks. Collect. Essays Financ. Econ. 2021, 4, 3–11. [Google Scholar]
  69. Guo, L.; Duan, X.; Li, H.; Yang, W.; Ren, Y.; Guo, Y. Does a Higher Minimum Wage Accelerate Labour Division in Agricultural Production? Evidence from the Main Rice-Planting Area in China. Econ. Res. Ekon. Istraživanja 2021, 35, 2984–3010. [Google Scholar] [CrossRef]
  70. Madhukar, A.; Kumar, V.; Dashora, K. Spatial and Temporal Trends in the Yields of Three Major Crops: Wheat, Rice and Maize in India. Int. J. Plant Prod. 2020, 14, 187–207. [Google Scholar] [CrossRef]
  71. Ghosh, D.; Rathore, M.; Brahmachari, K.; Singh, R.; Kumar, B. Impact of Burial and Flooding Depths on Indian Weedy Rice. Crop Prot. 2017, 100, 106–110. [Google Scholar] [CrossRef]
  72. Liu, J.; Zhang, C.; Hu, R.; Zhu, X.; Cai, J. Aging of Agricultural Labor Force and Technical Efficiency in Tea Production: Evidence from Meitan County, China. Sustainability 2019, 11, 6246. [Google Scholar] [CrossRef] [Green Version]
  73. van den Berg, M.M.; Hengsdijk, H.; Wolf, J.; van Ittersum, M.K.; Guanghuo, W.; Roetter, R.P. The Impact of Increasing Farm Size and Mechanization on Rural Income and Rice Production in Zhejiang Province, China. Agric. Syst. 2007, 94, 841–850. [Google Scholar] [CrossRef]
  74. Lu, H.; Xie, H.; He, Y.; Wu, Z.; Zhang, X. Assessing the Impacts of Land Fragmentation and Plot Size on Yields and Costs: A Translog Production Model and Cost Function Approach. Agric. Syst. 2018, 161, 81–88. [Google Scholar] [CrossRef]
  75. Kenmore, P.E.; Litsinger, J.A.; Bandong, J.P.; Santiago, A.C.; Salac, M.M. Philippine Rice Farmers And Insecticides: Thirty Years Of Growing Dependency and New Options For Change. In Management of Pests and Pesticides; CRC Press: Boca Raton, FL, USA, 2019; pp. 98–108. [Google Scholar]
Figure 1. Theoretical model in this study.
Agriculture 12 01682 g001
Figure 2. The location of the investigated area in this study.
Agriculture 12 01682 g002
Figure 3. Effects of the pesticide application behavior on the income of rice farmers and rice output.
Agriculture 12 01682 g003
Figure 4. Effects of rice harvesting behaviors in safe interval on the income of rice farmers and rice output.
Agriculture 12 01682 g004
Figure 5. Effects of the choice of rice farmers’ physical control behaviors on the income of rice farmers and rice output.
Agriculture 12 01682 g005
Table 1. Descriptive statistics of rice farmers’ characteristic variables.
VariablesDefinition and AssignmentMeanStandard DeviationMinMaxCoefficient of Variation
Explained variables
Rice net incomeHow much is your family’s net income from selling rice in 2020?8.99171.65365.298313.41500.1839
Reduced pesticide application behaviorsDo you use less chemicals in your rice fields than before? Yes = 1; No = 00.27690.5005011.8075
Rice harvesting behaviors at safe intervalsIs your rice harvested at safe intervals?
Yes = 1; No = 0
0.64180.4800010.7479
Physical control behaviorsDo you take physical control measures such as sex traps in your rice fields? Yes = 1; No = 00.32750.4698011.4345
Core explanatory variables
Outsourcing of pesticide applicationDoes your family outsource the pesticide application to the service organizations?
Yes = 1; No = 0
0.27690.4480011.6179
Weeding outsourcingDoes your family outsource weeding to service organizations? Yes = 1; No = 00.05930.2365013.9882
Harvesting outsourcingDoes your family outsource harvesting to service organizations? Yes = 1; No = 00.66150.4737010.7161
Other explanatory variables
AgeActual age of rice farmers interviewed57.450610.510023850.1829
GenderMale = 1; Female = 00.83300.3734010.4482
EducationYears of Education of Interviewed Rice Farmers6.72973.49690160.5196
Party memberAre the interviewed rice farmers party members? Yes = 1; No = 00.09010.2867013.1820
Number of plantersWhat is the total number of people planting rice fields in your home?1.98460.7638160.3849
Planting timeBy 2020, how many years have you planted rice?33.505530.10641500.8986
Number of laborersWhat is the total number of members with working ability in your family?2.41320.9915170.4109
Rice planting areaHow many acres of rice are planted in your home?34.221065.605738001.9171
Land fragmentationDegree of land fragmentation: total planting area/block number0.97961.08860.1429101.1113
Security risk awarenessDo you understand the safety risks of rice caused by excessive use of pesticides?
Completely ignorant = 1; Don’t understand = 2; General = 3; Understand = 4; Fully understood = 5
3.22201.2510150.3883
Cognition of green productionDo you know the common green pesticide differentiation methods and green production measures? Completely ignorant = 1; Don’t know = 2; General = 3; Know = 4; Fully aware = 54.45051.9388150.4356
Is it NingxiaIs the rice area where your family grows located in Ningxia? Yes = 1; No = 00.52310.5000010.9559
Instrumental variables
Diseases and insect pestsAre there any diseases and insect pests in the rice area where your family grows? Have = 1; None = 00.89670.3047010.3398
AltitudeHow many meters above sea level is your planting area?788.6584301.408137811060.3822
Note: The net income, age and altitude of rice are logarithm values.
Table 2. The descriptive statistics and differences of rice farmers with and without reducing pesticide application.
VariablesImplement the Behaviors of Reducing Pesticide ApplicationThe Behaviors of Reducing Pesticide Application Was Not ImplementedDiff
Rice net income10.4107.5772.833 ***
Outsourcing of pesticide application0.7890.1530.636 ***
Weeding outsourcing0.3720.0740.297 ***
Harvesting outsourcing0.8900.3580.532 ***
Age3.9854.079−0.094 ***
Gender0.6970.961−0.263 ***
Education7.2116.2180.993
Party member0.1010.0740.027
Number of planters2.1831.7940.390 ***
Planting time28.37222.2886.083 ***
Number of laborers2.4682.3670.101
Rice planting area64.2483.89560.353 ***
Land fragmentation0.3281.635−1.307 ***
Security risk awareness3.6512.7990.852 ***
Cognition of green production4.9683.9261.042 ***
Is it in Ningxia0.9390.1060.833 ***
Whether there are diseases and insect pests
Altitude
0.838
6.269
0.954
6.923
−0.116 ***
−0.654
Note: The net income, age and altitude of rice are logarithm; *, ** and *** represent significant levels of 10%, 5% and 1%, respectively.
Table 3. The descriptive statistics and differences of rice farmers with and without safe interval rice harvesting behaviors.
VariablesImplement Safe Interval Rice HarvestRice Harvest at Safe Intervals Has Not Been ImplementedDiff
Rice net income9.4128.6730.739 ***
Outsourcing of pesticide application0.3180.2020.116 ***
Weeding outsourcing0.0980.0380.060 ***
Harvesting outsourcing0.8180.3800.438 ***
Age3.9954.054−0.059 ***
Gender0.7640.957−0.193 ***
Education6.9216.3870.535
Party member0.0920.0860.007
Number of planters2.2521.8360.416
Planting time39.39022.96316.427 ***
Number of laborers2.4252.3930.032
Rice planting area64.2483.89560.353 ***
Land fragmentation0.3401.337−0.997 ***
Security risk awareness3.4382.8340.604 ***
Cognition of green production4.6884.0250.663 ***
Is it in Ningxia0.9450.2880.657 ***
Whether there are diseases and insect pests
Altitude
0.847
6.397
0.925
6.936
−0.078 ***
−0.539
Note: The net income, age and altitude of rice are logarithm; *, ** and *** represent significant levels of 10%, 5% and 1%, respectively.
Table 4. Variable descriptive statistics and differences between rice farmers who implemented and did not implement physical control behaviors.
VariablesImplement Physical Prevention and ControlPhysical Control Was Not ImplementedDiff
Rice net income9.8567.2162.640 ***
Outsourcing of pesticide application0.2940.2420.052 ***
Weeding outsourcing0.0780.0200.058
Harvesting outsourcing0.8320.5780.254 ***
Age4.0094.081−0.072
Gender0.6980.899−0.201
Education7.2426.4800.761
Party member0.1070.0820.107
Number of planters2.0561.8390.217
Planting time54.04023.50730.533 ***
Number of laborers2.4772.3820.095 ***
Rice planting area48.4604.97943.481 ***
Land fragmentation0.6091.742−1.133 ***
Security risk awareness3.6783.0000.678 ***
Cognition of green production4.9734.1960.777 **
Is it in Ningxia0.7390.0810.658
Whether there are diseases and insect pests
Altitude
0.953
6.240
0.869
6.760
0.084 ***
−0.520
Note: The net income, age and altitude of rice are logarithm; *, ** and *** represent significant levels of 10%, 5% and 1%, respectively.
Table 5. Simultaneous estimation results of AGP selection model and rice income-output model for reducing pesticide application behaviors.
VariablesGreen Production Selection Model of Reducing Pesticide Application BehaviorsIncome-Output Model of Rice Farmers
Reduced Pesticide Application Behaviors for Rice FarmersRice Farmers with Unreduced Pesticide Application Behaviors
Outsourcing of pesticide application0.7822 *** (0.2045)0.3318 ** (0.1415)0.1520 (0.1255)
Weeding outsourcing0.7651 ** (0.3740)0.0732 (0.1920)0.0255 (0.1386)
Harvesting outsourcing−0.0369 (0.0987)0.0965 (0.1194)0.1228 (0.1261)
Age−0.0614 ** (0.0217)−0.4054 (0.4151)−0.2705 (0.1738)
Gender−0.0068 (0.3217)−0.0046 (0.1289)−0.1101 (0.2196)
Education−0.0448 (0.0306)−0.0045 (0.0165)−0.0140 (0.0745)
Party member0.1404 * (0.1217)−0.0203 (0.1035)−0.1169 (0.1176)
Number of planters−0.0585 (0.0849)−0.0633 (0.0888)−0.1017 (0.1162)
Planting time−0.0059 (0.0079)0.0213 * (0.0104)0.0042 (0.0049)
Number of laborers0.0837 (0.1254)0.1551 *** (0.0374)0.0499 (0.0663)
Rice planting area0.0341 *** (0.0072)0.0483 *** (0.0081)0.0043 *** (0.0006)
Land fragmentation−0.8904 ** (0.4118)−0.1244 *** (0.0282)−0.6343 ** (0.2733)
Security risk awareness0.1155 (0.1005)0.0035 (0.0490)0.0369 (0.0392)
Cognition of green production0.1147 ** (0.0427)0.0460 * (0.0282)0.0411 * (0.0318)
Is it Ningxia0.1551 (0.1422)0.5919 (0.2773)−0.2118 (0.2452)
Whether there are diseases and insect pests−0.7503 * (0.4296)--
Altitude0.0017 (0.0014)--
Constant−9.3495 (11.0496)9.3955 *** (1.3987)9.2098 *** (1.1492)
ρ μ a   or   ρ μ n   −0.8322 ** (0.4233)0.8619 ** (0.2177)
Wald-chi2(15) 91.42
LR test of indep.eqns 23.58 ***
Log likelihood −565.3886
Observations 447
Note: The net income, age and altitude of rice are logarithm; *, ** and *** represent significant levels of 10%, 5% and 1%, respectively.
Table 6. Average treatment effect of rice farmers’ reduction of pesticide application behaviors on rice income and output.
GroupsImplement the Behaviors of Reducing Pesticide ApplicationThe Behaviors of Reducing Pesticide Application Was Not ImplementedATTATU
Reduced pesticide application behaviors for rice farmers8.23387.72650.5123 ***-
Rice farmers with unreduced pesticide application behaviors10.23339.6223-0.6110 ***
Note: The net income of rice is logarithmic; *, ** and *** represent significant levels of 10%, 5% and 1%, respectively.
Table 7. Simultaneous estimation results of green production behaviors model and rice income-output model in safety interval.
VariablesGreen Production Selection Model of Safety IntervalIncome-Output Model of Rice Farmers
Rice Farmers Who Implement Safe Interval Rice Harvesting BehaviorsRice Farmers Who Have Not Implemented Safe Interval Rice Harvesting Behaviors
Outsourcing of pesticide application1.1526 *** (0.1973)0.3719 *** (0.1292)0.3184 ** (0.1291)
Weeding outsourcing0.1701 (0.3213)0.1470 (0.2627)−0.0158 (0.1501)
Harvesting outsourcing0.6592 *** (0.1983)0.4515 *** (0.1627)−0.0146 (0.1014)
Age−1.0386 * (−0.5425)−0.2885 (0.3011)−0.0179 (0.2975)
Gender0.1913 (0.2912)−0.0407 (0.1395)−0.1269 (0.2447)
Education−0.0580 (0.0277)−0.0014 (0.0167)−0.0145 (0.0143)
Party member−0.1947 (0.3242)0.1187 (0.1850)−0.2027 (0.1573)
Number of planters−0.2180 (0.1594)−0.1263 (0.0897)0.0304 (0.0717)
Planting time−0.0005 (0.0018)−0.0002 (0.0003)−0.0510 (0.0052)
Number of laborers−0.0881 (0.1240)0.1353 (0.0592)0.0878 (0.0660)
Rice planting area0.0228 *** (0.0035)0.0290 *** (0.0029)0.0032 *** (0.0006)
Land fragmentation0.0519 ** (0.0223)−0.1964 *** (0.0534)−0.4295 ** (0.2692)
Security risk awareness0.1252 ** (0.0757)−0.0271 (0.0477)0.0196 (0.0397)
Cognition of green production0.0230 (0.0515)0.0540 * (0.0279)0.0265 * (0.0108)
Is it Ningxia0.7279 (0.6117)1.0574 (0.2002)2.3944 (0.3754)
Whether there are diseases and insect pests−0.4796 * (0.2482)--
Altitude−0.8910 (0.2972)--
Constant23.6478 *** (8.2385)9.8856 *** (1.3398)7.8022 *** (1.3568)
ρ μ a   or   ρ μ n   −1.6181 *** (0.3098)0.3647 ** (0.1841)
Wald-chi2(15) 454.20
LR test of indep.eqns 23.58 ***
Log likelihood −595.09825
Observations 447
Note: The net income, age and altitude of rice are logarithm; *, ** and *** represent significant levels of 10%, 5% and 1%, respectively.
Table 8. Average treatment effect of rice farmers’ choice of rice harvesting behaviors in safe interval on rice income and output.
GroupsImplement the Behaviors of Harvesting Rice at Safe IntervalsThe Behaviors of Harvesting Rice at Safe Intervals Was Not ImplementedATTATU
Rice farmers who harvest rice at safe intervals9.39517.93771.4574 ***-
Rice farmers who harvest rice at unsafe intervals8.73508.6957-0.3935 ***
Note: The net income, age and altitude of rice are logarithm; *, ** and *** represent significant levels of 10%, 5% and 1%, respectively.
Table 9. Simultaneous estimation results of green production behaviors model and rice income-output model using physical control behaviors.
VariablesGreen Production Selection Model of Physical ControlIncome-Output Model of Rice Farmers
Rice Farmers Who Implement Physical Control BehaviorsRice Farmers Who Have Not Implemented Physical Control Behaviors
Outsourcing of pesticide application0.2657 (0.1862)0.1820 (0.1671)0.2453 (0.1033)
Weeding outsourcing−0.1863 (0.3929)0.7078 (0.4670)0.0612 (0.1730)
Harvesting outsourcing0.2900 (0.2132)0.0450 (0.1797)0.2689 (0.1043)
Age0.5227 (0.4542)−0.5528 * (0.3311)−0.4842 * (0.2912)
Gender−0.1126 (0.1948)0.0218 (0.1497)−0.0062 (0.1584)
Education0.0069 (0.0220)0.0012 (0.0182)0.0076 (0.1459)
Party member0.0018 (0.2539)0.2666 (0.1983)0.0464 (0.1653)
Number of planters0.2114 * (0.1272)−0.0823 (0.0974)0.1849 (0.0752)
Planting time0.0007 (0.0008)0.0003 (0.0003)0.0034 (0.0038)
Number of laborers−0.0842 (0.0876)0.2010 *** (0.0652)0.2033 *** (0.0595)
Rice planting area0.1212 *** (0.0032)0.0207 *** (0.0029)0.0063 *** (0.0007)
Land fragmentation−0.1327 * (0.0793)−0.0619 (0.0552)−0.1504 (0.0707)
Security risk awareness0.0713 (0.0686)0.0428 (0.0570)0.0110 (0.0405)
Cognition of green production0.0016 (0.0394)0.0414 (0.0307)0.0302 (0.0274)
Is it Ningxia0.1983 (0.0876)0.5125 (0.3720)0.5382 (0.1962)
Whether there are diseases and insect pests−0.0741 (0.2923)--
Altitude0.7397 (0.8919)--
Constant−6.4632 (5.3338)9.8154 *** (1.4888)9.5819 *** (1.2470)
ρ μ a   or     ρ μ n   -−2.0438 *** (0.5748)0.8616 *** (0.2099)
Wald-chi2(15) 250.75
LR test of indep.eqns 8.36 ***
Log likelihood −634.83963
Observations 447
Note: The net income, age and altitude of rice are logarithm; *, ** and *** represent significant levels of 10%, 5% and 1%, respectively.
Table 10. Average treatment effect of rice farmers’ physical control behaviors choice on rice income and output.
GroupsImplement Physical Prevention and Control BehaviorsFailure to Implement Physical Prevention and Control BehaviorsATTATU
Physical control behaviors of rice farmers10.50769.46341.0442 ***-
Rice farmers with non-physical control behaviors10.23107.8666-2.3644 ***
Note: The net income of rice is logarithmic; *, ** and *** represent significant levels of 10%, 5% and 1%, respectively.
Publisher’s Note: MDPI stays neutral with regard to jurisdictional claims in published maps and institutional affiliations.

