Article

Impact of Extreme Temperature and Soil Water Stress on the Growth and Yield of Soybean (Glycine max (L.) Merrill)

by
Labake Ogunkanmi
1,
Dilys S. MacCarthy
2,* and
Samuel G. K. Adiku
1
1
Department of Soil Science, University of Ghana, Legon, Accra GA-489-9979, Ghana
2
Soil and Irrigation Research Centre, University of Ghana, Kpong EL-0633-5197, Ghana
*
Author to whom correspondence should be addressed.
Agriculture 2022, 12(1), 43; https://doi.org/10.3390/agriculture12010043
Submission received: 26 November 2021 / Revised: 20 December 2021 / Accepted: 23 December 2021 / Published: 31 December 2021
(This article belongs to the Section Ecosystem, Environment and Climate Change in Agriculture)

Abstract

:
Climate change is a major environmental stressor that would adversely affect tropical agriculture, which is largely rain-fed. Associated with climate change is an increasing trend in temperature and decline in rainfall, leading to prolonged and repeated droughts. The purpose of this study was to determine the effect of climate variables such as temperature, relative humidity, vapor pressure deficit (VPD), and soil water on the phenology, biomass, and grain yield of soybean crops. A greenhouse experiment was set in a split plot design with three average environmental conditions as the main plots: E1 (36 °C, RH = 55%), E2 (34 °C, RH = 57%) and E3 (33 °C, RH = 44%). Additionally, there were three water treatments: W1 (near saturation), W2 (Field capacity), and W3 (soil water deficit) and two soybean varieties (Afayak and Jenguma). These treatments were replicated nine times. The results showed that high temperatures (E1) accelerated the crop development, particularly at flowering. Additionally, increased atmospheric demand for water under a high temperature environment resulted in high evapotranspiration, leading to high transpiration which probably reduced photosynthetic activity of the plants and thereby contributing to biomass and grain yield loss. Biomass and yield were drastically reduced for the combined effect of high temperature (E1) and drought (W3) as compared to combined effect of ambient temperature (E3) and well-watered condition (W1). Increasing temperatures and erratic rainfall distributions associated with climate change poses a potential threat to the soybean production in Ghana.

1. Introduction

Changes in weather components are largely responsible for the frequent yield variability and gaps that have been recorded in the literature, especially in Sub-Saharan Africa (SSA) [1,2]. Within the last few decades, the impact of the rapidly increasing temperatures and erratic rainfall patterns on crop yields have become more evident in the SSA [3]. An analysis of weather patterns between 1960 and 2000 in Ghana indicated a general temperature rise of about 1 °C over the whole country [4]. Associated with this is a decline in rainfall, which generally decreases from south to north [2].
Indeed, projections show that these trends will continue at least into the near future [1,5]. These developments spell adverse conditions for rain-fed agriculture, especially due to the inherently low productivity of the soils. The most cultivated and dominant soils in the Guinea savanna zone of Ghana which is the hub for soybean cultivation are the acrisols, which are characteristically low activity clay soils [6] that have a coarse texture as well as low water holding capacities. In particular, soils in northern Ghana have degraded over time, with some losing almost 50% of the top soils and becoming very gravelly and shallow [7]. Though soils of the middle belt are inherently deeper, they are also degrading at very fast rates.
The combination of rapidly changing weather and the declining soil productivity has adverse consequences on crop growth [8]. First, the crop development rate is accelerated when the ambient temperature increases [9], thereby shortening the overall life cycle of the plants. As a consequence, the crop spends less time in the field accumulating biomass, leading to reduction in size, shorter reproductive duration, and reduced overall yield [9]. Second, the plant respiration rate increases with temperature [10], resulting in a reduced net assimilate accumulation [11]. Therefore, even under non-limiting soil water conditions, crop growth would be impaired under increasing temperature conditions. Additionally, increased temperatures would increase the potential evapotranspiration while reducing the vapor pressure, with a resultant increased evaporative demand on the crop [11]. If rainfall reduces as projected under climate change, soil water replenishment and availability would also be adversely affected, especially due to agricultural drought (low water storage capacity). Literature sources have indicated that the combined effect of high temperature and drought has more detrimental effects on yield and grain number as compared to their individual effects [12]. A study carried out by Jumrani and Bhatia [11] showed a significant decline in the seed yield of soybean sown at high temperatures of 38 and 42 °C with yield reductions of 42 and 64%, respectively. It was also indicated that the decline was very high at all temperatures (30, 34, 38 and 42 °C) when plants were subjected to water stress.
An understanding of how plants adapt to the increasing climate change impact is necessary to guide policies and practices that should be developed to minimize the impacts, especially as many sub-Saharan governments seek to expand the cultivation of some crops into their non-traditional growing belt. In Ghana, soybean (Glycine max) is one crop that is promoted out of their traditional growing areas in the south to more savannah locations found in the southern coastal zone and in the northern locations. The desire to achieve this lies in the superior protein and oil content compared with the other traditional legumes (such as cowpea, Phaseolus spp., etc.). The successful introduction of soybean crops into northern Ghana would address the nutritional protein needs that is often a challenge in those locations. Yet, whether or not the changing weather and soil challenges would support the policy drive is yet to be fully understood. Questions of how different varieties will tolerate the increasing heat and water stress still continue to remain open. Presumably, the longer-duration high yielding variety Jenguma (110–115 days), grown in Ghana would better adapt to the stressed environments than the shorter-duration varieties (e.g., Afayak), since the longer natural life cycle of the former could offset the shortening effect of increasing temperatures. This hypothesis is yet to be validated.
It is the purpose of this study to investigate, with the aim of gaining further understanding of the responses of the development, the growth and yield of two soybean varieties of contrasting life cycles (namely Jenguma and Afayak) to increased temperature and water stress conditions under greenhouse conditions.

2. Materials and Methods

2.1. Site Description and Experimental Set Up

This study was carried out at the University of Ghana, Soil and Irrigation Research Centre (SIREC)—Kpong (6°9′ N and 0°4′ E, 22 m alt) which is located within the coastal savannah zone of Ghana. The soil used is classified as Typic Calciustert [13], locally known as Tropical Black Clay called Akuse series [14]. The soils were potted and placed in three (3) growth chambers constructed by covering a wooden framework with transparent plastic sheets. The dimensions of each chamber were 3.0 m (length), 0.8 m (width), and 1 m (height). The temperatures within the chambers were not controlled to maintain constant values. However, different temperature regimes were realized based on the number and size of windows created on the sides of the chambers. Two of the three chambers, E1 and E2, had two and four window openings respectively, each of size 35 cm by 35 cm, resulting in an average seasonal temperature of 36 °C for the chamber with two windows and 34 °C for the one with four windows. The third chamber, E3, which served as the control had half of the polythene sheet removed from all sides to allow free wind circulation resulting in an average seasonal temperature of 33 °C. The day-to-day variations in the temperature and relative humidity in this chamber reflect conditions that would pertain naturally on crop fields.

2.2. Treatment Structure

Each chamber received six treatments replicated nine times comprising two soybean varieties (V1 = Afayak: TGX 1834-5E and V2 = Jenguma: Tax 1445-2E) widely cultivated in northern Ghana [15] and three water regimes: W1 (post-flowering soil water content kept near saturation), W2 (soil water content kept near field capacity throughout the growing period, and W3 (post-flowering drying cycle). The total experimental units were 162 pots with 54 in each growth chamber. The experiment was laid out in a split-plot design, with the temperature chambers as the main plot with the other factors (water and varieties) being the sub-plots randomized within each main plot (chamber). The Jenguma (Tax 1445-2E) variety has an attractive grain color (cream), high oil content about 20%, is resistant to pod shattering in the field, and is a determinate. Jenguma has an approximate grain yield of 1.7–2.8 t/ha (17–28 bags/ha) [16]. Afayak (TGX 1834-5E) variety is also resistant to shattering, lodging, resistant to pest infestation with a potential yield of 2.0–2.2 t/ha and is also determinate. Both varieties are effective in the control of Striga hermonthica [17].
The pots which had dimensions of 15 cm diameter and 14 cm width were filled with soil to a bulk density of 1.34 g/cm3, resulting in 2 kg of sieved soil per pot. The potted soils were pre-saturated with water and allowed to drain for two days before sowing. Before transferring the pots to the chambers, the emerged seedlings were nursed in a larger screen house for 14 days to ensure uniformity and then thinned to 1 plant/pot. At 15 days after emergence (DAE), the pots were transferred to the growth chambers. The pots continued to receive watering to maintain the soil water at or near field capacity until flowering time when water treatments were imposed. The pots were weighed every other day and topped up with water for those treatments that required so. For W1, water was applied to saturate the pots with a head of 2 cm which was allowed to drain, transpire or evaporate before the re-watering to saturation. For W2, the soil water continued to be maintained at field capacity with no ponding. In the case of W3, watering frequency was reduced to achieve a longer drying cycle until maturity. In total W1, W2 and W3 received 21,900, 14,800 and 11,100 mL, respectively, by the end of the growing period. The water content in the pots under W1 and W2 were between 0.35–0.4 gg−1 and 0.25–0.3 gg−1, respectively. For W3, the water content declined from 0.30 gg−1 at the onset of water stress imposition to about 0.1 gg−1 at maturity.

2.3. Weather Variables Measurements

The weather variables (temperature in °C and relative humidity in %) were measured in each growth chamber five times daily (6 am, 9 am, 12 noon, 3 pm and 6 pm) throughout the growth period using a combined temperature and humidity meter (BioTemp 1 × 1.5 V AAA). As the measurements were manual, no data could be collected in the night. The average temperatures and relative humidity in each of the growth chambers were used to estimate the daily vapor pressure deficit (VPD) following [18]:
VPD = 100 RH 100 × SVP
SVP = 610.7 × 10 7.5 T 237 + T
where SVP is the standard vapor pressure (Pa), RH is the relative humidity (%), and T is the temperature (°C).
The potential evapotranspiration in each chamber was measured on daily basis by measuring the decrease in the level of water in measuring beakers that were placed in the chambers.

2.4. Plant Development

The plant development was determined as the number of days to (i) 50% emergence, (ii) 50% flowering, (iii) 50% podding, and (iv) 50% physiological maturity. The time to reach each developmental stage was also expressed as the growing day degrees (GDD) or cumulative thermal time TT, defined as
GDD = TT = ( T av T b )   t
where Tav (°C) is the average daily temperature in a given chamber, Tb (°C) is the base temperature and, t is time. The value of Tb = 10 °C was taken from the literature [19]. Additionally, data were collected on plant height, number of leaves, and rate of node appearance using selected plants that were tagged soon after emergence.

2.5. Plant Growth and Yield

Plants were harvested sequentially during the growth period. Four (4) dry matter harvests were carried out at vegetative (28 DAE), flowering (35 DAE), pod formation (50 DAE) and at maturity stages. The dry matter was determined after oven drying for three days at 70 °C. At physiological maturity, the matured pods (i.e., color turned yellow to brown) were harvested to determine yield parameters such as pod number, seed number and seed weight. The undamaged pods were detached from the plants and counted, manually threshed and the undamaged seeds counted after which the seeds were oven dried and the seed dry weight estimated.

2.6. Statistical Analysis

The data were analyzed with the analysis of variance (ANOVA) using GenStat statistical software (12th edition, 2009, VSN International Ltd., Hemel Hempstead, UK). Means were separated using the Duncan Multiple Range Test and compared at 5% level of significance. Microsoft Excel (Office 2013, Microsoft Corporation, Redmond, WA, USA) was used for data entry and graphical representation of data were with Sigma Plot (2006 version, SPSS Inc., Chicago, IL, USA).

3. Results

3.1. Weather Conditions in the Chambers and Watering Regimes

Temperature variations during the growth period showed that the daily average temperature range for E1 (highest temperature) was from 29.7 to 41 °C, (Figure 1a) but the mean was 36 °C, giving a variability (CV) = of 7%. The temperature range for E2 were between 29.6 and 38 °C while E3 (ambient) were between 29.1 and 37.5 °C. Environment E2 and E3, had means of 34 and 33 °C, respectively, with both having CVs of 6%. On hourly time scale, the ranges were far higher (not shown). Indeed, the daily cycle data indicated that by early morning, the temperatures in all the chambers were similar but the greatest differences were observed at 3 pm. The effect of night time temperatures were not measured. Contrary to the temperature patterns, the relative humidity was lowest for E3 and highest for E2. In general, the RH declined over time (Figure 1b). The average relative humidity over the growing period in the chambers were 54, 57 and 44% for E1, E2, and E3, suggesting a drier condition for E3 than E1 and E2, respectively. Although the plants in E1 and E2 were under higher relative humidity, the higher temperatures in these environments increased the stress on the plants.

3.2. Effect of Temperature on Plant Development

The variety Afayak attained 50% flowering (average 38 DAE) earlier than the Jenguma variety (40 DAE) on chronological time basis. However, when expressed in thermal time units, the differences were not significant (Table 1). Differences in temperature in the different chambers influenced plant development. Plant development, especially to maturity, was somewhat faster under E1 (36 °C) than the cooler environments in the case of Afayak. In general, the Afayak variety appeared to be more sensitive to temperature differences than the Jenguma variety.
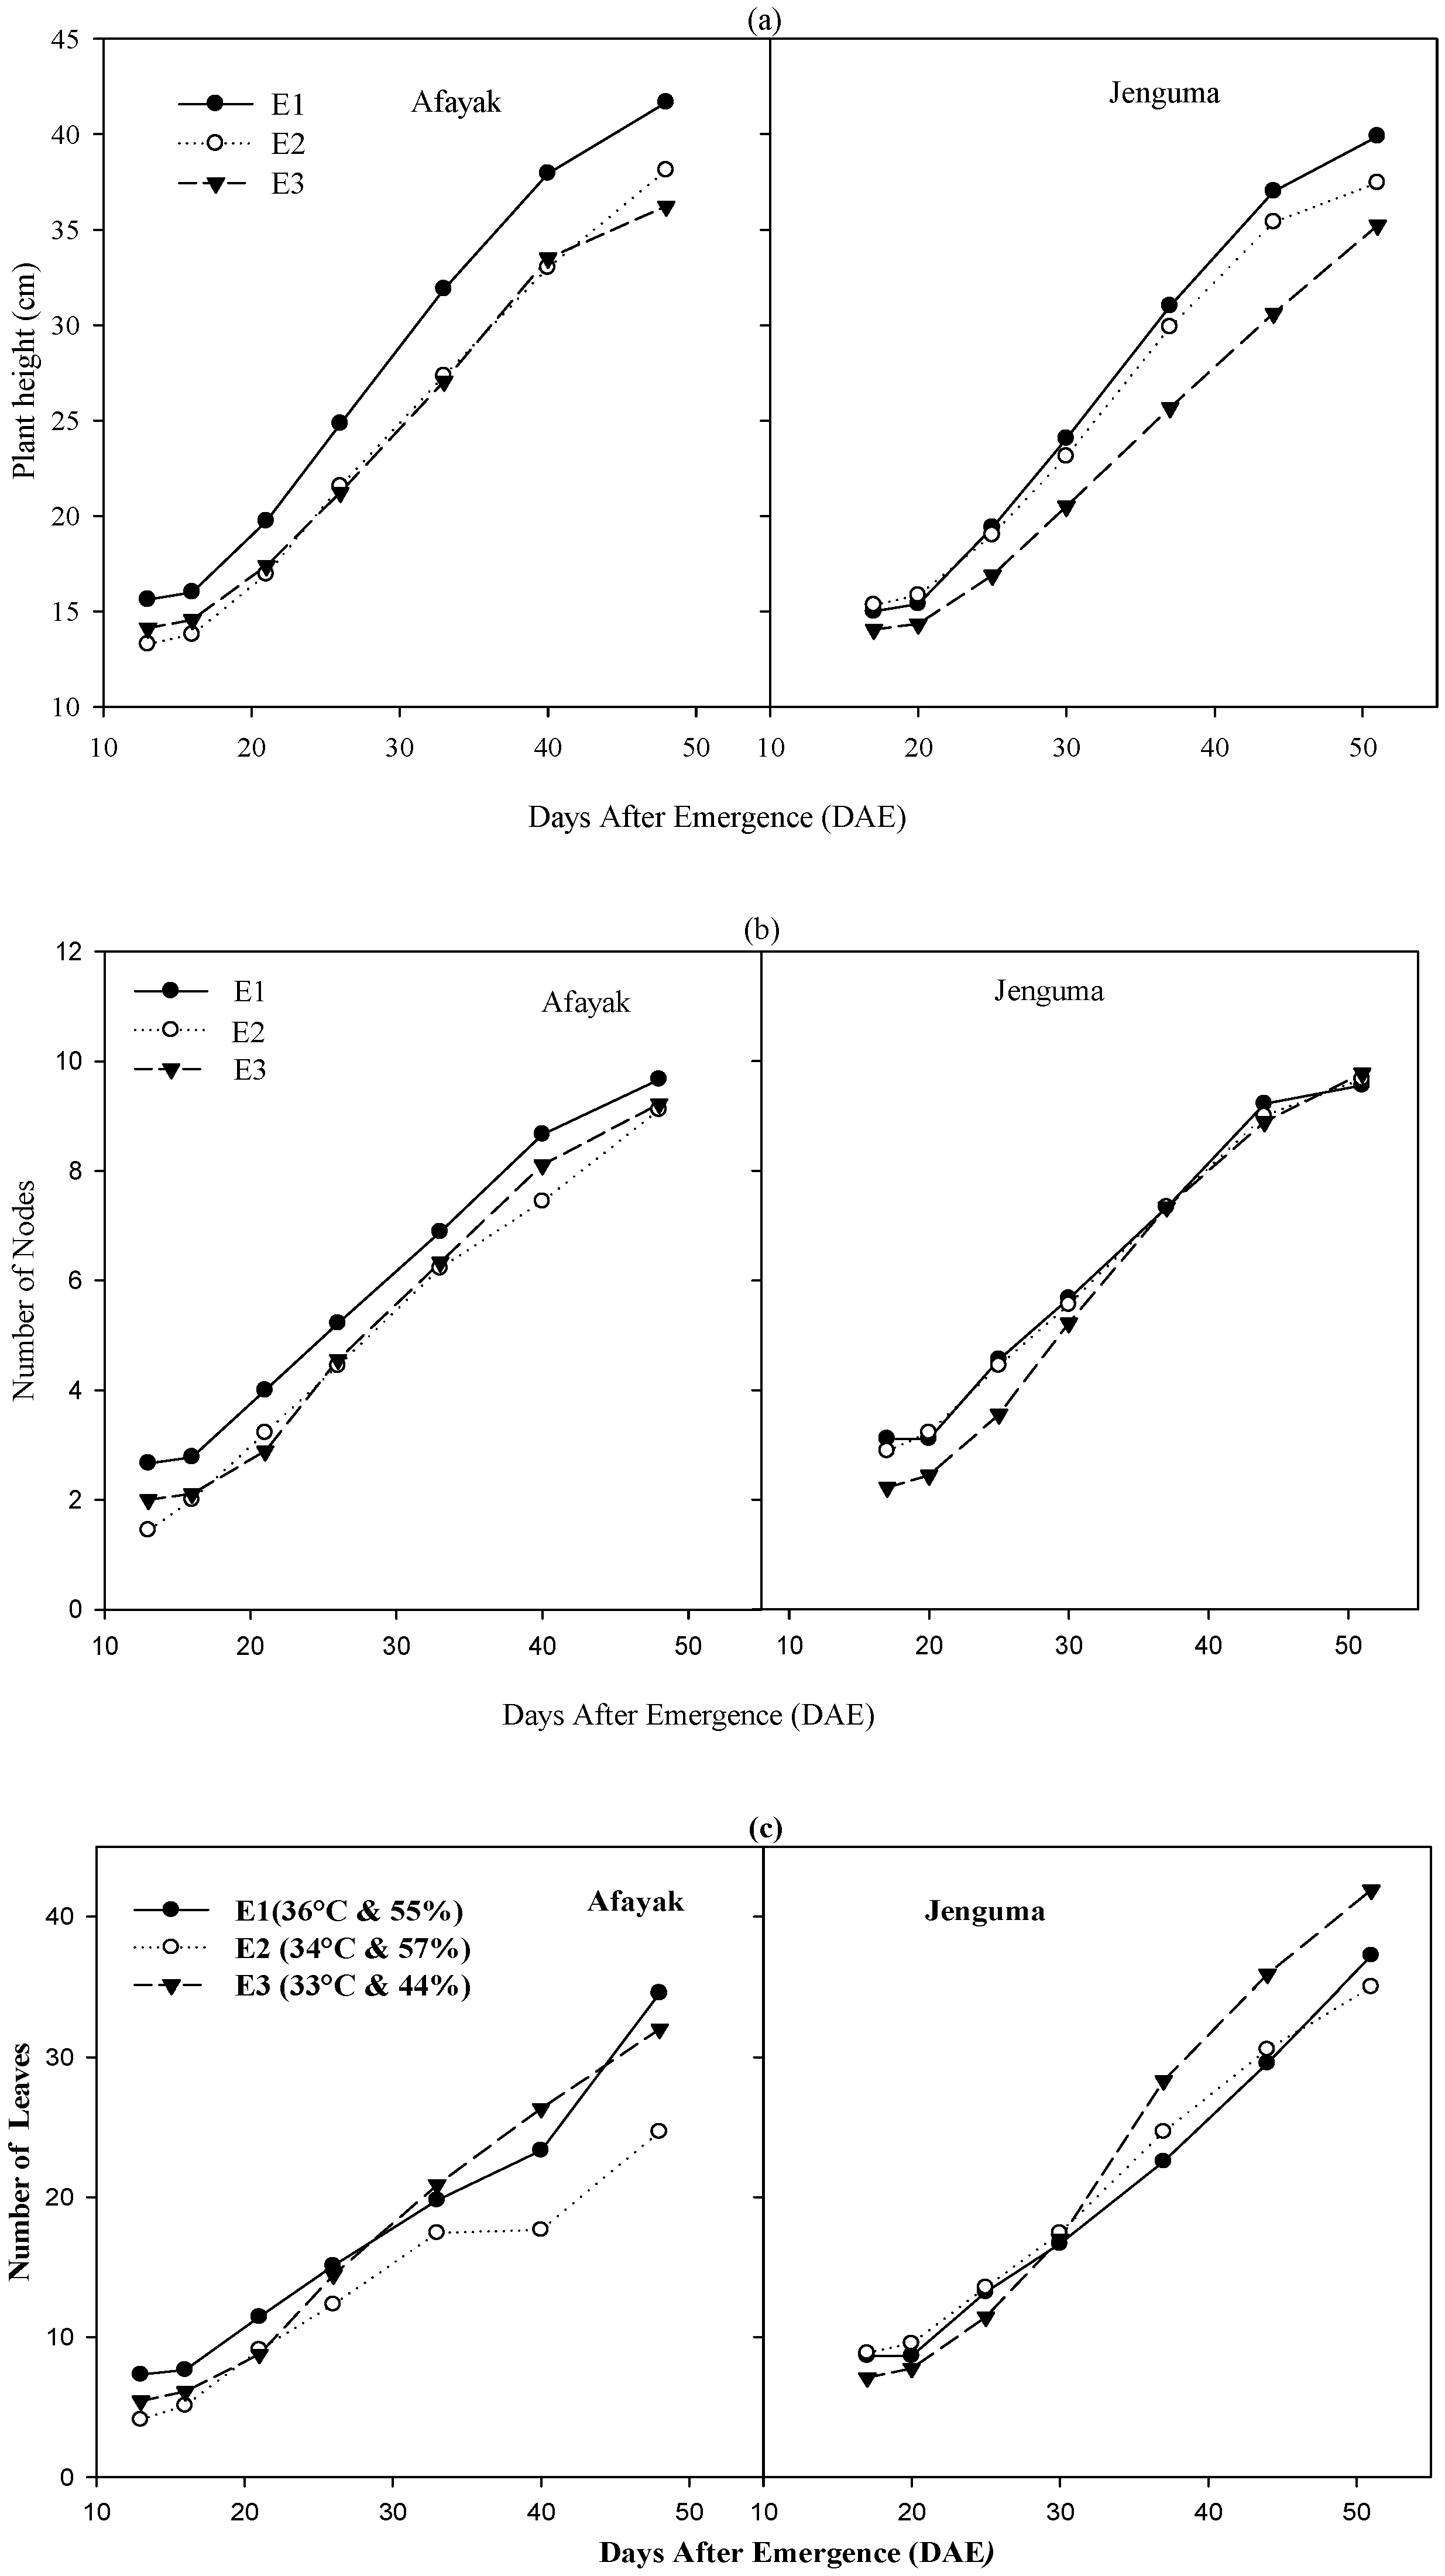
With regard to plant height, both varieties (Afayak and Jenguma) produced the highest mean heights in E1 (36 °C) with Afayak showing a more rapid increase than Jenguma (Figure 2a). Similarly, environment E1 had the 10 nodes formed by 48 DAE for the Afayak variety whereas the same number of nodes appeared on 50 DAE for Jenguma (Figure 2b). Thus, the Afayak variety showed greater sensitivity to increasing air temperature with regard to node appearance. Jenguma showed little or no difference in the number of nodes formed in all three environments prior to flowering.
Although there was no difference in the total number of nodes formed for both varieties in all three environments, the rate of node appearance differed. The total number of leaves for Afayak in E1, E2 and E3 were 35, 25 and 32, respectively, at 50 DAE, while Jenguma had 37, 35 and 41 for E1, E2 and E3, respectively.

3.3. Patterns of Biomass Accumulation

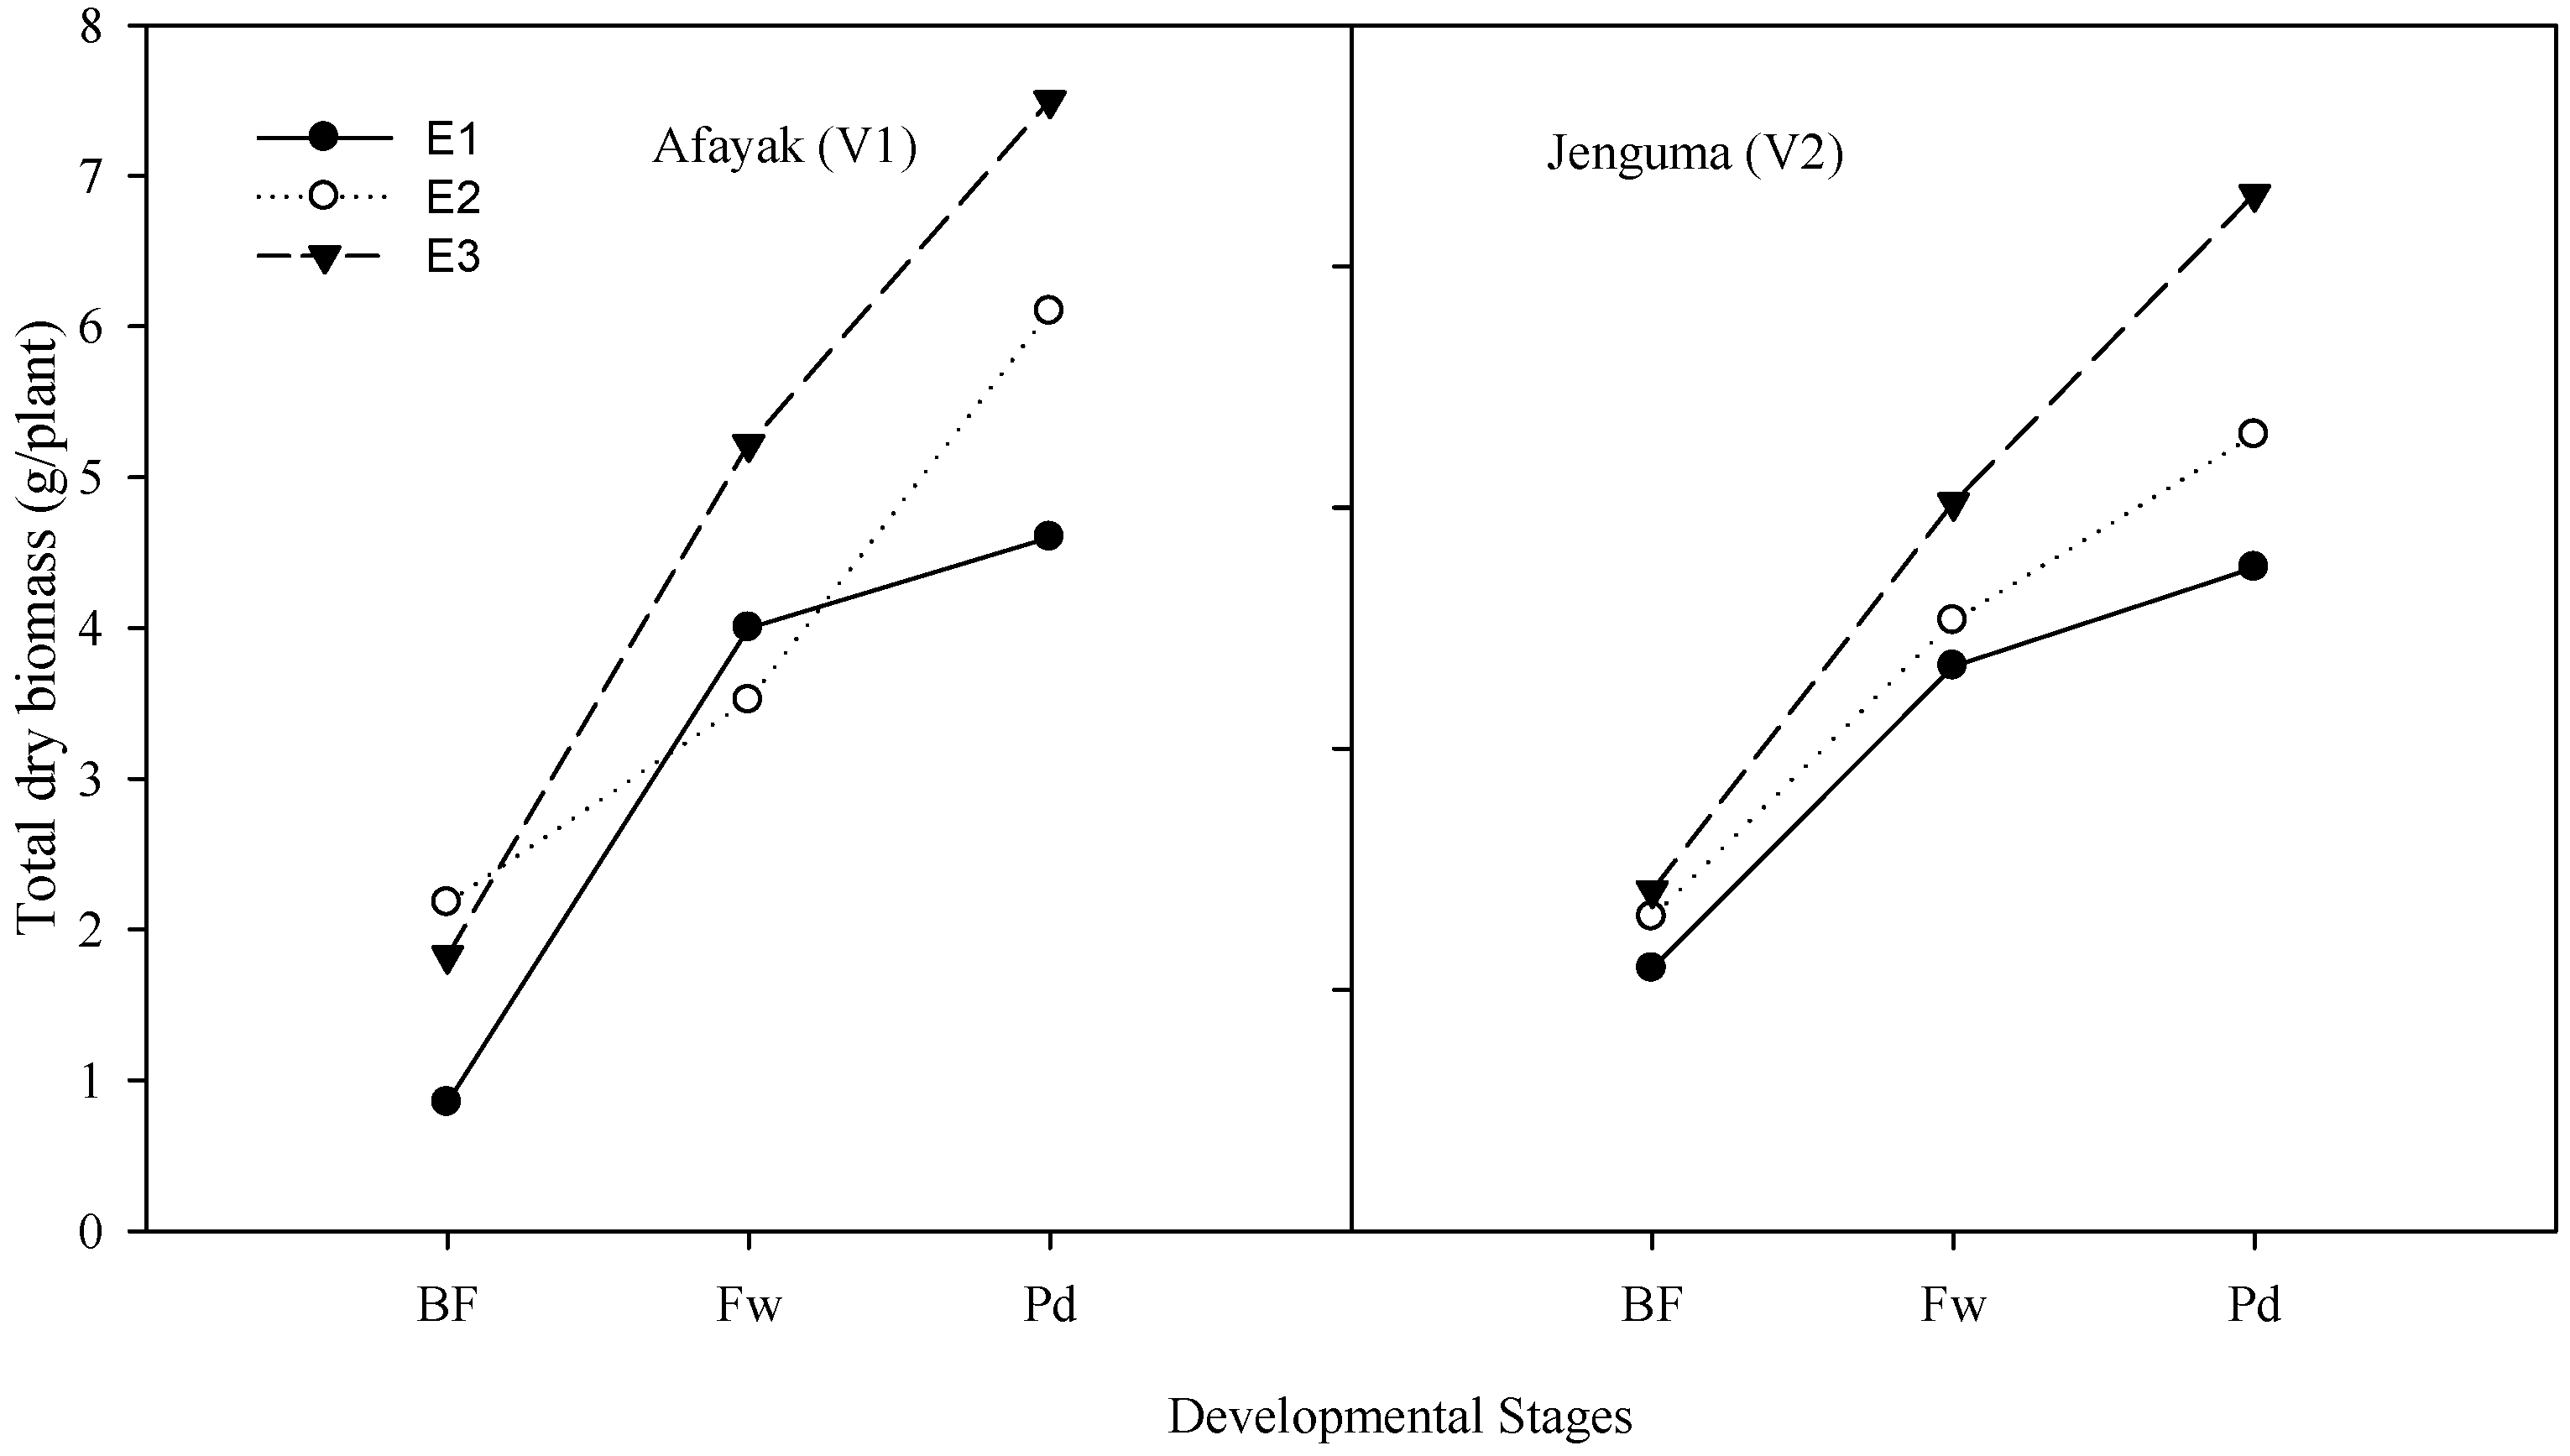
Plants in E2 recorded the highest mean total dry weight (TDW) (p < 0.05) of 2.39 g/plant at the end of the vegetative stage while those in E1 recorded a TDW of 1.51 g/plant (Table 2). At the flowering stage, Environment E3 had the highest total dry biomass with mean weights of 5.22 and 6.04 g/plant for both Afayak and Jenguma varieties, respectively (Table 2). The TDW of the Afayak variety in E3 was significantly higher than those in E1 and E2 but no significant differences were observed between E1 and E2 while Jenguma variety in E3 was significantly higher than E1 but not significantly different from E2. However, there was no significant difference between the means of the TDW of plants under E1 and E2, hence no significant difference in plant growth between environments E1 and E2.
The overall growth pattern showed a general increase in biomass accumulation as development stages progressed under each temperature environment and variety (Figure 3). However, there was a decline in the growth of Afayak from flowering to the onset of podding in E2. In the case of Jenguma, the decline in growth was sharper for E1 (hottest chamber). At the podding stage, the highest total dry biomass for both varieties were observed in E3 while the lowest for Afayak was observed in E2 (Figure 3). In general, increasing temperature led to a decline in biomass accumulation for both varieties.

3.4. Varietal Differences in Pod and Seed Weights under Varied Temperature

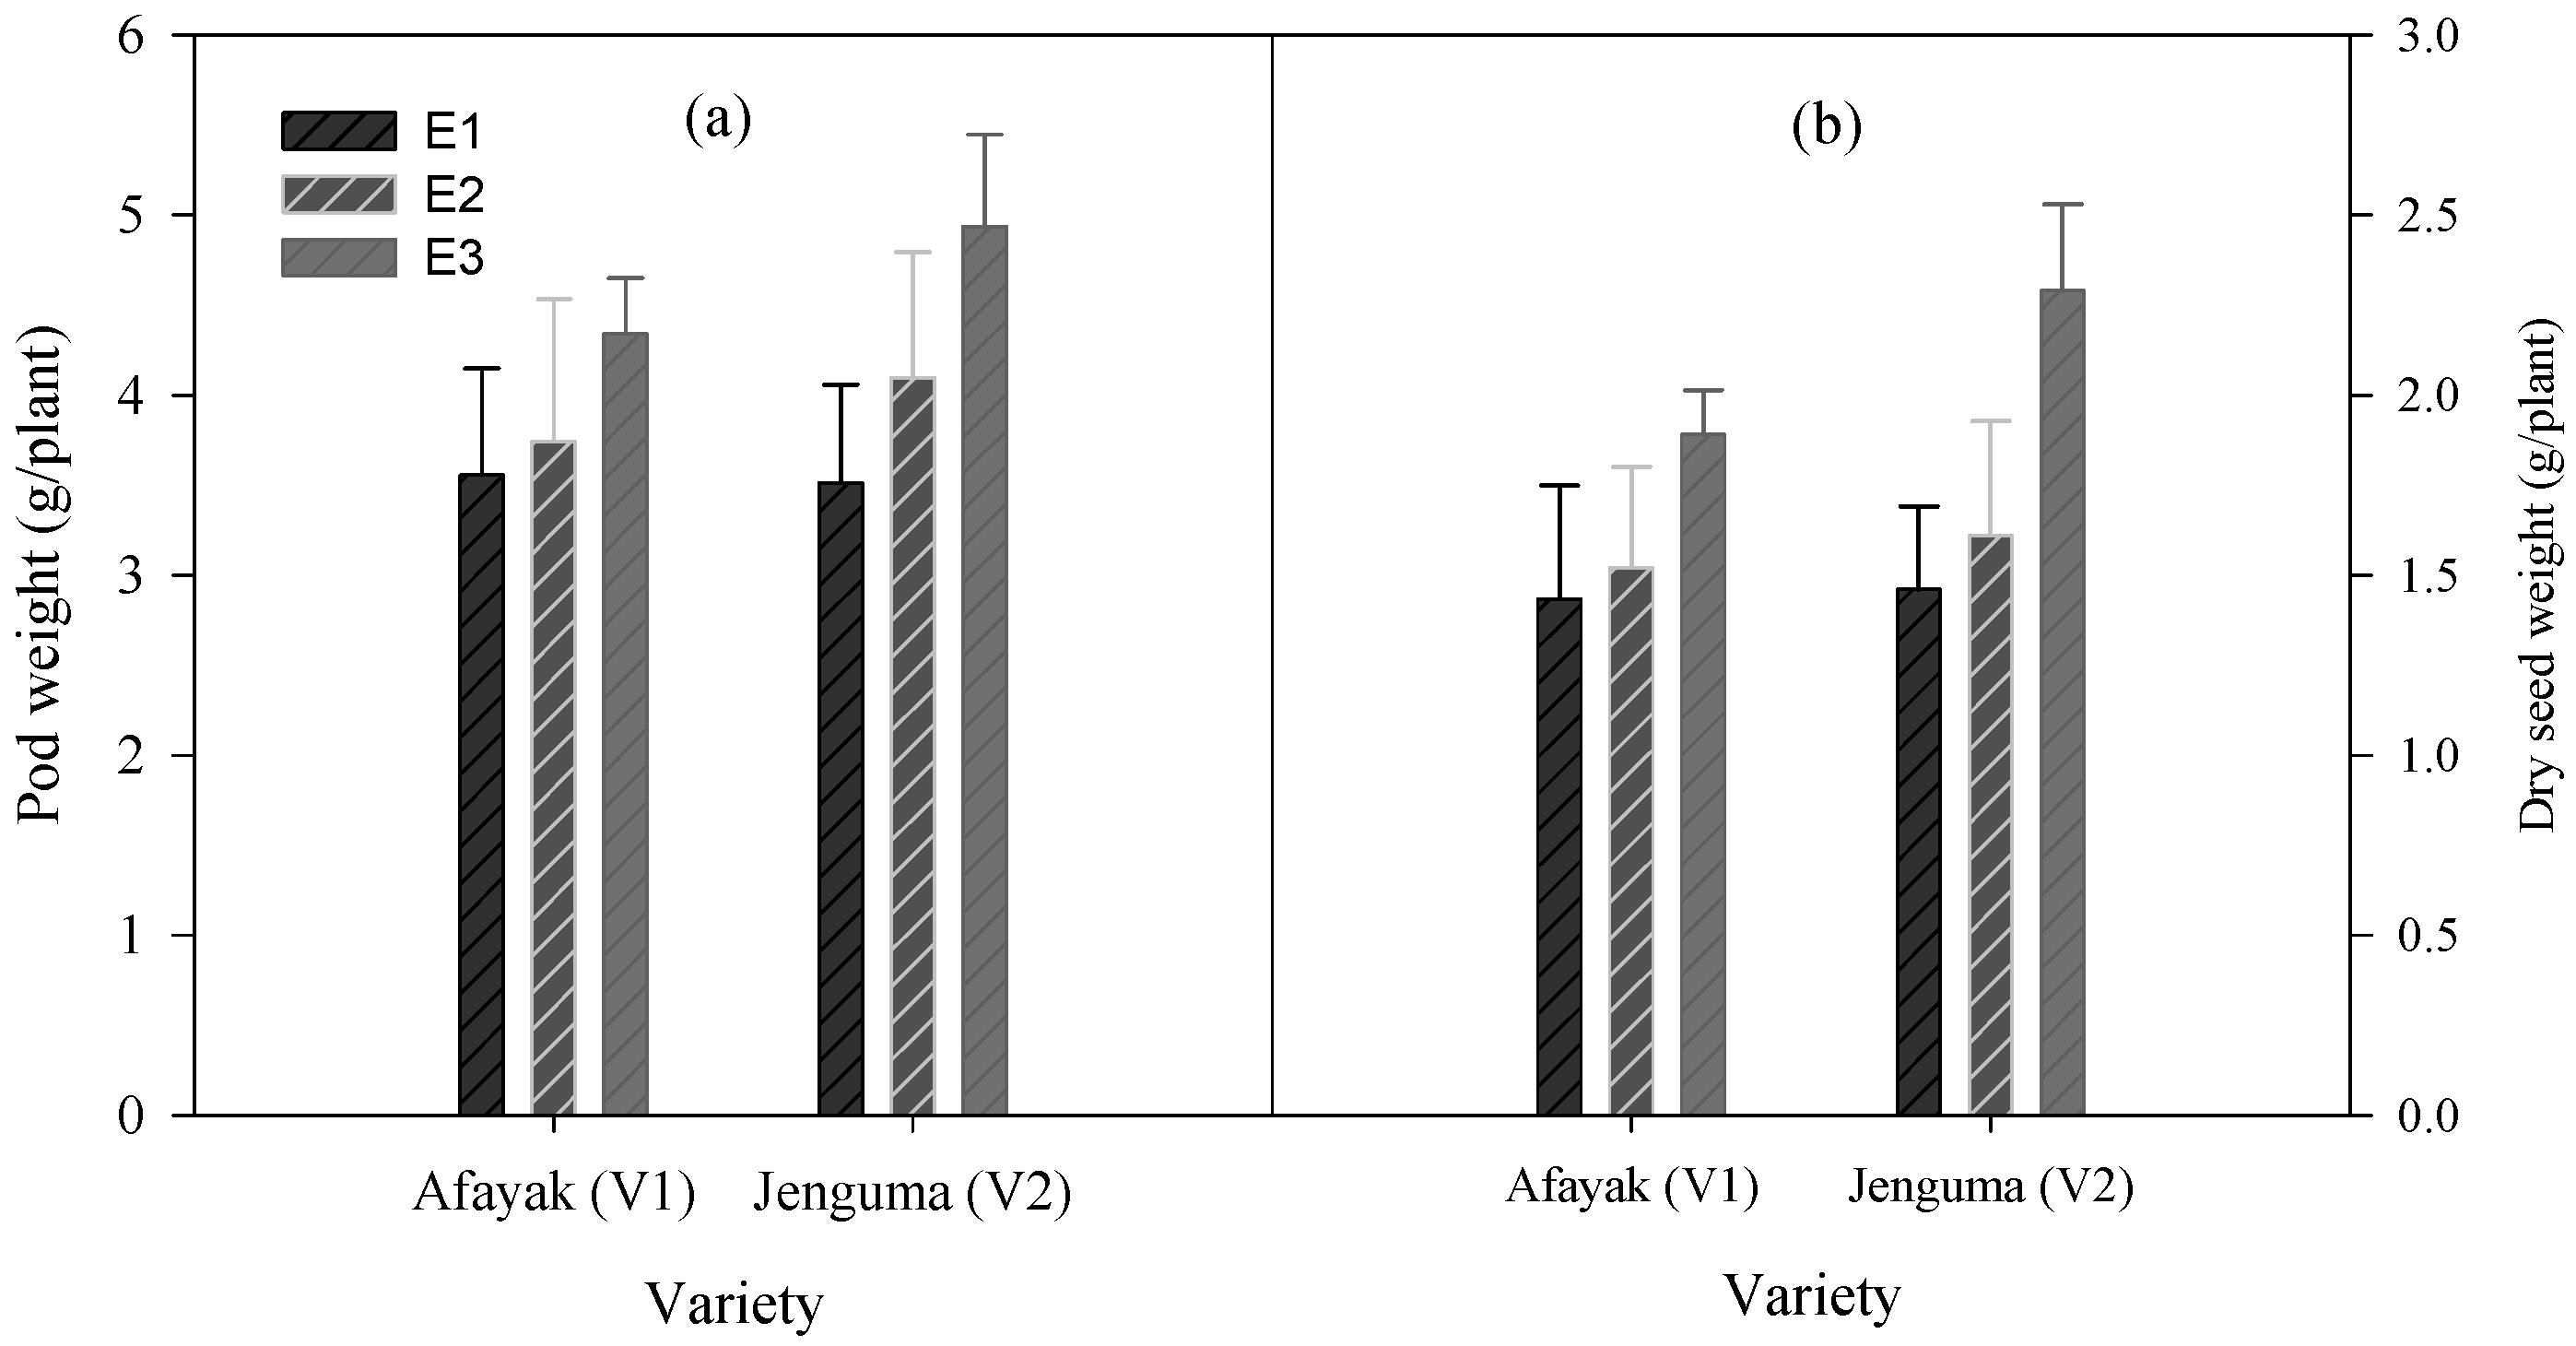
The mean pod weight of the two varieties decreased as temperature increased (Figure 4a). Pod weight decreased from 4.52 g/plant in E3 to 3.91 g/plant in E1 for Afayak variety representing 13% reduction while for Jenguma variety, there was a significant decrease in pod weights from 4.97 g/plant in E3 to 3.81 g/plant in E1 representing 20% loss. Although for Afayak, the decrease was not significant among the three environments (E1, E2 and E3) for Jenguma, the difference in the mean pod weights under E3 were significantly higher than those in the other two environments (E1 and E2). Environment had significant effect on dry seed weight of both varieties (Figure 4b), with decreased dry seed weight when temperature increased. Grain yields reduced by 24% and 29% for the Afayak and Jenguma varieties respectively. Thus, grain yield was negatively affected by high temperatures. However, Jenguma had significantly higher yield than Afayak in E3.

3.5. Effect of Water Treatments on Yield under Varied Temperature

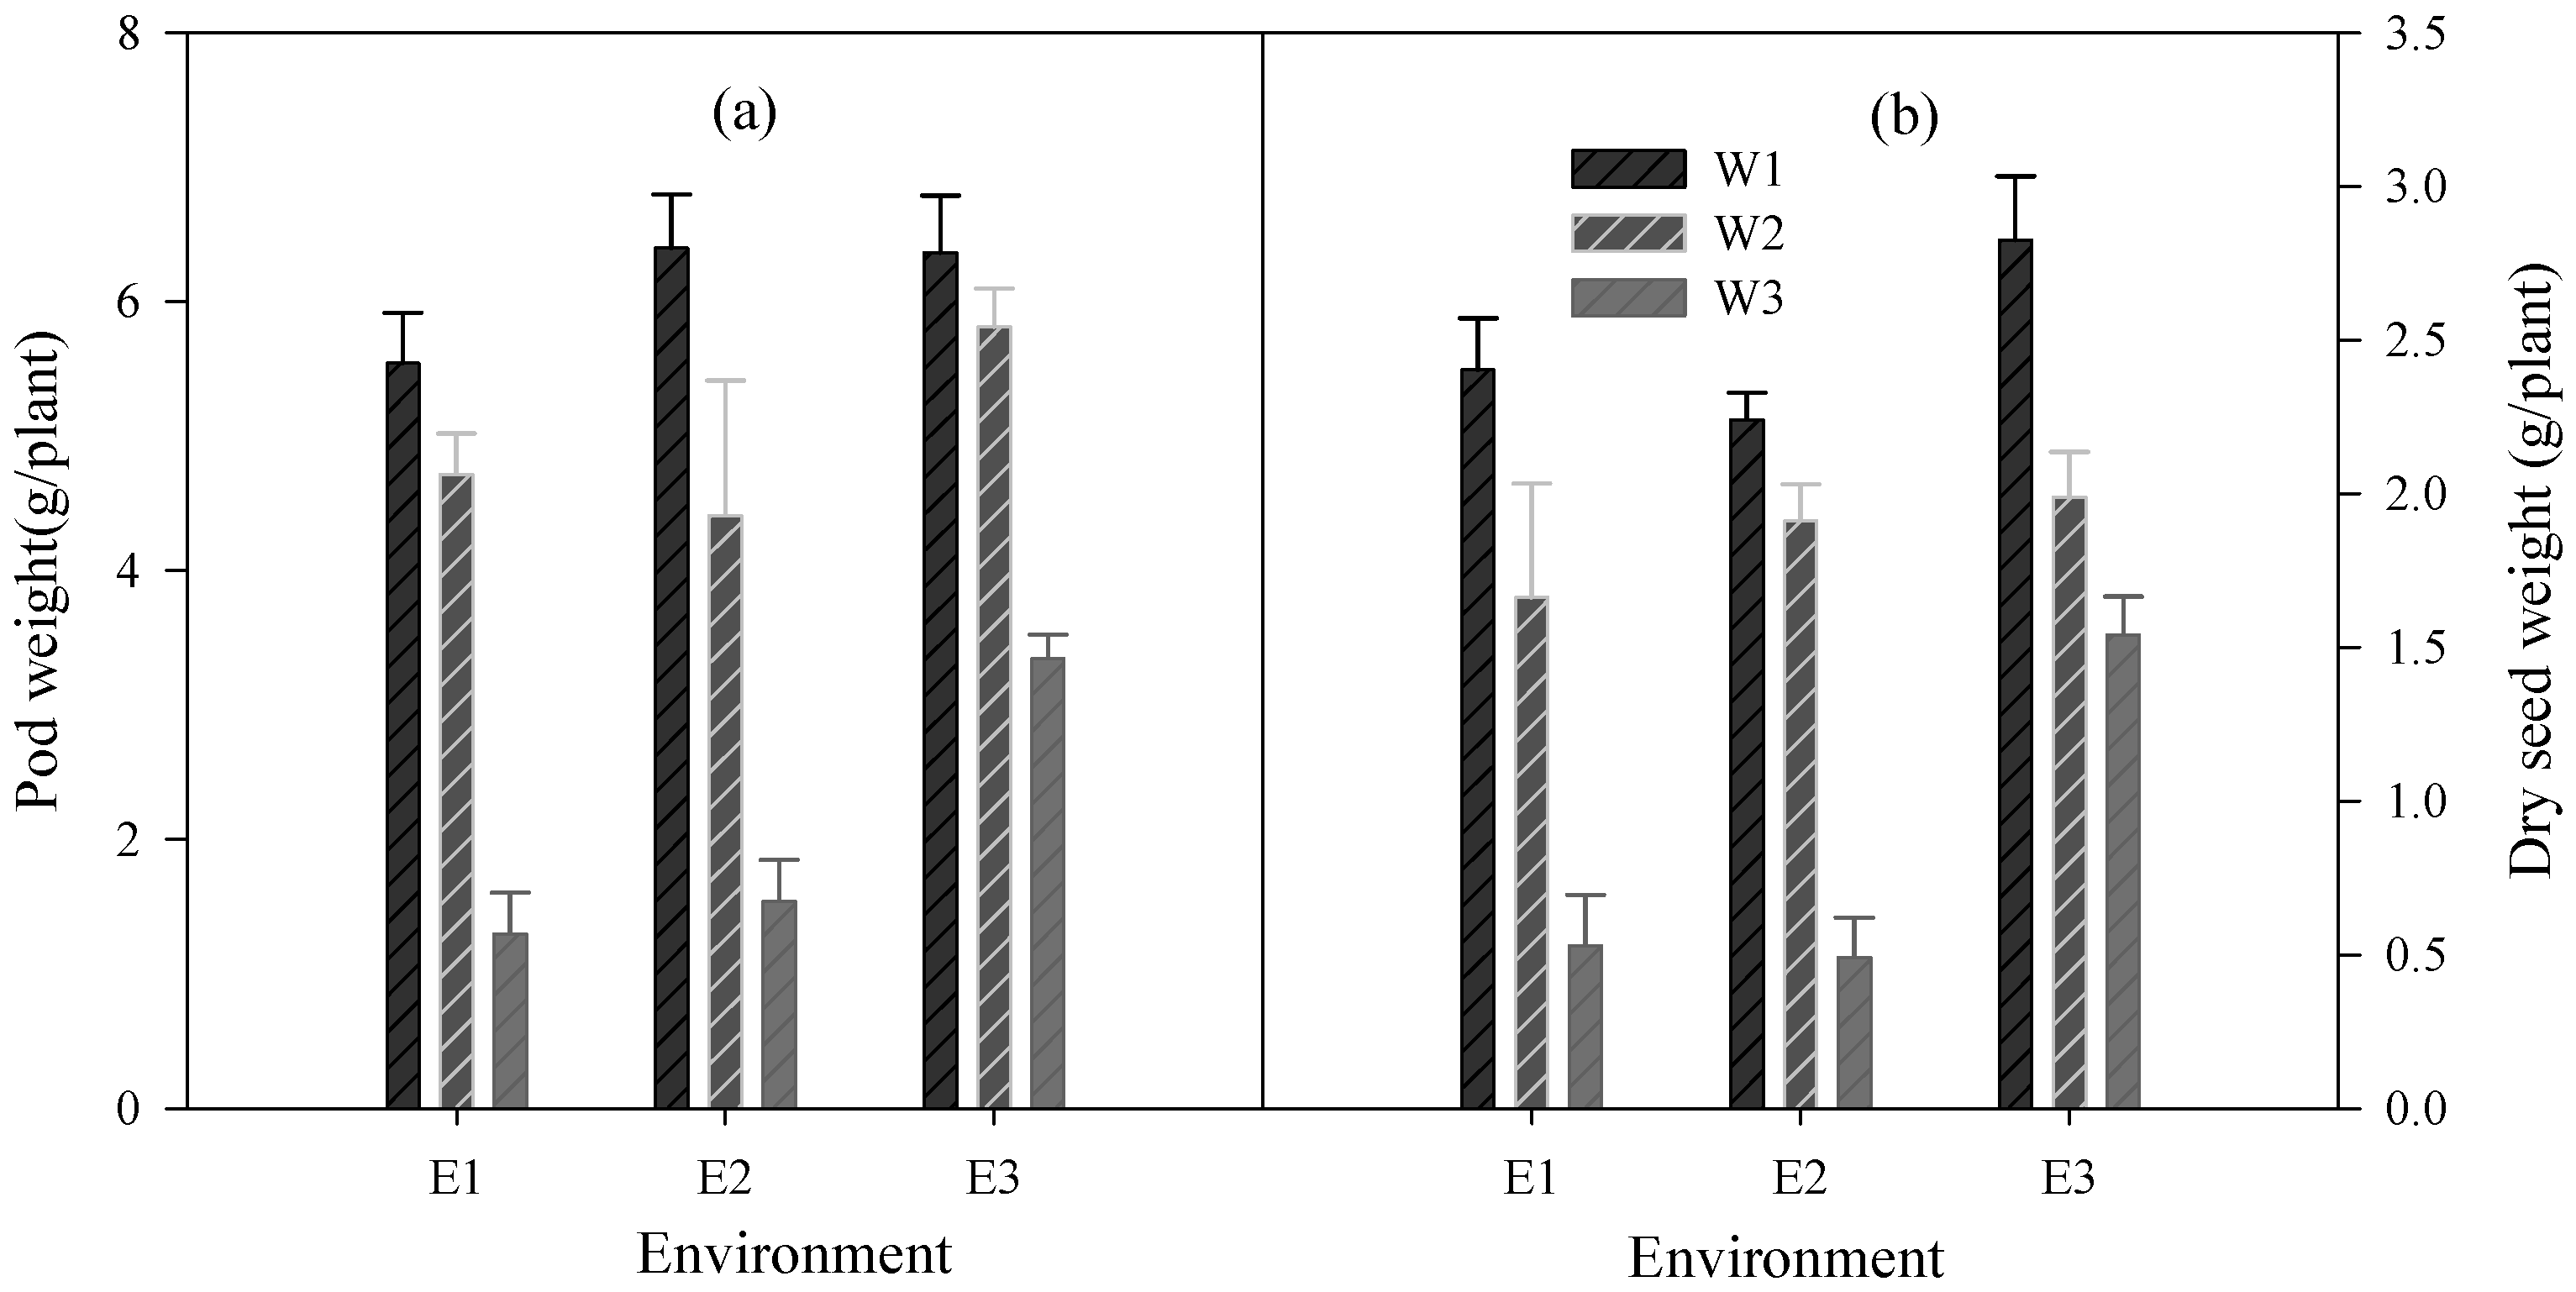
Imposing water stress at post-flowering (W3) yielded the lowest mean pod weights, while the near saturation soil moisture condition (W1) recorded the highest mean pod weights across the different environments (Figure 5a). Means of the pod weights under water treatment; W1 were different among the environments with those in E1 having the least mean pod weight. The mean pod weights under the water treatments; W1 and W2 were similar in E1. There were significant differences in pod weights among the water treatments across environments. The dry seed weight under W1 was significantly higher than W2 and W3 across environments with the water treatments under E3 having the highest dry seed weights (Figure 5b). As with mean pod weight, the post-flowering soil water deficit (W3) had the least dry seed weight in all three environments. Seed weights under E1 and E2 were statistically different from E3. However, there was no statistical difference between E1 and E2.
The interactive effect of temperature and water on pod weights was significant (Table 3). Generally, pod weight increased as water content increased under reducing temperature. The combined effect of temperature and water stress led to significantly low pod weight under the E1 and E2 conditions with mean yield losses of 63 and 54%, respectively. Except for the ambient temperature condition (E3), the W3 (soil water deficit) treatment produced the lowest pod weight among the water treatments while W1 produced the highest pod weight. The effect of soil water deficit at post-flowering was more severe in E1 and E2 (with yield declines of 71 and 66%, respectively) relative to those in E3.

4. Discussion

Temperature and water (rainfall) are major environmental factors that impact plant growth. In this study, the range of temperatures realized in the chambers mimic those observed in the tropics and the possible future increases as predicted under climate change [20,21]. Several authors have predicted increase in temperature over the years [4,20,21]. Data in Ghana has shown that the country has a high temperature with the average annual temperature ranging between 24 °C to 30 °C. In spite of this, there are instances where the temperature can be as high as 40 °C in northern Ghana [2]. Similarly, moisture stress due to erratic rainfall pattern is known to be a major constraint to crop production. Therefore, the chambers represented field conditions quite well. Furthermore, given the steady temperature rise and the range of soil water used in this study, our treatments provide a good basis to study the future of soybean performance in the region.
Differences in soybean response to temperature varied with variety, with the response to temperature for the loss in pod weight in the Jenguma variety being doubled in comparison to the effect on the Afayak variety. High daily temperatures reaching 41 °C in E1 would have been detrimental to soybean growth, given that the optimum temperature range is reported to be between 20 and 35 °C [22]. Another study [23] stated that the optimum temperature (Topt) for soybean growth is generally 30 °C. Even in the cooler chambers, maximum daily temperatures reached 39 °C in E2 and 38 °C in E3. Several studies have shown that temperature influences the development, growth, and yields of crops [24,25]. In this study, differences were observed in the development of the soybean varieties (Afayak and Jenguma) in the three environments (E1, E2, and E3). The environment E1, which had the highest average temperature of 36 °C led to the shortest time to 50% flowering in both varieties as compared to the other two environments (Table 1). This pattern of response conforms to other studies. For example, a study by [26], showed that a certain soybean variety sown at a high temperature season had a shorter time to flowering of 18 days after sowing (DAS) compared to 28 DAS for sowing in a cooler season. In another study, [11] reported that an increase in temperature led to a significant reduction in each phenological stage in soybean.
In this study, the Afayak variety was more responsive to temperature with regard to development than the Jenguma variety. Under all the three environments, 50% podding for Jenguma occurred at 52 DAE (Table 1). Another plant development component that is affected by temperature is plant height and node appearance. These two components involve cell division with their rate of appearance higher under elevated temperatures. In this study, plant height for both varieties increased over time and were enhanced under increasing temperature (especially under the hottest environment). Earlier research conducted by [27], showed that increases in temperature enhanced rapid vegetative growth. Other authors also reported increased height in canola plants under high temperature conditions [28]. In soybean, node development is a precursor to leaf development, the main photosynthetic apparatus of the plant. Hence, both node and leaf appearance rates affect the overall growth and yield. This study indicated that an initial rapid rate of node appearance was more obvious with the Afayak variety under the high temperature environment E1 (Figure 2b). The Jenguma variety also showed an increasing rate in node appearance with increased temperature. This is consistent with the results of research conducted by [29,30]. Similar trend was observed for number of leaves as node appearance leads to leaf formation [31].
Elevated temperature also reduced biomass accumulation as earlier indicated by Hatfield and Prueger [9], who showed that extremely high temperatures reduced significantly the total vegetative dry weight of maize. High temperatures potentially accelerate senescence and decrease leaf chlorophyll content particularly during the grain filling period [32,33]. In this study, plants in the elevated temperature environments produced lower pod weights of between 17 to 40% which could be attributed to increasing temperatures. Hatfield et al. [8] stated that increases in temperature have the potential to reduce yield by between 2.5% and 10%. Our finding is also supported by [34] who indicated that soybean seed yield was sensitive to increase in temperature resulting in seed yield reduction.
Another component of climate change of relevance to plant growth is rainfall. The water stressed treatment (W3; soil water deficit) had the lowest mean pod weight for all the environments. This implies that soil water stress condition is capable of reducing pod weights even under ambient temperature. This is in agreement with the findings by Hatfield and Prueger [9], which showed that under water deficit conditions, there was reduced biomass and grain yield under both ambient and high temperature conditions. Reduced pod and seed yield under soil water deficit situation in this study is due to insufficient moisture for proper growth and development which may have disrupted photosynthetic activities. Plants normally close their stomata under water stress conditions resulting in the reduction in uptake of carbon dioxide and hence, biomass accumulation declines. Qaseem et al. [34] observed that water stress resulted in 45% reduction in grain yield compared to the 66 to 71% observed in this study. The higher yield reduction in the current study could be attributed to the fact that, water stress occurred at the reproductive stage which is known to be very sensitive to water stress. Moisture stress at the reproductive stage interferes with the translocation of metabolites (accumulated in the stems and leaves during the vegetative stage) to the grains, thereby resulting in reduced grain size and hence, grain yield. Another study explained the reduction in soybean yield under water stress to be attributable to hormonal imbalance in the leaves that results in growth inhibition, reduced chlorophyll content and the relative water content in leaves [35,36]. In effect, continuous biomass production is impaired, and the final seed production is adversely affected. Another study [37] attributed soybean yield reduction under water stress during the reproductive period to accelerated leaf senescence and shortening of the seed filling duration.
Increasing temperature trends will also increase the atmospheric demand for water as was observed under the highest temperature condition (in the current study) which recorded the highest potential evapotranspiration (224 mm) while E2 and E3 had cumulative actual evapotranspiration rates of 208 and 185 mm, respectively. Increased water vapour deficit will lead to increased leaf transpiration rate leading to a higher leaf temperature and hence, reduced photosynthetic activity [9]. Thus, the increasing temperature trends will increase the atmospheric demand for water. If drought frequency increases (which is often associated with climate change) then the combination of high temperatures and drought can be detrimental to plant growth and productivity. This is due to the fact that the higher evaporative demand at elevated temperature forces the stomata to close and thereafter leads to reduced transpiration and photosynthesis [38,39]. Hence, less assimilates are available for optimum growth. These explain the reduction in dry matter accumulation, pod and seed yield of E1 and also E2 observed in the current study.
The combined effect of both high temperature and water stress on yield of many crops is believed to be greater than the singular effects of each stress [33]. We have observed in this study that the interactive effect of increasing temperature led to drastic reduction in pod and seed weights (Table 3), especially under the highest temperature condition. Water deficits has been shown to aggravate the effect of increasing temperature on plant biomass [12,39]. This drastic yield reduction can be attributed to a number of factors such as higher evaporative demand at increasing temperature which causes the stomata to close and thereafter leads to reduced transpiration and photosynthesis [40]. Also, if plants are exposed to extreme temperature conditions, water stress could occur quickly since the plant lacks sufficient capacity to extend its roots deeper into the soil profile to extract available water in the deeper soil profile (hence its inability to meet the increased atmospheric demand). The effect of temperature and water deficit in this study were severe mainly due to the fact that the combined effect of the stress factors occurred during the reproductive stage at which time the plants lack adequate plasticity to recover from the effect of the stress factors. The drastic reductions in the total biomass accumulation at maturity observed for the environments E1 and E2 at the high temperatures corresponds with the findings by [11] who also observed that temperature and water stress significantly reduced the total above ground biomass of soybean at harvest. Other studies [11,33] reported that the interactive effect of temperature and water stress reduced soybean yield particularly so when water stress occurred during the reproductive stage. Qaseem et al. [34] reported 56% decrease in yield of wheat due to combined heat and drought stress which was higher than the individual effects of 43% and 53% for drought and heat stress, respectively. In all cases, combined stress of high temperature and soil water deficit were more detrimental than the individual effect. Thus, the findings of this study agreed with previous observations.
Overall, the Jenguma variety had higher yields than the Afayak variety and appeared to be more tolerant to environmental (both temperature and soil water) stress. There hasn’t been any previous comparison regarding the performance of these two varieties under increasing temperature and drought conditions, even though Asafo-Adjei et al. [16] reported higher grain yields for Jenguma compared to other soybean under ambient temperatures. However, when the stresses became extreme, both varieties failed in performance.

5. Conclusions

This study provides information on the response of soybean growth and yield under potential future changes in temperature and soil moisture conditions. Increased temperature beyond the optimal range resulted in the reduction in plant phenology and hence, the amount of biomass accumulated, reduction in pod and seed weight, and, for that matter, grain yield. Additionally, increased atmospheric demand for water under high temperature environment resulted in high evapotranspiration leading to high transpiration and consequently reduced photosynthetic activity of the plants, thereby contributing to biomass and grain yield loss. Both elevated temperature and water stresses post-flowering significantly impacted plant growth and yield parameters negatively. The combined effects of the two factors were more severe than the individual stresses. The Jenguma variety with a longer life cycle was more resilient to the temperature stress than the shorter cycle variety. However, under severe stress (36 °C) conditions, both varieties succumbed. Thus, increasing temperatures and possible erratic rainfall distribution, associated with climate change would likely impact adversely on the development, growth, and yield of soybean crops in Ghana.

Author Contributions

Conceptualization, L.O., D.S.M. and S.G.K.A.; data curation, L.O.; formal analysis, L.O., D.S.M. and S.G.K.A.; funding acquisition, D.S.M. and S.G.K.A.; investigation, L.O., D.S.M. and S.G.K.A.; methodology, L.O., D.S.M. and S.G.K.A.; resources, D.S.M. and S.G.K.A.; supervision, D.S.M. and S.G.K.A.; writing—original draft, L.O.; writing—review and editing, D.S.M. and S.G.K.A. All authors have read and agreed to the published version of the manuscript.

Funding

The APC was funded by Deutscher Akademischer Austauschdienst (DAAD).

Institutional Review Board Statement

Not applicable.

Informed Consent Statement

Not applicable.

Data Availability Statement

The data presented in this study are available on request from the lead author.

Acknowledgments

We acknowledge the financial support in form of scholarship to the lead author by DAAD (Deutscher Akademischer Austauschdienst). Support from the staff of the Soil and Irrigation Centre, University of Ghana is also appreciated.

Conflicts of Interest

The authors declare no conflict of interest. The funders had no role in the design of the study; in the collection, analyses, or interpretation of data; in the writing of the manuscript; or in the decision to publish the results.

References

  1. Cairns, J.E.; Hellin, J.; Sonder, K.; Araus, J.L.; MacRobert, J.F.; Thierfelder, C.; Prasanna, B.M. Adapting maize production to climate change in sub-Saharan Africa. Food Secur. 2013, 5, 345–360. [Google Scholar] [CrossRef] [Green Version]
  2. Asante, F.A.; Amuakwa-Mensah, F. Climate Change and Variability in Ghana: Stocktaking. Climate 2015, 3, 78–99. [Google Scholar] [CrossRef] [Green Version]
  3. Cameron, C. Climate Change Financing and Aid Effectiveness: Ghana Case Study. 2011. Available online: http://www.agulhas.co.uk. (accessed on 2 February 2018).
  4. MESTI. Ghana National Climate Change Policy; Ghana Ministry of Environment, Science, Technology and Innovation (MESTI): Accra, Ghana, 2013. [Google Scholar]
  5. Zougmoré, R.; Partey, S.; Ouédraogo, M.; Omitoyin, B.; Thomas, T.; Ayantunde, A.; Ericksen, P.; Said, M.; Jalloh, A. Toward climate-smart agriculture in West Africa: A review of climate change impacts, adaptation strategies and policy developments for the livestock, fishery and crop production sectors. Agric. Food Secur. 2016, 5, 26. [Google Scholar] [CrossRef]
  6. Eze, P.N. Characterization, Classification and Pedogenesis of Soil on a Legon Catena in the Accra Plains, Ghana. Master’s Thesis, Department of Soil Science, University of Ghana, Legon, Ghana, 2008. [Google Scholar]
  7. Senayah, J.; Kufogbe, S.; Dedzoe, C. Land degradation in the Sudan Savanna of Ghana: A case study in the Bawku Area. West Afr. J. Appl. Ecol. 2005, 8. [Google Scholar] [CrossRef] [Green Version]
  8. Hatfield, J.L.; Boote, K.J.; Kimball, B.A.; Ziska, L.H.; Izaurralde, R.C.; Ort, D.; Wolfe, D. Climate impacts on agriculture: Implications for crop production. Agron. J. 2011, 103, 351–370. [Google Scholar] [CrossRef] [Green Version]
  9. Hatfield, J.L.; Prueger, J.H. Temperature extremes: Effect on plant growth and development. Weather Clim. Extrem. 2015, 10, 4–10. [Google Scholar] [CrossRef] [Green Version]
  10. Paembonan, S.A.; Hagihara, A.; Hozumi, K. Long-term respiration in relation to growth and maintenance processes of the aboveground parts of a hinoki forest tree. Tree Physiol. 1992, 10, 101–110. [Google Scholar] [CrossRef]
  11. Jumrani, K.; Bhatia, V.S. Impact of combined stress of high temperature and water deficit on growth and seed yield of soybean. Physiol. Mol. Biol. Plants 2018, 24, 37–50. [Google Scholar] [CrossRef]
  12. Prasad, P.V.V.; Pisipati, S.R.; Momčilović, I.; Ristic, Z. Independent and Combined Effects of High Temperature and Drought Stress During Grain Filling on Plant Yield and Chloroplast EF-Tu Expression in Spring Wheat. J. Agron. Crop. Sci. 2011, 197, 430–441. [Google Scholar] [CrossRef]
  13. Amatekpor, J.K.; Oteng, J.W.; Agyiri, P. Field tour guide: Technical Center for Agricultural and Rural Co-operation (CTA). In Proceedings of the Sustaining Soil Productivity in Intensive African Agriculture, Accra, Ghana, 15–19 November 1993. [Google Scholar]
  14. Amatekpor, J.K.; Dowuona, G.N.N. Site Characterization. IBSRAM Vertisol Project; Department of Soil Science, University of Ghana: Legon, Ghana, 1995; p. 42. [Google Scholar]
  15. SARI. New Soybean Varieties Released. GNA. 2003. Available online: http://www.ghanaweb.com/GhanaHomepage/NewsArchive/artikel.php?ID=47098. (accessed on 15 February 2018).
  16. Asafo-Adjei, B.; Ansah, I.O.O.; Asuboah, R.A.; Dapaah, H.; Harruna, M.; Oti-Boateng, C. Soybean Production Guide; CSIR (CRI and SARI): Kumasi, Ghana, 2005; pp. 76–85. [Google Scholar]
  17. SARI. Soybean: A Production Guide for Northern Ghana; Alliance for Green Revolution in Africa Soil Health Project 2009 SHP 005; SARI: Nyankpala, Ghana, 2012; pp. 4–7. [Google Scholar]
  18. Berry, F.A.; Bolly, E.; Beers, N.R. Hand Book of Meteorology; Mcgraw-Hill Book Company, Inc.: New York, NY, USA, 1945. [Google Scholar]
  19. Hundal, S.S.; Singh, H.; Dhaliwal, L. Agroclimatic models for growth and yield of soybean (Glycine max). Indian J. Agric. Sci. 2003, 73, 668–670. [Google Scholar]
  20. Tachie-Obeng, E.; Akponikpe, P.B.I.; Adiku, S. Considering effective adaptation options to impacts of climate change for maize production in Ghana. Environ. Dev. 2013, 5, 131–145. [Google Scholar] [CrossRef]
  21. Freduah, B.S.; MacCarthy, D.S.; Adam, M.; Ly, M.; Ruane, A.C.; Timpong-Jones, E.C.; Traore, P.S.; Boote, K.J.; Porter, C.; Adiku, S.G.K. Sensitivity of Maize Yield in Smallholder Systems to Climate Scenarios in Semi-Arid Regions of West Africa: Accounting for Variability in Farm Management Practices. Agronomy 2019, 9, 639. [Google Scholar] [CrossRef] [Green Version]
  22. Meehl, G.A.; Meehl, G.A.; Stocker, T.F.; Collins, W.D.; Friedlingstein, P.; Gaye, T.; Noda, A. Global climate projections. In Climate Change 2007: The Physical Science Basis; Solomon, S., Qin, D., Manning, M., Chen, Z., Marquis, M., Averyt, K.B., Tignor, M., Miller, H.L., Eds.; Cambridge University Press: Cambridge, UK; New York, NY, USA, 2007; pp. 747–845. [Google Scholar]
  23. IPCC. Contribution of Working Groups I, II and III to the Fourth Assessment Report of the Intergovernmental Panel on Climate Change; Pachauri, R.K., Reisinger, A., Eds.; Climate Change 2007: Synthesis Report; IPCC: Geneva, Switzerland, 2007; p. 104. [Google Scholar]
  24. Viana, J.S.; Gonçalves, E.P.; Silva, A.C.; Matos, V.P. Climatic conditions and production of soybean in northeastern Brazil. In A Comprehensive Survey of International Soybean Research-Genetics, Physiology, Agronomy and Nitrogen Relationships; InTech: London, UK, 2013; pp. 377–392. [Google Scholar]
  25. Hoeft, R.G.; Nafziger, E.D.; Johnson, R.R.; Aldrich, S.R. Soybean as a crop. In Modern Corn and Soybean Production; RR Donnelley and Sons: Chicago, IL, USA, 2000; pp. 31–59. [Google Scholar]
  26. Thornton, P.K.; Ericksen, P.J.; Herrero, M.; Challinor, A.J. Climate variability and vulnerability to climate change: A review. Glob. Chang. Biol. 2014, 20, 3313–3328. [Google Scholar] [CrossRef] [PubMed]
  27. Luo, Q. Performance of agro-climate indices and wheat grain yield in a changing climate. Clim. Res. 2016, 69, 143–154. [Google Scholar] [CrossRef] [Green Version]
  28. Kumar, A.; Pndey, V.; Shekh, M.A.; Kumar, M. Growth and Yield Response of Soybean (Glycine max L.) in Relation to Temperature, Photoperiod and Sunshine Duration at Anand, Gujurat, India. Am.-Eurasian J. Sustain. Agric. 2008, 1, 45–50. [Google Scholar]
  29. Gibson, L.R.; Mullen, R.E. Influence of day and night temperature on soybean seed yield. Crop. Sci. 1996, 36, 98–104. [Google Scholar] [CrossRef]
  30. Qaderi, M.M.; Kurepin, L.V.; Reid, D.M. Growth and physiological responses of canola (Brassica napus L.) to three components of global climate change: Temperature, carbon dioxide and drought. Physiol. Plant. 2006, 128, 710–721. [Google Scholar] [CrossRef]
  31. Hesketh, J.D.; Myhre, D.L.; Willey, C.R. Temperature control of time intervals between vegetative and reproductive events in soybeans 1. Crop. Sci. 1973, 13, 250–254. [Google Scholar] [CrossRef]
  32. Tenorio, F.A.M. Temperature Control of Node Appearance and Initiation in Soybean. Master Thesis, University of Nebraska-Lincoln, Lincoln, NE, USA, 2016. [Google Scholar]
  33. Dreesen, P.E.; De Boeck, H.J.; Janssens, I.A.; Nijs, I. Summer heat and drought extremes trigger unexpected changes in productivity of a temperate annual/biannual plant community. Environ. Exp. Bot. 2012, 79, 21–30. [Google Scholar] [CrossRef]
  34. Bastidas, A.M.; Setiyono, T.D.; Dobermann, A.; Cassman, K.G.; Elmore, R.W.; Graef, G.L.; Specht, J.E. Soybean sowing date: The vegetative, reproductive, and agronomic impacts. Crop. Sci. 2008, 48, 727–740. [Google Scholar] [CrossRef] [Green Version]
  35. Qaseem, M.F.; Qureshi, R.; Shaheen, H. Effects of Pre-Anthesis Drought, Heat and Their Combination on the Growth, Yield and Physiology of diverse Wheat (Triticum aestivum L.) Genotypes Varying in Sensitivity to Heat and 0drought stress. Sci. Rep. 2019, 9, 6955. [Google Scholar] [CrossRef] [PubMed] [Green Version]
  36. Iqbal, N.; Hussain, S.; Raza, M.A.; Yang, C.-Q.; Safdar, M.E.; Brestic, M.; Aziz, A.; Hayyat, M.S.; Asghar, M.A.; Wang, X.C.; et al. Drought Tolerance of Soybean (Glycine max L. Merr.) by Improved Photosynthetic Characteristics and an Efficient Antioxidant Enzyme Activities Under a Split-Root System. Front. Physiol. 2019, 10, 786. [Google Scholar] [CrossRef] [PubMed] [Green Version]
  37. Dong, S.; Jiang, Y.; Dong, Y.; Wang, L.; Wang, W.; Ma, Z.; Yan, C.; Ma, C.; Liu, L. A study on soybean responses to drought stress and rehydration. Saudi J. Biol. Sci. 2019, 26, 2006–2017. [Google Scholar] [CrossRef]
  38. De Souza, P.I.; Egli, D.B.; Bruening, W.P. Water Stress during Seed Filling and Leaf Senescence in Soybean. Agron. J. 1997, 89, 807–812. [Google Scholar] [CrossRef]
  39. Zhu, X.G.; Long, S.P.; Ort, D.R. Improving Photosynthetic Efficiency for Greater Yield. Annu. Rev. Plant Biol. 2010, 61, 235–261. [Google Scholar] [CrossRef] [Green Version]
  40. Long, S.P.; Ort, D.R. More than taking the heat: Crops and global change. Curr. Opin. Plant Biol. 2010, 13, 240–247. [Google Scholar] [CrossRef]
Figure 1. (a) Temperature (°C) and (b) relative humidity (%) in the growth chambers throughout the duration of the experiment.
Agriculture 12 00043 g001
Figure 2. Differences in (a) plant height and (b) node appearance (c) leaf appearance for the two varieties under varying environment (E1: 36 °C, RH: 55%; E2: 34 °C, RH: 57%; and E3: 33 °C, RH: 44%).
Agriculture 12 00043 g002
Figure 3. Environmental change on plant biomass accumulation at different developmental stages (BF, before flowering; Fw, flowering; Pd, podding) in two soybean varieties. (E1: 36 °C, RH: 55%, E2: 34 °C, RH: 57% and E3: 33 °C, RH: 44%).
Agriculture 12 00043 g003
Figure 4. Environmental effect on (a) pod weight and (b) dry seed weight of both soybean varieties.
Agriculture 12 00043 g004
Figure 5. Interaction of environment and different water regimes on (a) pod weight and (b) dry seed weights (E1: 36 °C and RH—55%, E2: 34 °C and RH—57%, and E3: 33 °C and RH—44%. W1, W2, W3 are near saturation, field capacity, and drought, respectively. The vertical bars are standard errors of the means).
Agriculture 12 00043 g005
Table 1. Chronological days and thermal time for developmental stages.
EnvironmentVarietyFloweringPoddingMaturity
CT (DAE)TT (°Cd)CT (DAE)TT (°Cd) CT (DAE)TT (°Cd)
E1 (36 °C)Afayak37894481176972416
E1 (36 °C)Jenguma399285212651012506
E2 (34 °C)Afayak388955011941042530
E2 (34 °C)Jenguma409355212341012429
E3 (33 °C)Afayak40893501134972271
E3 (33 °C)Jenguma419135211741012360
Environment (Envt) 0.001 0.123 0.001
Variety (Var) 0.003 0.001 0.001
Envt × Var 0.604 0.178 0.001
CT, chronological time; TT, thermal time; DAE, days after emergence.
Table 2. Effect of environment on total dry biomass weight (TDW) at the vegetative and flowering stages.
Environment (Envt)Variety
(Var)
Vegetative (g/Plant)Flowering (g/Plant)Podding (g/Plant)
E1 (36 °C)Afayak0.854.014.57
E2 (34 °C)Afayak2.183.526.07
E3 (33 °C)Afayak1.835.227.48
E1 (36 °C)Jenguma2.174.695.53
E2 (34 °C)Jenguma2.65.066.62
E3 (33 °C)Jenguma2.826.048.63
Envt0.670.950.35
lsd (0.05)Var0.610.650.29
Envt × Var0.951.180.43
Table 3. Effects of environment and water as well as their interaction on seed weight and pod weight showing varietal differences.
Environment (Envt)WaterVariety
(Var)
Dry Seed
Weight (g/Plant)
Pod Weight (g/Plant)
E1 (36 °C)112.39 cd6.21 efg
122.14 bcd5.09 defg
211.83 bc4.65 def
221.99 bcd4.78 defg
310.27 a0.88 a
320.63 a1.55 ab
E2(34 °C)112.20 cd6.22 fg
122.66 de6.62 fg
211.51 b4.61 de
221.76 bc4.29 de
310.68 a1.75 abc
320.38 a1.33 a
E3 (33 °C)112.29 bcd5.71 efg
123.15 e6.76 g
211.96 bcd4.43 de
222.03 bcd4.36 de
311.59 bc3.43 cd
321.49 b3.24 bcd
L.S. D (0.05)Envt 0.280.70
Water 0.280.70
Var 0.230.57
Envt × Water 0.481.22
Envt × Var 0.400.99
Water × Var 0.400.99
Envt × Water × Var 0.681.72
Common letters are not significantly different (p < 0.05) according to Duncan multiple range test. Variety 1 (V1), Afayak; Variety 2 (V2), Jenguma; Water 1 (W1), near saturation; Water 2 (W2), field capacity; Water 3 (W3), soil water deficit.
Publisher’s Note: MDPI stays neutral with regard to jurisdictional claims in published maps and institutional affiliations.