
Production and Profitability of Hybrid Rice Is Influenced by Different Nutrient Management Practices

 ,
,  ,
,  , , ,
, , ,  , ,
, ,  ,
,  and
and
Abstract
1. Introduction
2. Materials and Methods
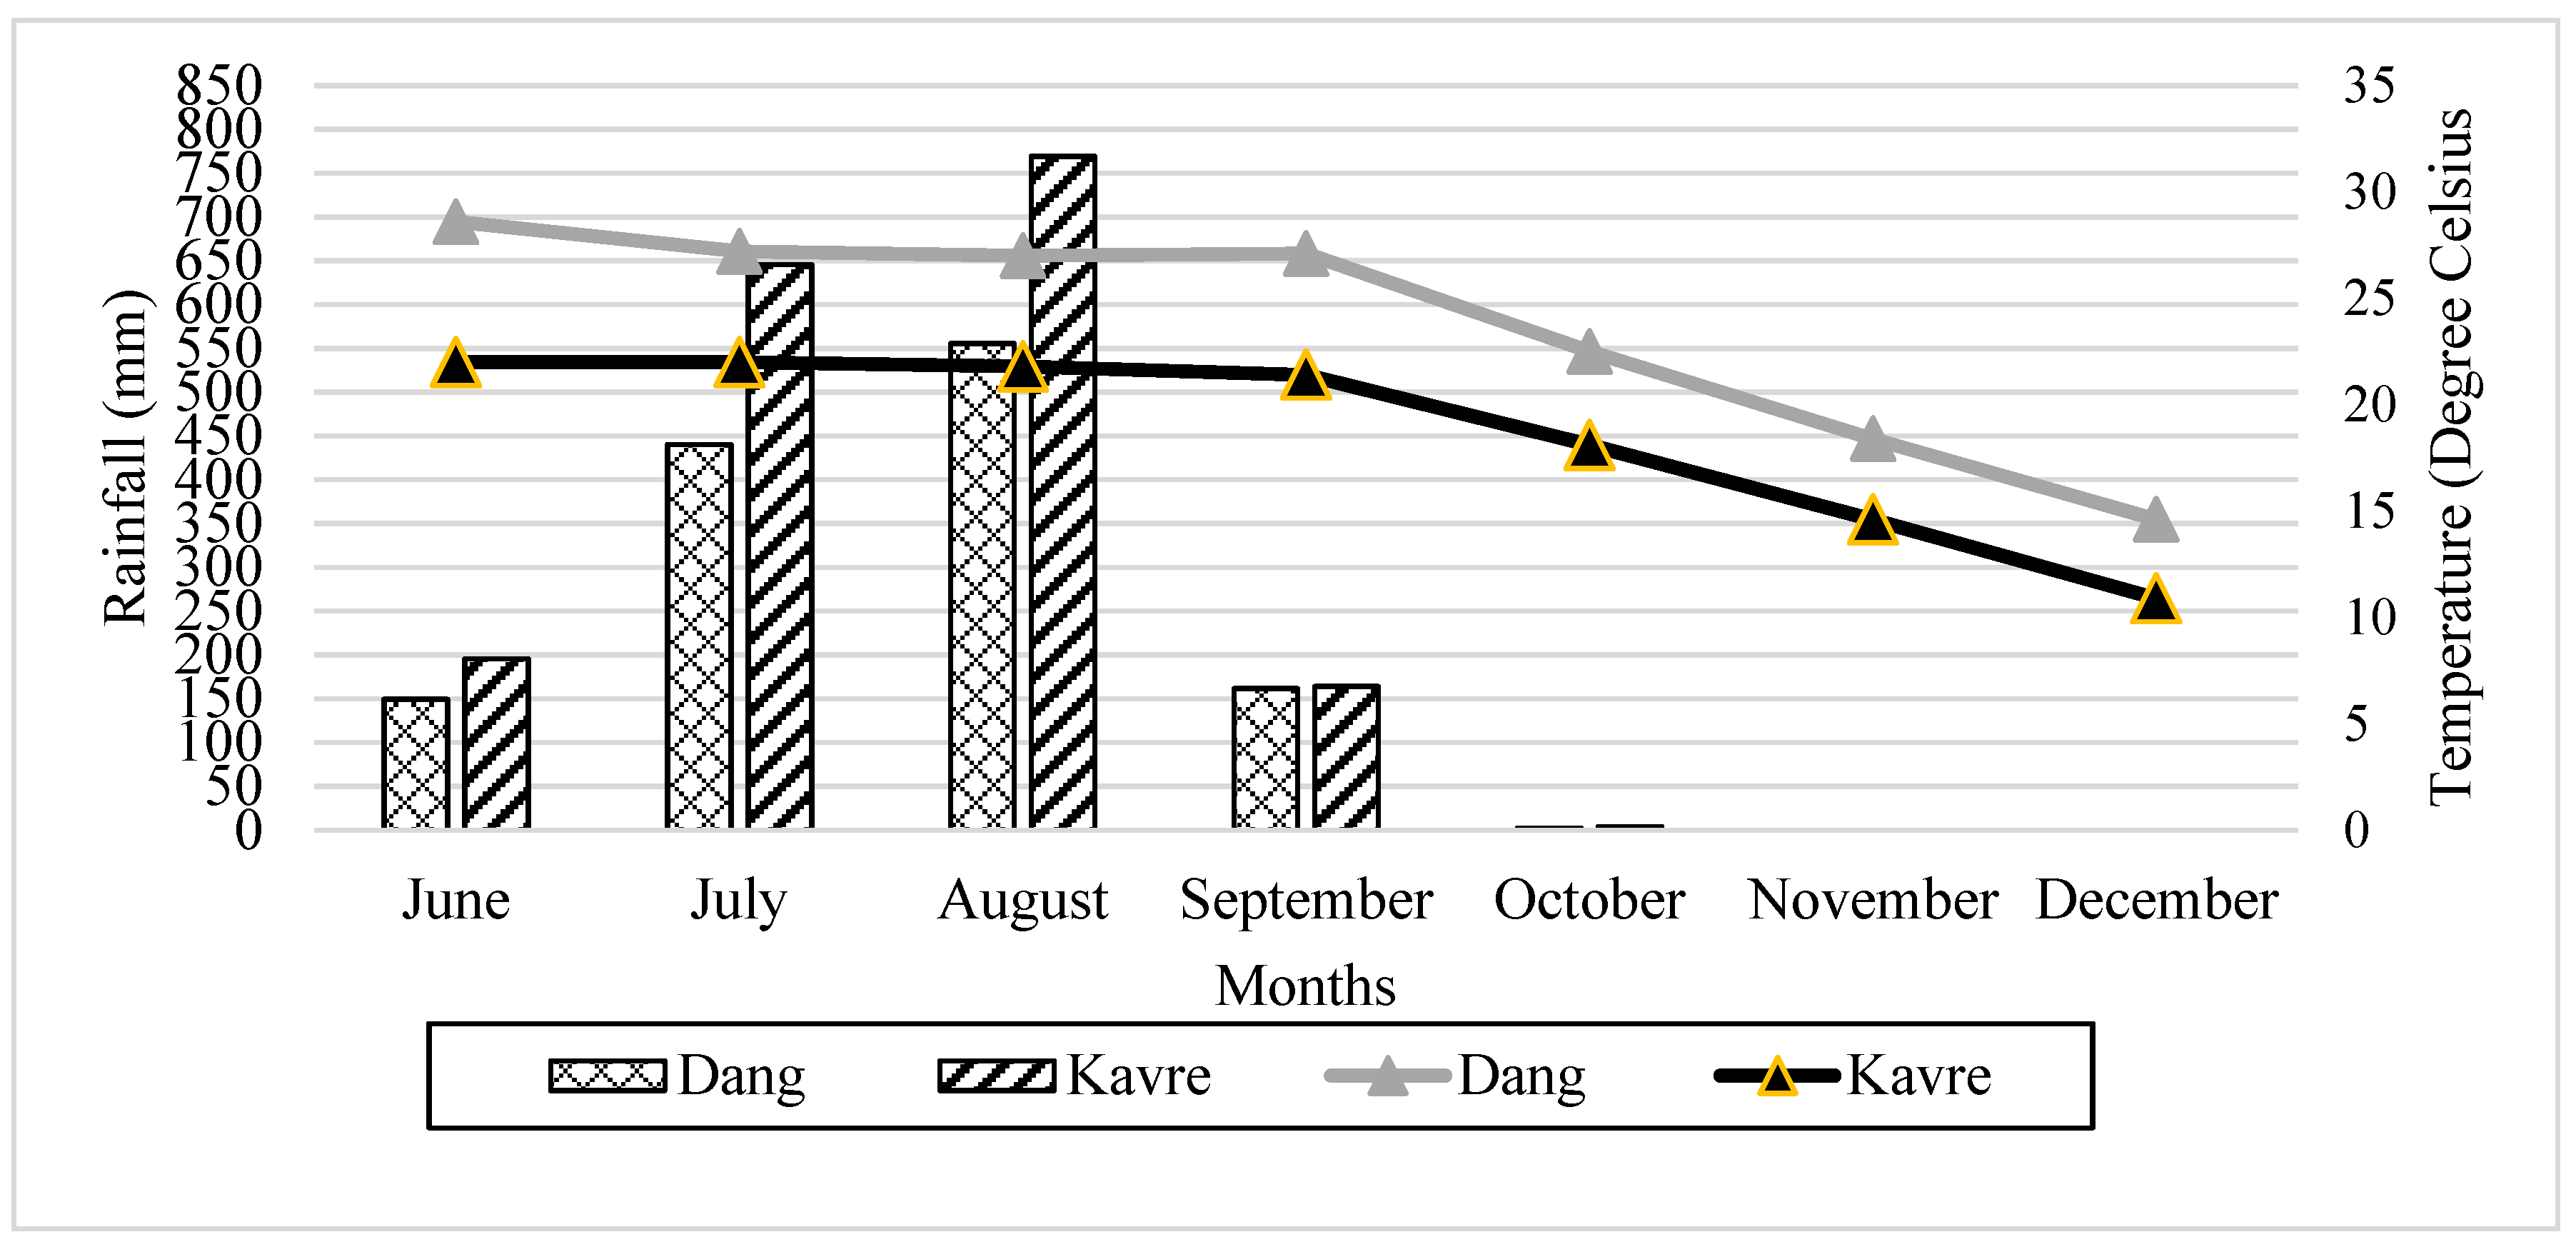
2.1. Study Site and Weather Conditions
2.2. Experimental Setup and Crop Management
2.3. Measurement and Data Collection
2.4. Data Analysis
3. Results and Discussion
3.1. Result of Mean Performance of Rice Traits
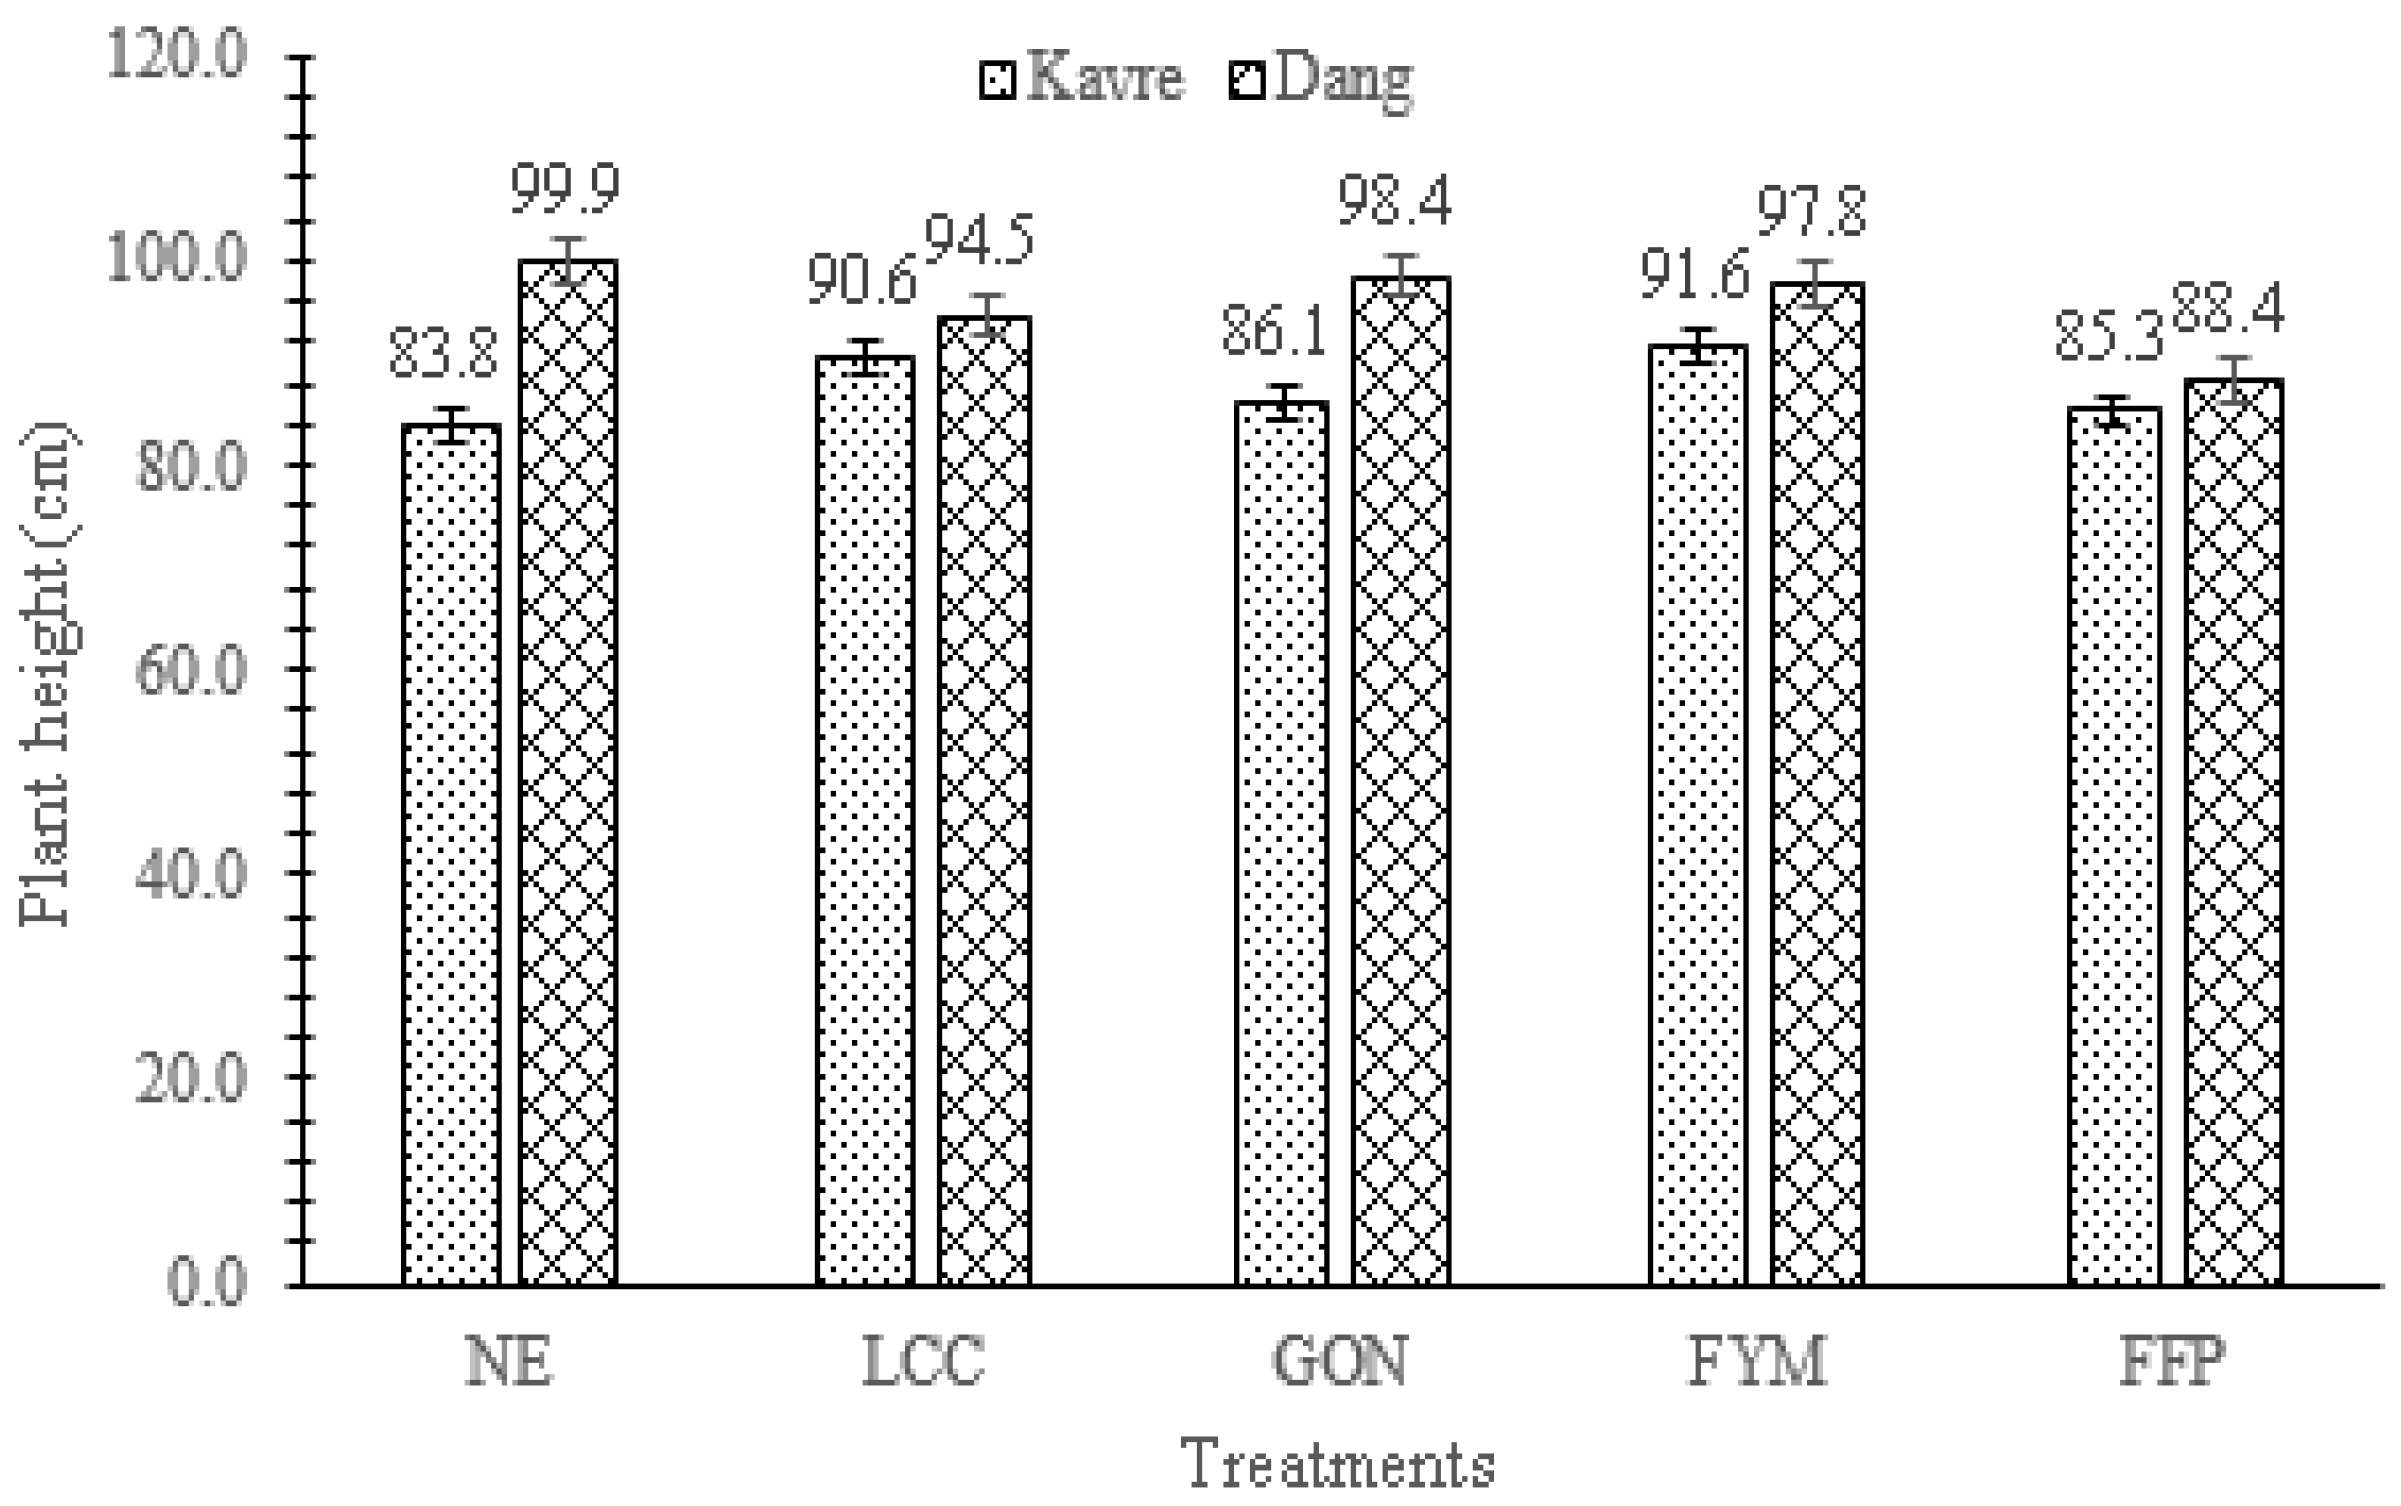
3.1.1. Plant Height (PH)
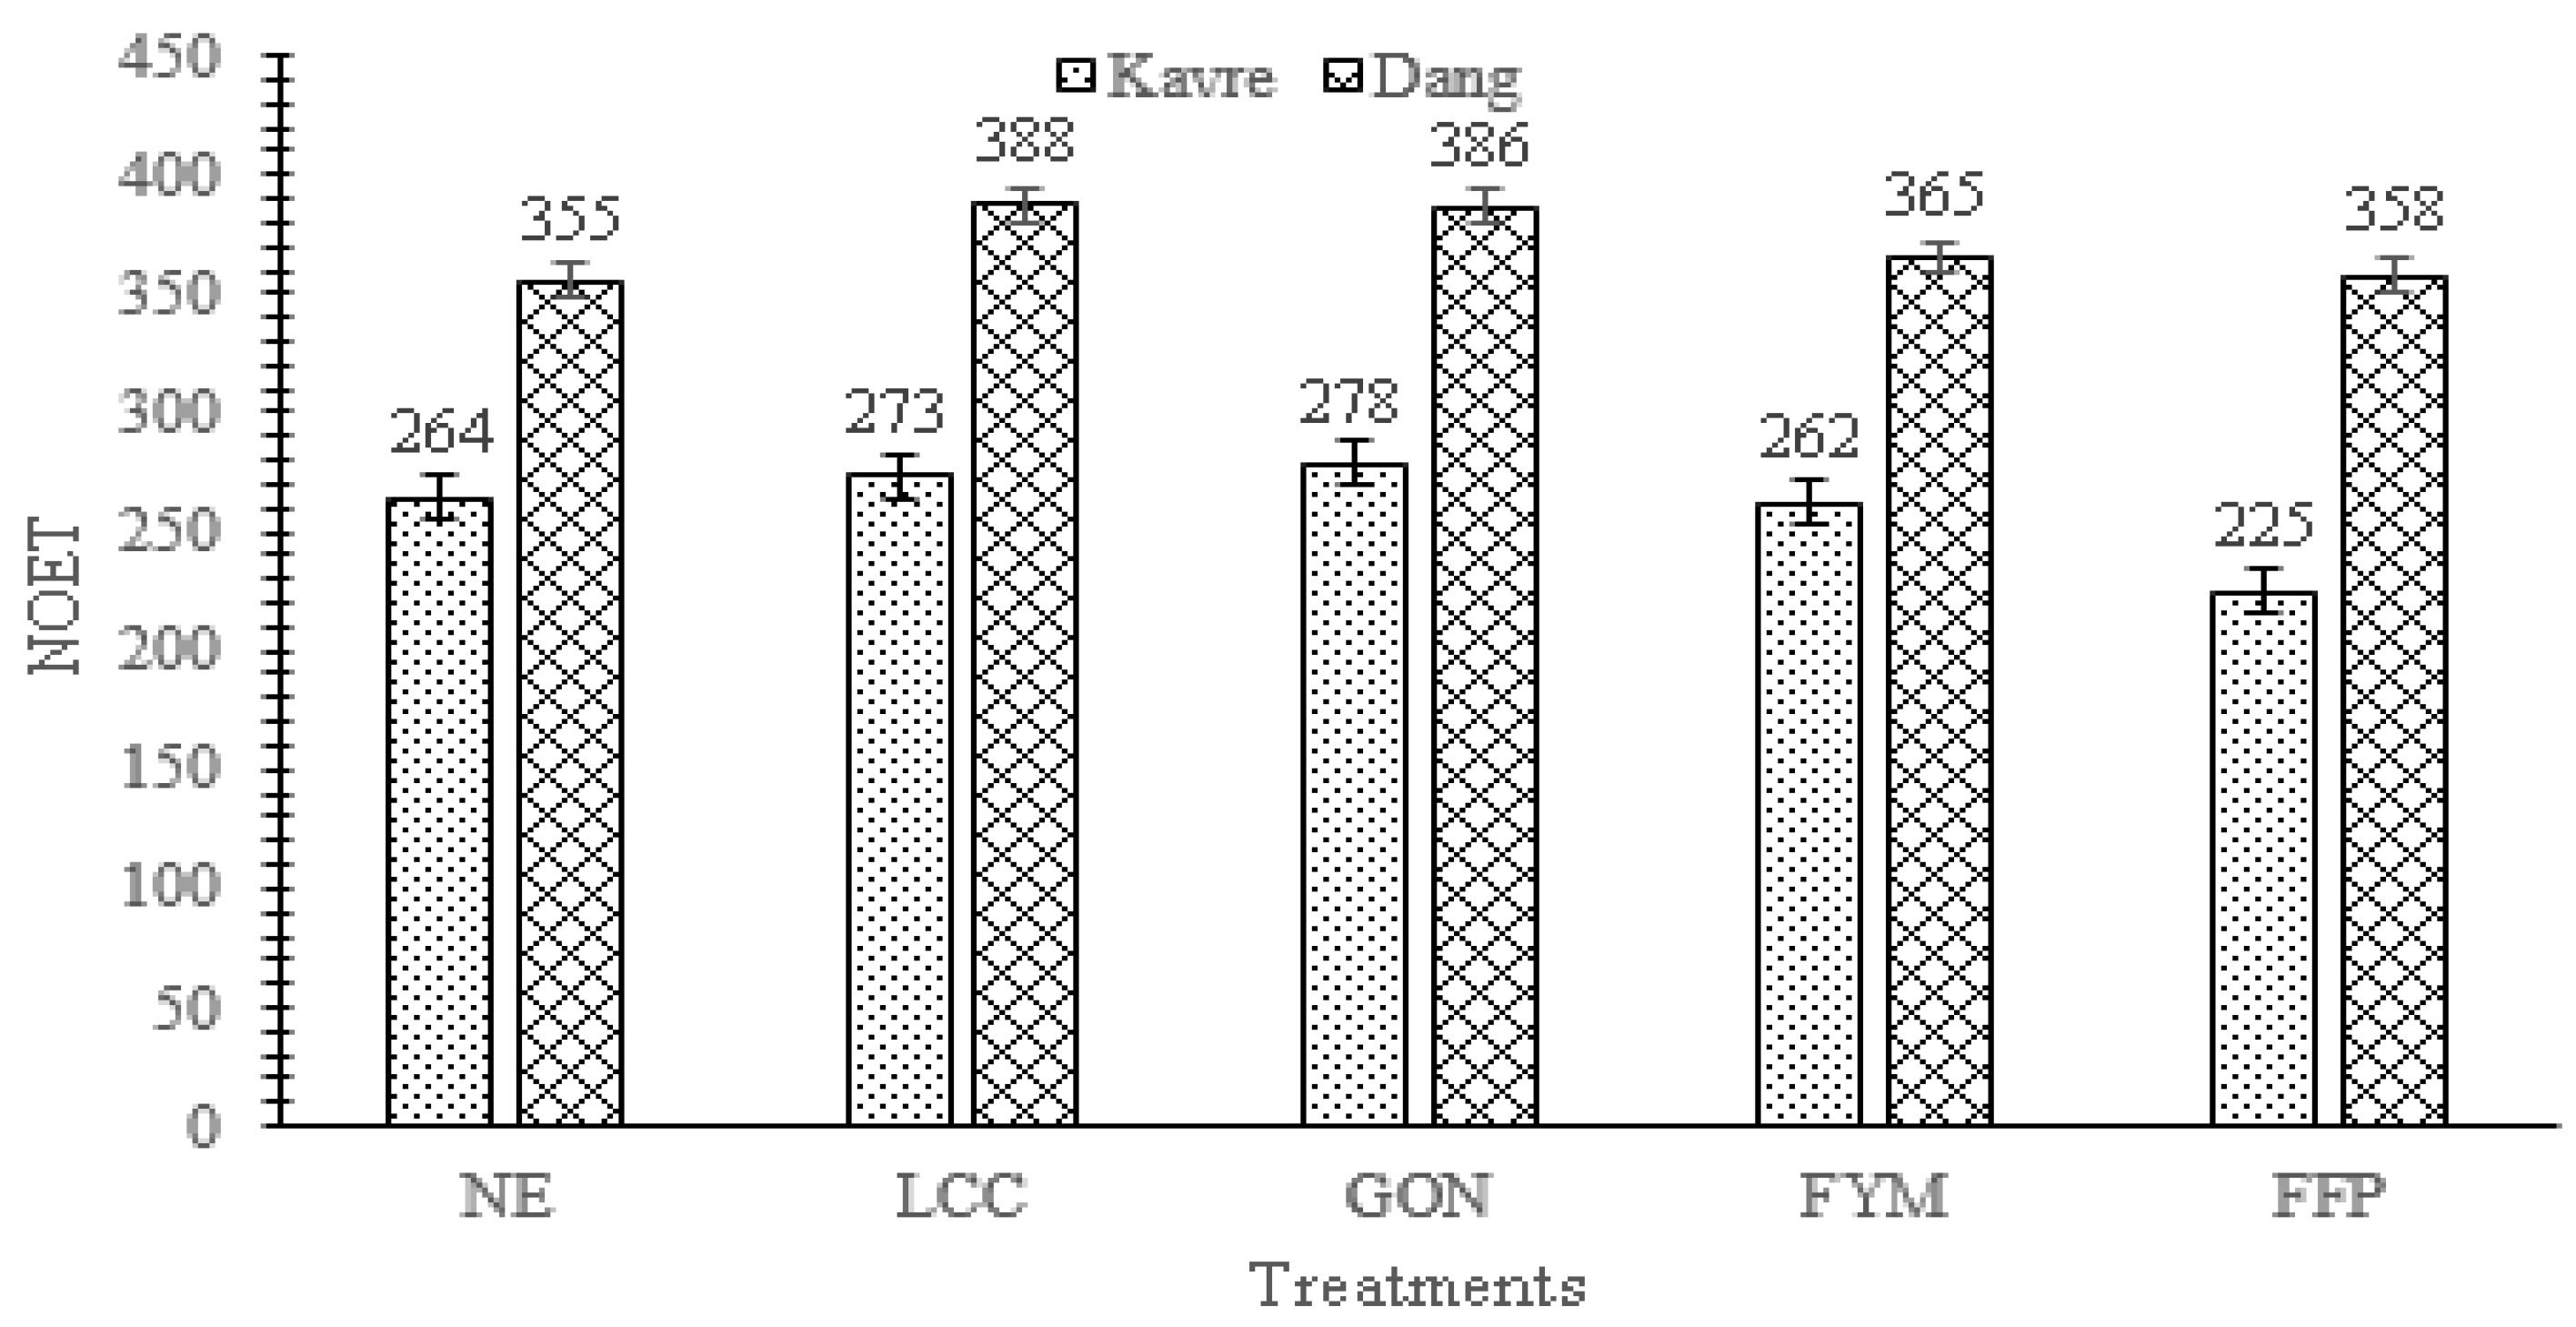
3.1.2. Number of Effective Tiller (NOET)
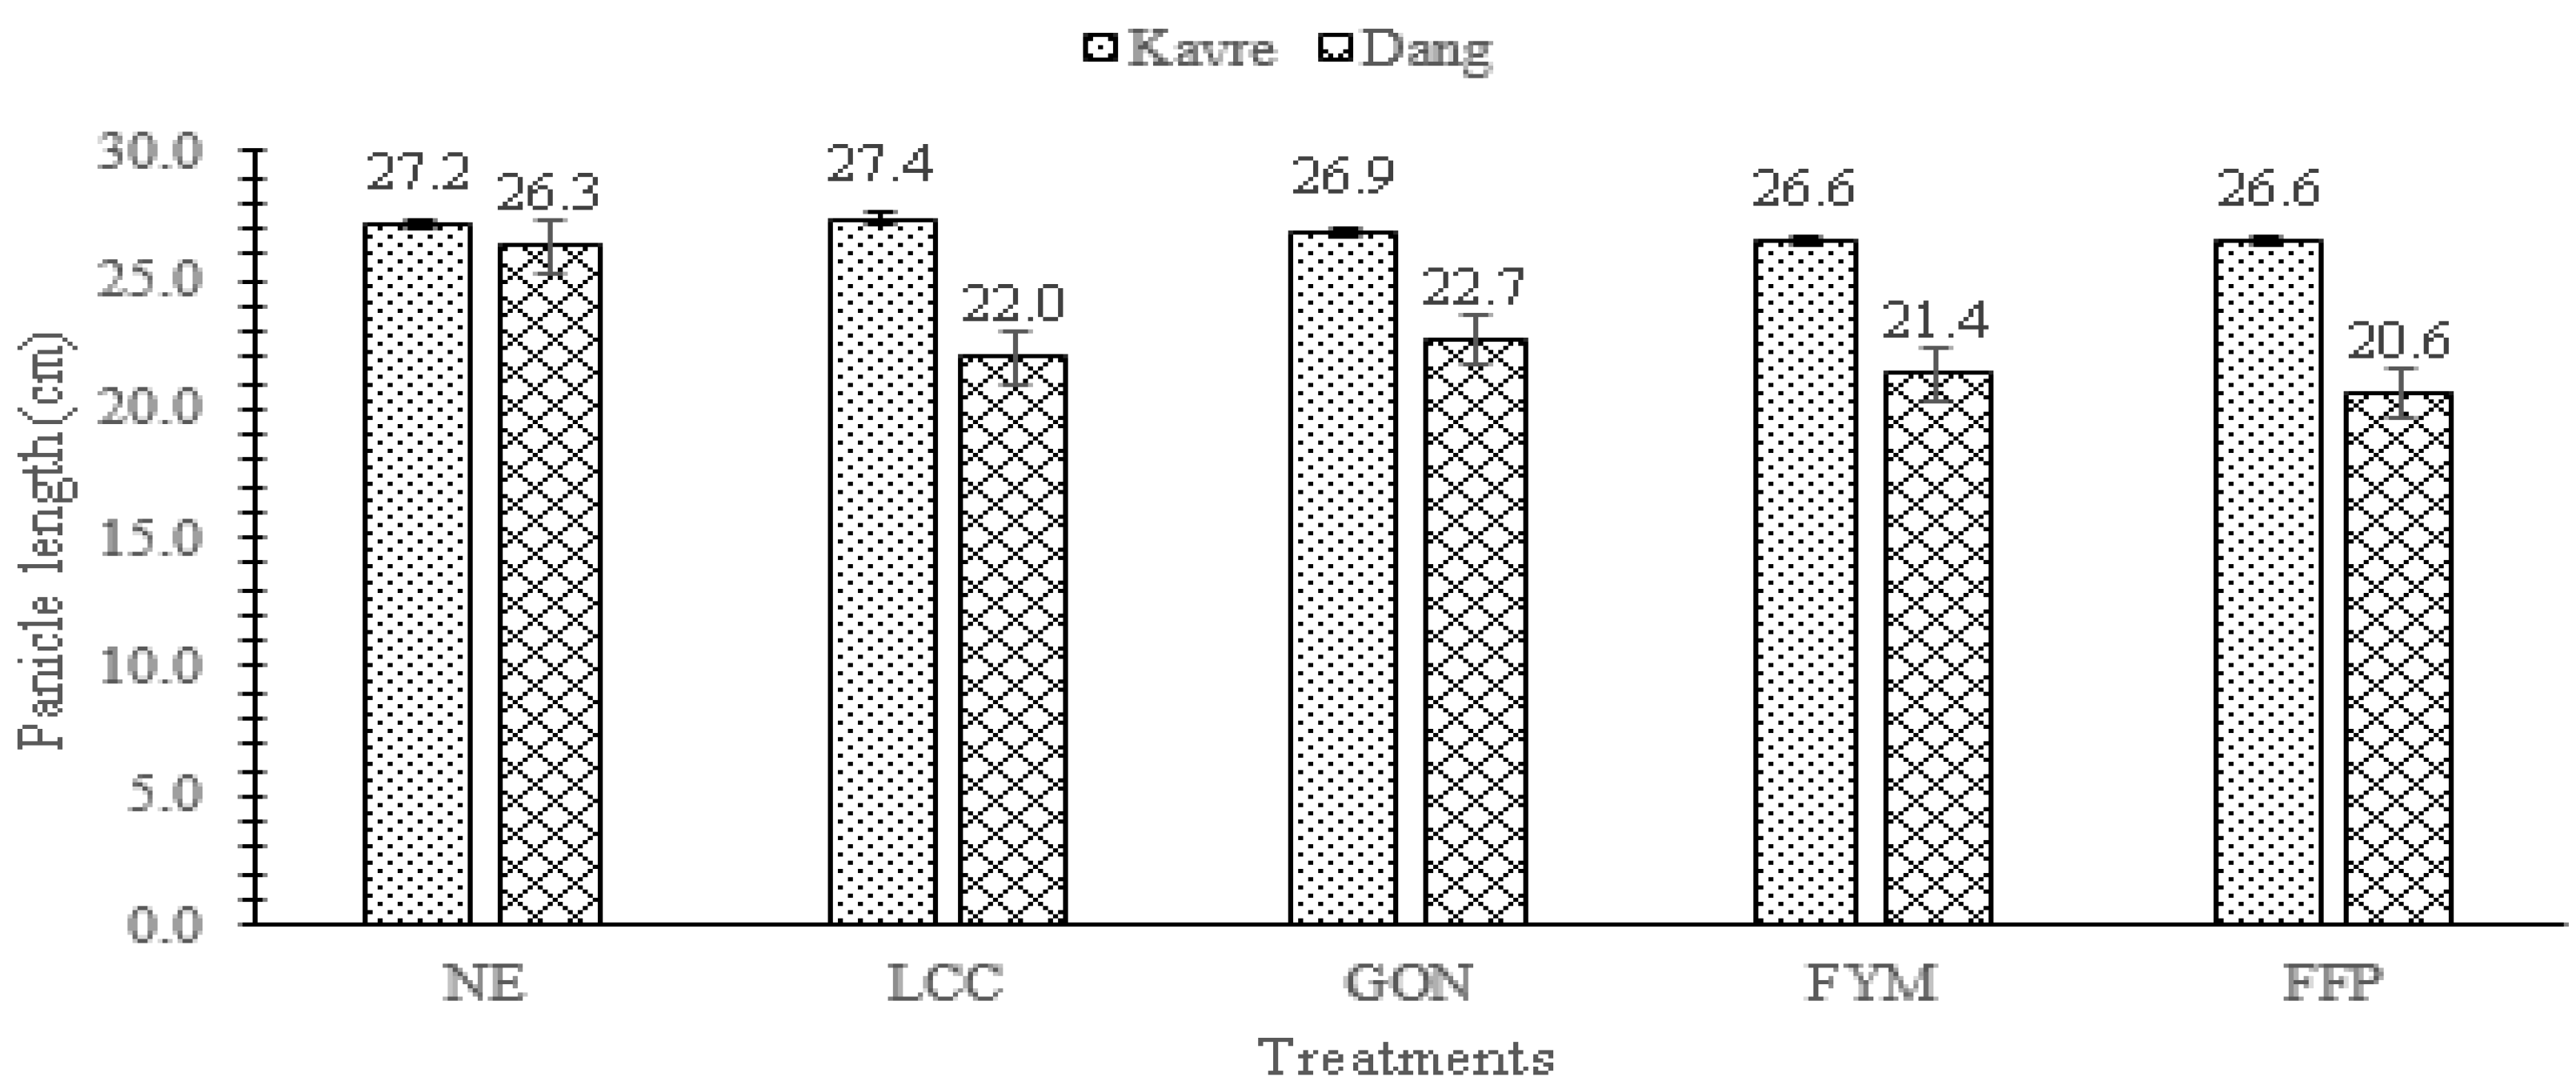
3.2. Panicle Length (PL)
3.3. Kavre
3.4. Dang
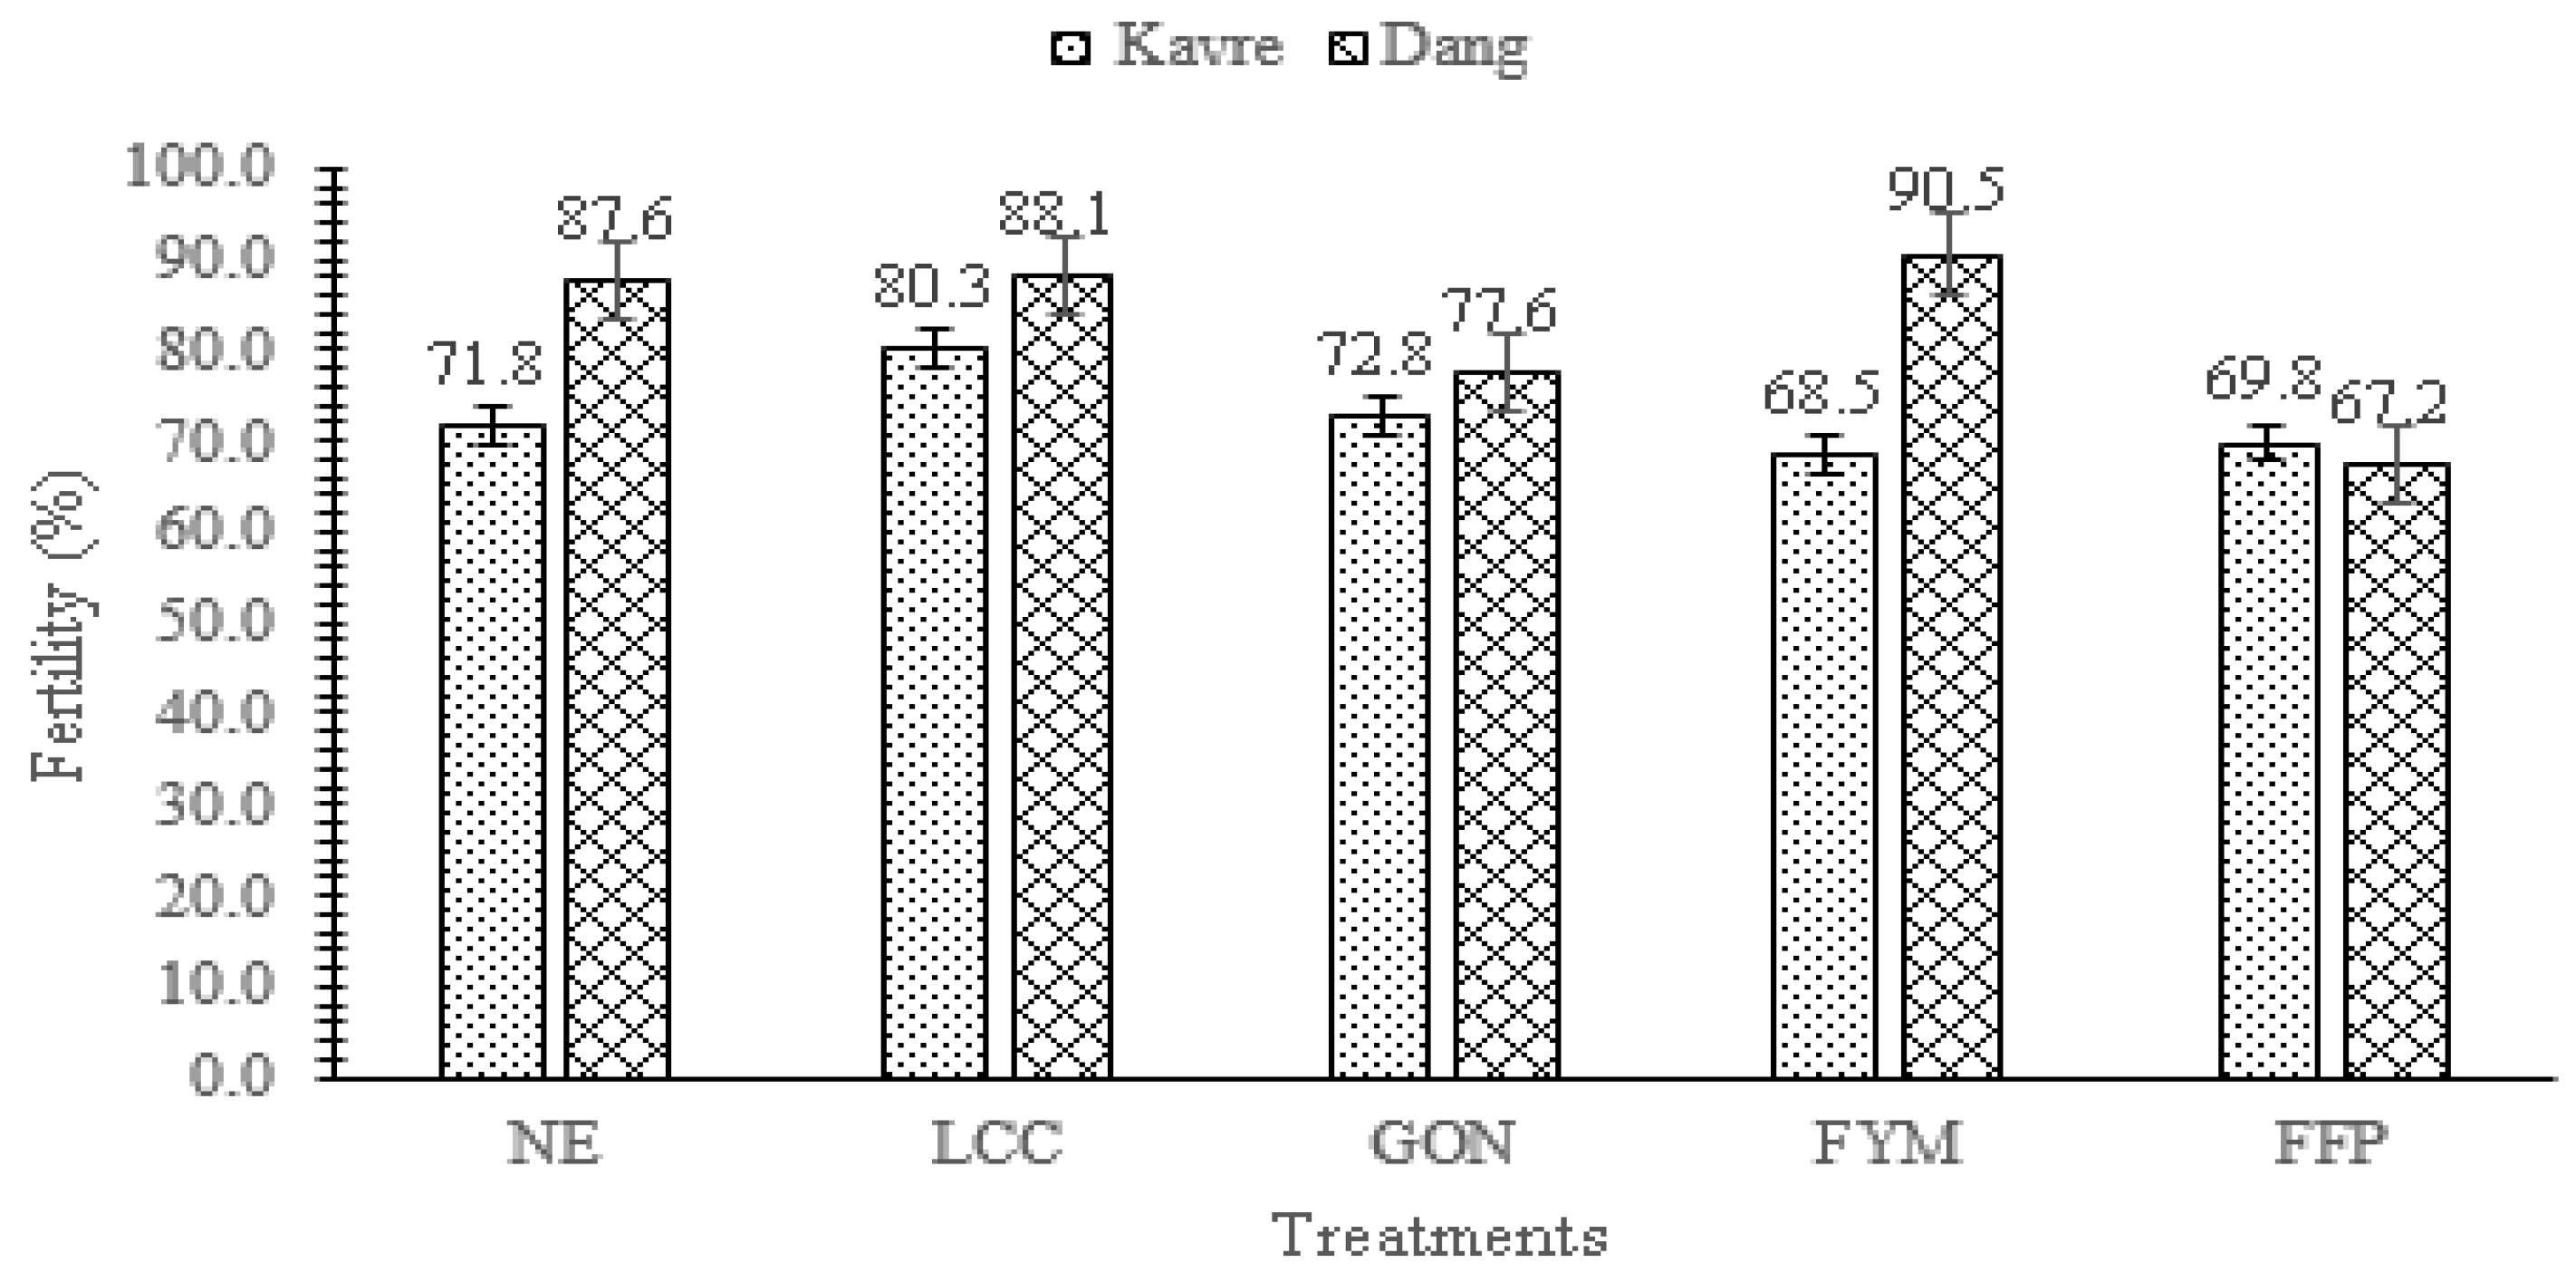
3.5. Fertility (FT)
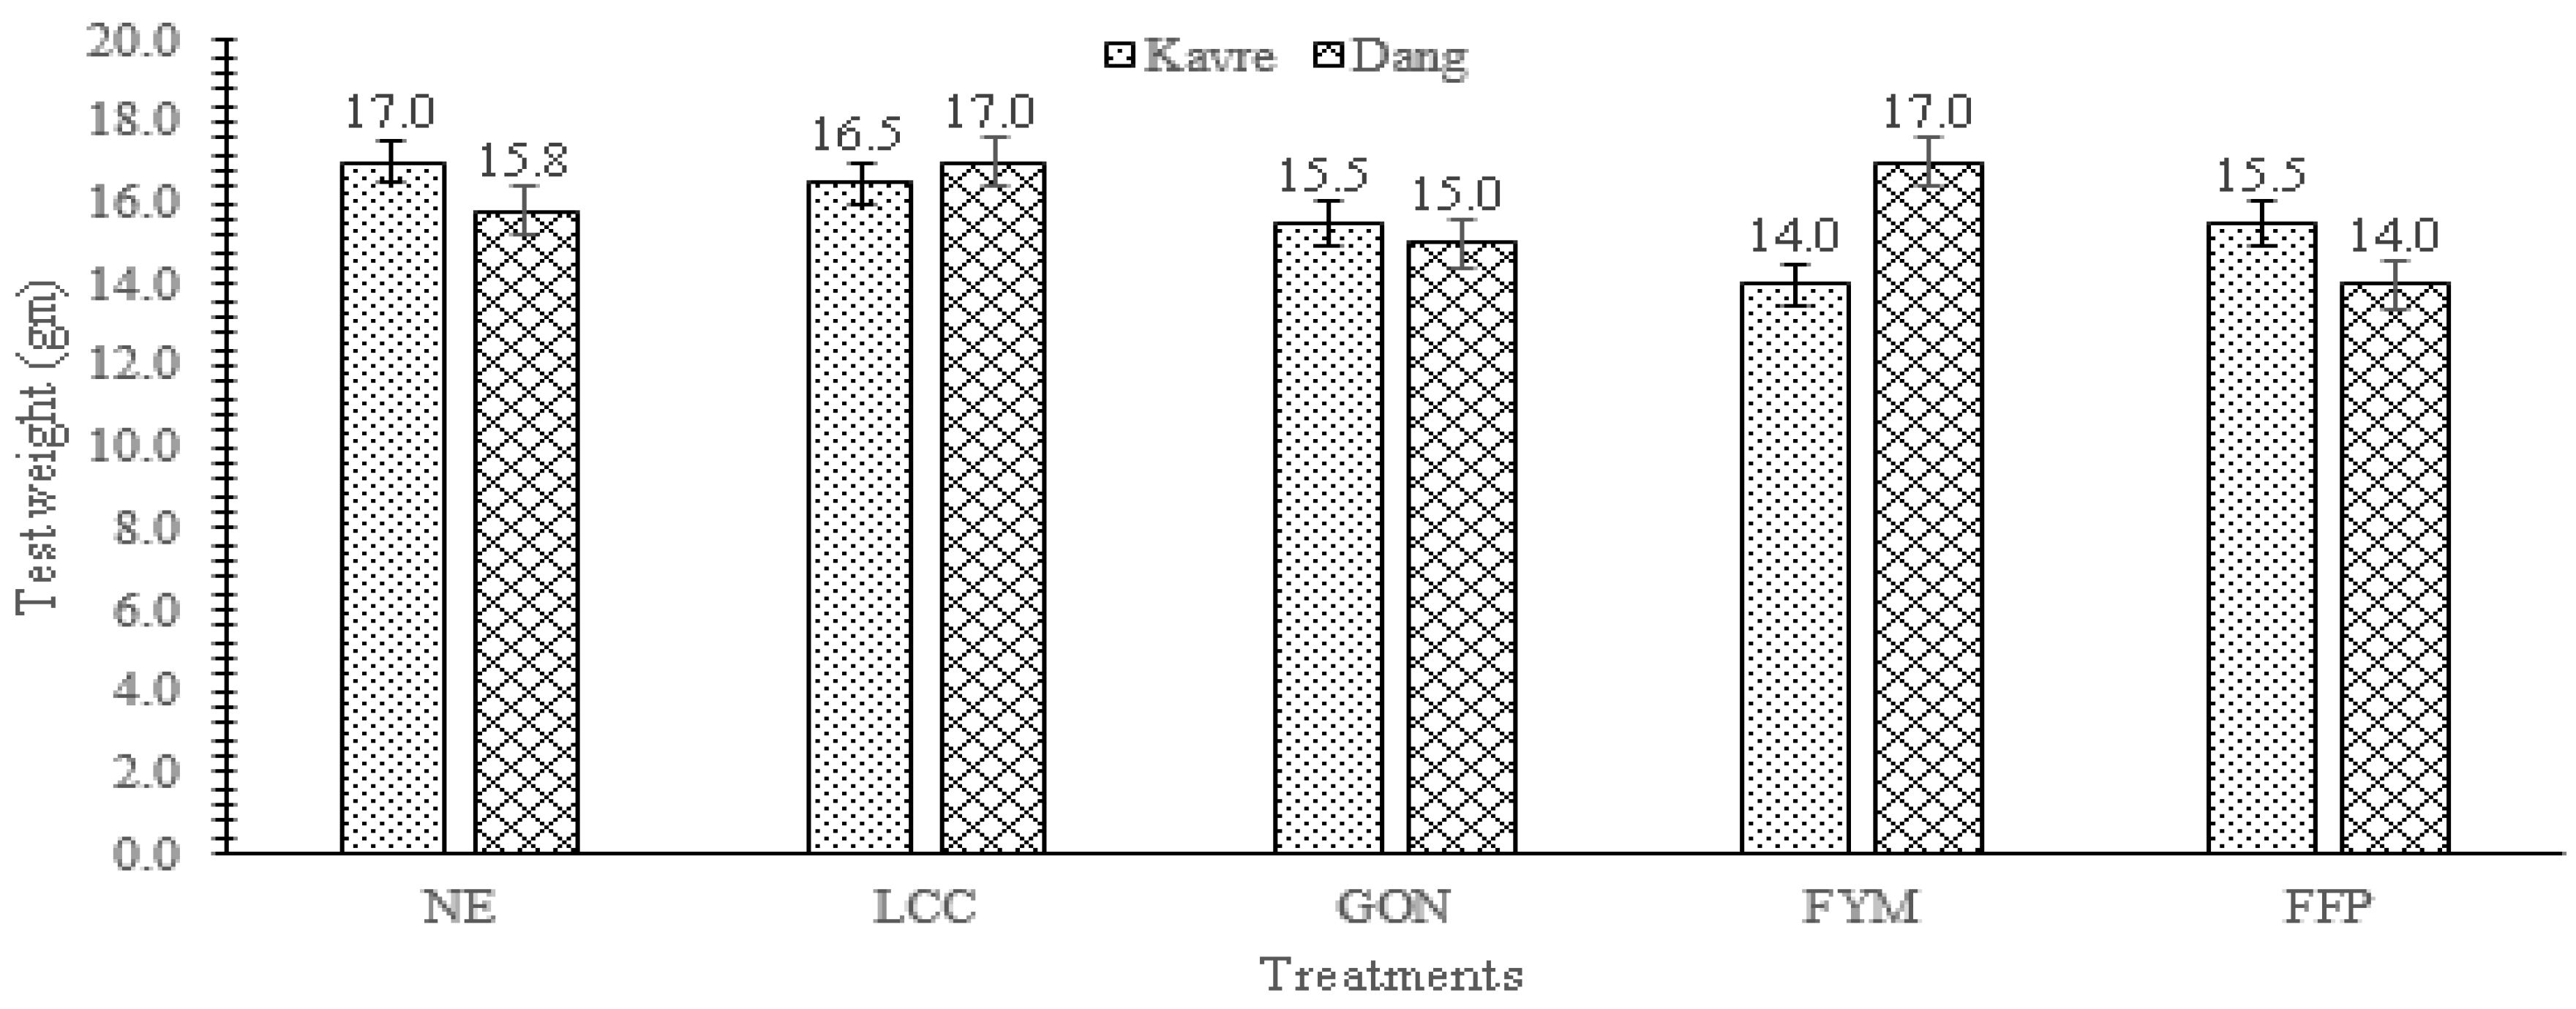
3.6. Test Weight
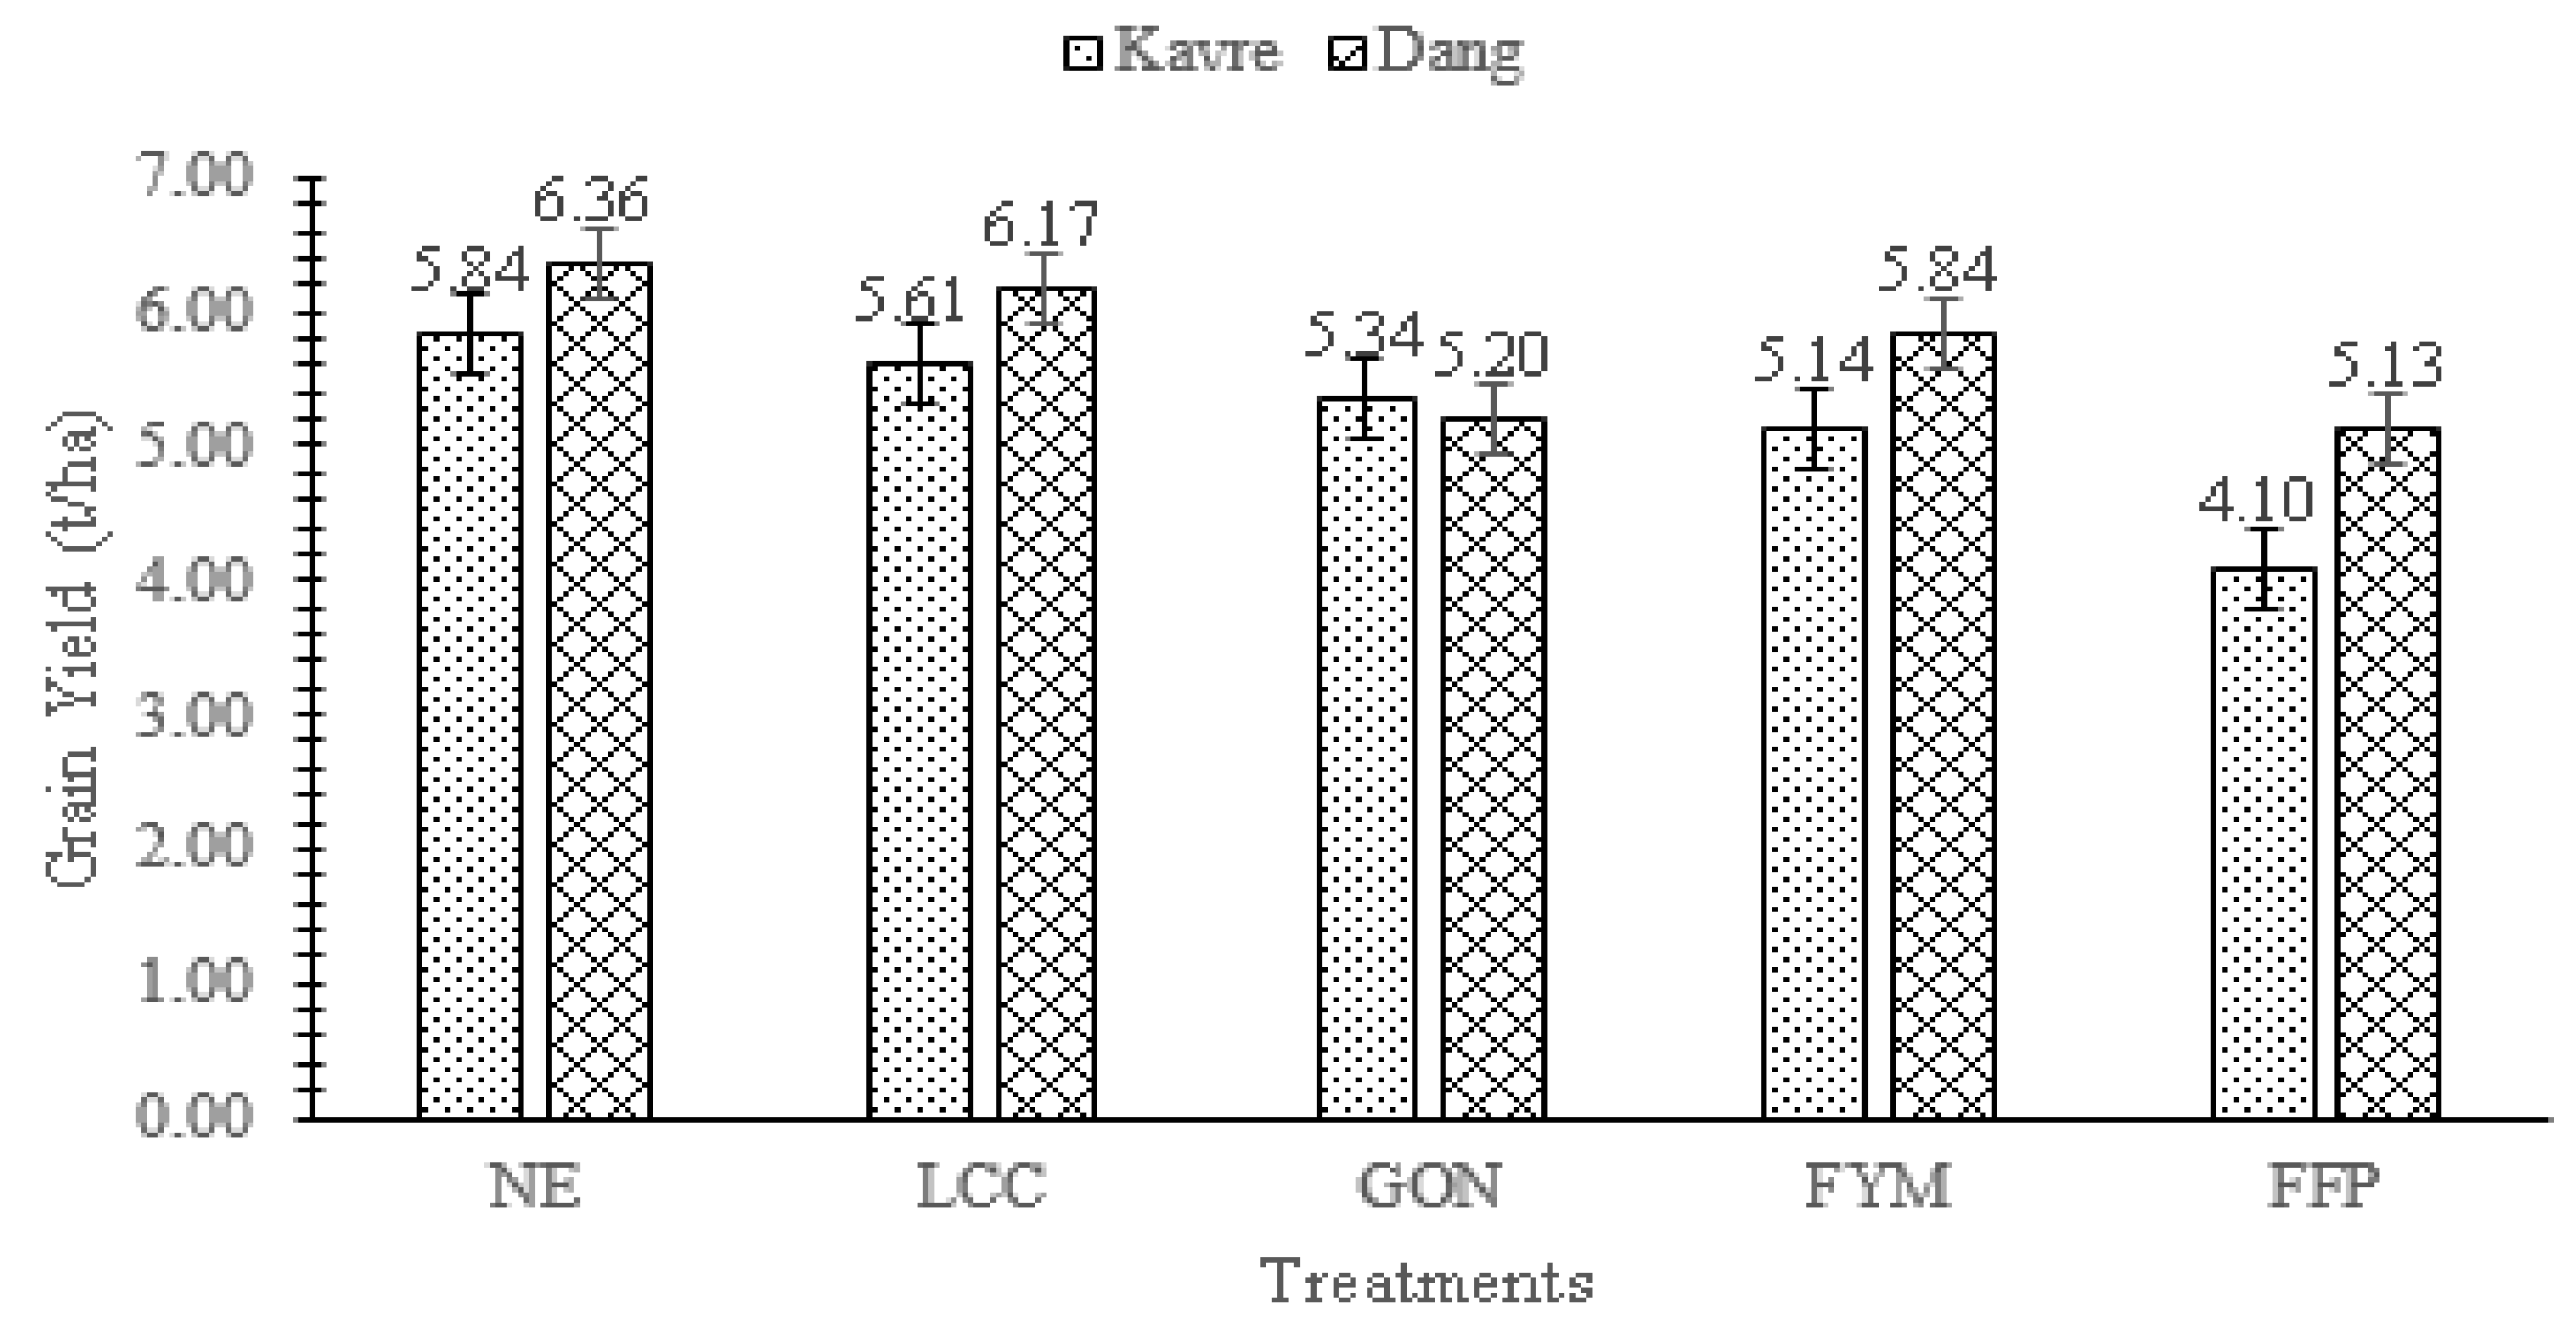
3.7. Grain Yield
3.7.1. Kavrepalanchowk
3.7.2. Dang
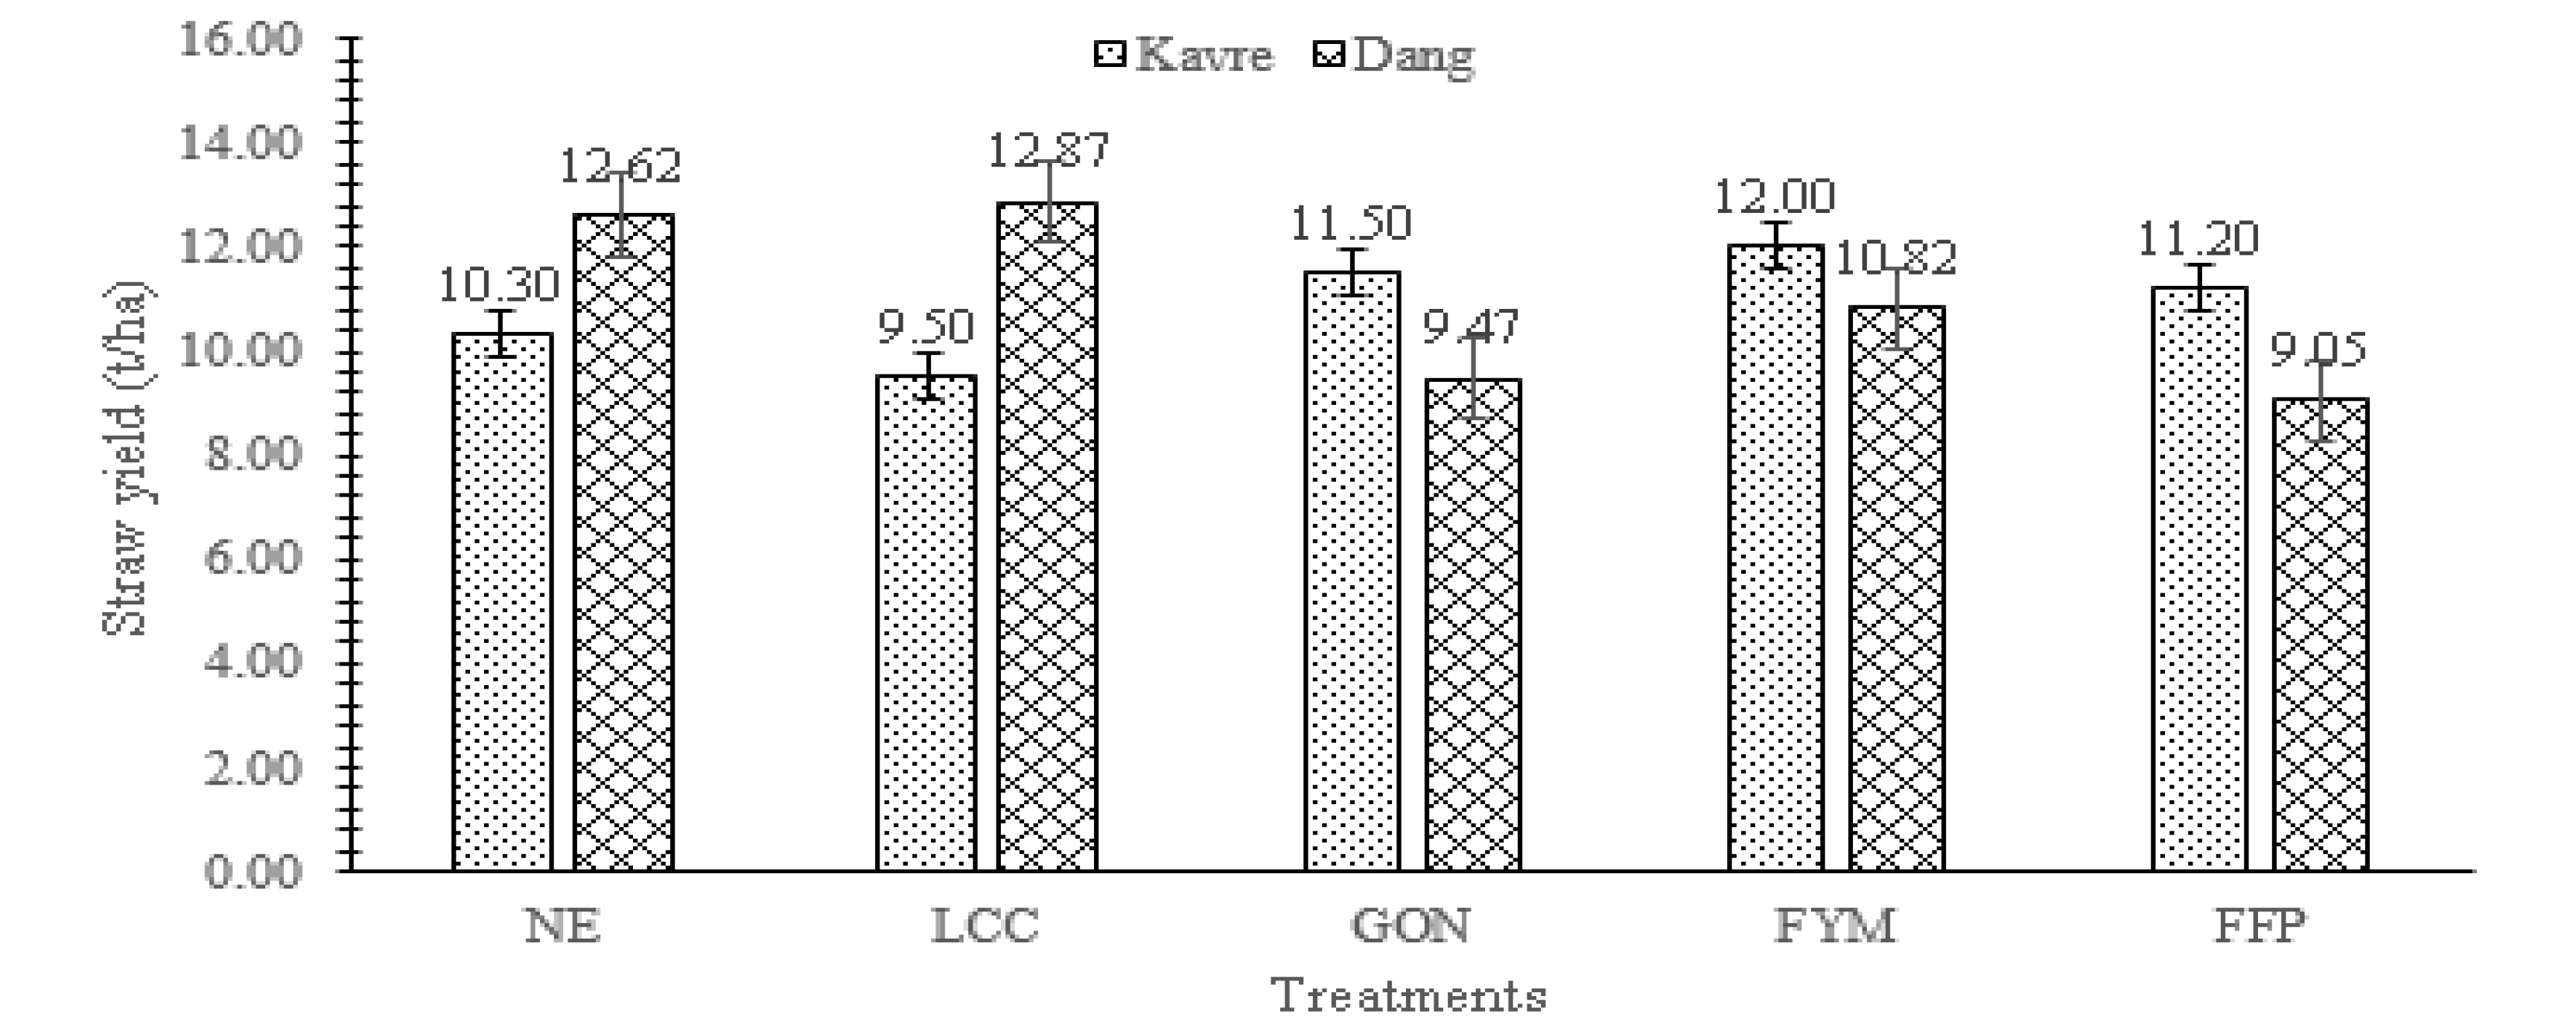
3.8. Straw Yield
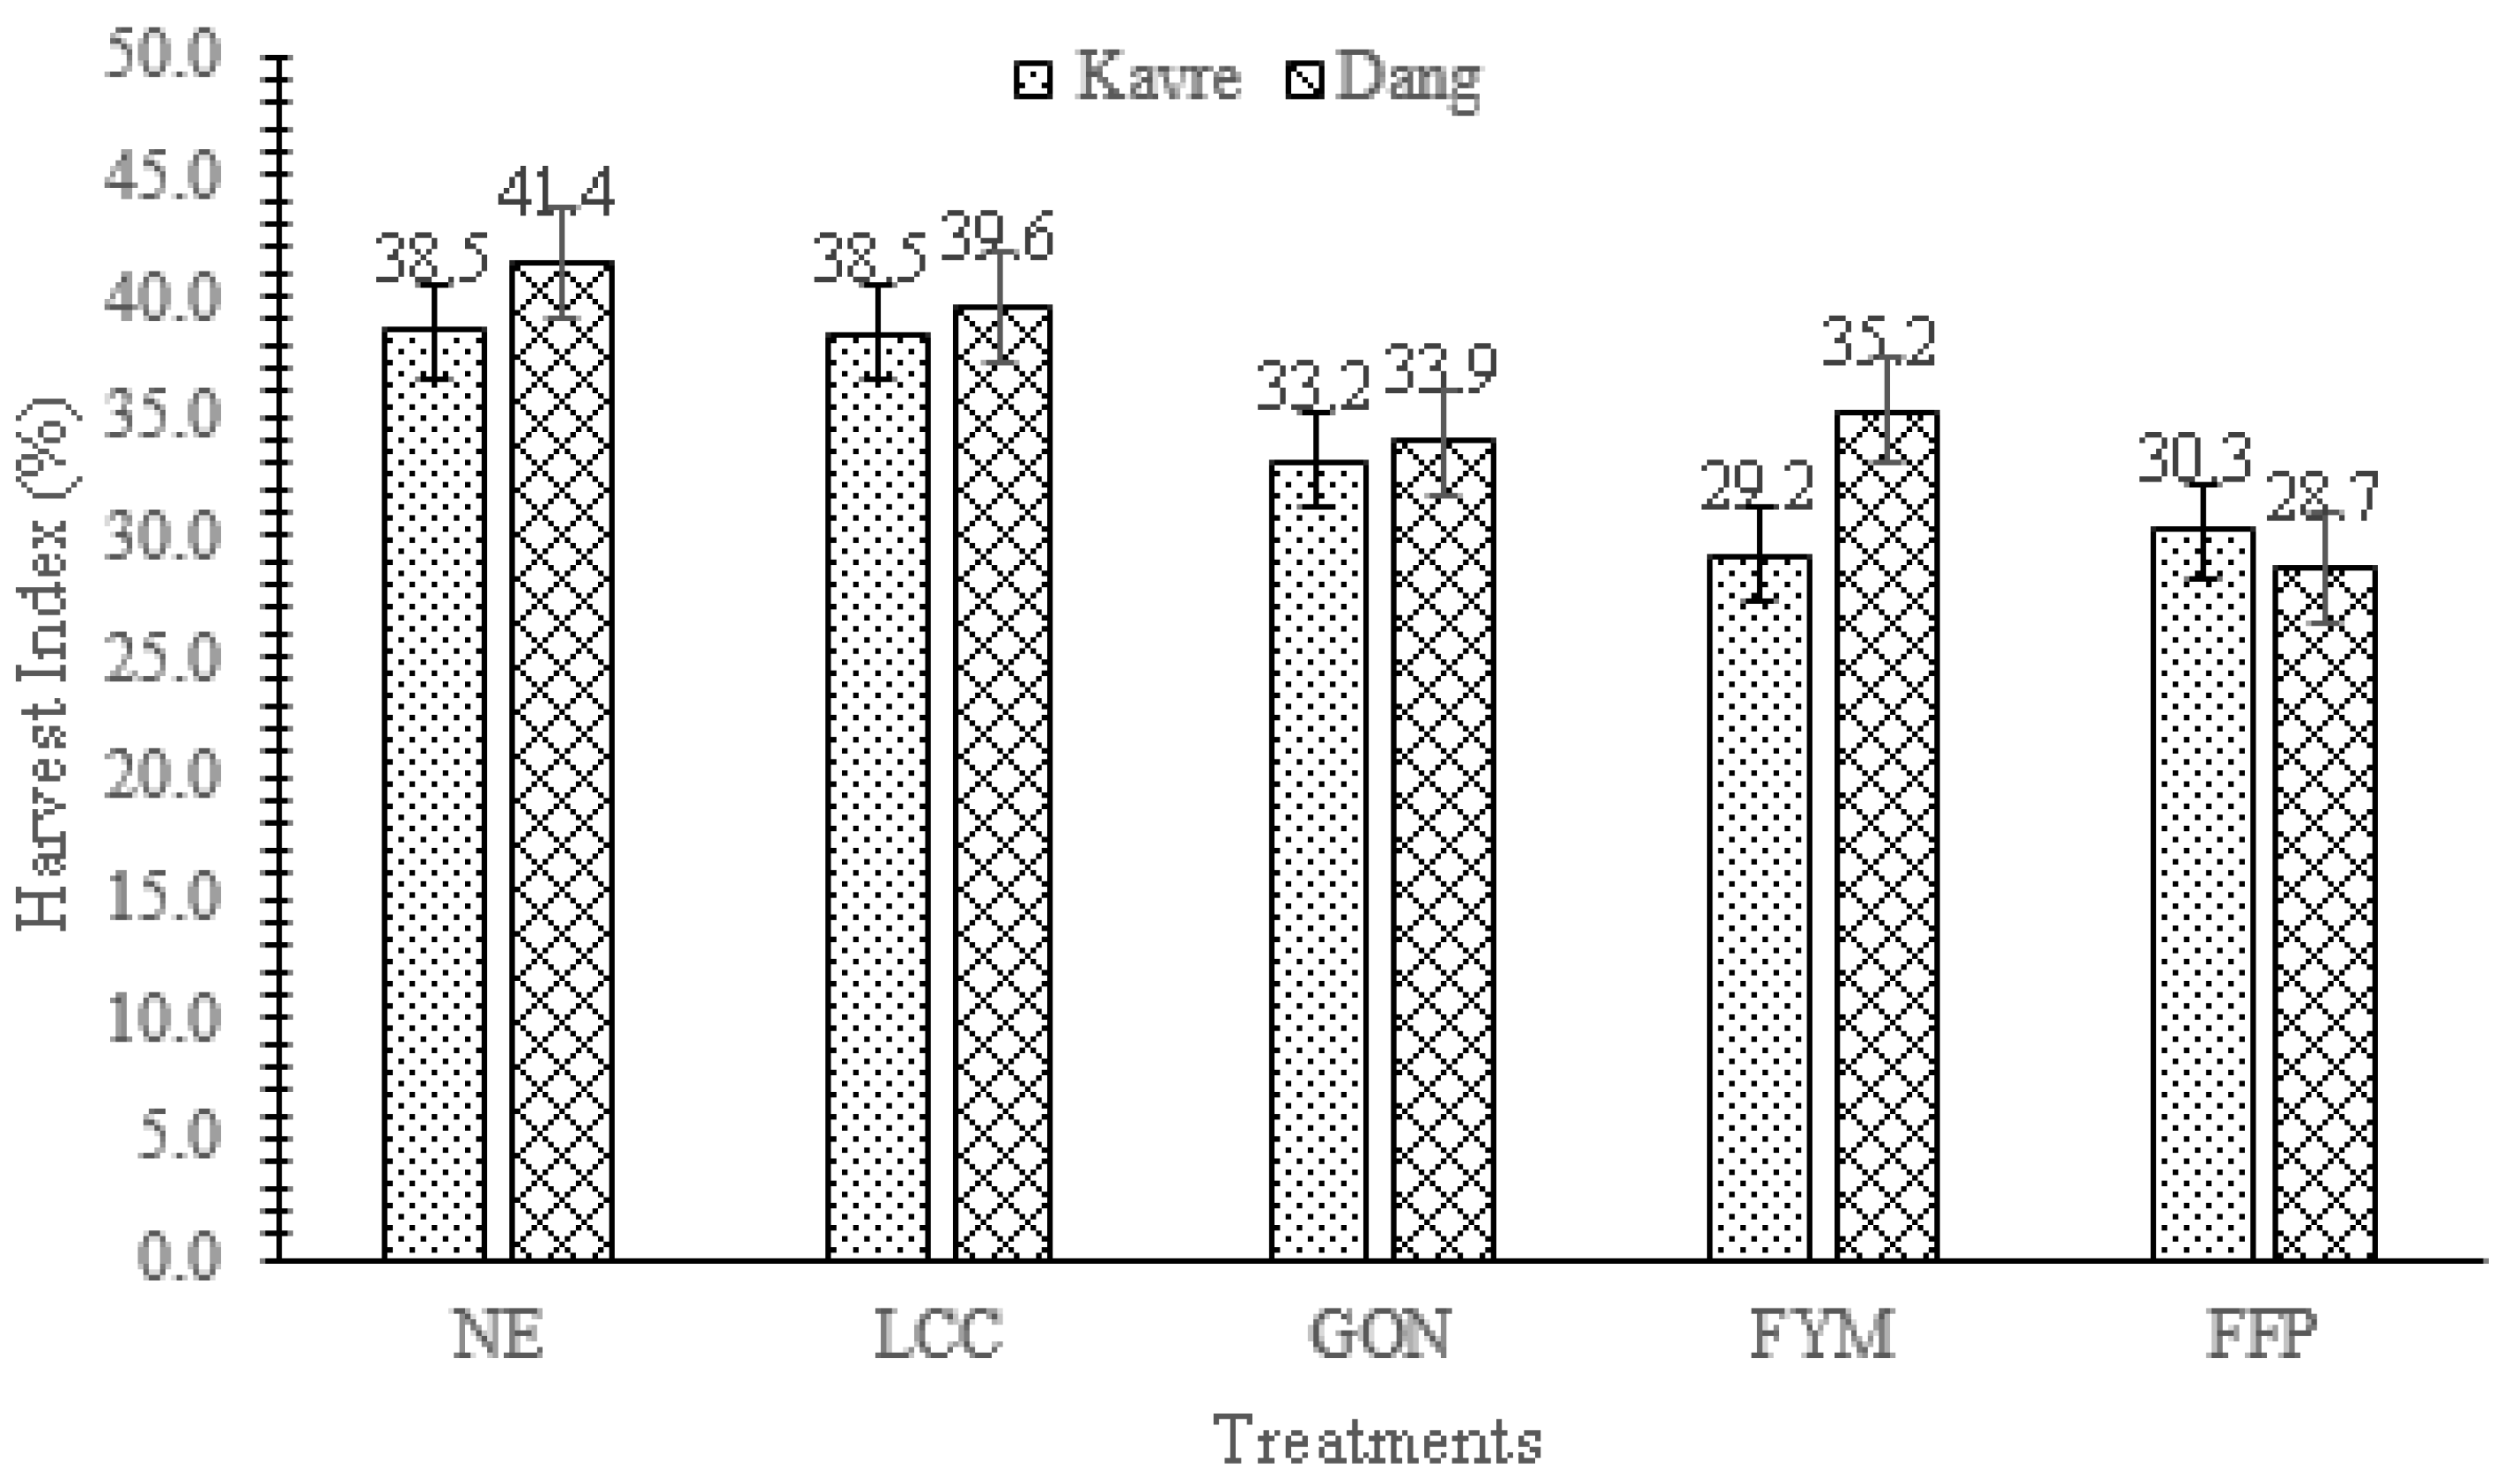
3.9. Harvest Index
3.9.1. Kavrepalanchowk
3.9.2. Dang
4. Discussion on Mean Performance of Rice Traits
4.1. Combined Analysis of Straw Yield and Harvest Index in Kavre and Dang
4.2. Yield Gap Analysis
4.2.1. Yield Gap at Kavre
4.2.2. Yield Gap at Dang
4.3. Correlation among Different Rice Trait across Both the Location
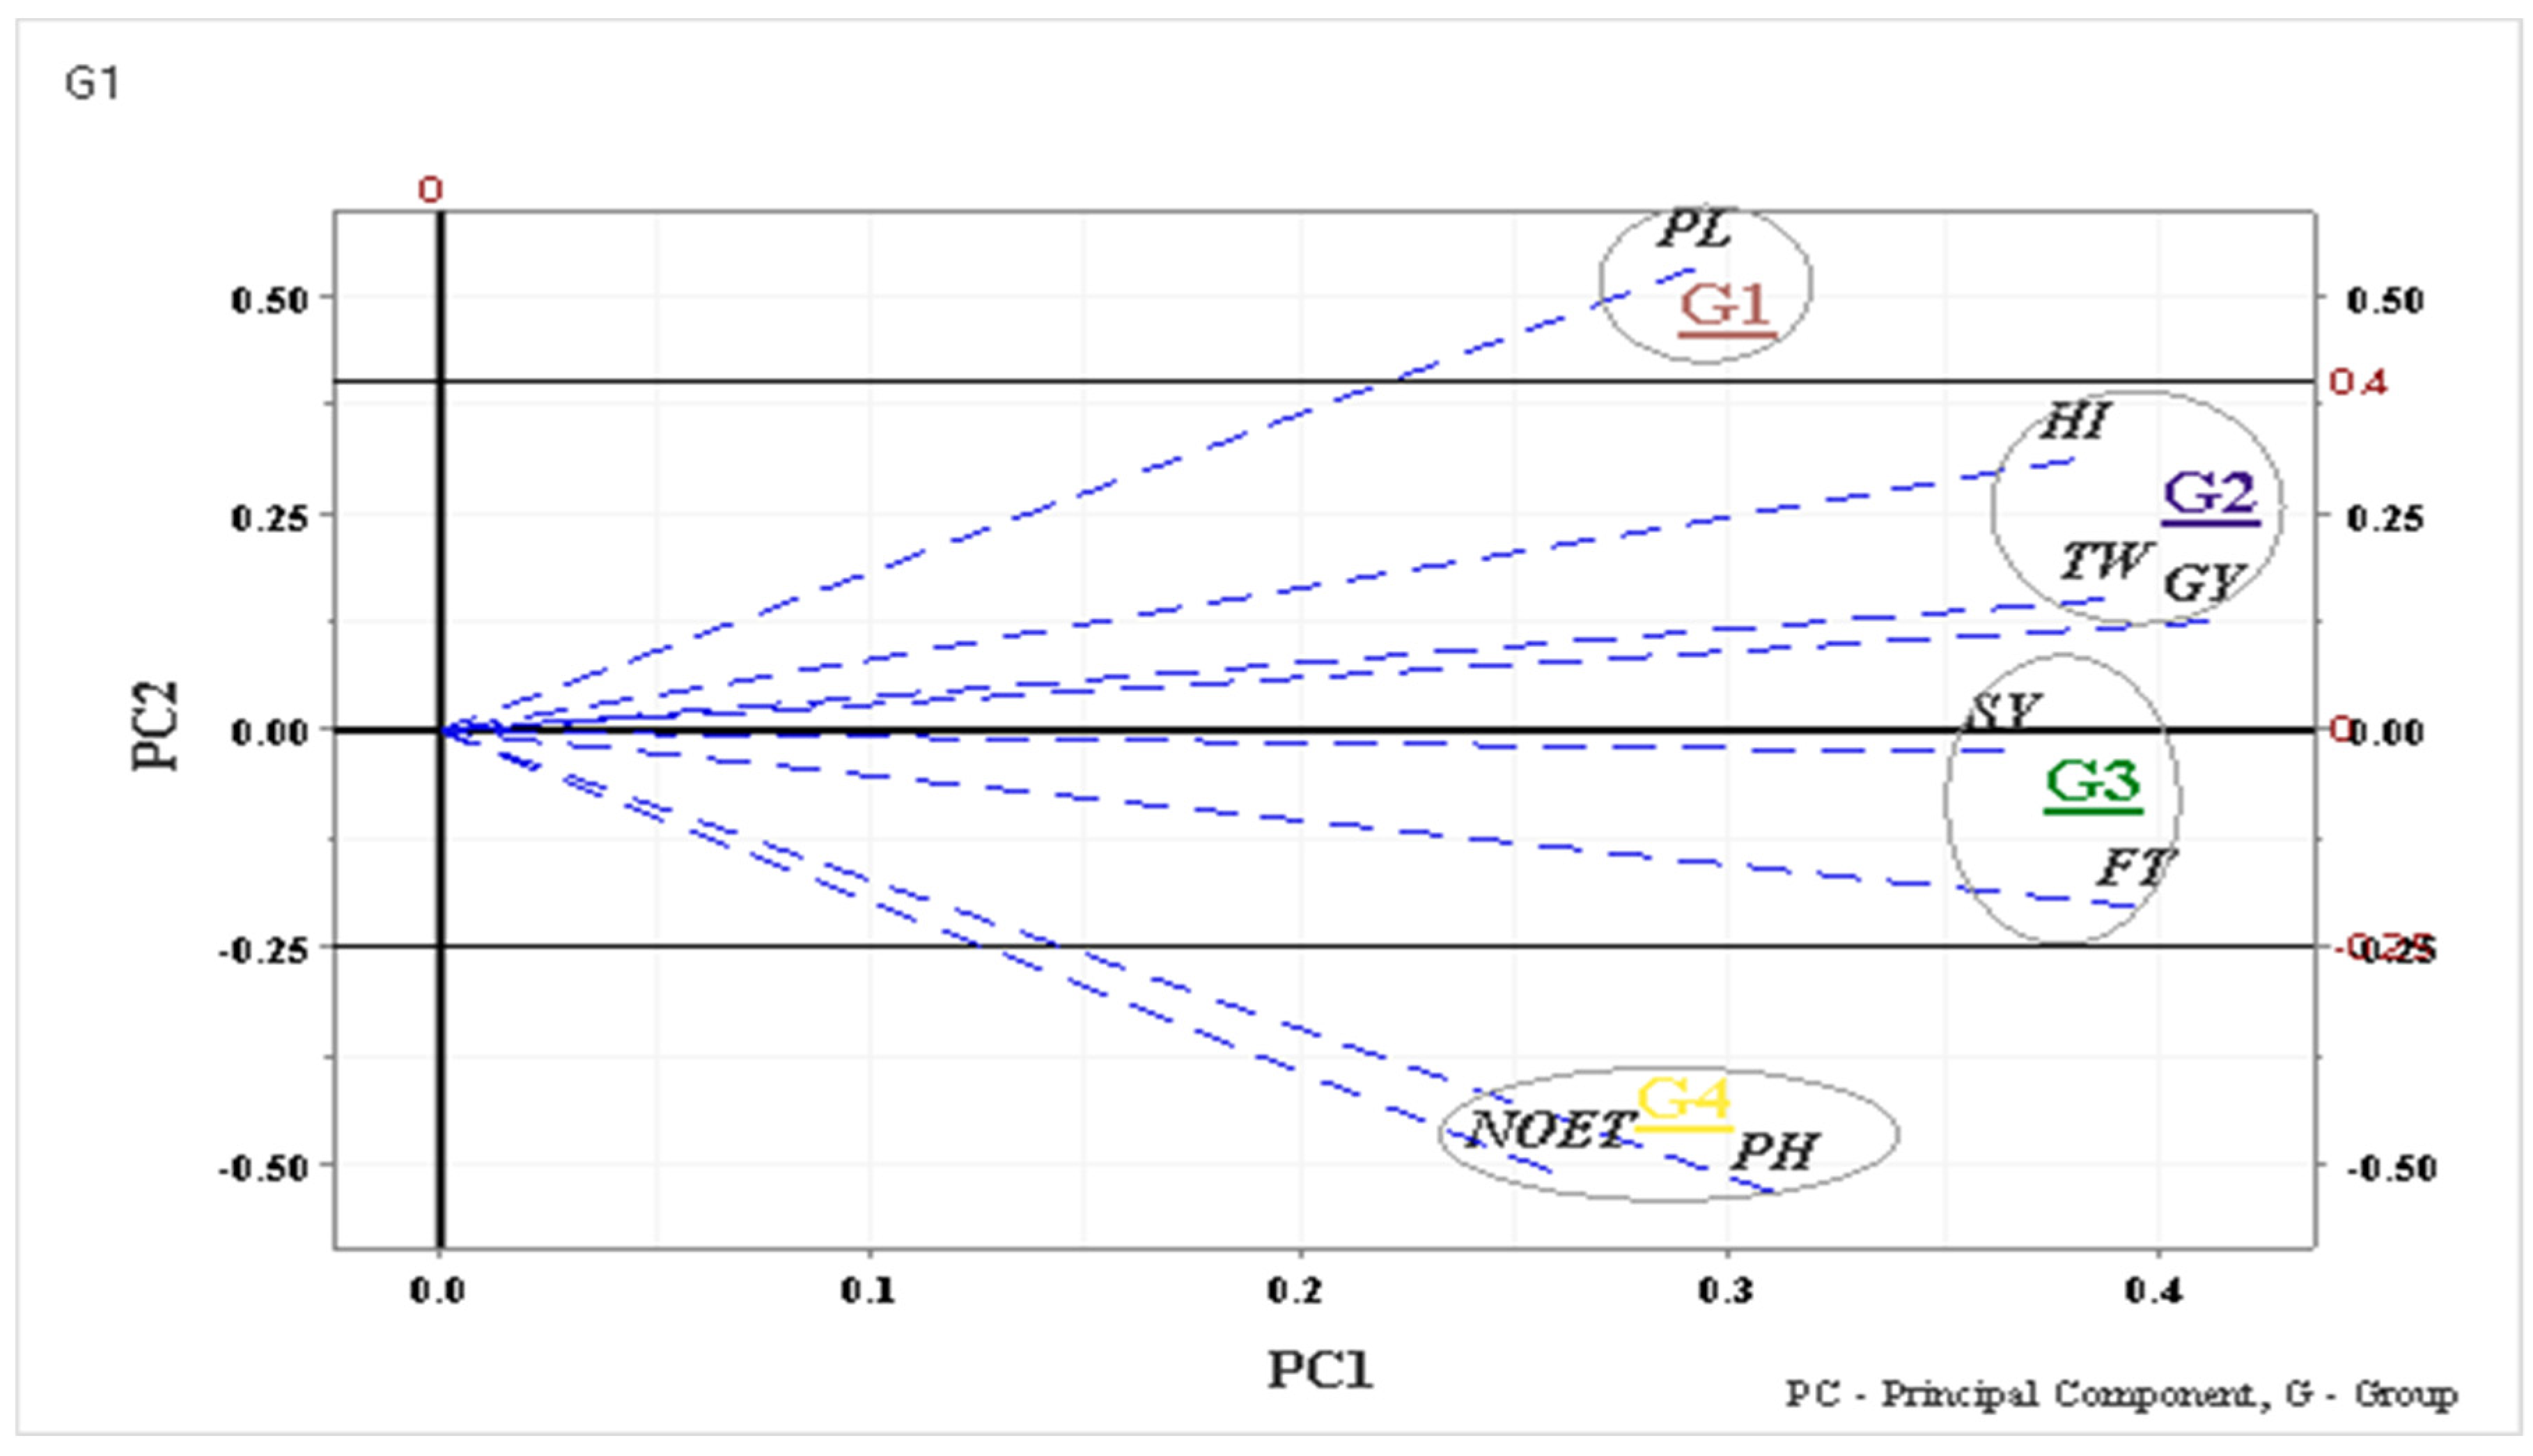
4.4. Principal Component Analysis of Different Rice Traits
4.5. Eigen Value and Principal Component
4.6. Biplot of PCA
4.7. Production Economics at Kavre and Dang
4.7.1. Kavre
4.7.2. Dang
5. Conclusions
Author Contributions
Funding
Acknowledgments
Conflicts of Interest
References
- Maiti, R.; Sarkar, N.C.; Rodriguez, H.G.; Kumari, A.; Begum, S.; Rajkumar, D. Advances in Rice Science: Botany, Production, and Crop Improvement; Apple Academic Press: Palm Bay, FL, USA, 2020. [Google Scholar]
- Shahbandeh, M. World Production Volume of Milled Rice from 2008/2009 to 2020/2021. 2021. Available online: https://www.statista.com/statistics/271972/world-husked-rice-production-volume-since-2008/ (accessed on 9 June 2021).
- Abdullah, A.; Kobayashi, H.; Matsumura, I.; Ito, S. World Rice Demand towards 2050: Impact of Decreasing Demand of Per Capita Rice Consumption for China and India. 2008. Available online: https://www.semanticscholar.org/paper/World-Rice-Demand-Towards-2050%3A-Impact-of-Demand-of-Ito/260f4d3b195718591a8143982ec4cffa66f8f338 (accessed on 9 June 2021).
- MoALD. Selected Indicators of Nepalese Agriculture. Available online: https://nepalindata.com/ (accessed on 9 June 2021).
- ABPSD. Statistical Information on Nepalese Agriculture 2013/14 (2070/071), Agri Statistics Section, Agri Business Promotion and Statistics Division; Government of Nepal; Ministry of Agriculture and Co-Operatives; ABPSD: Kathmandu, Nepal, 2014. [Google Scholar]
- Prasad, K.; Singh, R.; Singh, S. Effect of seedlings age and number of seedlings per hill on the yield of rice in a sodic soil. Curr. Agric. 2011, 16, 67–70. [Google Scholar]
- Katoch, P.; Katoch, A.; Podel, M.; Uperti, S. Bakanae of Rice: A serious disease in Punjab. Int. J. Curr. Microbiol. Appl. Sci. 2019, 8, 129–136. [Google Scholar] [CrossRef]
- Baral, B.R.; Pande, K.R.; Gaihre, Y.K.; Baral, K.R.; Sah, S.K.; Thapa, Y.B. Farmers’ fertilizer application gap in rice-based cropping system: A case study of Nepal. SAARC J. Agric. 2019, 17, 267–277. [Google Scholar] [CrossRef]
- Matsushima, S. High Yielding Rice Cultivation; University of Tokyo Press: Tokyo, Japan, 1976. [Google Scholar]
- Ladha, J.K.; Pathak, H.; Krupnik, T.J.J.; Six, J.; Van Kessel, C. Efficiency of fertilizer nitrogen in cereal production: Retrospects and prospects. Adv. Agron. 2005, 87, 85–156. [Google Scholar]
- Joshy, D. Soil Fertility and Fertilizer Use in Nepal. 1997. Available online: https://agris.fao.org/agris-search/search.do?recordID=NP9700156 (accessed on 9 June 2021).
- Witt, C.; Buresh, R.J.; Peng, S.; Balasubramanian, V.; Dobermann, A. Nutrient management. In Rice A Practical Guide to Nutrient Management; Fairhurst, T.H., Witt, C., Buresh, R., Dobermann, A., Eds.; International Rice Research Institute: Los Baños, Philippines, 2007. [Google Scholar]
- Satyanarayana, T.; Majumdar, K.; Pampolino, M.; Johnston, A.M.; Jat, M.L.; Kuchanur, P.; Sreelatha, D.; Sekhar, J.C.; Kumar, Y.; Maheswaran, R.; et al. Nutrient Expert TM: A Tool to Optimize Nutrient Use and Improve Productivity of Maize. Better Crop. 2013, 97, 21–24. [Google Scholar]
- Dahal, S.; Shrestha, A.; Dahal, S.; Amgain, L.P. Nutrient Expert Impact on Yield and Economic In Maize and Wheat. Int. J. Appl. Sci. Biotechnol. 2018, 6, 45–52. [Google Scholar] [CrossRef][Green Version]
- Bhatta, R.D.; Amgain, L.P.; Subedi, R.; Kandel, B.P. Assessment of productivity and profitabilty of wheat using Nutrient Expert®-Wheat model in Jhapa district of Nepal. Heliyon 2020, 6, e04144. [Google Scholar] [CrossRef]
- Amgain, L.P.; Timsina, J.; Dutta, S.; Majumdar, K. Nutrient expert® rice—An alternative fertilizer recommendation strategy to improve productivity, profitability and nutrient use efficiency of rice in Nepal. J. Plant Nutr. 2021, 44, 2258–2273. [Google Scholar] [CrossRef]
- Sapkota, T.B.; Majumdar, K.; Jat, M.L.; Kumar, A.; Bishnoi, D.K.; McDonald, A.J.; Pampolino, M. Precision nutrient management in conservation agriculture based wheat production of Northwest India: Profitability, nutrient use efficiency and environmental footprint. Field Crop. Res. 2014, 155, 233–244. [Google Scholar] [CrossRef]
- Shah, M.L.; Yadav, R. Response of Rice Varieties to Age of Seedlings and Transplanting Dates. Nepal Agric. Res. J. 2001, 4–5, 14–17. [Google Scholar] [CrossRef]
- Prasad, R.; Shivay, Y.S.; Kumar, D.; Sharma, S.N. Learning by Doing Exercises in Soil Fertility (A Practical Manual for Soil Fertility); Division of Agronomy, IARI: New Delhi, Indian, 2006. [Google Scholar]
- Pal, S.; Sana, M.; Banerjee, H.; Lhungdim, L. Effectiveness of nitrogen and bio-fertilizer choice for improving growth and yield of hybrid rice (Oryza sativa L.) during dry season. Oryza-An Int. J. Rice 2020, 57, 302–309. [Google Scholar] [CrossRef]
- Meena, S.L.; Singh, S.; Shivay, Y.S. Response of hybrid rice (Oryza sativa) to nitrogen and potassium application in sandy clay-loam soils. Indian J. Agric. Sci. 2003, 73, 8–11. [Google Scholar]
- Aslam, M.M.; Zeeshan, M.; Irum, A.; Hassan, M.U.; Ali, S.; Hussain, R.; Ramzani, P.M.A.; Rashid, M.F. Influence of Seedling Age and Nitrogen Rates on Productivity of Rice (Oryza sativa L.): A Review. Am. J. Plant Sci. 2015, 6, 1361–1369. [Google Scholar] [CrossRef]
- Subedi, R. Nursery Management Influences Yield and Yield Attributes of Rainfed Lowland Rice. J. Sustain. Soc. 2013, 2, 86–91. [Google Scholar] [CrossRef]
- Dutta, S.K.; Majumdar, K.; Satyanarayana, T. India, Nutrient Expert: A precisionnutrient management tool for smallholder production systems of India. Crop Soils Mag. 2014, 47, 23–25. [Google Scholar] [CrossRef]
- Malghani, A.L.; Malik, A.U.; Sattar, A.; Hussain, F.; Abbas, G.; Hussain, J. Response of Growth and Yield of Wheat to NPK fertilizer. Sci. Int. 2010, 24, 185–189. [Google Scholar]
- Budhathoki, S.; Amgain, L.P.; Subedi, S.; Iqbal, M.; Shrestha, N.; Aryal, S. Assessing Growth, Productivity and Profitability of Drought Tolerant Rice Using Nutrient Expert—Rice and Other Precision Fertilizer Management Practices in Lamjung, Nepal. Acta Sci. Agric. 2018, 2, 153–158. [Google Scholar] [CrossRef]
- Chaturvedi, I. Effect of Nitrogen Fertilizers on Growth, Yield and Quality of Hybrid Rice (Oryza sativa). J. Cent. Eur. Agric. 2005, 6, 611–618. [Google Scholar] [CrossRef]
- Marahatta, S. Increasing productivity of an intensive rice based system through site specific nutrient management in Western Terai of Nepal. J. Agric. Environ. 2017, 18, 140–150. [Google Scholar] [CrossRef]
- Haq, M.T.; Sattar, M.A.; Hossain, M.M.; Hasan, M.M. Effects of Fertilizers and Pesticides on Growth and Yield of Rice. J. Biol. 2002, 2, 84–88. [Google Scholar] [CrossRef]
- Hussain, N.; Khan, M.A.; Javed, M.A. Effect of foliar application of plant micronutrient mixture on growth and yield of wheat (Triticum aestivum). Pakitstan J. Biol. Sci. 2005, 8, 1096–1099. [Google Scholar] [CrossRef]
- Virmani, S.S.; Mao, C.X.; Hardy, B. Hybrid Rice for Food Security, Poverty Alleviation, and Environmental Protection; International Rice Research Institute: Metro Manila, Philippines, 2003. [Google Scholar]
- Dobermann, A.; Witt, C.; Dawe, D.; Abdulrachman, S.; Gines, H.; Nagarajan, R.; Satawathananont, S.; Son, T.; Tan, P.; Wang, G.; et al. Site-specific nutrient management for intensive rice cropping systems in Asia. Field Crop. Res. 2002, 74, 37–66. [Google Scholar] [CrossRef]
- Gaire, A.; Koirala, S.; Shrestha, R.K.; Amgain, L.P. Growth and Productivity of Different Cultivars of Rice Under Nutrient Expert© and Other Fertilizer Management Practices at Lamjung. Int. J. Appl. Sci. Biotechnol. 2016, 4, 178–182. [Google Scholar] [CrossRef][Green Version]
- Wang, G.; Zhang, Q.C.; Witt, C.; Buresh, R.J. Opportunities for yield increases and environmental benefits through site-specific nutrient management in rice systems of Zhejiang province, China. Agric. Syst. 2007, 94, 801–806. [Google Scholar] [CrossRef]
- Biradar, D.; Aladakatti, Y.; Rao, T.; Tiwari, K. Site-specific nutrient management for maximization of crop yields in Northern Karnataka. Better Crop. 2006, 90, 33–35. [Google Scholar]
- Shrestha, S.; Amgain, L.P.; Subedi, R.; Shrestha, P.; Shahi, S. Productivity and Profitability Analysis of Old Aged Hybrid Rice Seedling Using Nutrient-Rice Expert and Other Precision Nutrient Management Practices at Lamjung, Nepal. Int. J. Appl. Sci. Biotechnol. 2018, 6, 232–237. [Google Scholar] [CrossRef]
- Adhikari, B.N.; Joshi, B.P.; Shrestha, J.; Bhatta, N.R. Genetic variability, heritability, genetic advance and correlation among yield and yield components of rice (Oryza sativa L.). J. Agric. Nat. Resour. 2018, 1, 149–160. [Google Scholar] [CrossRef]
- Aditya, J.P.; Bhartiya, A. Genetic variability, correlation and path analysis for quantitative characters in rainfed upland rice of Uttarakhand Hills. J. Rice Res. 2013, 6, 24–34. [Google Scholar]
- Gyawali, S.; Poudel, A.; Poudel, S. Genetic variability and association analysis in different rice genotypes in mid hill of western Nepal. Acta Sci. Agric. 2018, 2, 69–76. [Google Scholar]
- Ogunbayo, S.A.; Sie, M.; Ojo, D.K.; Sanni, K.A.; Akinwale, M.G.; Toulou, B.; Shittu, A.; Idehen, E.O.; Popoola, A.R.; Daniel, I.; et al. Genetic variation and heritability of yield and related traits in promising rice genotypes (Oryza sativa L.). J. Plant Breed. Crop Sci. 2014, 6, 153–159. [Google Scholar] [CrossRef]
- Madhavilatha, L.; Sekhar, M.R.; Suneetha, Y.; Srinivas, T. Genetic variability, correlation and path analysis for yield and quality traits in rice (Oryza sativa L.). Res. Crop. 2005, 6, 527. [Google Scholar]
- Qamar, Z.U.; Cheema, A.A.; Ashraf, M.; Rashid, M.; Tahir, G.R. Association analysis of some yield influencing traits in aromatic and non aromatic rice. Pakistan J. Bot. 2005, 37, 613–627. [Google Scholar]
- Rashid, M.; Cheema, A.A.; Ashraf, M. Numerical analysis of variation among Basmati rice Mutants. Pakistan J. Bot. 2008, 40, 2413–2417. [Google Scholar]
- Iftekharuddaula, K.M.; Akter, K.; Hassan, M.S.; Fatema, K.; Badshah, A. Genetic Divergence, Character Association and Selection Criteria in Irrigated Rice. J. Biol. Sci. 2002, 2, 243–246. [Google Scholar] [CrossRef]
- Khan, A.S.; Imran, M.; Ashfaq, M. Estimation of genetic variability and correlation for grain yield components in Rice (Oryza sativa L.). Am. J. Agric. Environ. Sci. 2009, 6, 585–590. [Google Scholar]
- Ravikumar, B.N.V.S.R.; Kumari, P.N.; Rao, P.V.R.; Rani, M.G.; Satyanarayana, P.V.; Chamundeswari, N.; Vishnuvardhan, K.M.; Suryanarayana, Y.; Bharatalakdhmi, M.; Vishnuvardhan, R. Principal component analysis and character association for yield components in rice (Oryza sativa L.) cultivars suitable for irrigated ecosystem. Curr. Biot. 2015, 9, 25–35. [Google Scholar]
- Babu, V.R.; Shreya, K.; Dangi, K.S.; Usharani, G.; Shankar, A.S. Correlation and Path Analysis Studies in Popular Rice Hybrids of India. Int. J. Sci. Res. Publ. 2012, 2, 1–5. [Google Scholar]
- Kashyap, A.; Yadav, V.K. Principal Component Analysis and Character Association for Yield Components in Rice (Oryza sativa L.) Genotypes of Salt Tolerance under Alkaline Condition. Int. J. Curr. Microbiol. Appl. Sci. 2020, 9, 481–495. [Google Scholar] [CrossRef]
- Anandan, A.; Pradhan, S.K.; Das, S.K.; Behera, L.; Sangeetha, G. Differential responses of rice genotypes and physiological mechanism under prolonged deepwater flooding. Field Crop. Res. 2015, 172, 153–163. [Google Scholar] [CrossRef]
- Gana, A.S.; Shaba, S.Z.; Tsado, E.K. Principal component analysis of morphological traits in thirty-nine accessions of rice (Oryza sativa L.) grown in a rainfed lowland ecology of Nigeria. J. Plant Breed. Crop Sci. 2013, 4, 120–126. [Google Scholar] [CrossRef][Green Version]
- Aliyu, B.; Akoroda, M.; Padulosi, S. Variation with Vigna Reticulata Hooker FII. Niger. J. Genet. 2000, 15, 1–8. [Google Scholar] [CrossRef]
- Gana, A.S. Variability Studies of the Response of Rice Varieties to Biotic and Abiotic Stresses. Ph.D. Thesis, University of Ilorin, Ilorin, Nigeria, 2006. [Google Scholar]
- Kumar, A.; Majumdar, K.; Jat, M.L.; Pampolino, M.; Kamboj, B.R.; Bishnoi, D.K.; Kumar, V.; Johnston, A.M. Evaluation of Nutrient Expert TM for Wheat. Better Crop. 2012, 6, 27–29. [Google Scholar]
- Attanandana, T.; Kongton, S.; Boonsompopphan, B.; Polwatana, A.; Verapatananirund, P.; Yost, R. Site-specific nutrient management of irrigated rice in the central plain of Thailand. J. Sustain. Agric. 2010, 34, 258–269. [Google Scholar] [CrossRef]


| Properties | pH Value: | Organic Matter: | Total Nitrogen: | Available Phosphorus (P2O5): | Available Potassium (K2O): | Zinc: | Boron: |
|---|---|---|---|---|---|---|---|
| Dang | 7.091 | 2.71% | 0.13% | 73.128 kg/ha | 396.539 kg/ha | 0.612 ppm | 1.283 ppm |
| Kavre | 6.088 | 1.81% | 0.07% | 127.277 kg/ha | 285.611 kg/ha | 1.561 ppm | 0.897 ppm |
| Treatment Number | Symbol | Treatment Combination |
|---|---|---|
| T1 | NE | Nutrient Expert recommended dose at Kavre -Farmer 1: 141:39:72 kg NPK/ha -Farmer 2: 132:38:61 kg NPK/ha -Farmer 3: 132:38:61 kg NPK/ha -Farmer 4–132:38:61 kg NPK/ha Nutrient Expert recommended dose at Dang -Farmer 1: 118:37:52 kg NPK/ha -Farmer 2: 93:23:29 kg NPK/ha -Farmer 3: 109:28:46 kg NPK/ha -Farmer 4: 109:28:46 kg NPK/ha |
| T2 | LCC | Nitrogen as per LCC and P & K calculated from Nutrient Expert |
| T3 | GON | Government of Nepal recommended dose -140:60:30 kg NPK/ha (Shah and Yadav, 2001) |
| T4 | FYM | -Farm Yard Manure (FYM) (15-ton ha−1) |
| T5 | FFP | Farmers’ existing practices at Kavre -Farmer 1: 60.4:36.8:36 kg NPK/ha -Farmer 2: 71.2:64.4:0 kg NPK/ha -Farmer 3: 45.08:36.8:0 kg NPK/ha -Farmer 4: 31.8:46:0 kg NPK/ha Farmer’s existing practice at Dang -Farmer 1, 2, 3, and 4: 16.5:15:0 kg NPK/ha |
| Treatment | SY | HI |
|---|---|---|
| NE | 11.45 | 34.65 |
| LCC | 11.20 | 34.50 |
| GON | 10.26 | 37.67 |
| FYM | 11.01 | 31.14 |
| FPP | 10.76 | 36.94 |
| Residual Variance | 2.808 | 16.673 |
| Treatment significance | 0.977 | 0.794 |
| Trt x Loc significance | 0.010 | 0.001 |
| Grand Mean | 10.93 | 34.98 |
| LSD | 5.31 | 15.53 |
| CV | 15.33 | 11.67 |
| Kavre | Dang | |||||
|---|---|---|---|---|---|---|
| Treatments | Grain Yield (t/ha) | Yield Difference over FPP | Increase (%) | Grain Yield (t/ha) | Yield Difference over FPP | Increase (%) |
| NE | 5.84 | +1.74 | 42.44 | 6.36 | +1.23 | 23.97 |
| LCC | 5.61 | +1.51 | 36.82 | 6.17 | +1.04 | 20.27 |
| GON | 5.34 | +1.24 | 30.24 | 5.20 | +0.07 | 1.36 |
| FFP | 4.10 | 5.13 | - | - | ||
| PH | NOET | PL | FT | TW | SY | HI | |
|---|---|---|---|---|---|---|---|
| NOET | 0.69 | ||||||
| PL | 0.25 | 0.22 | |||||
| FT | 0.80 | 0.66 | 0.45 | ||||
| TW | 0.50 | 0.50 | 0.64 | 0.92 * | |||
| SY | 0.78 | 0.30 | 0.55 | 0.86 | 0.76 | ||
| HI | 0.42 | 0.48 | 0.83 | 0.80 | 0.95 * | 0.69 | |
| GY | 0.68 | 0.51 | 0.78 | 0.90 * | 0.93 * | 0.89* | 0.94 * |
| Traits | PC1 | PC2 | PC3 | PC4 |
|---|---|---|---|---|
| Plant Height | 0.310 | −0.531 | −0.264 | −0.406 |
| Number of Effective Tillers | 0.258 | −0.507 | 0.679 | −0.145 |
| Panicle Length | 0.292 | 0.533 | 0.167 | −0.629 |
| Fertility | 0.395 | −0.203 | −0.076 | 0.351 |
| Test Weight | 0.387 | 0.151 | 0.093 | 0.518 |
| Straw Yield | 0.364 | −0.024 | −0.598 | −0.057 |
| Harvest Index | 0.380 | 0.312 | 0.253 | 0.145 |
| Grain Yield | 0.411 | 0.126 | −0.065 | −0.063 |
| Eigenvalue | 5.776 | 1.1965 | 0.6478 | 0.3797 |
| Proportion explained | 0.722 | 0.15 | 0.081 | 0.047 |
| Cumulative% explained | 72.2 | 87.2 | 95.3 | 100 |
| Kavre | Dang | |||||
|---|---|---|---|---|---|---|
| Treatment | Gross Revenue (NRs ha−1) | Net Revenue (NRs ha−1) | B:C Ratio | Gross Revenue (NRs ha−1) | Net Revenue (NRs ha−1) | B:C Ratio |
| NE | 182,710 a | 64,516 a | 1.55 a | 206,211 a | 75,925 a | 2.61 a |
| LCC | 161,936 ab | 42,543 a | 1.36 a | 177,761 b | 62,302 ab | 2.26 b |
| GON | 149,646 ab | 32,338 ab | 1.28 ab | 173,289 b | 58,380 b | 2.02 c |
| FFP | 151,859 ab | 40,497 a | 0.88 a | 151,395 c | 51,499 b | 2.26 b |
| SEM | 11,484.6 | 11,373.3 | 0.09 | 1.7328 | 3.842496 | 0.17 |
| Grand mean | 151,099 | 24,635 | 1.22 | 177,164 | 62,026.5 | 2.29 |
| LSD (0.05) | 34,618.4 | 34,282.8 | 0.25 | 19,699.41 | 13,618.16 | 0.05 |
| CV (%) | 15.2 | 92.3 | 14 | 6.72 | 14.15 | 1.41 |
| F test | * | ** | ** | ** | * | ** |
Publisher’s Note: MDPI stays neutral with regard to jurisdictional claims in published maps and institutional affiliations. |
© 2021 by the authors. Licensee MDPI, Basel, Switzerland. This article is an open access article distributed under the terms and conditions of the Creative Commons Attribution (CC BY) license (https://creativecommons.org/licenses/by/4.0/).
Share and Cite
Bhatta, R.D.; Paudel, M.; Ghimire, K.; Dahal, K.R.; Amgain, L.P.; Pokhrel, S.; Acharya, S.; Kandel, B.P.; Aryal, K.; K. C., B.; et al. Production and Profitability of Hybrid Rice Is Influenced by Different Nutrient Management Practices. Agriculture 2022, 12, 4. https://doi.org/10.3390/agriculture12010004
Bhatta RD, Paudel M, Ghimire K, Dahal KR, Amgain LP, Pokhrel S, Acharya S, Kandel BP, Aryal K, K. C. B, et al. Production and Profitability of Hybrid Rice Is Influenced by Different Nutrient Management Practices. Agriculture. 2022; 12(1):4. https://doi.org/10.3390/agriculture12010004
Chicago/Turabian StyleBhatta, Ram Datta, Mahendra Paudel, Kishor Ghimire, Khem Raj Dahal, Lal Prasad Amgain, Samiksha Pokhrel, Samikshya Acharya, Bishnu Prasad Kandel, Krishna Aryal, Bishwas K. C., and et al. 2022. "Production and Profitability of Hybrid Rice Is Influenced by Different Nutrient Management Practices" Agriculture 12, no. 1: 4. https://doi.org/10.3390/agriculture12010004
APA StyleBhatta, R. D., Paudel, M., Ghimire, K., Dahal, K. R., Amgain, L. P., Pokhrel, S., Acharya, S., Kandel, B. P., Aryal, K., K. C., B., Pandey, M., KC, Y., Paudel, S., Subedi, M., Pant, B. R., Bajgai, T. R., Koirala, N., Aboelenin, S. M., Soliman, M. M., ... Upadhyaya, J. (2022). Production and Profitability of Hybrid Rice Is Influenced by Different Nutrient Management Practices. Agriculture, 12(1), 4. https://doi.org/10.3390/agriculture12010004