Article

Assessment of Drought Tolerance of Miscanthus Genotypes through Dry-Down Treatment and Fixed-Soil-Moisture-Content Techniques

by
Tzu-Ya Weng
1,
Taiken Nakashima
2,
Antonio Villanueva-Morales
3,
J. Ryan Stewart
4,5,6,
Erik J. Sacks
5,7 and
Toshihiko Yamada
5,6,*
1
Graduate School of Global Food Resources, Hokkaido University, Sapporo 0600809, Hokkaido, Japan
2
Research Faculty of Agriculture, Hokkaido University, Sapporo 0608589, Hokkaido, Japan
3
Department of Statistics, Mathematics and Computing, Forest Sciences Division, Universidad Autónoma Chapingo, Texcoco 56230, Mexico
4
Department of Plant and Wildlife Sciences, Brigham Young University, Provo, UT 84604, USA
5
Field Science Center for Northern Biosphere, Hokkaido University, Sapporo 0600811, Hokkaido, Japan
6
Global Center for Food, Land and Water Resources, Hokkaido University, Sapporo 0608589, Hokkaido, Japan
7
Department of Crop Sciences, University of Illinois, Urbana-Champaign, Urbana, IL 61801, USA
*
Author to whom correspondence should be addressed.
Agriculture 2022, 12(1), 6; https://doi.org/10.3390/agriculture12010006
Submission received: 16 November 2021 / Revised: 13 December 2021 / Accepted: 14 December 2021 / Published: 22 December 2021
(This article belongs to the Special Issue Abiotic Stresses, Biostimulants and Plant Activity)

Abstract

:
Miscanthus, a high-yielding, warm-season C4 grass, shows promise as a potential bioenergy crop in temperate regions. However, drought may restrain productivity of most genotypes. In this study, total 29 Miscanthus genotypes of East-Asian origin were screened for drought tolerance with two methods, a dry-down treatment in two locations and a system where soil moisture content (SMC) was maintained at fixed levels using an automatic irrigation system in one location. One genotype, Miscanthus sinensis PMS-285, showed relatively high drought-tolerance capacity under moderate drought stress. Miscanthus sinensis PMS-285, aligned with the M. sinensis ‘Yangtze-Qinling’ genetic cluster, had relatively high principal component analysis ranking values in both two locations experiments, Hokkaido University and Brigham Young University. Genotypes derived from the ‘Yangtze-Qinling’ genetic cluster showed relatively greater photosynthetic performance than other genetic clusters, suggesting germplasm from this group could be a potential source of drought-tolerant plant material. Diploid genotypes showed stronger drought tolerance than tetraploid genotypes, suggesting ploidy could be an influential factor for this trait. Of the two methods, the dry-down treatment appears more suitable for selecting drought-tolerant genotypes given that it reflects water-stress conditions in the field. However, the fixed-SMC experiment may be good for understanding the physiological responses of plants to relatively constant water-stress levels.

1. Introduction

Drought stress limits plant growth and yield and acts as a barrier to the successful cultivation of bioenergy crops, such as sugarcane and maize, particularly in world arid and semi-arid regions [1]. Drought impairs plant metabolism, such that plants cannot provide sufficient photosynthetic energy for cell growth and maintenance, which sometimes results in death [2].
To adapt and survive under drought stress, mechanisms involving drought resistance and drought recovery are key aspects of adaptations [3]. Plants with drought tolerance generally express certain traits under stress, such as leaf area reduction to minimize transpirational water loss and maintenance of high chlorophyll content to enable high photosynthetic levels in order to produce enough energy for survival. Therefore, photosynthetic parameters, especially photosynthetic rate (Pn), are considered as an effective measure of drought tolerance in plants, such as in Leucaena leucocephala (Lam.) de Wit [4]. Liu et al. (2015) reported that the photosynthetic rate of drought-tolerant switchgrass (Panicum virgatum L.) genotypes was positively correlated with other physiological parameters, such as relative water content, transpiration rate (Tr), stomatal conductance (gs), and water-use efficiency (WUE) when subjected to low-water conditions [5]. It means that the performance of Pn can be regarded as the physiological response of plants under drought.
Extreme drought will likely increase in the future due to global warming [6]. Consequently, there is a strong need for identifying crop accessions with high recovery capacity to drought stress. Such a trait enables crops to access water from the soil from short-term rain events and to maintain physiological function to survive drought. Lauenroth et al. (1987) observed that the warm-season perennial grass species, Bouteloua gracilis H.B.K. Lag. ex Steud., in response to low soil moisture, generated new root growth after the root zone was replenished with water, which led to increased soil water uptake [7]. Also, lipid peroxidation and H2O2 content, which were generated in tea plants (Camellia sinensis (L) O. Kuntze) in response to drought, decreased after post-drought soil-water recharge [8]. In addition, the catalase activity of pea (Pisum sativum L., cv. Progress 9), which is involved in removing H2O2 molecules, increased during drought [9]. However, H2O2 molecules decreased to normal levels after re-watering. Moreover, Chen et al. (2016) reported drought adaptability of maize (Zea mays L.) seedlings was more associated with drought recovery (r = 0.714) than drought resistance (r = 0.332) in correlation analysis, suggesting recovery capacity is a key component of plant survival to drought stress [3]. They also used it as a screening criterion to identify drought-tolerant genotypes.
For evaluation of drought tolerance in plants under greenhouse studies, two types of techniques, the dry-down treatment [10] and fixed-soil moisture content (SMC) methods [11,12], have been used to apply low-water conditions in potted plants. In the dry-down method, water is withheld from plants, often for several days, after initially being well watered. As evapotranspiration occurs, SMC will continue to decline, which often leads to gradually increasing levels of plant drought stress. The SMC of plants in dry-down treatments usually decreases quickly over a short period of time. Advantages of the dry-down technique include cost-efficiency and ease of operation. However, the method affords little time for researchers to observe how plants respond to drought.
On the other hand, the fixed SMC technique is used to keep the SMC of target plants at fixed soil-moisture levels by regularly adding water through a computerized irrigation system to the rhizosphere of the potted plants based on the amount of water evapotranspired from the plant and medium [11]. In this technique, the rhizosphere of target plants can be maintained at a relatively constant SMC, thus allowing for the plants to experience continuous drought conditions. The disadvantages of the fixed-SMC method include the large amount of time and effort required for calculating evapotranspiration and for maintaining irrigation levels. However, comparison between both techniques is warranted given that each method offers distinct advantages in terms of characterizing plant responses to drought stress.
Miscanthus, a C4 perennial rhizomatous grass, has high biomass productivity in marginal lands and expresses high CO2 fixation in low-temperature conditions, underscoring its potential as a bioenergy crop [13,14]. Two major important Miscanthus species are Miscanthus sinensis Andersson and Miscanthus sacchariflorus (Maxim.) Bentham. A single sterile triploid clone of Miscanthus × giganteus Greef & Deuter ex Hodk. & Renvoize, a hybrid between M. sacchariflorus and M. sinensis, has been adapted for commercial biomass production in Europe and North America. Based on data generated from restriction site-associated DNA sequencing and Golden Gate technologies, M. sinensis is mainly comprised of 6 genetic clusters, which include ‘South-eastern China plus tropical’, ‘Yangtze-Qinling’, ‘Sichuan Basin’, ‘Korea, North China’, ‘Southern Japan’, and ‘Northern Japan’ [15]. On the other hand, M. sacchariflorus consists of ‘Yangtze’ diploids, ‘Northern China’ diploids, ‘Korea/Northeast China/Russia’ diploids, ‘Northern China/Korea/Russia’ tetraploids, ‘Southern Japan’ tetraploids, and ‘Northern Japan’ tetraploids [16]. Relative to M. sinensis species, the diploid and tetraploid clusters of M. sacchariflorus, possibly play a role in stress-tolerance expression in the species complex, when used to breed M. × giganteus new genotype by crossing M. sacchariflorus with M. sinensis species. In the present study, a core population of several Miscanthus species, which were characterized by Clark et al. (2014, 2019) [15,16], were included for evaluation of their response to drought.
Miscanthus species are considered to have stronger drought tolerance than another potential energy crop, switchgrass [17,18]. Under drought conditions, relative to maize and switchgrass, Miscanthus exhibited higher light-use efficiency, photosynthetic rate, and above-ground biomass [19]. However, as a potential energy crop, selection needs to be made of drought-tolerant Miscanthus accessions [20]. Many cultivated Miscanthus genotypes, including the widely cultivated, high-yielding Miscanthus × giganteus, lack strong drought tolerance [21]. Moreover, M. × giganteus uses more water than maize due to its longer growing season and higher productivity [21]. Selecting for drought tolerance of Miscanthus is essential for wherever it may be cultivated as a bioenergy crop because the ubiquity of drought also happens even in high-rainfall areas [20]. Selecting for and developing drought-tolerant Miscanthus genotypes as breeding material increases the versatility of Miscanthus as a sustainable bioenergy crop.
Little research appears to have been done to characterize drought tolerance of Miscanthus. Previous research on the impact of drought on Miscanthus mainly focused on M. × giganteus [22,23]. Most parameters, such as dry weight accumulation, leaf expansion chlorophyl content, decreased when M. × giganteus meet drought [22]. Moreover, there are many genetic resources of Miscanthus spp., which could be used as breeding stock to improve drought-adaptation capacity in high-yielding accessions. Consequently, there is a need to identify and evaluate drought-tolerant Miscanthus genotypes as breeding material from the core population.
Given that there are considerable genetic differences among Miscanthus genotypes, even under well-watered conditions, assessment of drought tolerance, based only on photosynthesis data collected during periods of low SMC, can be fraught with limitations. To avoid this problem, we employed the drought stress index (DSI) methodology of Liu et al. (2015) [5]. It shows promise in quantifying drought-induced effects in Miscanthus plants. Drought stress index values are calculated as follows:
DSI = (value of traits under stress condition)/(value of traits under
well-watered condition) × 100
The DSI can remove genetic differences among different genotypes and can be used as an indicator of drought tolerance throughout the Miscanthus genus.
The present study focused on two objectives to characterize the drought-tolerance capacity of Miscanthus. The first objective was to compare different techniques used to impose drought stress in plants in terms of their suitable applications. The second was to screen Miscanthus genotypes for drought tolerance with the express purpose of identifying germplasm to use as future breeding-stock material.

2. Materials and Methods

2.1. Screening Experiment for Dry-Down-Imposed Drought Stress

2.1.1. Experiment in Hokkaido University, Japan

A population of 23 Miscanthus genotypes, which included 10 M. sinensis, one M. sinensis var. condensatus, 11 M. sacchariflorus, and one M. floridulus genotypes, which were collected from across East Asia, served as the source of the selection materials for this study (Table 1; Table S1). The genotypes were divided into thirteen genetic clusters, based on analyses by Clark et al. (2014, 2019) [15,16]. Considerable genetic variation existed among the genotypes [15,16]. As such, we considered that even with only 23 genotypes, which had limited representation (i.e., between 1–6 genotypes) of each genetic cluster, there was sufficient genetic variation to draw broad-based inferences for the genus at large. The experiment was conducted in a semi-open rain-shelter greenhouse at Hokkaido University (HU) in Sapporo, Japan (43°4′43″N, 141°20′19″E). The dry-down experiment ran from July to August 2018. All 23 Miscanthus genotypes were propagated from rhizomes. Rhizome pieces of each genotype were cut into 10 cm lengths and grown in plastic pots (diameter = 19 cm, height = 27 cm). All plants were irrigated every day for 4 weeks before starting the experiment.
The screening experiment was arranged as a randomized complete block design. There are three blocks and each block consisted of two pots of each of the 23 genotypes. One pot represented the well-watered treatment and one pot was assigned to the drought-stress treatment for each of the 23 genotypes in one block. The well-watered treatment involved daily irrigation to saturate the rhizosphere of each of the treated plants, while the dry-down treatment was applied by withholding water for 7 days. After 7 days, plants were irrigated to container capacity. The dry-down period was repeated four times.
The Soil Plant Analysis Development (SPAD) Chlorophyll meter (SPAD-502Plus, Konica Minolta, Osaka, Japan), used to measure chlorophyll content, is one of the simpler and quicker means to characterize drought stress due to its non-destructive nature and its close correlation with leaf-level photosynthesis [24,25]. Measurements of SPAD value were taken on all plants between 10:30 am to 2:00 pm on days 0, 7, 14, 21, and 28. Rhizosphere conditions after 28 days of the dry-down experiment could be equated with what occurs in the field in the spring and/or summer in temperate regions, such as the east-central U.S. [26].
To evaluate drought tolerance in 23 Miscanthus genotypes during the dry-down experiment, DSI of SPAD value was plotted against coefficient of variance (CV) of SPAD value (Figure 1). The DSI of the HU screening experiment was calculated as follows:
DSI of SPAD value (HU screening experiment) = (value of traits on day 28
of drought)/(value of traits on day 0 as well-watered treatment) × 100

2.1.2. Experiment at Brigham Young University, USA

A population of 14 Miscanthus genotypes (Table 1), where each plant constituted the experimental units, were included in a drought-tolerance-evaluation experiment at Brigham Young University (BYU), Provo, Utah, USA (40°14’59” N, 111°38’57” W). The experiment was arranged in a completely randomized design. Due to independent Miscanthus genotype management at HU and BYU, six Miscanthus genotypes (JPN-2011-010, PMS-7, PMS-164, PMS-285, PMS-347, PI417947) were both evaluated in the HU screening experiment and BYU experiment. However, the remaining eight genotypes were only evaluated in the BYU experiment. The experiment was conducted under greenhouse conditions from 4 to 25 October 2019. Each genotype was replicated two times. All plants grown in plastic pots (diameter = 19 cm, height = 27 cm) were irrigated daily for one week prior to treatment initiation to keep them well watered before the dry-down experiment started. After measurements were collected on day 0 of the experiment, the dry-down treatment was applied by withholding water for 7 days. Plants were then irrigated to container capacity. The dry-down period was repeated three times.
The SPAD value was measured in all plants between 1:00 am to 3:30 pm on days 0, 7, 14, and 21 with a SPAD chlorophyll meter (MC-100 Chlorophyll Concentration Meter, Apogee Instruments, Inc., Logan, UT, USA). Photosynthesis parameters such as Pn, gs, Tr, intercellular CO2 concentration (Ci), and leaf-level fluorescence (φPSII) were also measured for all genotypes with a portable photosynthesis system (LI-6400XT, LI-COR, Lincoln, NE, USA) with a 6400-40 leaf chamber fluorometer for use with the LI-6400 Portable Photosynthesis System (LI-COR, Lincoln, NE, USA). In addition, soil water potential was measured from collected soil samples on days 0, 7, 14, and 21 with a WP4C Dew Point Potentiometer (METER Group, Pullman, WA. USA).
Drought tolerance of Miscanthus genotypes was evaluated with the DSI data from the 14-day-dry-down data set from the BYU screening experiment, where the soil water potential (−2.6 MPa) led to slight levels of drought stress after the dry-down period.
DSI (14-day dry-down data) = (value of traits from 14-day dry-down)/
(value of traits of 0-day dry-down) × 100
In order to comprehensively assess drought tolerance of the different genotypes, principal component analysis (PCA) ranking values, which were based on DSI values, were used to assess drought-tolerance capacity in each Miscanthus genotype based on the methodology of Liu et al. (2015) [5]. Liu et al. (2015) reported that the PCA based on the DSI of physiological parameters is considered to be a reliable method for evaluating drought tolerance among plants genotypes.
The 14 Miscanthus genotypes were ranked based on the PCA ranking values, which are based on DSI (14-day dry-down data) values. A significance test analysis done through SAS of the DSI data from the BYU screening experiment was used to complement the PCA results.
To understand the effect of different environments on Miscanthus genotype performance, SPAD value-based DSI values of the six Miscanthus genotypes were subjected to analysis of variance (ANOVA) in the HU screening and BYU experiments. As mentioned previously, six Miscanthus genotypes (JPN-2011-010, PMS-7, PMS-164, PMS-285, PMS-347, PI417947) were used in both the HU-screening and BYU screening experiments. Both experiments used the dry-down treatment to impose drought stress.

2.2. Precise-Comparison Experiment with Automated Irrigation System at HU

A total of ten Miscanthus genotypes, consisting of eight putatively drought-tolerant and two drought-sensitive Miscanthus genotypes, were selected based on preliminary results from the HU screening experiment. A scatterplot of SPAD value-based CV values and SPAD value-based DSI values in the HU screening experiment is shown in Figure 1. Relatively lower CV values and higher DSI values of some genotypes indicated that they had fewer variation between different drought levels and less differences between well-watered and drought conditions. Based on these results, eight putatively drought-tolerant genotypes (PMS-164, PMS-285, PMS-347, PMS-7, UI10-00008, UI10-00015, UI10-00020, UI10-00024) and two drought-sensitive genotypes (JPN-2011-004, UI11-00033) were selected to be included in the HU precise-comparison experiment for further analysis of their photosynthetic performance under specific drought levels through an automated irrigation system. Among the eight drought-tolerant genotypes, there was only one representative from the M. sacchariflorus species group, UI10-00008, while the other seven were M. sinensis genotypes. On the other hand, the most drought-sensitive genotypes, JPN-2011-004 and UI11-00033, were M. sacchariflorus. The genotypes were evaluated for drought tolerance in a precise-comparison experiment using an automated irrigation system following the methodology of Nemali and van Iersel (2006) [12]. A simplified diagram of the irrigation system can be seen in Figure S1. The experiment was conducted in a semi-open greenhouse at Hokkaido University from 10 September to 10 October 2018.
The precise-comparison experiment was arranged in a completely randomized design. Each genotype had three replicates. Soil moisture sensors (GS3, Meter Group, Pullman, WA) were inserted, along with drip emitters, into each of the potted plants (diameter = 19 cm, height = 27 cm). The sensors and emitters were connected to an automatic irrigation system, which regulated the amount of water applied to each plant. Soil-moisture treatments (20, 25, and 30% SMC) were arranged by setting the set-point of the system at pre-determined soil-moisture levels. The lowest SMC treatment (20%) was defined as the severe drought treatment and the highest SMC treatment (30%) was considered the well-watered treatment. After all potted plants achieved their SMC set points for 5 days, Pn, gs, Ci, and Tr were collected on the youngest, fully expanded leaf of each plant with a portable photosynthesis system (LI-6400XT). Leaf-level fluorescence (φPSII) and SPAD value, which were measured at the same time as photosynthesis, were measured with a fluorometer (Junior-PAM, Heinz Walz GmbH, Effeltrich, Germany) and a SPAD chlorophyll meter (SPAD-502Plus), respectively.
Soil moisture of all pots was controlled by the automated irrigation system. Average changes in SMC levels can be seen in Figure S2. The time taken for the potted media to reach the severe-drought-level set point required more time than media in the slight-drought-level treatment. For example, it only took 5 days for soil moisture to decrease from 30% to 25%, while it took 8 days for soil moisture to reduce from 25% to 20% (Figure S2).
Drought tolerance of these 10 Miscanthus genotypes was evaluated with the DSI data from the 25% SMC treatment in the HU precise-comparison experiment.
DSI (25% SMC treatment) = (value of traits of 25% SMC)/
(value of traits of 30% SMC) × 100
A PCA-ranking value based on DSI from the 25% SMC treatment was calculated for each genotype following the method of Liu et al. (2015) [5]. The 10 Miscanthus genotypes were ranked as relatively drought tolerant based on PCA ranking values. A significance test analysis done through SAS of the DSI data from the HU precise-comparison experiment was used to complement the PCA results.
To understand how different drought-treatment methods affected evaluation results of drought tolerance in Miscanthus spp., DSI of four photosynthetic parameters (Pn, gs, Tr, φPSII) of four Miscanthus genotypes (PMS-7, PMS-164, PMS-285, PMS-347), which were subjected to slight stress-level conditions (25% SMC in the HU precise-comparison experiment and −2.6 MPa of soil water potential on day 14 of the BYU experiment), were subjected to ANOVA. The fixed-SMC method was used as a drought-treatment method in the HU precise-comparison experiment, while in the BYU experiment, the dry-down method was used to subject plants to drought stress.

2.3. Post-Drought Recovery in the BYU Experiment

After the 21-day BYU dry-down screening experiment finished, a 7-day post-drought recovery experiment was conducted with the same plants in order to evaluate the drought-recovery capacity of the Miscanthus genotypes. A population of 14 Miscanthus genotypes (Table 1) was used in the 7-day post-drought-recovery experiment, which was the same material used in the BYU screening experiment. The recovery experiment was arranged in a completely randomized design and conducted under greenhouse conditions from 25 October to 1 November 2019, with two replicates of each genotype. Plants were watered daily over the 7-day experiment. Instrumentation and measurement parameters were the same as those used in the screening experiment. Measurements were made on the seventh day of the recovery experiment.
To understand the degree of recovery capacity from drought stress in Miscanthus genotypes, recovery DSI values were used to calculate PCA ranking values as assessment criteria.
Recovery DSI = (value of traits of day 7 in BYU recovery experiment)/
(value of traits of day 21 in BYU screening experiment) × 100
Moreover, to comprehensively assess drought-recovery capacity of the different genotypes, the PCA ranking value based on recovery DSI values was calculated. The 14 Miscanthus genotypes were ranked according to their relative drought recovery capacity levels, which were based on the PCA-ranking-value results.

2.4. Drought Tolerance Evaluation and Statistical Analysis

The DSI values and PCA ranking values, which were based on DSI values, were used to assess the drought-tolerance capacity in Miscanthus genotypes which was based on the methodology of Liu et al. (2015) [5]. In order to quantify drought-induced effects in Miscanthus plants, the DSI value of each photosynthesis parameter was calculated using equation 1. Moreover, to comprehensively assess drought tolerance of the different genotypes, the PCA ranking value based on DSI values was calculated using the formula below:
PCA ranking value = (contribution of the first principal components (PC1) (%) ×
PC1) + (contribution of the second principal components (PC2) (%) × PC2) +
(contribution of the third principal components (PC3) (%) × PC3)
In the BYU post-drought recovery experiment, recovery DSI values were used as an evaluation parameter of the recovery capacity of different genotypes. The formula used Equation (5). In the HU screening experiment, DSI of SPAD value and CV of SPAD value were used as drought-tolerance-evaluation parameters.
Microsoft Excel (Microsoft Office 2016, Microsoft Corporation, Redmond, WA, USA) was used to perform ANOVA. R statistical software (R3.5.1 by R Development Core Team, 2018) and ggplot2 package of R software were used to perform PCA of drought tolerance of Miscanthus genotypes. Statistical Analysis System (SAS Institute Inc., Cary, NC, USA) was used to respectively perform a significance test analysis of the DSI data from the HU precise-comparison and BYU screening experiments.

3. Results

3.1. Comparison of Miscanthus Genotype Performance between HU and BYU Experiments

Drought stress index values of 21-day dry-down of SPAD value of six Miscanthus genotypes (JPN-2011-010, PMS-007, PMS-164, PMS-285, PMS-347, PI417947) in the HU screening experiment and BYU experiment were subjected to ANOVA (Table 2). In the ANOVA results, there was no significant difference (p > 0.05) in DSI values of Miscanthus genotypes in the HU and BYU experiments.
Drought stress index values of four photosynthetic parameters (Pn, gs, Tr, φPSII) of four Miscanthus genotypes (PMS-7, PMS-164, PMS-285, PMS-347) under slight stress-level conditions (25% SMC in the HU precise-comparison experiment and soil water potential as −2.6 MPa on day 14 of the BYU experiment) were subjected to ANOVA (Table 3). The ANOVA results was significant (p ≤ 0.05) in DSI values of Miscanthus genotypes in the HU precise-comparison and BYU experiments.
The DSI φPSII mean values of M. sinensis genotype PMS-285 in the slight stress-level treatment in both the HU precise-comparison (94.1) and BYU (75.9) experiments significantly differed from that of the M. sacchariflorus genotype UI11-00033 (39.2) and M. sinensis genotype UI10-00015 (37.8) in the HU precise-comparison experiment (Table S2). In the BYU experiment, DSI φPSII of M. sinensis genotype PMS-007 (102.9) was higher than other genotypes and significantly differed from that of four M. sinensis genotypes (PMS-014, PMS-164, PMS-347, PMS-586) (Table S2-1). However, compared to its performance in the BYU experiment, the DSI φPSII of PMS-007 (71.5) was moderately high in the HU precise-comparison experiment (Table S2-2). The DSI Pn of M. sinensis genotype PMS-007 was relatively higher in the HU precise-comparison (77.3) and BYU (94.4) experiments than other genotypes subjected to slight stress levels, with the exception of M. sinensis genotype UI10-00088 in the BYU experiment (Table S3).
In addition, plants of M. sinensis genotype PMS-164 had higher DSI φPSII levels in the severe-stress-level treatment in the HU precise comparison (99.0) and BYU (67.8) experiments relative to those in slight stress-level treatment (HU: 42.9, BYU: 63.6) (Table S2). The DSI gs of M. sinensis genotype PMS-164 in the slight-stress-level treatment of the HU precise-comparison (824) and BYU (195) experiments statistically differed from 9 genotypes in the HU precise-comparison experiment (Table S4).

3.2. Changes in Soil Water Potential across Treatments in the BYU Experiment

Average changes in soil water potential of each genotype across treatments in the BYU experiment are shown in Table 4. Across treatments, soil water potential in the BYU experiment decreased, on average, from day 7 to 21 with the gradual exposure of plants to different levels of SMC. At first, soil water potential did not differ between days 0 and 7, but then considerably decreased on days 14 and 21 (Table 4). Soil water potential was around −0.1 MPa on days 0 and 7 and then decreased to −2.6 MPa on day 14 and −10.2 MPa on day 21 (Table 4). The soil water potential values on days 14 and 21 were more severe than those found at field capacity (−0.33 MPa) and permanent wilting (−1.5 MPa).

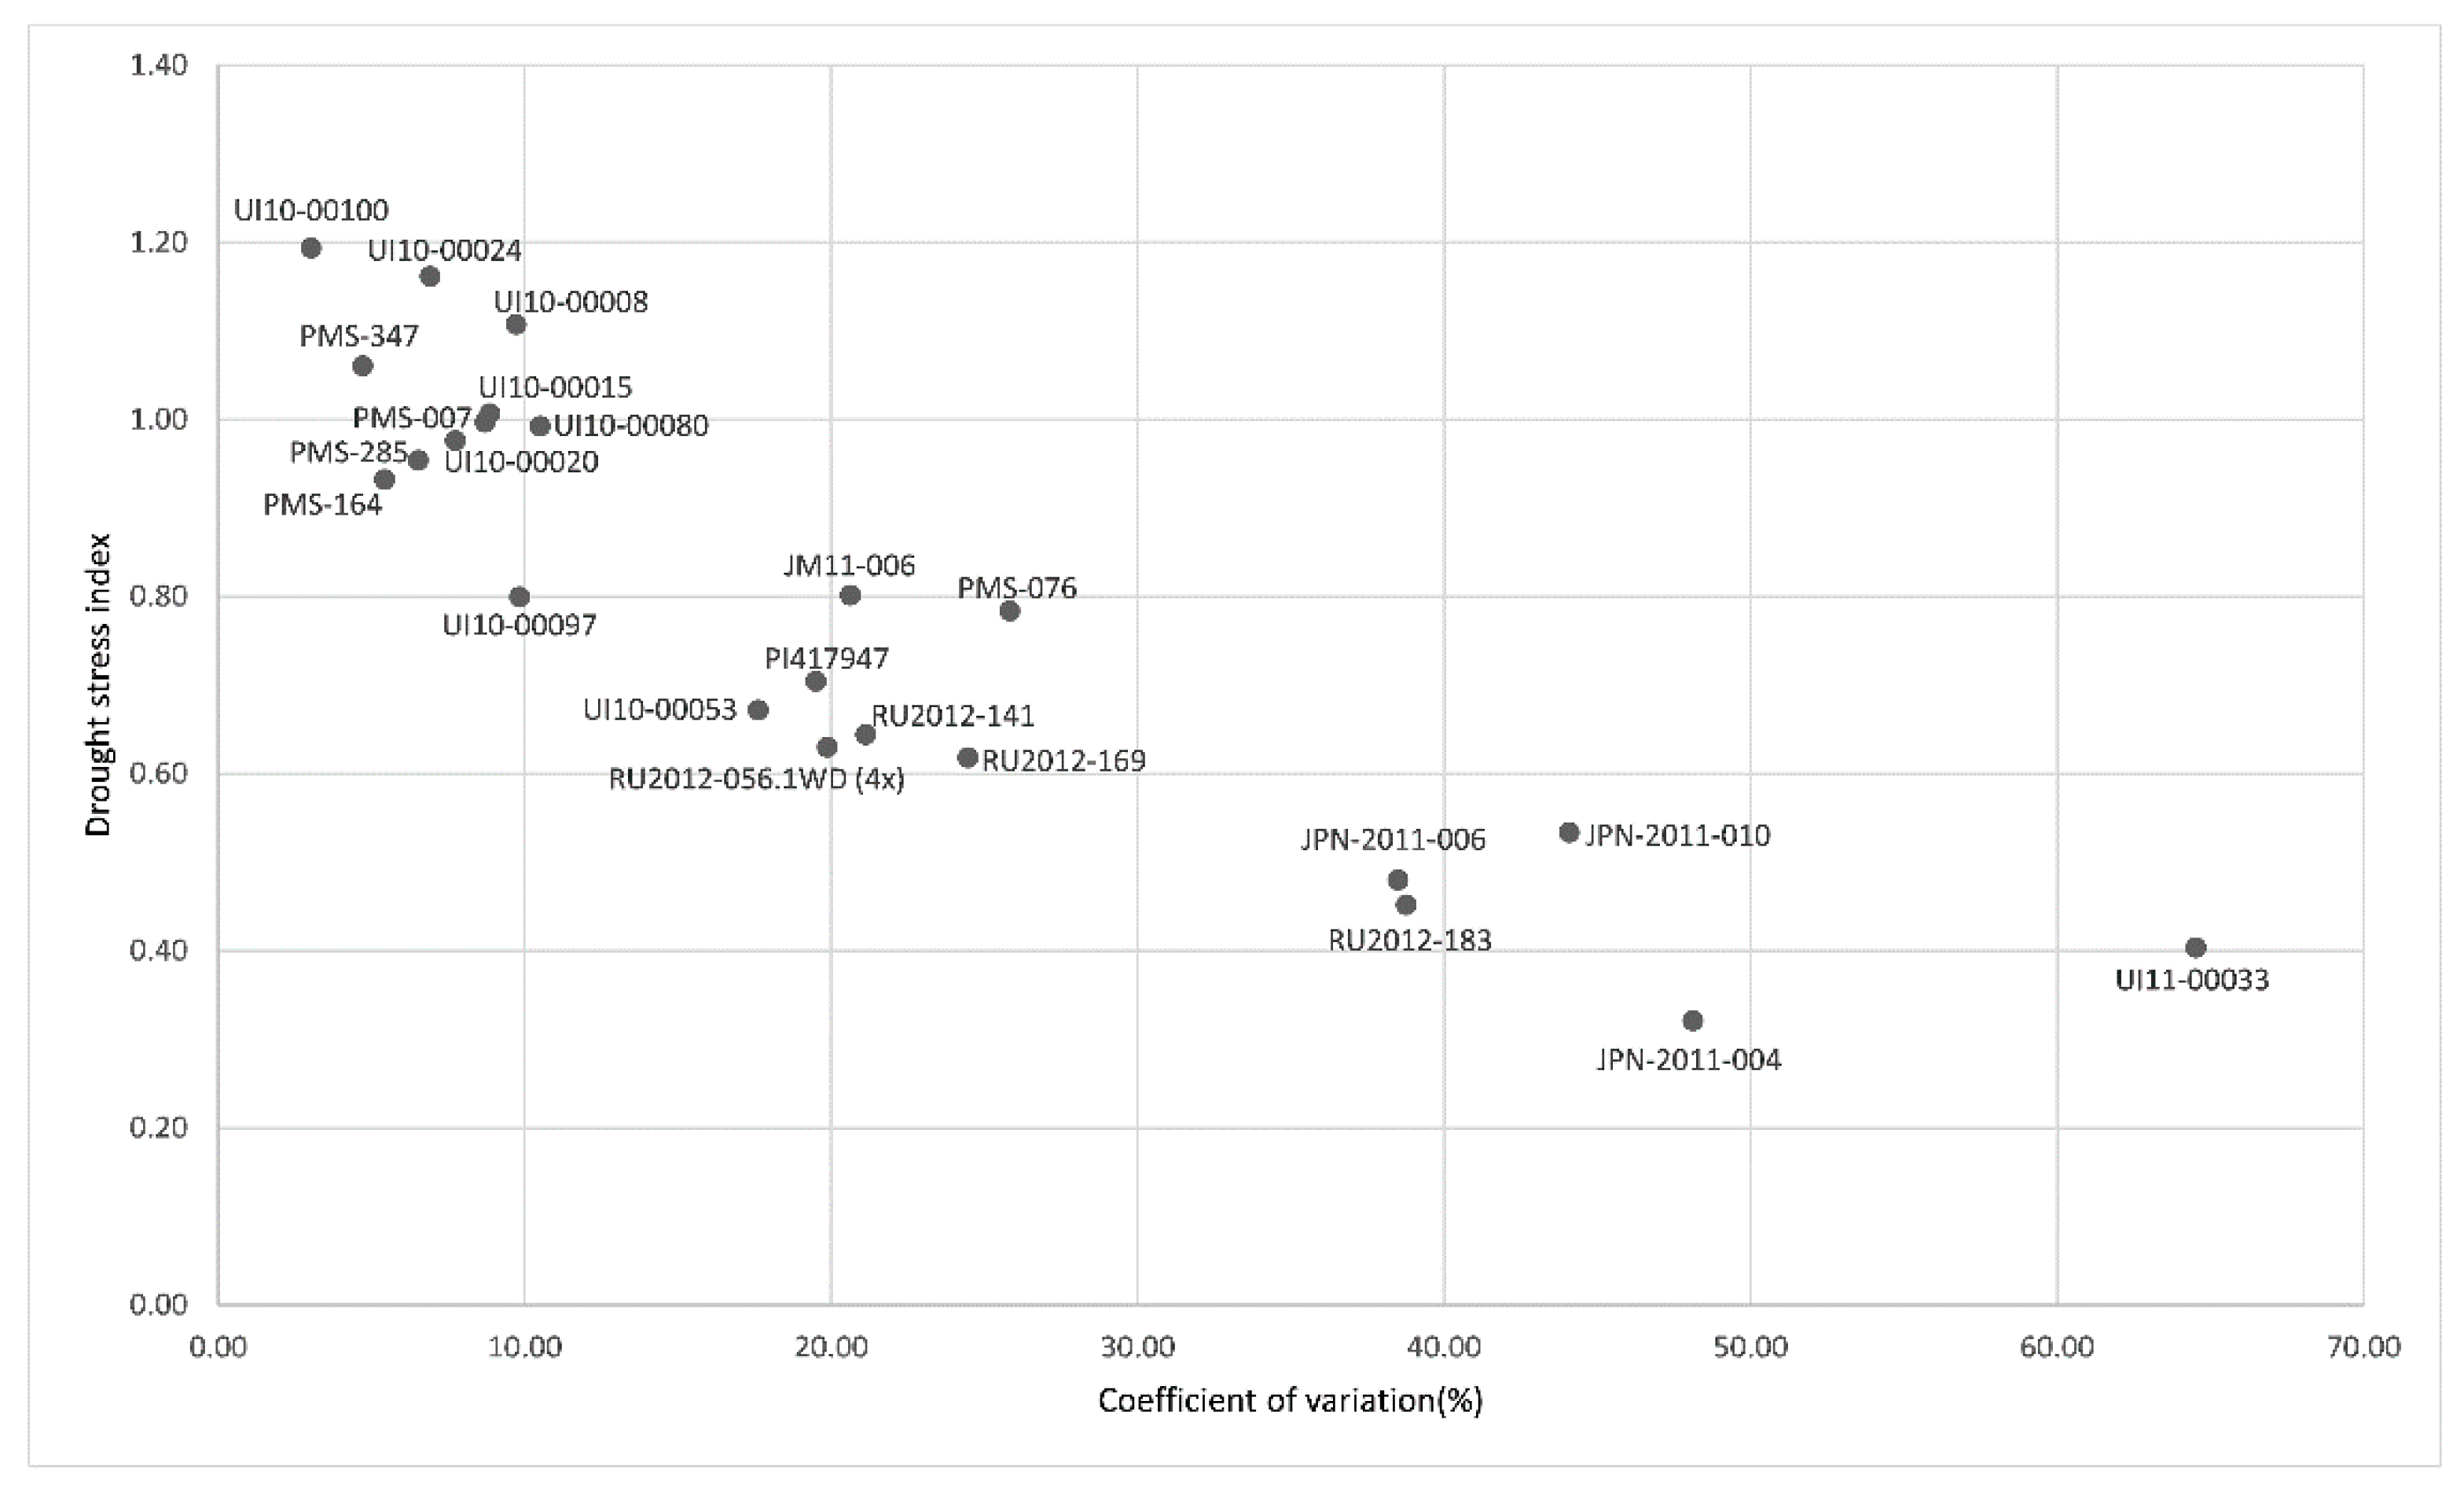
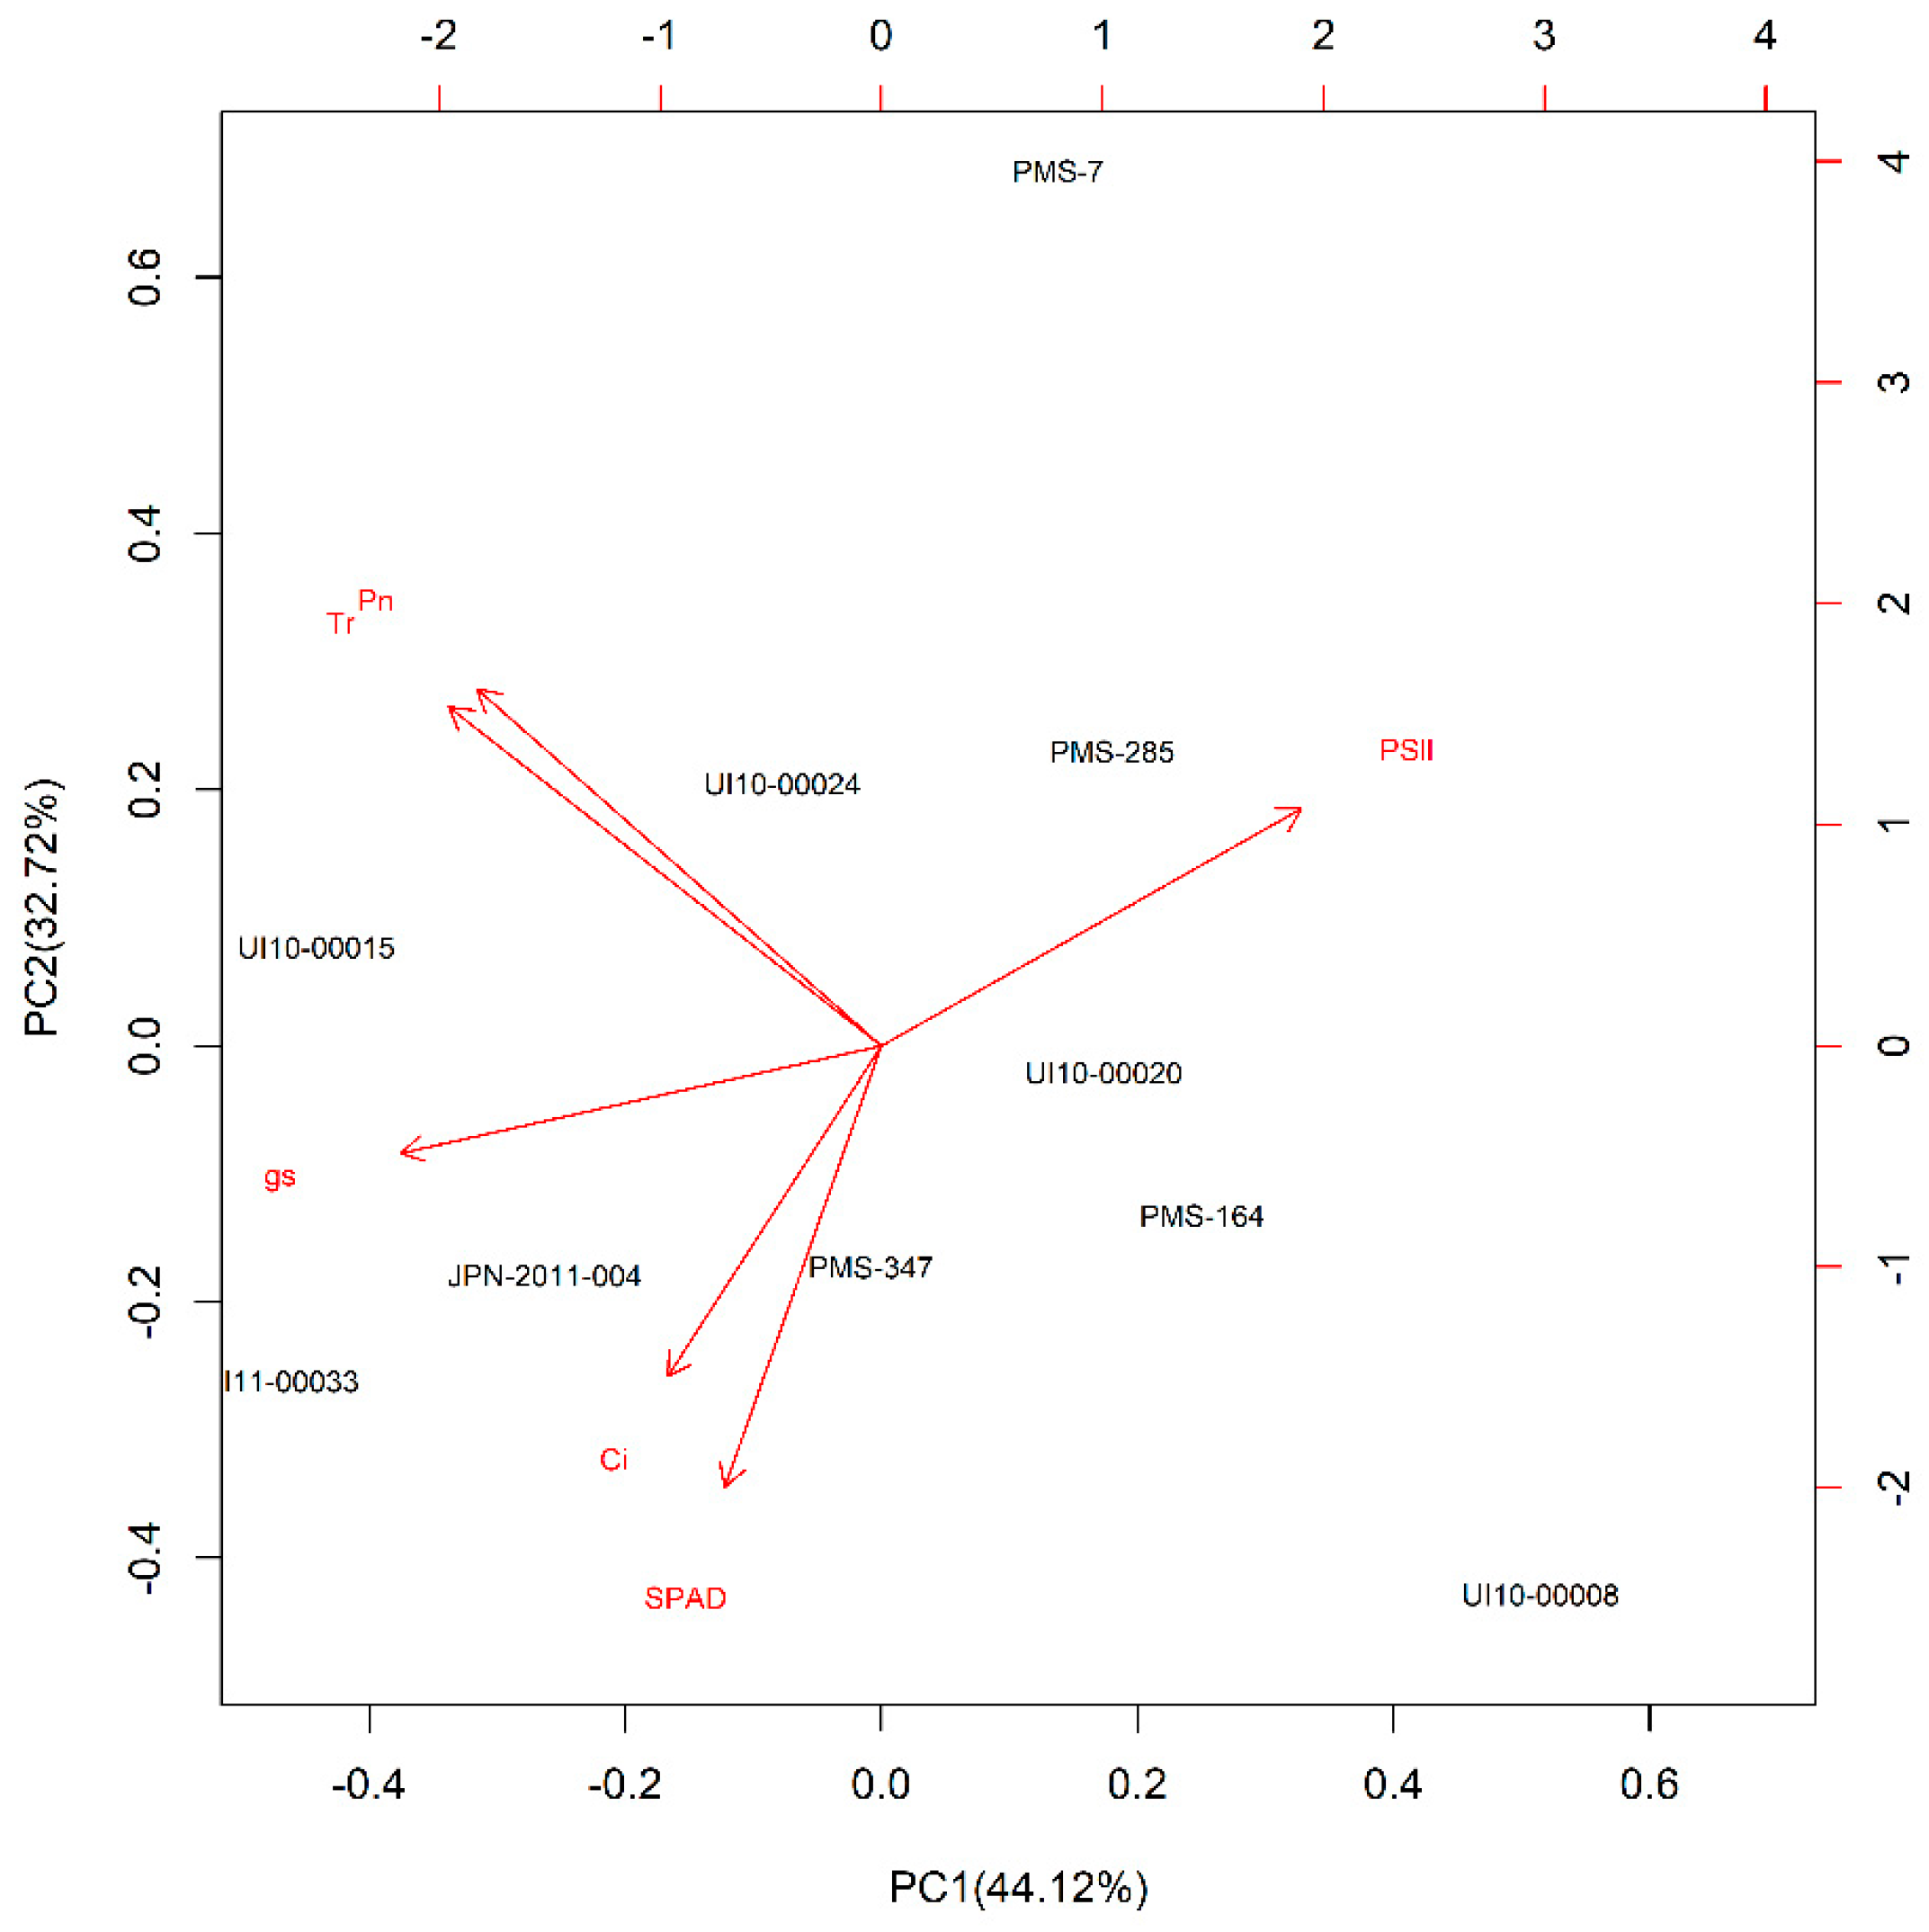
3.3. Performance of Genotypes under Dry-Down Experiment in BYU Screening Experiment

After water-deficit treatments were initiated, photosynthetic levels of all Miscanthus genotypes decreased after day 7 as soil water potential decreased (Table 4). Most genotypes showed higher Pn on day 7 than on day 0, which corresponded to no changes in soil water potential (Table 4). After soil water potential values exhibited a large drop from day 7 to day 14 (−0.14 to −2.6 MPa), the Pn performance of all genotypes also showed a sharp decline, particularly going from a 15% decrease to a 77% decrease in Pn (Table 4). Moreover, five genotypes (JPN-2011-010, JM11-006, JPN-2010-005, UI10-00048, UI10-00092) died after day 14 due to serious drought. In addition, the Pn performance of the M. sinensis genotype, PMS-285, when experiencing low-water availability, showed almost no differences with conspecific genotypes in the well-watered treatment (Table 4). Although Pn of M. sinensis PMS-285 was at relatively moderate levels on days 0 and 7, it dropped when low soil-water conditions became more severe on days 14 and 21 (Table 4). However, the Pn of other genotypes experienced sharp decreases due to low soil-water availability during this time period, such as M. sinensis genotype UI10-00048 (Table 4).
In order to understand how photosynthetic traits contributed to drought tolerance of Miscanthus genotypes in the BYU experiment, we performed PCA using the DSI values (day 14) of six measured parameters (Pn, gs, Ci, Tr, φPSII, SPAD value) (Figure 2). The first (PC1) and second (PC2) principal components explained 76.6% of the variance among 14 Miscanthus genotypes. In addition, Pn and Tr had the largest contribution in PC1, suggesting Pn and Tr were the two most important photosynthesis parameters to the PCA results (Figure 2).
According to the PCA ranking value based on the DSI (day 14 of the BYU screening experiment) (Table 5), M. sinensis genotype PMS-285 and M. floridulus genotype PI417947 had relatively high ranking values compared to other genotypes, suggesting that they were more tolerant to drought stress among the 14 Miscanthus genotypes. In contrast, three of the M. sacchariflorus genotypes (JPN-2011-010, JPN-2010-005, JM11-006), which originated from Japan, showed relatively poor performance under low-water conditions while M. sinensis genotype UI10-00048 had the lowest PCA ranking relative to the other 13 Miscanthus genotypes in the BYU experiment (Table 5).

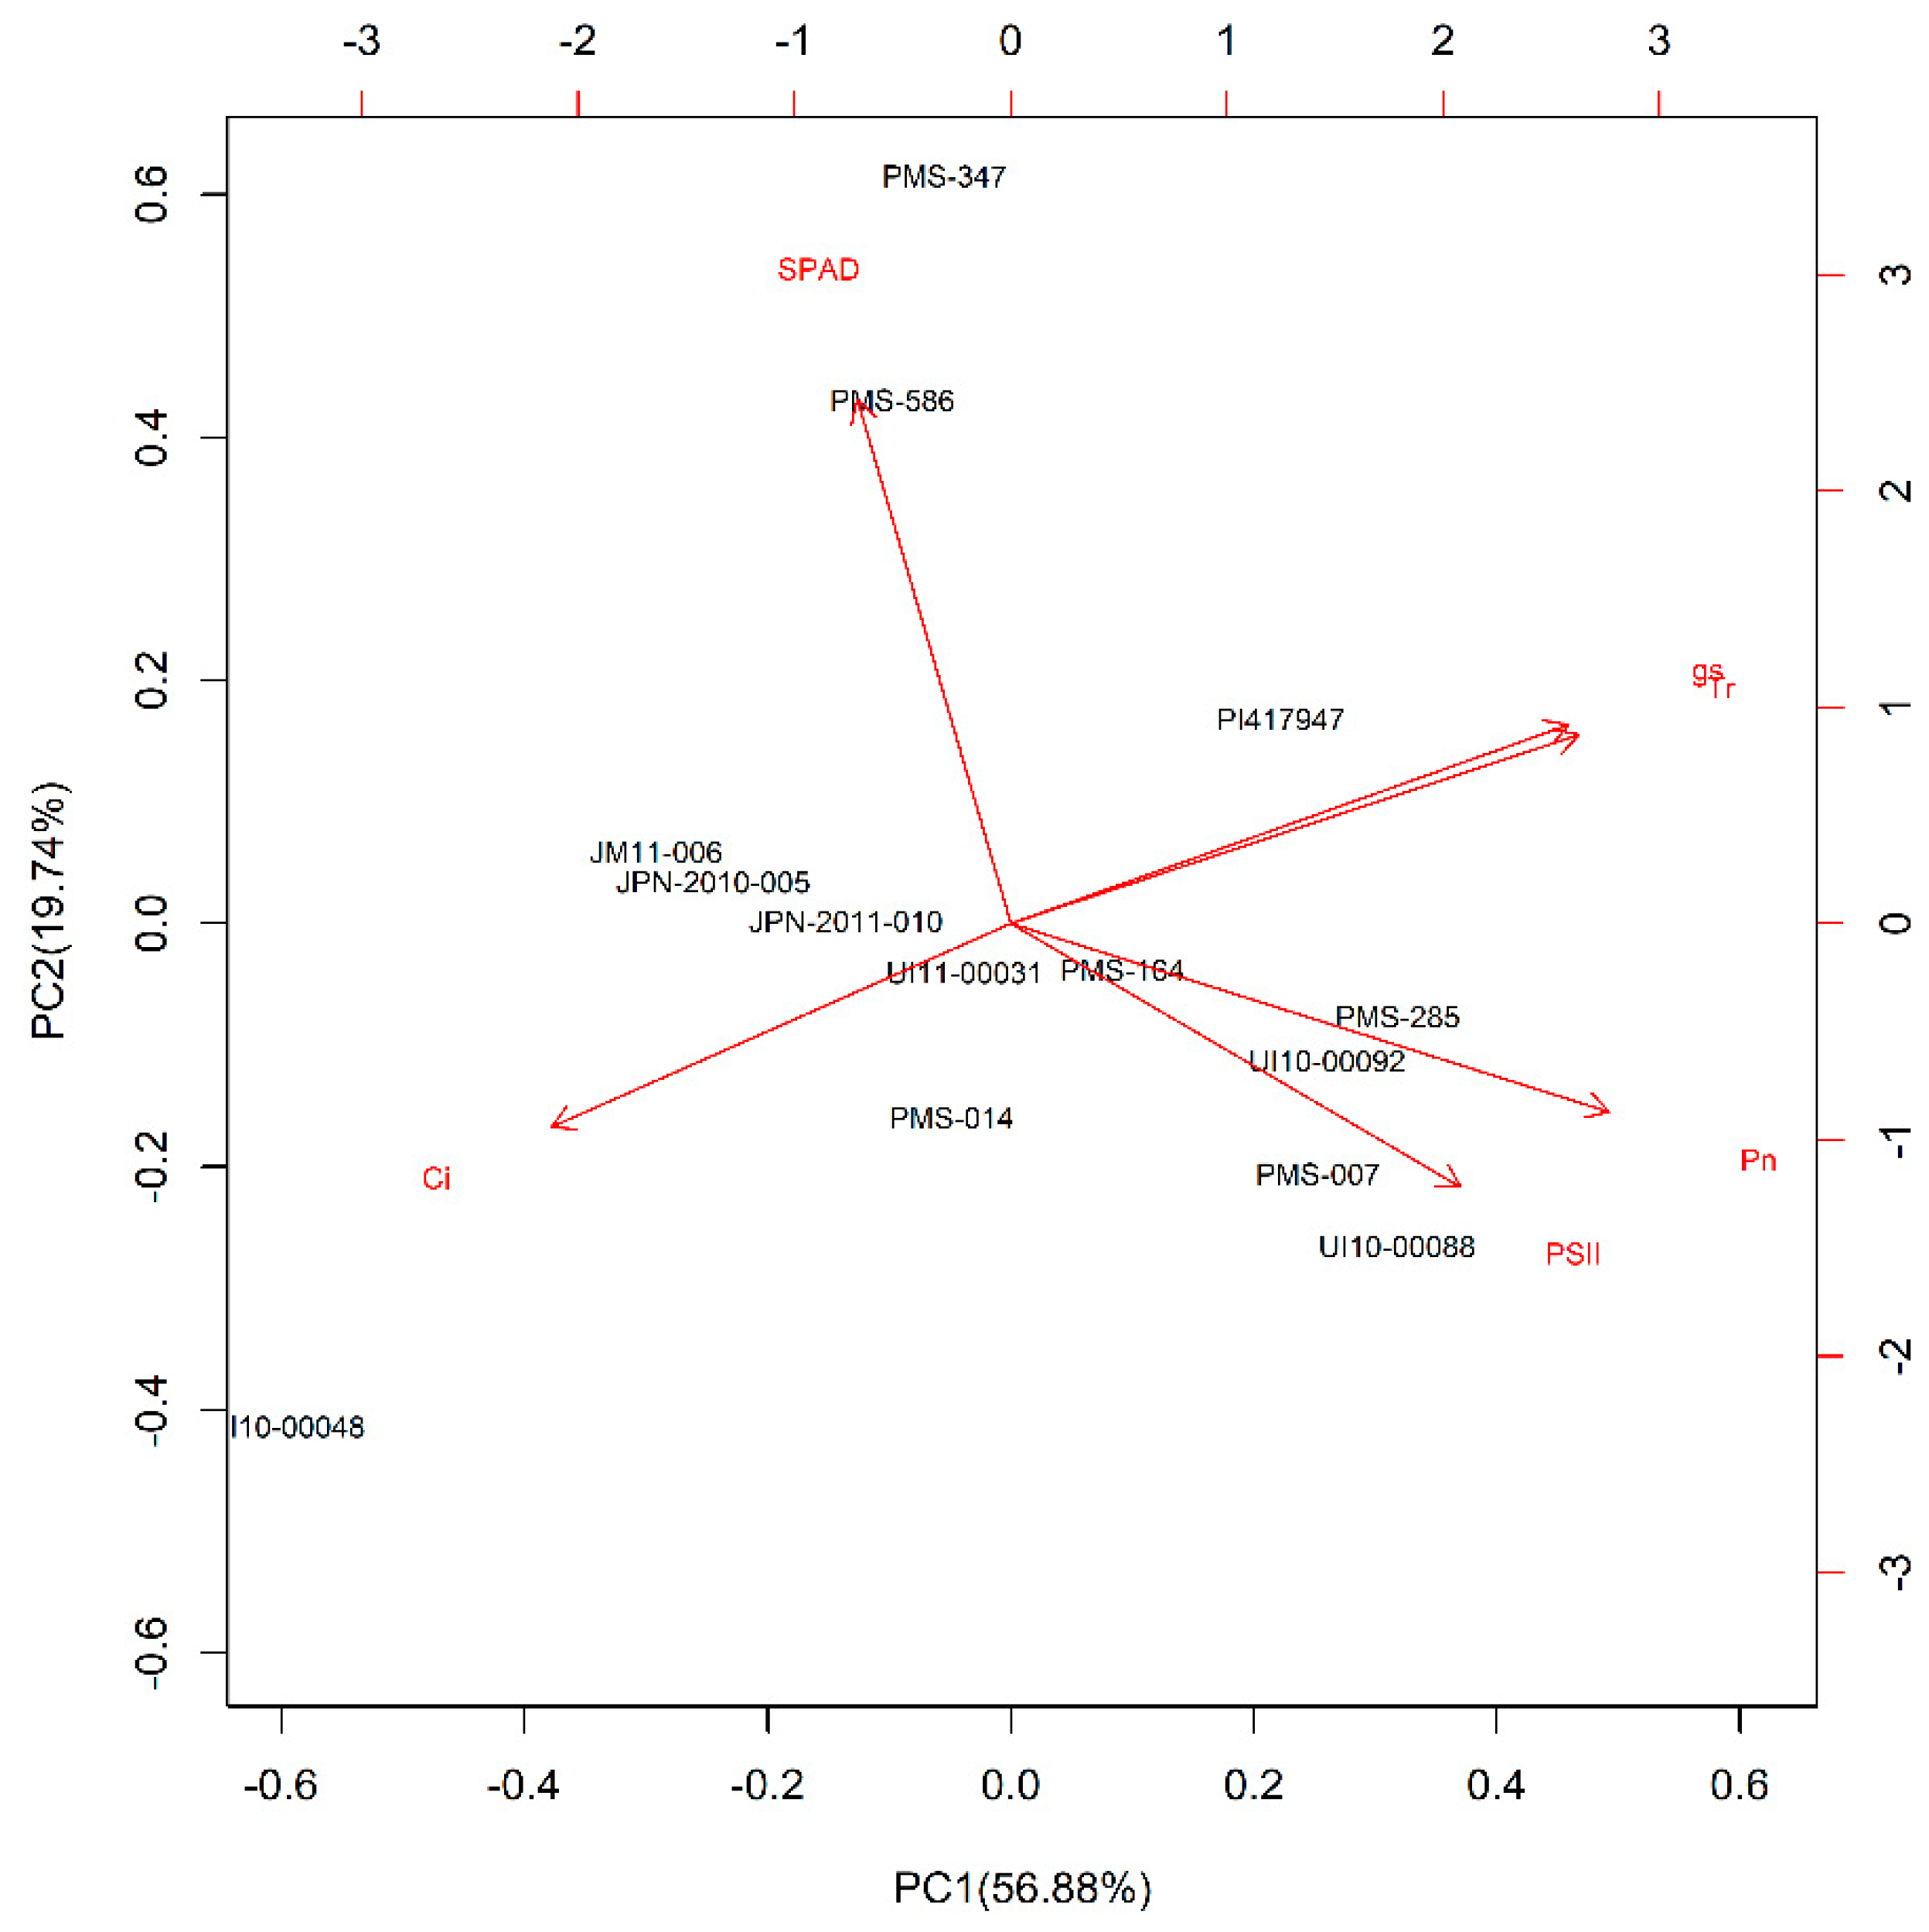
3.4. Performance of Genotypes under Fixed Drought Level with Automated Irrigation System in the HU Precise-Comparison Experiment

The PCA using the DSI (25% SMC) values of six parameters suggested that the PC1 and PC2 explained 76.9% of the variance among all 10 genotypes (Figure 3). Photosynthetic rate and Tr showed similar and strong influences on the PC1 axis. Stomatal conductance (gs), and Tr were the most important photosynthesis parameters to the PCA result of the HU precise-comparison experiment because they provided the largest contribution to PC1 (Figure 3).
According to the PCA ranking value based on the DSI (25% SMC) data (Table 6), M. sinensis genotypes, PMS-007 and PMS-285, had relatively high ranking values than the other genotypes, suggesting that they were more tolerant to drought stress while M. sacchariflorus genotypes, JPN-2011-004 and UI11-00033, had relatively lower ranking values than the other genotypes and were found to be more sensitive to drought stress. It is noteworthy that M. sinensis genotype PMS-285 also had a higher PCA ranking than other genotypes in the BYU screening experiment, while M. sinensis genotype PMS-007 did not have a high PCA ranking in the BYU screening experiment (Table 5). In contrast, M. sacchariflorus genotypes, with the exception of genotype UI10-00008, appeared to be more sensitive to drought than M. sinensis genotypes in the HU precise-comparison experiment (Table 6), which was also observed in the BYU screening experiment (Table 5).

3.5. Drought Recovery Capacity of Miscanthus Genotypes of Post-Drought Recovery Experiment in BYU

Upon rewatering plants daily for 7 days after a 21-day dry-down treatment, the average soil water potential of all Miscanthus genotypes on day 7 of the BYU recovery experiment increased to 0.04 MPa, which was similar to that on day 0 of the BYU screening experiment (Table 4). This result suggests that the soil moisture level was high enough for plants to recover from drought (Table 4). Three M. sacchariflorus genotypes, JPN-2011-010, JM11-006, and JPN-2010-005, and two M. sinensis genotypes, UI10-00048 and UI10-00092, were nearly dead due to drought stress after a 21-day dry-down period in the BYU screening experiment (Table 4). Consequently, we were not able to characterize the recovery capacity of these genotypes.
On the other hand, the photosynthetic levels of M. sinensis genotypes PMS-014 and PMS-586 exhibited relatively quick recovery of Pn levels on day 7 in the BYU recovery experiment (Table 4). The Pn level of genotype PMS-014 on day 7 in the BYU recovery experiment was six times greater than its Pn performance on day 21 in the BYU screening experiment (Table 4). A similar pattern could be seen with genotype PMS-586, whose Pn level was four times greater than its Pn performance on day 21 in the BYU screening experiment (Table 4). In addition, these two genotypes had high recovery-PCA-ranking values, suggesting that they had the potential to recover from drought damage (Table 7). On the other hand, M. sinensis genotype PMS-285 had a relatively low recovery ranking value and was less capable of recovering from drought (Table 7), but it displayed higher Pn levels than other genotypes under low-water conditions in the BYU screening experiment (Table 4).

4. Discussion

4.1. Comparison of Different Drought Treatment Methods for Evaluation

Some plants species show different physiological responses under rapidly-imposed and slowly-imposed drought-stress conditions [27]. As we mentioned earlier, two drought-treatment methods, the dry-down technique, and the fixed-SMC technique, imposed different patterns of drought stress on plants in the experiments. The dry-down technique made a quick and sizable decrease in SMC over a short period of time, while the fixed-SMC technique-controlled SMC at a relatively constant level at a slower rate and for a longer period of time. Both drought-imposition techniques were used in previous research for studying drought tolerance in plants [4,5,28,29,30,31].
Drought-tolerant genotypes, which were selected through the PCA ranking analysis, also showed different degrees of drought tolerance in the HU precise-comparison and BYU experiments. For example, M. sinensis PMS-007 showed high drought tolerance performance in the HU precise-comparison, but only medium-level performance in the BYU screening experiment. Environmental factors and methods of drought imposition could have been factors that influenced the results of the HU precise-comparison and BYU screening experiments. However, it appears that environmental factors did not influence the results of the two experiments. According to our results, there was no significant difference (p > 0.5) in DSI values of Miscanthus genotypes in the HU and BYU experiments (Table 2), suggesting that there was no effect of environment between the HU and BYU experiments when both experiments used the dry-down technique to impose drought on Miscanthus plants. Therefore, the different evaluation results between the HU precise-comparison and BYU experiments were likely due to differences in how drought was imposed.
Decreases in SMC showed different patterns in the two drought-treatment methods used in this study. As reflected in changes in soil water potential values, drought stress conditions caused by the dry-down technique became more severe (i.e., soil water potential went below the permanent wilting point (−1.5 MPa) over a 14-day period (day 7 to day 21 in the BYU screening experiment) with a quick and sizable decrease in SMC (Table 4). In this case, plants had little time to adjust low-water conditions. On the other hand, with the fixed-SMC method, SMC changed slowly and could be controlled at a relatively constant level for plants to respond low-water availability. In the HU precise-comparison experiment, soil moisture controlled by an automated irrigation system took around 30 days to change from slight stress to severe stress, and at each stress level plants had 3–5 days to adjust the stress before measurement (Figure S2). With the fixed-SMC method, plants had enough time to exhibit their responses to drought, presuming that there was some physiological regulation in their cells. Based on the different patterns we observed in decreases in SMC (Table 4; Figure S2), the dry-down method is suitable for selecting drought-tolerant genotypes for cultivar or breeding development. However, the fixed-SMC method can aid researchers in clarifying drought-induced response of plants, such as changes in cell-level osmotic potential changing or toxic ROS scavenging regulation [32].
Under field conditions, drought can be defined as a condition where plants cannot get take up enough water from dry soil for normal physiological function over an extended period of time [33]. Large decreases in soil moisture over a short period of time during a dry-down are more similar to drought in the field, which leads plants to perform all steps of drought-caused physiological regulation in a short time [27]. This aspect of the dry-down method leads plants to respond to low-water availability as if they were subjected to field conditions. However, rapidly decreasing soil moisture makes it difficult to capture and characterize ephemeral physiological changes in plants [27]. On the other hand, the fixed-SMC method is controlled by a computer, which can regulate irrigation and thereby control SMC to maintain continuous drought conditions [12]. Therefore, plants generally have enough time in this method to physiologically respond to drought due to being subjected to constant, low-SMC conditions. In addition, physiological responses of plants to different soil-moisture conditions (e.g., well-watered, moderate, severe) with this approach seem more straightforward than in the dry-down method [34]. However, such constant soil-moisture conditions, even when water levels are fairly low, differ from drought in the field such that genotypes identified as drought tolerant through the fixed-SMC method may not perform well when grown in the field.

4.2. Characteristics of Drought Stress in Miscanthus spp.

In general, M. sinensis appears to have stronger drought tolerance than M. sacchariflorus (Table 5 and Table 6). Based on the PCA ranking results of the BYU screening experiment, four M. sacchariflorus genotypes (UI11-00031, JPN-2011-010, JPN-2010-005, and JM11-006) ranked relatively low in terms of drought-stress tolerance (Table 5). Similarly, based on the PCA ranking results of the HU precise-comparison experiment, two M. sacchariflorus genotypes, JPN-2011-004 and UI11-00033 ranked 9 and 10, suggesting they were sensitive to drought stress (Table 6). These results correspond to their native habitats. Miscanthus sinensis usually grows in dry, upland areas, while M. sacchariflorus occurs in mesic, lowland areas [35].
Miscanthus × giganteus, which is a triploid hybrid of tetraploid M. sacchariflorus and diploid M. sinensis, is considered as a potential high-yielding energy crop (29–38 Mg ha−1) [13]. However, M. × giganteus expresses sensitivity to drought and needs more irrigation than maize under commercial cultivation conditions [21]. Genes inherited from M. sacchariflorus possibly influence the drought sensitivity of M. × giganteus.
Based on the PCA ranking results of the HU precise-comparison and BYU screening experiments, M. sinensis genotype PMS-285 had higher photosynthetic performance under drought in both experiments, suggesting that it can be used as germplasm in breeding programs (Table 5 and Table 6). Miscanthus sinensis genotype PMS-007 showed relatively higher photosynthesis performance than other genotypes in the HU precise-comparison experiment (Table 6), but it exhibited only relatively moderate photosynthesis performance in the BYU screening experiment (Table 5). Considering the two drought-imposition methods used in our study, M. sinensis genotype PMS-007 appeared to maintain high photosynthesis performance for stable and consistent responses to low-water availability in the fixed-SMC method, but the photosynthesis performance was relatively lower at rapidly decreasing SMC conditions caused by the dry-down method (Table 4 and Table S5). Considering the different photosynthetic performance of M. sinensis genotypes PMS-285 and PMS-007 under dry-down and the fixed-SMC treatments, there should be some differences between the drought-response mechanisms of M. sinensis genotypes PMS-285 and PMS-007, which allowed for genotype PMS-285 to be tolerant of both rapidly and slowly decreasing soil-moisture availability, which needs to be clarified in the future. In addition, the genotypes, M. sacchariflorus UI10-00008 and M. sinensis UI10-00020, which had relatively narrow leaves and smaller leaf area than other genotypes, were more tolerant to drought than other genotypes in the HU precise-comparison experiment, with the exception of M. sinensis genotypes PMS-285 and PMS-007 (Table 6). A relatively small leaf area can lead to low transpiration levels, which could allow for plants to maintain photosynthetic rates at levels to sustain moderate growth despite having low soil-water availability [28,36].
The DSI φPSII of Miscanthus sinensis genotype PMS-285 in the slight-stress-level treatment in the HU precise-comparison (94.1) and BYU (75.9) experiments exceeded that of other genotypes in the study, except for M. sinensis genotype PMS007 and UI10-00088 in the BYU experiment (Table S2). On the other hand, the DSI Pn of M. sinensis genotype PMS-007 is relatively higher than other genotypes under slight stress levels in both the HU precise-comparison and BYU experiments (Table S3). The relatively high values of DSI φPSII of M. sinensis genotype PMS-285 and DSI Pn of M. sinensis genotype PMS-007 could help explain why these two genotypes showed stronger drought tolerance than other genotypes in this study. In addition, the DSI gs of M. sinensis genotype PMS-164 exceeded that of other genotypes in both experiments (Table S4).
Interestingly, the Miscanthus genotypes with strong drought-recovery capacity (PMS-014, PMS-586) did not exhibit high drought tolerance (Table 5 and Table 7). On the other hand, genotypes with high drought tolerance may not have sufficient drought-recovery capacity. Based on the recovery PCA ranking results (Table 7), M. sinensis genotypes PMS-014 and PMS-586 ranked relatively higher than other genotypes, but they only displayed moderate levels of tolerance under 14 days of being subjected to the drought treatment in the BYU screening experiment (Table 5).
Miscanthus sinensis genotype PMS-285 had a higher photosynthetic performance of Pn and DSI φPSII than other genotypes under drought in both the HU precise comparison and BYU screening experiments (Table 4 and Table S2). In addition, this genotype had a higher Pn value on day 21 of the BYU screening experiment than its Pn value on day 7 of the BYU recovery experiment (Table 4). In addition, M. sinensis genotype PMS-285 did not have a high recovery PCA ranking value (Table 7), which suggests it did not recover from drought stress after being rewatered. This is surprising given that it had a high PCA ranking value under slight drought stress in both the HU precise comparison and BYU screening experiments (Table 5 and Table 6).
Recovery capacity from drought is an important trait to help plants tide over from the effects of low SMC conditions [3]. Several plant species, whose photosynthetic machinery can often recover rapidly from drought stress, can absorb water when short-term rain events occur in the midst of a prolonged drought [3,7]. Lauenroth et al. (1987) reported that new root growth of Bouteloua gracilis, a warm-season perennial grass species, occurred nearly 40 h after being rewatered [7]. Such root growth has the capability of increasing water availability for plants. Another study, which focused on water relations of sugarcane (Saccharum officinarum L.), found that high WUE and deep root systems enable sugarcane to recover from drought damage [37]. Such traits may be a possible reason for the strong recovery performance of M. sinensis genotypes PMS-014 and PMS-586. These traits could be effective screening criteria for drought-tolerant genotypes of Miscanthus. The WUE and rooting depth were not measured in our experiments but should be focused on in future research.
Genetic clusters and ploidy levels may be factors that have considerable influence on drought tolerance in Miscanthus spp. [16]. Regarding the influence of genetic clusters on drought tolerance, genotypes in the M. sinensis ‘Yangtze-Qinling’ genetic clusters appear to have relatively stronger drought tolerance than other genetic clusters (Table 5 and Table 6). In addition, genotypes in the M. sinensis ‘Sichuan’ genetic cluster can quickly recover from drought damage after being re-watered (Table 7). Both M. sinensis genotypes, PMS-007 and PMS-285, which align with the M. sinensis ‘Yangtze-Qinling’ genetic cluster (Table 5 and Table 6), expressed relatively higher photosynthesis performance than other genotypes under stress in the HU precise comparison experiment (Table 6). In contrast, in the BYU screening experiment, M. sinensis genotypes PMS-014 and PMS-586, which are associated with the M. sinensis ‘Sichuan’ genetic cluster (Table 5), displayed low photosynthetic levels when subjected to drought (Table 5). However, both exhibited relatively high recovery of photosynthetic levels after re-irrigation in the BYU recovery experiment (Table 7).
For different ploidy-type accessions, M. sacchariflorus diploid genotype UI10-00008 (Table 6) showed much higher photosynthesis performance than two other M. sacchariflorus tetraploid genotypes, JPN-2011-004 and UI11-00033, in the HU precise-comparison experiment (Table 6). Miscanthus sacchariflorus UI10-00008 has, on average, a small leaf area with only 0.8 cm leaf width, while genotypes JPN-2011-004 and UI11-00033 have an average leaf width of 2 cm (Table 6). In the BYU screening experiment, three M. sacchariflorus tetraploid genotypes were dead after a dry-down period of 21 days, but M. sacchariflorus diploid genotype UI11-00031 survived despite prolonged exposure to severe drought stress (Table 4). In addition, M. sacchariflorus diploid genotype UI11-00031 showed considerable recovery of Pn on day 7 in the BYU recovery experiment (Table 4). Therefore, ploidy level may reflect how leaf area and transpiration rate of Miscanthus genotypes contribute to drought tolerance. Moreover, drought-tolerant diploid M. sacchariflorus genotypes could be used as breeding material to produce high-yielding M. × giganteus genotypes with strong drought tolerance. Using genetic clusters and ploidy levels for genotype evaluation will help to improve the efficiency of the selection and breeding of stress-tolerant crops.
Ornamental Miscanthus cultivars exhibited relatively higher drought tolerance than most wild-type accessions in both the HU precise-comparison and BYU screening experiments (Table 5 and Table 6). Although wild-type Miscanthus accessions usually express stronger stress tolerance to drought, disease, and insect pests than ornamental cultivars [38], we found that some cultivars (M. floridulus PI417947, M. sinensis UI10-00088, M. sinensis UI10-00092, and M. sacchariflorus UI10-00008) showed relatively higher drought tolerance than wild-type accessions (Table 5 and Table 6). Miscanthus sinensis cultivars can be found in gardens and yards throughout the U.S., Canada, and Europe [39]. For ornamental plants, drought tolerance ranks high as an important selection criteria because drought stress is commonly encountered in managed landscapes.
Further studies are needed to characterize drought-stress-response mechanisms in Miscanthus. Few information exists regarding the drought-stress physiology of Miscanthus [40,41,42]. Improvement of drought tolerance in Miscanthus spp. can enable them to survive when subjected to drought conditions caused by climate change. Such crops offer the opportunity to also generate biomass under low-soil-water conditions, which is important for developing Miscanthus as a sustainable energy crop.

Supplementary Materials

The following are available online at https://www.mdpi.com/article/10.3390/agriculture12010006/s1. Table S1: Detailed information of 29 Miscanthus genotypes used for the evaluation of low-water-adaptability capacity in Miscanthus spp., including entry number, species, origin location, and genetic groups background. Table S2: Least squares means of drought stress index (DSI) values of chlorophyll fluorescence (φPSII) of Miscanthus genotypes. Table S3: Least squares means of drought stress index (DSI) values of photosynthetic rate (Pn) of Miscanthus genotypes. Table S4: Least squares means of drought stress index (DSI) values of stomatal conductance (gs) of Miscanthus genotypes. Table S5: Photosynthetic rate (Pn) of each Miscanthus genotype under each soil water content level in a precise-comparison experiment at Hokkaido University, Sapporo, Japan. Figure S1: Simplified diagram showing various parts of the irrigation system. Figure S2: Average changes in soil moisture content controlled by the automated irrigation system in a precise-comparison experiment at Hokkaido University, Sapporo, Japan.

Author Contributions

Conceptualization, T.Y. and E.J.S.; methodology, T.-Y.W., T.N. and J.R.S.; data curation, T.-Y.W. and A.V.-M.; writing—original draft preparation, T.-Y.W.; writing—review and editing, J.R.S. and T.Y.; funding acquisition, T.Y. All authors have read and agreed to the published version of the manuscript.

Funding

This work was funded by Grants-in-Aid for Scientific Research (No. 17H04615 to T.Y.) from the Japanese Ministry of Education, Science, Sports and Culture.

Acknowledgments

The authors would like to thank the staff of the Field Science Center for Northern Biosphere of Hokkaido University and the Department of Plant and Wildlife Sciences of Brigham Young University for their kind support and cooperation during the study. All supports and assistance are sincerely appreciated.

Conflicts of Interest

The authors declare no conflict of interest.

References

  1. Morrow, W.R., III; Gopal, A.; Fitts, G.; Lewis, S.; Dale, L.; Masanet, E. Feedstock loss from drought is a major economic risk for biofuel producers. Biomass Bioenergy 2014, 69, 135–143. [Google Scholar] [CrossRef] [Green Version]
  2. Farooq, M.; Wahid, A.; Kobayashi, N.; Fujita, D.; Basra, S.M.A. Plant drought stress: Effects, mechanisms and management. Agron. Sustain. Dev. 2009, 29, 185–212. [Google Scholar] [CrossRef] [Green Version]
  3. Chen, D.; Wang, S.; Cao, B.; Cao, D.; Leng, G.; Li, H.; Deng, X. Genotypic variation in growth and physiological response to drought stress and re-watering reveals the critical role of recovery in drought adaptation in maize seedlings. Front. Plant Sci. 2016, 6, 1241. [Google Scholar] [CrossRef] [Green Version]
  4. Chen, Y.; Chen, F.; Liu, L.; Zhu, S. Physiological responses of Leucaena leucocephala seedlings to drought stress. Procedia Eng. 2012, 28, 110–116. [Google Scholar] [CrossRef] [Green Version]
  5. Liu, Y.; Zhang, X.; Tran, H.; Shan, L.; Kim, J.; Childs, K.; Ervin, E.H.; Frazier, T.; Zhao, B. Assessment of drought tolerance of 49 switchgrass (Panicum virgatum) genotypes using physiological and morphological parameters. Biotechnol. Biofuels 2015, 8, 152. [Google Scholar] [CrossRef] [Green Version]
  6. Trenberth, K.E.; Dai, A.; Schrier, G.; van der Jones, P.D.; Barichivich, J.; Briffa, K.R.; Sheffield, J. Global warming and changes in drought. Nat. Clim. Chang. 2014, 4, 17–22. [Google Scholar] [CrossRef]
  7. Lauenroth, W.K.; Sala, O.E.; Milchunas, D.G.; Lathrop, R.W. Root dynamics of Bouteloua gracilis during short-term recovery from drought. Funct. Ecol. 1987, 1, 117–124. [Google Scholar] [CrossRef]
  8. Upadhyaya, H.; Panda, S.K.; Dutta, B.K. CaCl2 improves post-drought recovery potential in Camellia sinensis (L) O. Kuntze. Plant Cell Rep. 2011, 30, 495–503. [Google Scholar] [CrossRef] [PubMed]
  9. Mittler, R.; Zilinskas, B.A. Regulation of pea cytosolic ascorbate peroxidase and other antioxidant enzymes during the progression of drought stress and following recovery from drought. Plant J. 1994, 5, 397–405. [Google Scholar] [CrossRef]
  10. Blackman, C.J.; Li, X.; Choat, B.; Rymer, P.D.; DeKauwe, M.G.; Duursma, R.A.; Tissue, D.A.; Medlyn, B.E. Desiccation time during drought is highly predictable across species of Eucalyptus from contrasting climates. New Phytol. 2019, 224, 632–643. [Google Scholar] [CrossRef] [PubMed] [Green Version]
  11. Bergsten, S.J.; Stewart, J.R. Measurement of the influence of low water availability on the productivity of Agave weberi cultivated under controlled irrigation. Can. J. Plant Sci. 2013, 94, 439–444. [Google Scholar] [CrossRef] [Green Version]
  12. Nemali, K.S.; van Iersel, M.W. An automated system for controlling drought stress and irrigation in potted plants. Sci. Hortic. 2006, 110, 292–297. [Google Scholar] [CrossRef]
  13. Heaton, E.A.; Dohleman, F.G.; Long, S.P. Meeting US biofuel goals with less land: The potential of Miscanthus. Glob. Chang. Biol. 2008, 14, 2000–2014. [Google Scholar] [CrossRef]
  14. Toma, Y.; Fernandez, F.G.; Nishuwaki, A.; Yamada, T.; Bollero, G.; Stewart, J.R. Aboveground plant biomass, carbon, and nitrogen dynamics before and after burning in a seminatural grassland of Miscanthus sinensis in Kumamoto, Japan. Glob. Chang. Biol. Bioenergy 2010, 2, 52–62. [Google Scholar] [CrossRef] [Green Version]
  15. Clark, L.V.; Brummer, J.E.; Głowacka, K.; Hall, M.C.; Heo, K.; Peng, J.; Yamada, T.; Yoo, J.H.; Yu, C.Y.; Zhao, H.; et al. A footprint of past climate change on the diversity and population structure of Miscanthus sinensis. Ann. Bot. 2014, 114, 97–107. [Google Scholar] [CrossRef] [Green Version]
  16. Clark, L.V.; Jin, X.; Petersen, K.K.; Anzoua, K.G.; Bagmet, L.; Chebukin, P.; Deuter, M.; Dzyubenko, E.; Dzyubenko, N.; Heo, K.; et al. Population structure of Miscanthus sacchariflorus reveals two major polyploidization events, tetraploid-mediated unidirectional introgression from diploid M. sinensis, and diversity centred around the Yellow Sea. Ann. Bot. 2019, 124, 731–748. [Google Scholar] [CrossRef]
  17. Heaton, E.; Voigt, T.; Long, S.P. A quantitative review comparing the yields of two candidate C4 perennial biomass crops in relation to nitrogen, temperature and water. Biomass Bioenergy 2004, 27, 21–30. [Google Scholar] [CrossRef]
  18. Mann, J.J.; Barney, J.N.; Kyser, G.B.; DiTomaso, J.M. Root system dynamics of Miscanthus × giganteus and Panicum virgatum in response to rainfed and irrigated conditions in California. Bioenergy Res. 2013, 6, 678–687. [Google Scholar] [CrossRef]
  19. Joo, E.; Hussain, M.Z.; Zeri, M.; Masters, M.D.; Miller, J.N.; Gomez-Casanovas, N.; Bernacchi, C.J. The influence of drought and heat stress on long-term carbon fluxes of bioenergy crops grown in the Midwestern USA. Plant Cell Environ. 2016, 39, 1928–1940. [Google Scholar] [CrossRef]
  20. Van der Weijde, T.; Huxley, L.M.; Hawkins, S.; Sembiring, E.H.; Farrar, K.; Dolstra, O.; Visser, R.G.F.; Trindade, L.M. Impact of drought stress on growth and quality of miscanthus for biofuel production. Glob. Chang. Biol. Bioenergy 2017, 9, 770–782. [Google Scholar] [CrossRef] [Green Version]
  21. Vanloocke, A.; Bernacchi, C.J.; Twine, T.E. The impacts of Miscanthus × giganteus production on the Midwest US hydrologic cycle. Glob. Chang. Biol. Bioenergy 2010, 2, 180–191. [Google Scholar] [CrossRef]
  22. Ings, J.; Mur, L.A.J.; Robson, P.R.H.; Bosch, M. Physiological and growth responses to water deficit in the bioenergy crop Miscanthus × giganteus. Front. Plant Sci. 2013, 4, 468. [Google Scholar] [CrossRef] [PubMed] [Green Version]
  23. Emerson, R.; Hoover, A.; Ray, A.; Lacey, J.; Cortez, M.; Payne, C.; Karlen, D.; Birrell, S.; Laird, D.; Kallenbach, R.; et al. Drought effects on composition and yield for corn stover, mixed grasses, and Miscanthus as bioenergy feedstocks. Biofuels 2014, 5, 275–291. [Google Scholar] [CrossRef] [Green Version]
  24. Kato, M.; Kobayashi, K.; Ogiso, E.; Yokoo, M. Photosynthesis and dry-matter production during ripening stage in a female-sterile line of rice. Plant Prod. Sci. 2004, 7, 184–188. [Google Scholar] [CrossRef]
  25. Takai, T.; Kondo, M.; Yano, M.; Yamamoto, T. A quantitative trait locus for chlorophyll content and its association with leaf photosynthesis in rice. Rice 2010, 3, 172–180. [Google Scholar] [CrossRef] [Green Version]
  26. Namias, J. Nature and possible causes of the northeastern United States drought during 1962–1965. Mon. Weather. Rev. 1966, 94, 543–554. [Google Scholar] [CrossRef]
  27. Cornic, G.; Papgeorgiou, I.; Louason, G. Effect of a rapid and a slow drought cycle followed by rehydration on stomatal and non-stomatal components of leaf photosynthesis in Phaseolus vulgaris L. J. Plant Physiol. 1987, 126, 309–318. [Google Scholar] [CrossRef]
  28. Ganjeali, A.; Porsa, H.; Bagheri, A. Assessment of Iranian chickpea (Cicer arietinum L.) germplasms for drought tolerance. Agric. Water Manag. 2011, 98, 1477–1484. [Google Scholar] [CrossRef]
  29. Li, C.-N.; Yang, L.-T.; Srivastava, M.K.; Li, Y.-R. Foliar application of abscisic acid improves drought tolerance of sugarcane plant under severe water stress. Int. J. Agric. Innov. Res. 2014, 3, 101–107. [Google Scholar]
  30. Nazari, L.; Pakniyat, H. Assessment of drought tolerance in barley genotypes. J. Appl. Sci. 2010, 10, 151–156. [Google Scholar] [CrossRef]
  31. Percival, G.C.; Keary, I.P.; Al-Habsi, S. An assessment of the drought tolerance of Fraxinus genotypes for urban landscape plantings. Urban For. Urban Green. 2006, 5, 17–27. [Google Scholar] [CrossRef]
  32. Rohollahi, I.; Khoshkholghsima, N.; Nagano, H.; Hoshino, Y.; Yamada, T. Respiratory burst oxidase-D Expression and Biochemical Responses in Festuca arundinacea under Drought Stress. Crop Sci. 2018, 58, 435–442. [Google Scholar] [CrossRef] [Green Version]
  33. Dracup, J.A.; Lee, K.S.; Paulson, E.G. On the Definition of Droughts. Water Resour. Res. 1980, 16, 297–302. [Google Scholar] [CrossRef]
  34. Kim, J.; van Iersel, M.W. Slowly developing drought stress increases photosynthetic acclimation of Catharanthus roseus. Physiol. Plant. 2011, 143, 166–177. [Google Scholar] [CrossRef]
  35. Tamura, K.; Uwatoko, N.; Yamashita, H.; Fujimori, M.; Akiyama, Y.; Shoji, A.; Sanada, Y.; Okumura, K.; Gau, M. Discovery of natural interspecific hybrids between Miscanthus sacchariflorus and Miscanthus sinensis in southern Japan: Morphological characterization, genetic structure, and origin. Bioenergy Res. 2016, 9, 315–325. [Google Scholar] [CrossRef]
  36. Smith, W.K. Temperatures of desert plants: Another perspective on the adaptability of leaf size. Science 1978, 201, 614–616. [Google Scholar] [CrossRef]
  37. Jangpromma, N.; Thammasirirak, S.; Jaisil, P.; Songsri, P. Effects of drought and recovery from drought stress on above ground and root growth, and water use efficiency in sugarcane (Saccharum officinarum L.). Aust. J. Crop Sci. 2012, 6, 1298–1304. [Google Scholar]
  38. Dougherty, R.F.; Quinn, L.D.; Voigt, T.B.; Barney, J.N. Response of naturalized and ornamental biotypes of Miscanthus sinensis to soil-moisture and shade stress. Northeast. Nat. 2015, 22, 372–386. [Google Scholar] [CrossRef]
  39. Linde-Laursen, I. Cytogenetic analysis of Miscanthus ‘Giganteus’, an interspecific hybrid. Hereditas 1993, 119, 297–300. [Google Scholar] [CrossRef]
  40. Alvarez, E.; Scheiber, S.M.; Beeson, R.C.; Sandrock, D.R. Drought tolerance responses of purple lovegrass and ‘Adagio’ maiden grass. HortScience 2007, 42, 1695–1699. [Google Scholar] [CrossRef] [Green Version]
  41. Chen, M.; Hou, X.; Fan, X.; Wu, J.; Pan, Y. Drought tolerance analysis of Miscanthus sinensis ‘Gracillimu’ seedlings. Acta Prataculturae Sin. 2013, 22, 184–189. [Google Scholar] [CrossRef]
  42. Stavridou, E.; Webster, R.J.; Robson, P.R.H. Novel Miscanthus genotypes selected for different drought tolerance phenotypes show enhanced tolerance across combinations of salinity and drought treatments. Ann. Bot. 2019, 124, 653–674. [Google Scholar] [CrossRef] [PubMed]
Figure 1. Scatter plot of coefficient of variation and drought stress index of the Soil Plant Analysis Development (SPAD) Chlorophyll meter value in screening experiment at Hokkaido University, Sapporo, Japan of drought-stress tolerance. Scatter points encircled by solid circles represent resistant genotypes. Scatter points encircled by dotted circles represent susceptible genotypes.
Agriculture 12 00006 g001
Figure 2. Principal component analysis (PCA) bi-plot of drought stress index (DSI) of six physiological traits (photosynthetic rate (Pn), stomatal conductance (gs), transpiration rate (Tr), intercellular CO2 concentration (Ci), the Soil Plant Analysis Development (SPAD) Chlorophyll meter value, and chlorophyll fluorescence (PSII)) under drought over a 14-day period in screening experiment at Brigham Young University, Provo, UT, USA. Arrows represent physiological traits with various lengths, which were based on the impact of each trait on the separation of genotypes.
Agriculture 12 00006 g002
Figure 3. Principal component analysis (PCA) bi-plot of the drought stress index (DSI) of six physiological traits: photosynthetic rate (Pn), stomatal conductance (gs), transpiration rate (Tr), intercellular CO2 concentration (Ci), the Soil Plant Analysis Development (SPAD) Chlorophyll meter value, chlorophyll fluorescence (PSII) under 25% soil moisture in a precise-comparison experiment at Hokkaido University, Sapporo, Japan. Arrows represent physiological traits with various lengths, which were based on the impact of each trait on the separation of genotypes.
Agriculture 12 00006 g003
Table 1. List of Miscanthus genotypes included in screening experiments at Hokkaido University (HU), Sapporo, Japan and Brigham Young University (BYU), Provo, Utah, USA.
HU Screening Experiment (2017, 2018)BYU Screening Experiment (2019)
SpeciesAccessionTypeSpeciesAccessionType
M. sacchariflorusJM11-006WildM. sacchariflorusJM11-006Wild
M. sacchariflorusJPN-2011-004WildM. sacchariflorusJPN-2010-005Wild
M. sacchariflorusJPN-2011-006WildM. sacchariflorusJPN-2011-010Wild
M. sacchariflorusJPN-2011-010WildM. sacchariflorusUI11-00031Wild
M. sacchariflorusPMS-076WildM. sinensisPMS-007Wild
M. sacchariflorusRU2012-056.1WD (4x)WildM. sinensisPMS-014Wild
M. sacchariflorusRU2012-141WildM. sinensisPMS-164Wild
M. sacchariflorusRU2012-169WildM. sinensisPMS-285Wild
M. sacchariflorusRU2012-183WildM. sinensisPMS-347Wild
M. sacchariflorusUI10-00008CultivarM. sinensisPMS-586Wild
M. sacchariflorusUI11-00033WildM. sinensisUI10-00048Cultivar
M. sinensisPMS-164WildM. sinensisUI10-00088Cultivar
M. sinensisPMS-285WildM. sinensisUI10-00092Wild
M. sinensisPMS-347WildM. floridulusPI417947Wild
M. sinensisPMS-7Wild
M. sinensis var. condensatusUI10-00015Wild
M. sinensisUI10-00020Wild
M. sinensisUI10-00024Cultivar
M. sinensisUI10-00053Cultivar
M. sinensisUI10-00080Cultivar
M. sinensisUI10-00097Cultivar
M. sinensisUI10-00100Cultivar
M. floridulusPI417947Wild
Table 2. Analysis of Variance (ANOVA) result of six Miscanthus genotypes (JPN-2011-010, PMS-7, PMS-164, PMS-285, PMS-347, PI417947) between Hokkaido University screening experiment and Brigham Young University screening experiment using drought stress index of 21 days of SPAD value.
ANOVA
Source of variationSSdfMSFp-value
Between Groups0.006910.00690.19910.6650
Within Groups0.3453100.0345
Total0.352211
Table 3. Analysis of Variance (ANOVA) result of four Miscanthus genotypes (PMS-7, PMS-164, PMS-285, PMS-347) based on their drought stress index of four photosynthetic parameters (photosynthetic rate, stomatal conductance, transpiration rate, and chlorophyll fluorescence) under slight drought stress of Hokkaido University (HU) precise-comparison and Brigham Young University (BYU) screening experiments.
ANOVA
Source of variationSSdfMSFp-value
Between Groups3.286613.286618.30310.0002
Within Groups5.3870300.1796
Total8.673631
Slight drought stress was set as 25% volumetric water content in soil of HU experiment and soil water potential as −2.6 MPa in BYU experiment.
Table 4. Photosynthetic rate (Pn) of each Miscanthus genotype under each soil water potential in a screening experiment and a post-drought recovery experiment at Brigham Young University, Provo, Utah, USA.
Day 0Day 7Day 14Day 21Day 7 after Re-Watered
Soil Water Potential (mPa)−0.096−0.14−2.6025−10.250.04
SpeciesAccessionPn (μmol CO2 m−2 s−1)
M. sacchariflorusJM11-00611.28110.3552.310NANA
M. sacchariflorusJPN-2010-0057.6739.8992.744NANA
M. sacchariflorusJPN-2011-0108.0878.9303.927NANA
M. sacchariflorusUI11-0003112.04412.2927.7075.3728.145
M. floridulusPI4179473.9615.5953.1923.0062.774
M. sinensisPMS-0076.2688.0065.8243.4883.367
M. sinensisPMS-01410.72412.4366.3941.65511.899
M. sinensisPMS-1646.29411.9623.1077.3937.330
M. sinensisPMS-2857.6138.3646.8106.4845.121
M. sinensisPMS-3478.62410.4112.9191.8865.144
M. sinensisPMS-5865.1489.8322.0511.4386.569
M. sinensisUI10-000485.03415.1360.777NANA
M. sinensisUI10-000884.4185.0814.3121.1603.275
M. sinensisUI10-000925.33413.3355.049NANA
Table 5. Principal components analysis (PCA) ranking values based on the drought stress index (Day 14) and the rank of drought-tolerance capacity of fourteen Miscanthus genotypes under slight drought stress in a screening experiment at Brigham Young University (BYU), Provo, Utah, USA.
SpeciesAccessionOriginGenetic Clusters §PC1PC2PC3Ranking ValueRank
M. sinensisPMS-285ChinaYangtze-Qinling Msi2.2033−0.31010.46161.26471
M. floridulusPI417947CultivarSE China Msi1.56100.68480.19831.05432
M. sinensisUI10-00088CultivarC Japan Msi2.2217−1.07980.01101.05213
M. sinensisUI10-00092CultivarC Japan Msi1.8232−0.45880.41441.01174
M. sinensisPMS-007ChinaYangtze-Qinling Msi1.7714−0.83790.89030.98255
M. sinensisPMS-347ChinaSE China Msi−0.35212.50661.39180.51406
M. sinensisPMS-164ChinaYangtze-Qinling Msi0.6587−0.1539−1.82840.05607
M. sinensisPMS-586ChinaSichuan Msi−0.64861.75570.0789−0.00988
M. sacchariflorusUI11-00031ChinaYangtze diploids (ssp. lutarioriparius) Msa−0.2352−0.1630−0.0439−0.17299
M. sinensisPMS-014ChinaSichuan Msi−0.3133−0.6493−0.3376−0.359610
M. sacchariflorusJPN-2011-010JapanN Japan 4x Msa−0.91080.0087−0.5782−0.607511
M. sacchariflorusJPN-2010-005JapanN Japan 4x Msa−1.66860.1401−1.2992−1.126212
M. sacchariflorusJM11-006JapanS Japan 4x Msa−1.99280.2420−0.9925−1.242213
M. sinensisUI10-00048CultivarS Japan Msi−4.1179−1.68501.6335−2.417414
PCA ranking value was derived via calculation of first, second, and third principal components (PC1, PC2, and PC3). Slight drought stress was set as soil water potential as −2.6 MPa in the BYU experiment. § According to Clark et al. (2014) and Clark et al. (2019).
Table 6. Principal components analysis (PCA) ranking values based on the drought stress index (25% soil moisture content) and the rank of drought-tolerance capacity of ten Miscanthus genotypes under slight drought stress in a precise comparison experiment of a precise comparison experiment at Hokkaido University (HU), Sapporo, Japan.
SpeciesAccessionOriginGenetic Clusters §Leaf Width (cm)Leaf Length (cm)PC1PC2PC3Ranking ValueRank
M. sinensisPMS-007ChinaYangtze-Qinling Msi2.0600.713.03−0.571.2321
M. sinensisPMS-285ChinaYangtze-Qinling Msi1.1560.931.020.040.7492
M. sacchariflorusUI10-00008CultivarNEChina/Korea/Russia diploids Msa0.8442.65−1.900.550.6183
M. sinensisUI10-00020CultivarS Japan Msi0.4180.89−0.090.680.4504
M. sinensisPMS-164ChinaYangtze-Qinling Msi1.1251.29−0.58−0.360.3335
M. sinensisUI10-00024CultivarS Japan Msi0.627−0.400.900.470.1786
M. sinensisPMS-347ChinaSE China Msi1.848−0.04−0.76−0.52−0.3337
M. sinensis var. condensatusUI10-00015CultivarC Japan Msi1.640−2.270.341.39−0.7128
M. sacchariflorusJPN-2011-004JapanS Japan 4x Msa1.855−1.35−0.79−1.80−1.0859
M. sacchariflorusUI11-00033JapanS Japan 4x Msa2.061−2.41−1.160.14−1.42510
PCA ranking value was derived via calculation of first, second, and third principal components (PC1, PC2, and PC3). Slight drought stress was set as 25% volumetric water content in the media of the HU experiment. § According to Clark et al. (2014) and Clark et al. (2019).
Table 7. Recovery principal components analysis (PCA) ranking values based on the recovery drought stress index and the rank of recovery capacity from drought stress of fourteen Miscanthus genotypes in post-drought recovery experiment at Brigham Young University, Provo, Utah, USA.
SpeciesAccessionOriginGenetic Clusters PC1PC2PC3Ranking ValueRank
M. sinensisPMS-014ChinaSichuan Msi4.3565−1.49540.23792.89701
M. sinensisPMS-586ChinaSichuan Msi3.39390.43810.54612.56892
M. sinensisPMS-347ChinaSE China Msi2.74561.2399−1.05822.14843
M. sinensisUI10-00088CultivarC Japan Msi1.2360−0.68330.09900.77694
M. sacchariflorusUI11-00031ChinaYangtze diploids (ssp. lutarioriparius) Msa−0.29810.80910.6621−0.02945
M. floridulusPI417947CultivarSE China Msi−0.95722.36070.7977−0.21736
M. sinensisPMS-164ChinaYangtze-Qinling Msi−0.57580.7901−0.0801−0.27867
M. sinensisPMS-007ChinaYangtze-Qinling Msi−0.5925−0.3455−0.4199−0.51678
M. sinensisPMS-285ChinaYangtze-Qinling Msi−0.9592−0.80560.0559−0.83699
PCA ranking value was derived via calculation of first, second, and third principal components (PC1, PC2, and PC3). According to Clark et al. (2014) and Clark et al. (2019).
Publisher’s Note: MDPI stays neutral with regard to jurisdictional claims in published maps and institutional affiliations.

