Article

Transcriptome Integrated with Metabolome Reveals the Molecular Mechanism of Phytoplasma Cherry Phyllody Disease on Stiff Fruit in Chinese Cherry (Cerasus pseudocerasus L.)

1
College of Horticulture and Landscape Architecture, Southwest University, Chongqing 400715, China
2
Key Laboratory of Horticulture Science for Southern Mountainous Regions, Ministry of Education, Chongqing 400715, China
3
Southwest University Library, Southwest University, Chongqing 400715, China
*
Author to whom correspondence should be addressed.
Agriculture 2022, 12(1), 12; https://doi.org/10.3390/agriculture12010012
Submission received: 15 November 2021 / Revised: 17 December 2021 / Accepted: 20 December 2021 / Published: 23 December 2021
(This article belongs to the Special Issue Biotic and Abiotic Stresses in Crop Plants)

Abstract

:
Phytoplasma-infected Chinese cherry (Cerasus pseudocerasus L.) exhibits symptoms of phyllody and stiff fruit. To reveal the molecular mechanism of stiff fruit, the current study integrated transcriptome with metabolome. Results showed that the differentially expressed genes and the differentially accumulated metabolites were related to a high proportion of two aspects: pathogen resistance and signaling or regulatory functions, and the molecular mechanism of stiff fruit that were majorly induced by plant biotic stress response via phytohormones signal transduction, especially signal pathways of salicylic acid, auxin, and abscisic acid. Notably, there was a large overlap between phytoplasma stress response and drought stress response genes. Phytohormone content displayed significant difference that abscisic acid and salicylic acid content of phytoplasma-infected fruit were higher than that of healthy fruit, whereas zeatin, jasmonic acid, and IAA showed the opposite results. In addition, the expression of key candidate genes, including IAA4, IAA9, IAA14, IAA31, ARF5, ARF9, GH3.1, GH3.17, SAUR20, SAUR32, SAUR40, PR1a, PRB1, TGA10, SnRK2.3, and AHK2, was responsible for cherry stiff fruit. In conclusion, the current study contributed a foundation for understanding the molecular mechanism of cherry phyllody disease on stiff fruit, a better understanding of fruit development, and found the potential candidate genes involved in cherry stiff fruit, which could be used for further research in associated fields.

1. Introduction

Chinese cherry (Cerasus pseudocerasus L.) is one of the four major cherry cultivars in China. With special flavor, this species is widely grown in the mountain area of south China and has important economic value for achieving targeted poverty alleviation. In 1971, cherry phytoplasma diseases were first reported by Granett and Gilme as the symptoms of cherry X disease [1]. The subgroup 16SrV-B of sweet cherry virescence disease and the subgroup 16SrI-B phytoplasma of sweet cherry fasciation disease have been reported in recent years [2,3,4]. However, cherry phytoplasma diseases are rarely reported in China.
From 2016 to 2020, a large-scale (over 50%) phytoplasma disease incidence was discovered in the Chinese cherry planting area in Chongqing, China. The previous study identified that Chinese cherry was infected by 16SrV-B subgroup phytoplasma and named cherry phyllody disease (ChP) [5]. The symptoms include plant decline, clustered leaves, virescence, phyllody, and stiff fruit. The cherry phytoplasma disease with complicated symptoms: stiff fruit show small size and deformity, stay in young fruit period, and drop within a week before fruit expansion stage (Figure 1).
Phytoplasmas are obligatory parasitic bacteria that have no cell wall, are hard to be cultured, exist in the phloem sieve cells of plants, and can cause phyllody, witches’ broom, clusters, and virescence [6]. Its transmission mainly relies on Hemiptera insect, and it can also be transmitted by Cuscuta chinensis and grafting. Previous studies of phytoplasma diseases mainly focus on the isolation, detection, and identification of phytoplasma effectors. Three well-known phytoplasma effectors are TENGU, SAP11, and SAP54. SAP54 induces the development of leaf-like flowers, and SAP11 induces stem proliferation and alters leaf development, while TENGU induces witches’ broom, dwarfism, and flower sterility in plants [7,8,9]. Recent studies found more Phytoplasma effectors, such as SAP05 from Arabidopsis of Aster Yellows phytoplasma strain Witches’ Broom (AY-WB) [10], SAP11CaPM from apple proliferation phytoplasma in the 16SrX-A subgroup [11], SWP1 from wheat blue dwarf phytoplasma in the 16SrI-C subgroup [12], and SJP1 and SJP2 from jujube witches’ broom in two 16SrV-B group [13].
Molecular mechanisms of plants resistant pathogen including phytoplasma almost are through the regulation of non-expressor of pathogenesis-related genes 1(NPR1) by salicylic acid (SA)-mediated systemic acquired resistance (SAR) [14]. Jasmonic acid (JA) and ethylene are considered the major defense phytohormones in abiotic and biotic stress response, while auxin, abscisic acid (ABA), cytokinin (CTK), and gibberellins (GAs) are also deemed to be involved in plant immunity. The regulation of plant pathogen immunity is quite complicated process, through an intricate signaling network. The stiff fruit caused by cherry phytoplasma disease is involved in the fruit development process regulated by the phytohormone network, which makes things more complex.
Previous studies have documented in detail that Aux/IAA (Auxin/indole acetic acid) genes, ARF (auxin response factor) transcription factors, GH3 (Gretchen Hagen 3) genes, and SAURs (small auxin up RNAs), many of which are induced by auxin, take part in nearly all stages of plant development and regulate a series of essential activities [15,16,17]. These genes have a common auxin response element, and their promoter regions contain a cis-acting element (TGTCTC) [18]. The interaction network of these genes is complex; for example, 70% of ARFs can interact with Aux/IAA factors through the integration of co-expression profiles and protein–protein interaction data [19]. Aux/IAA proteins are a kind of short-lived nuclear protein, encoded by primary auxin response genes [20]. SAURs are the largest family of early auxin response genes with regulation of a huge series of cellular, physiological, and developmental processes [17].
Although previous studies had highlighted the pathogenesis of phytoplasma diseases in many crop species, the release characteristics of stiff fruit under cherry phyllody disease phytoplasma infection need more study in Chinese cherry. By integrating transcriptomics with metabolomics, this study focused on the molecular mechanism and revealed a complex signal network of stiff fruit during early cherry fruit development under phytoplasma infection.

2. Materials and Methods

2.1. Sample Collection

Here, 5-year-old Chinese cherry trees were selected to be samples, which grew with rainfed water in Qijiang District, Chongqing (the average annual temperature is 18.8 °C, with an average precipitation of 1070 mm). The fruit samples were collected in the 2nd in week of March 2021 from three ChP-infected trees (Fr3, 106.660059° N, 28.930975° E, soil pH 6.8) within a range of 0.1 km and three healthy trees (Ckfr, 106.659721° N, 28.930932° E, soil pH 6.8) within a range of 0.1 km; to satisfy basic biological replicates, the Fr3 group was 1 km away from the Ckfr group. The collected fruit samples were immediately frozen in liquid nitrogen after being collected from trees and were stored at −80 °C until further experiment.

2.2. Total RNA Extraction, Expression Analysis of Genes with RNA-Seq

Extraction of total RNA was performed using the RNA plant Plus Reagent (Tiangen, China, https://www.tiangen.com/asset/imsupload/up0031254001467350989.pdf, accessed on 10 November 2021). RNA purity was assessed spectrophotometrically using the model NC2000 Nanodrop (ThermoFisher Scientific, Waltham, MA, USA). Concentrations of the RNA preparations were assessed using the Qubit RNA Assay Kit (ThermoFisher Scientific, Waltham, MA USA) with the model NC2000 Nanodrop (ThermoFisher Scientific, Waltham, MA, USA). RNA degradation and contamination were firstly examined on a 1% agarose gel (Biowest, France) [2]. Further assessment of RNA integrity was performed using the model 2100 Bioanalyzer system (Agilent Technologies, Santa Clara, CA, USA) with the RNA 6000 Nano Kit (model 5067-1511, Agilent Technologies, Santa Clara, CA, USA).
Generation of RNAseq libraries used 1.5 μg RNA samples with the NEBNext Ultra RNA Library Prep Kit for Illumina (NEB, Ipswich, MA, USA, https://www.neb.com/products/e7770-nebnext-ultra-ii-rna-library-prep-kit-for-illumina, accessed on 10 November 2021). After quality inspection of the library by model 2100 Bioanalyzer (Agilent Technologies, Santa Clara, CA, USA), the prepared libraries were sequenced on an Illumina NextSeq 500 platform for generation of paired-end reads. Construction of RNA-seq library construction and Illumina sequencing procedures were performed at Personal Biotechnology Co., Ltd. (Shanghai, China, http://www.personalbio.cn/, accessed on 10 November 2021).
Raw data were removed, along with reads containing adapters, reads containing poly-N, and low-quality reads, to obtain clean reads. Clean reads were used for calculation of the Q20, Q30, guanine, or cytosine content and sequence duplication level. The sequenced left files (read1 files) from all RNA-seq libraries were pooled into a single left fq file; in the same way, all right files (read2 files) were pooled into a single right fq file. The filtered reads were compared to the reference genome DBcherry v1.0 (https://www.rosaceae.org/species/prunus_avium/genome_v1.0.a1, accessed on 10 November 2021) using Hisat2 (http://ccb.jhu.edu/software/hisat2/index.shtml, accessed on 10 November 2021) software. Transcriptome assembly was accomplished based on the left fq and right fq files using software Trinity (Dublin, Ireland). All assembly parameters were set to the software default values. Annotation of gene function was based on six publicly available databases, including Nr (NCBI non-redundant protein sequences), EC (enzyme commission), GDR (genome database for rosaceae), Swiss-Prot (a manually annotated and reviewed protein sequence database), KEGG (Kyoto Encyclopedia of Genes and Genomes Ortholog database), and GO (gene ontology).
Gene expression levels were estimated by expectation-maximization (RSEM) before GO enrichment or KEGG enrichment. the gene ontology analysis tool was used for GO enrichment analysis of the differentially expressed genes (DEGs). According to the GO enrichment analysis results of DEGs, GO classification was carried out according to molecular function (MF), biological process (BP), and cell component (CC), and the top 10 GO terms were selected in each GO classification with the least p-value. The top 20 GO terms of all GO classification were selected with the least false discovery rate (FDR) value according to Rich factor, FDR, and the content of this GO term. The statistical enrichment of DEGs in KEGG pathways were evaluated using KEGG orthology-based annotation system (KOBAS) software (Beijing, China). According to the results of KEGG enrichment, the degree of enrichment was measured by Rich factor, FDR value, and the number of genes enriched in this pathway. The top 20 KEGG pathways were selected with the most significant enrichment.

2.3. Metabolome Analysis

2.3.1. Metabolites Extraction

The samples were freeze-dried (model FreeZone 2.5 Liter, LABCONCO, Waltham, MA, USA) and crushed by a mixer mill (model A11, IKA, Darmstadt, Germany) at 60 Hz for 1 min. Then, 50 mg aliquot of individual samples were transferred to an Eppendorf tube after precise weighing, following addition of 1 mL of pre-cooled at −40 °C extract solution (containing internal standard, the proportion of methanol and pure water is 3:1). After vortex (model 88882010, ThermoFisher Scientific, Waltham, MA, USA) at 60 Hz for 30 s, the samples were homogenized at 40 Hz for 4 min and sonicated in an ice-water bath (model DT 1028 F, WIGGENS, Darmstadt, Germany) for 5 min. The cycle of homogenization and sonication was repeated for three times. The extracting solution was put on a constant temperature shaker over night at 4 °C before centrifugation at 12,000 rpm for 15 min at 4 °C. The supernatant liquid was carefully filtered through a 0.22 μm microporous membrane (BKMAM, China), and then the resulting supernatant liquid was diluted 5 times with mixture solution (containing internal standard, the proportion of methanol and pure water is 3:1) and vortexed at 60 Hz for 30 s. Then, 30 μL of sample from each vial were used as QC samples, which were stored at −80 °C before the ultra-performance liquid chromatography–mass spectroscopy (UPLC-MS, UPLC: model ExionLC AD, AB Sciex Technologies, Umeå, Sweden; MS: model QTrap 6500+, AB Sciex Technologies, Umeå, Sweden) analysis [21].

2.3.2. UPLC-MS Examination

An EXIONLC UPLC system (AB Sciex Technologies, Umeå, Sweden) was chosen for separation; the column temperature was set at 40 °C, the mobile phase A was pure water containing 0.1% formic acid, and the mobile phase B was acetonitrile. The auto-sampler temperature was set at 4 °C, and the injection volume was 2 μL. A QTrap 6500+ MS was applied for assay development, and ion source parameters were set as typical values: IonSpray voltage: +5500/−4500 V, temperature: 400 °C, curtain gas: 35 psi, ion source gas 1:60 psi, 2:60 psi, DP: ±100 V. The primary and secondary MS data were qualitatively assessed by searching the internal apparatus database and using a self-compiled database PMDB (PANOMICX Biomedical and Technology Co., Ltd. Suzhou, China, http://www.bionovogene.com/, accessed on 10 November 2021).

2.3.3. Metabolomics Analysis

An internal control was used to normalize metabolomics data and the data subjected to principal component analysis (PCA) using SIMCA-Q 17.0.1 (Sartorius, Germany, https://www.sartorius.com/download/1014254/simca-q-17-0-1-64-bit-en-b-00269-sartorius-zip-data.zip, accessed on 10 November 2021). In addition, the differential metabolites were identified as responsive biomarkers for determining the pattern of metabolic regulation. These metabolites were selected based on a combination of a statistically significant threshold of VIP (variable influence on projection) values obtained from the OPLS-DA model (orthogonal partial least squares’ discriminant analysis) and the p-value from a two-tailed Student’s t-test on the normalized peak areas. The names and the change times of metabolites were input into the genes cloud tool personal (Biotechnology Co., Ltd., Shanghai, China) metabolic pathways analysis. The metabolic information was mapped to the KEGG database to identify enriched KEGG pathways.

2.3.4. Quantification of Phytohormones

First, 50 mg of freeze-dried fruit samples of phytoplasma-infected cherry trees and healthy cherry trees were ground with liquid nitrogen into powder. After being put into 5 mL of isopropanol/hydrochloric acid buffer and shaken at 4 °C for 30 min, they were added to 10 mL dichloromethane and shaken at 4 °C for 30 min. The current study took the lower organic phase after 13,000 rpm centrifugation for them at 4 °C for 5 min and then dried the organic phase with nitrogen in dark condition. After that, 250 μL of them was used to dissolve in methanol (contained 0.1% formic acid), and they were finally detected by UPLC-MS [21].

2.4. cDNA Synthesis, and Quantitative Real-Time PCR

Samples of phytoplasma-infected fruit and healthy fruit were selected for qRT-PCR analysis. Total RNA extraction was same as described above. Reverse transcription was implemented with SuperScript IV VILO Master Mix (ThermoFisher Scientific, Waltham, MA, USA), and β-actin was used as the qPCR internal control. The selected genes and gene-specific primers used for qPCR were listed in Table S1. Gene expression was relatively quantified using the ∆∆Ct method [22]. Three biological replicates were used for each treatment, and each experiment was performed twice times. The means standard errors (SEs) were presented using ORIGIN 8.6 (https://www.originlab.com/index.aspx?go=Support&pid=1838, accessed on 10 November 2021).

3. Results

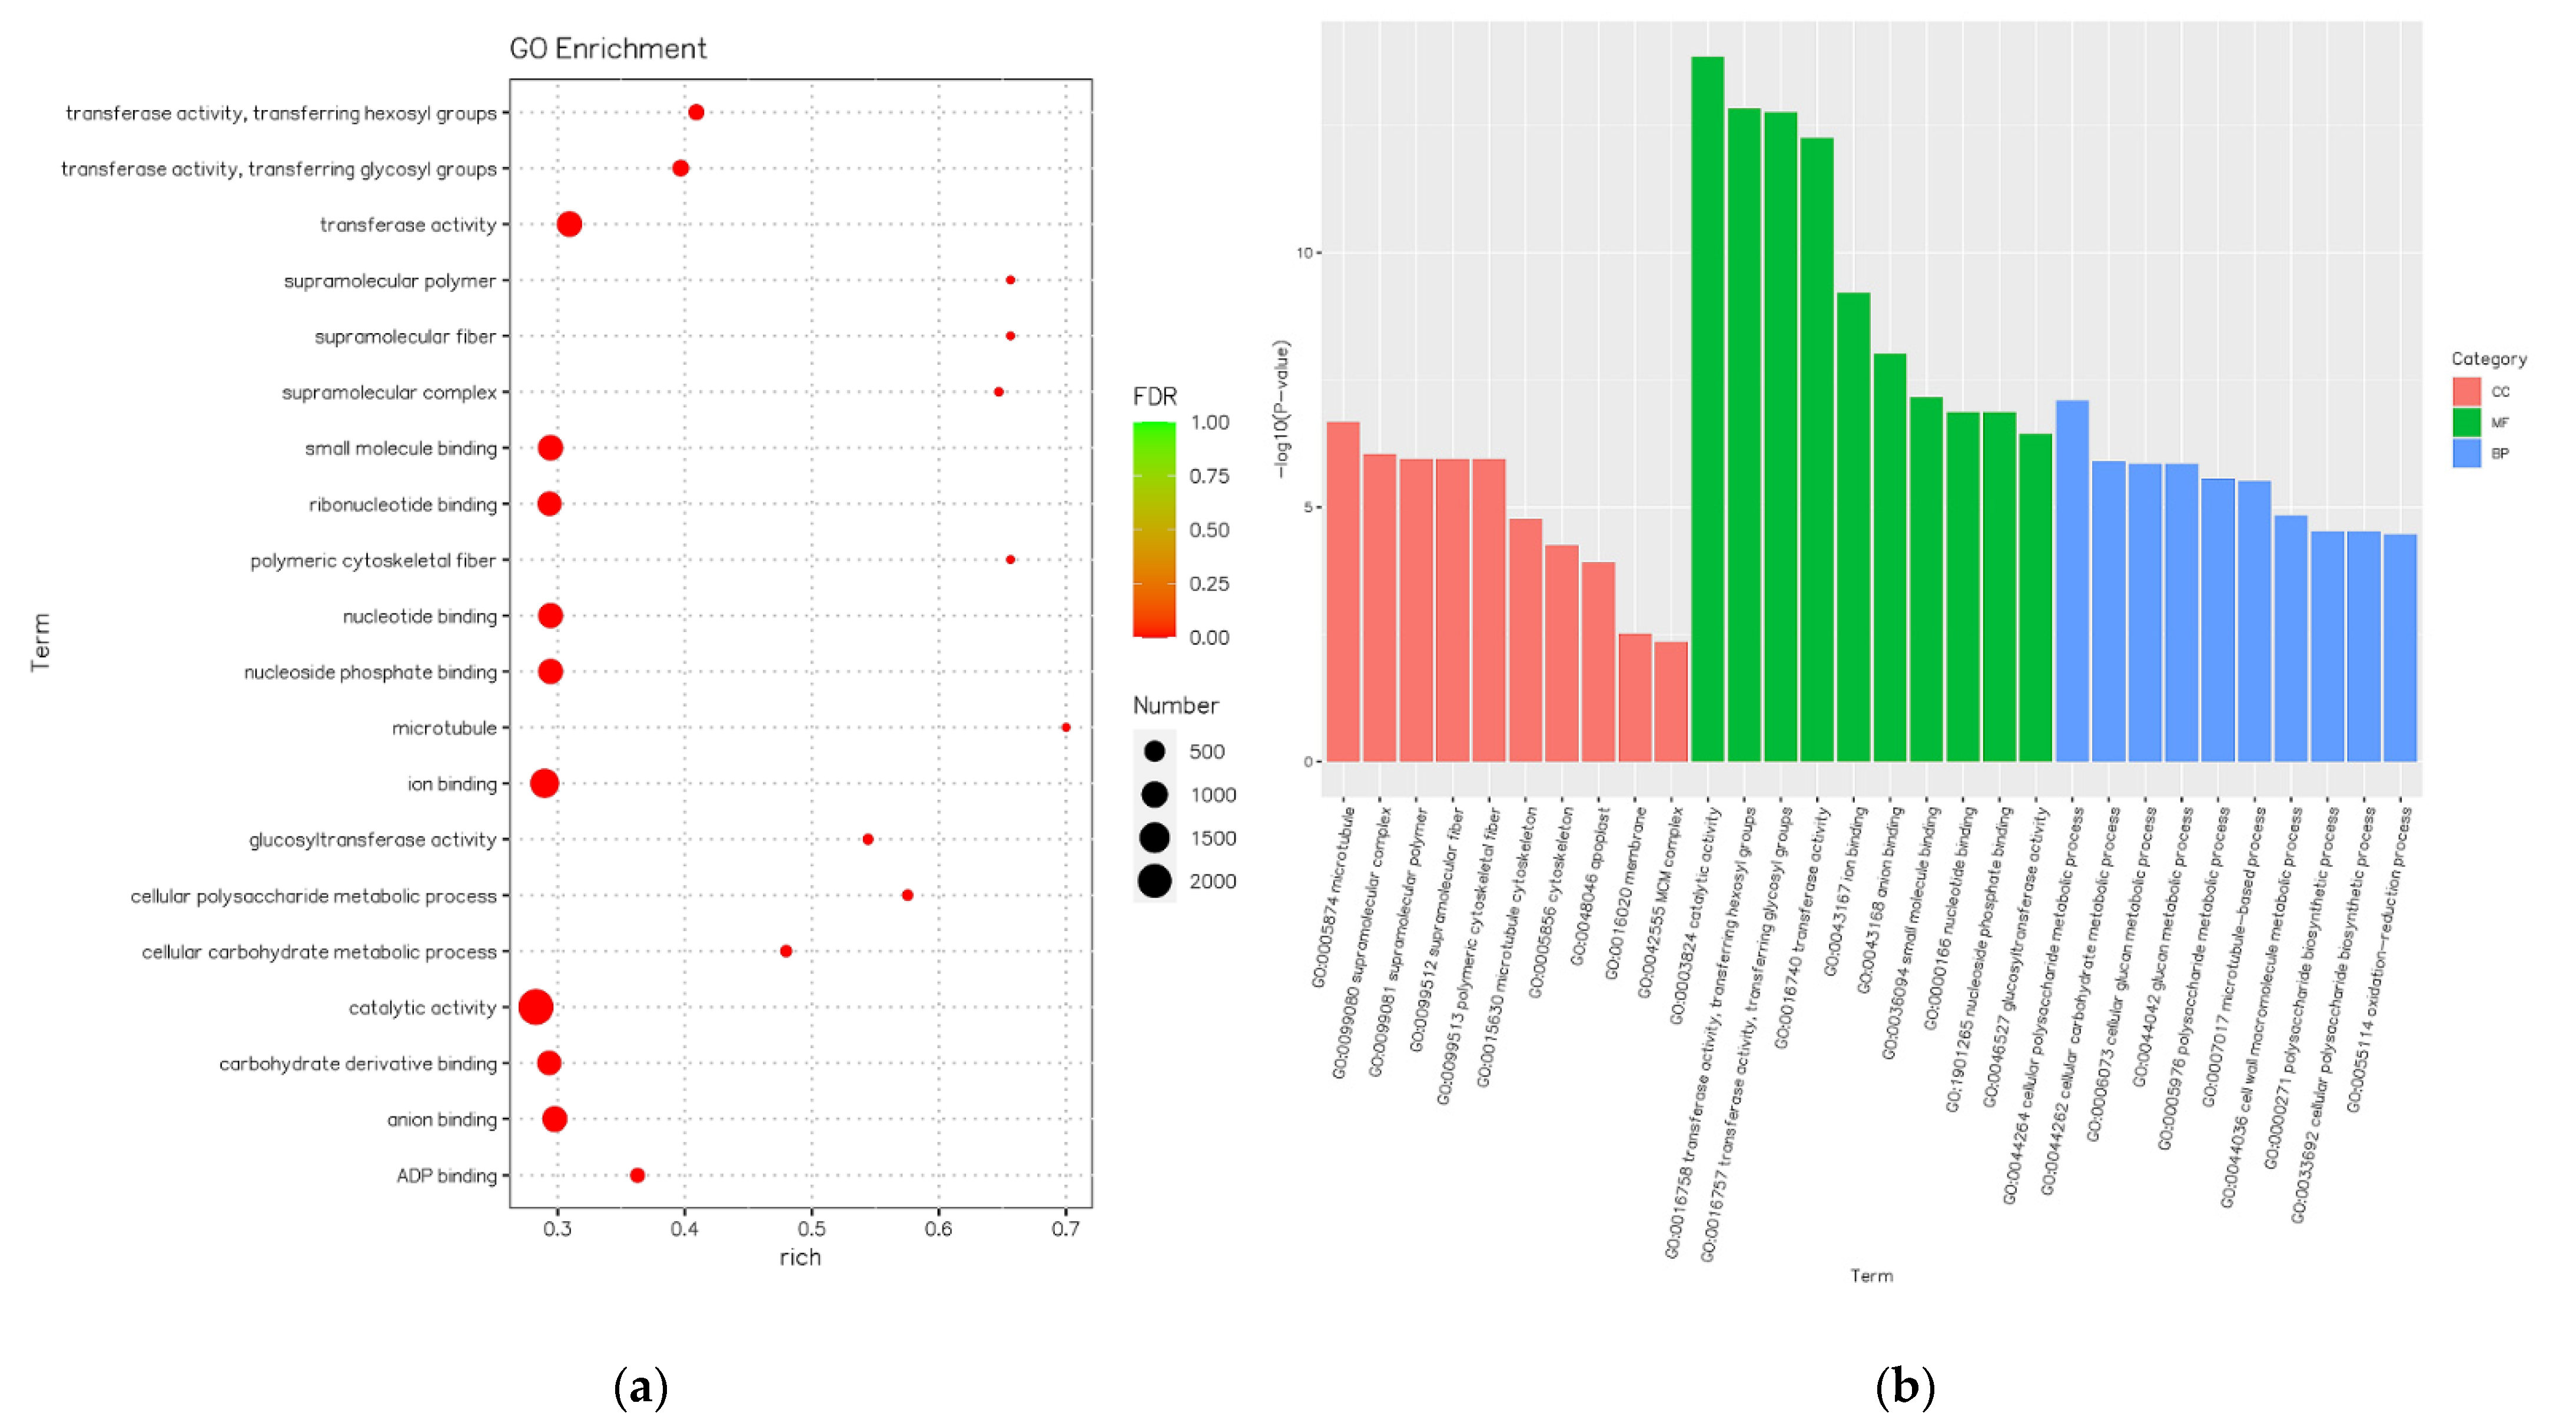
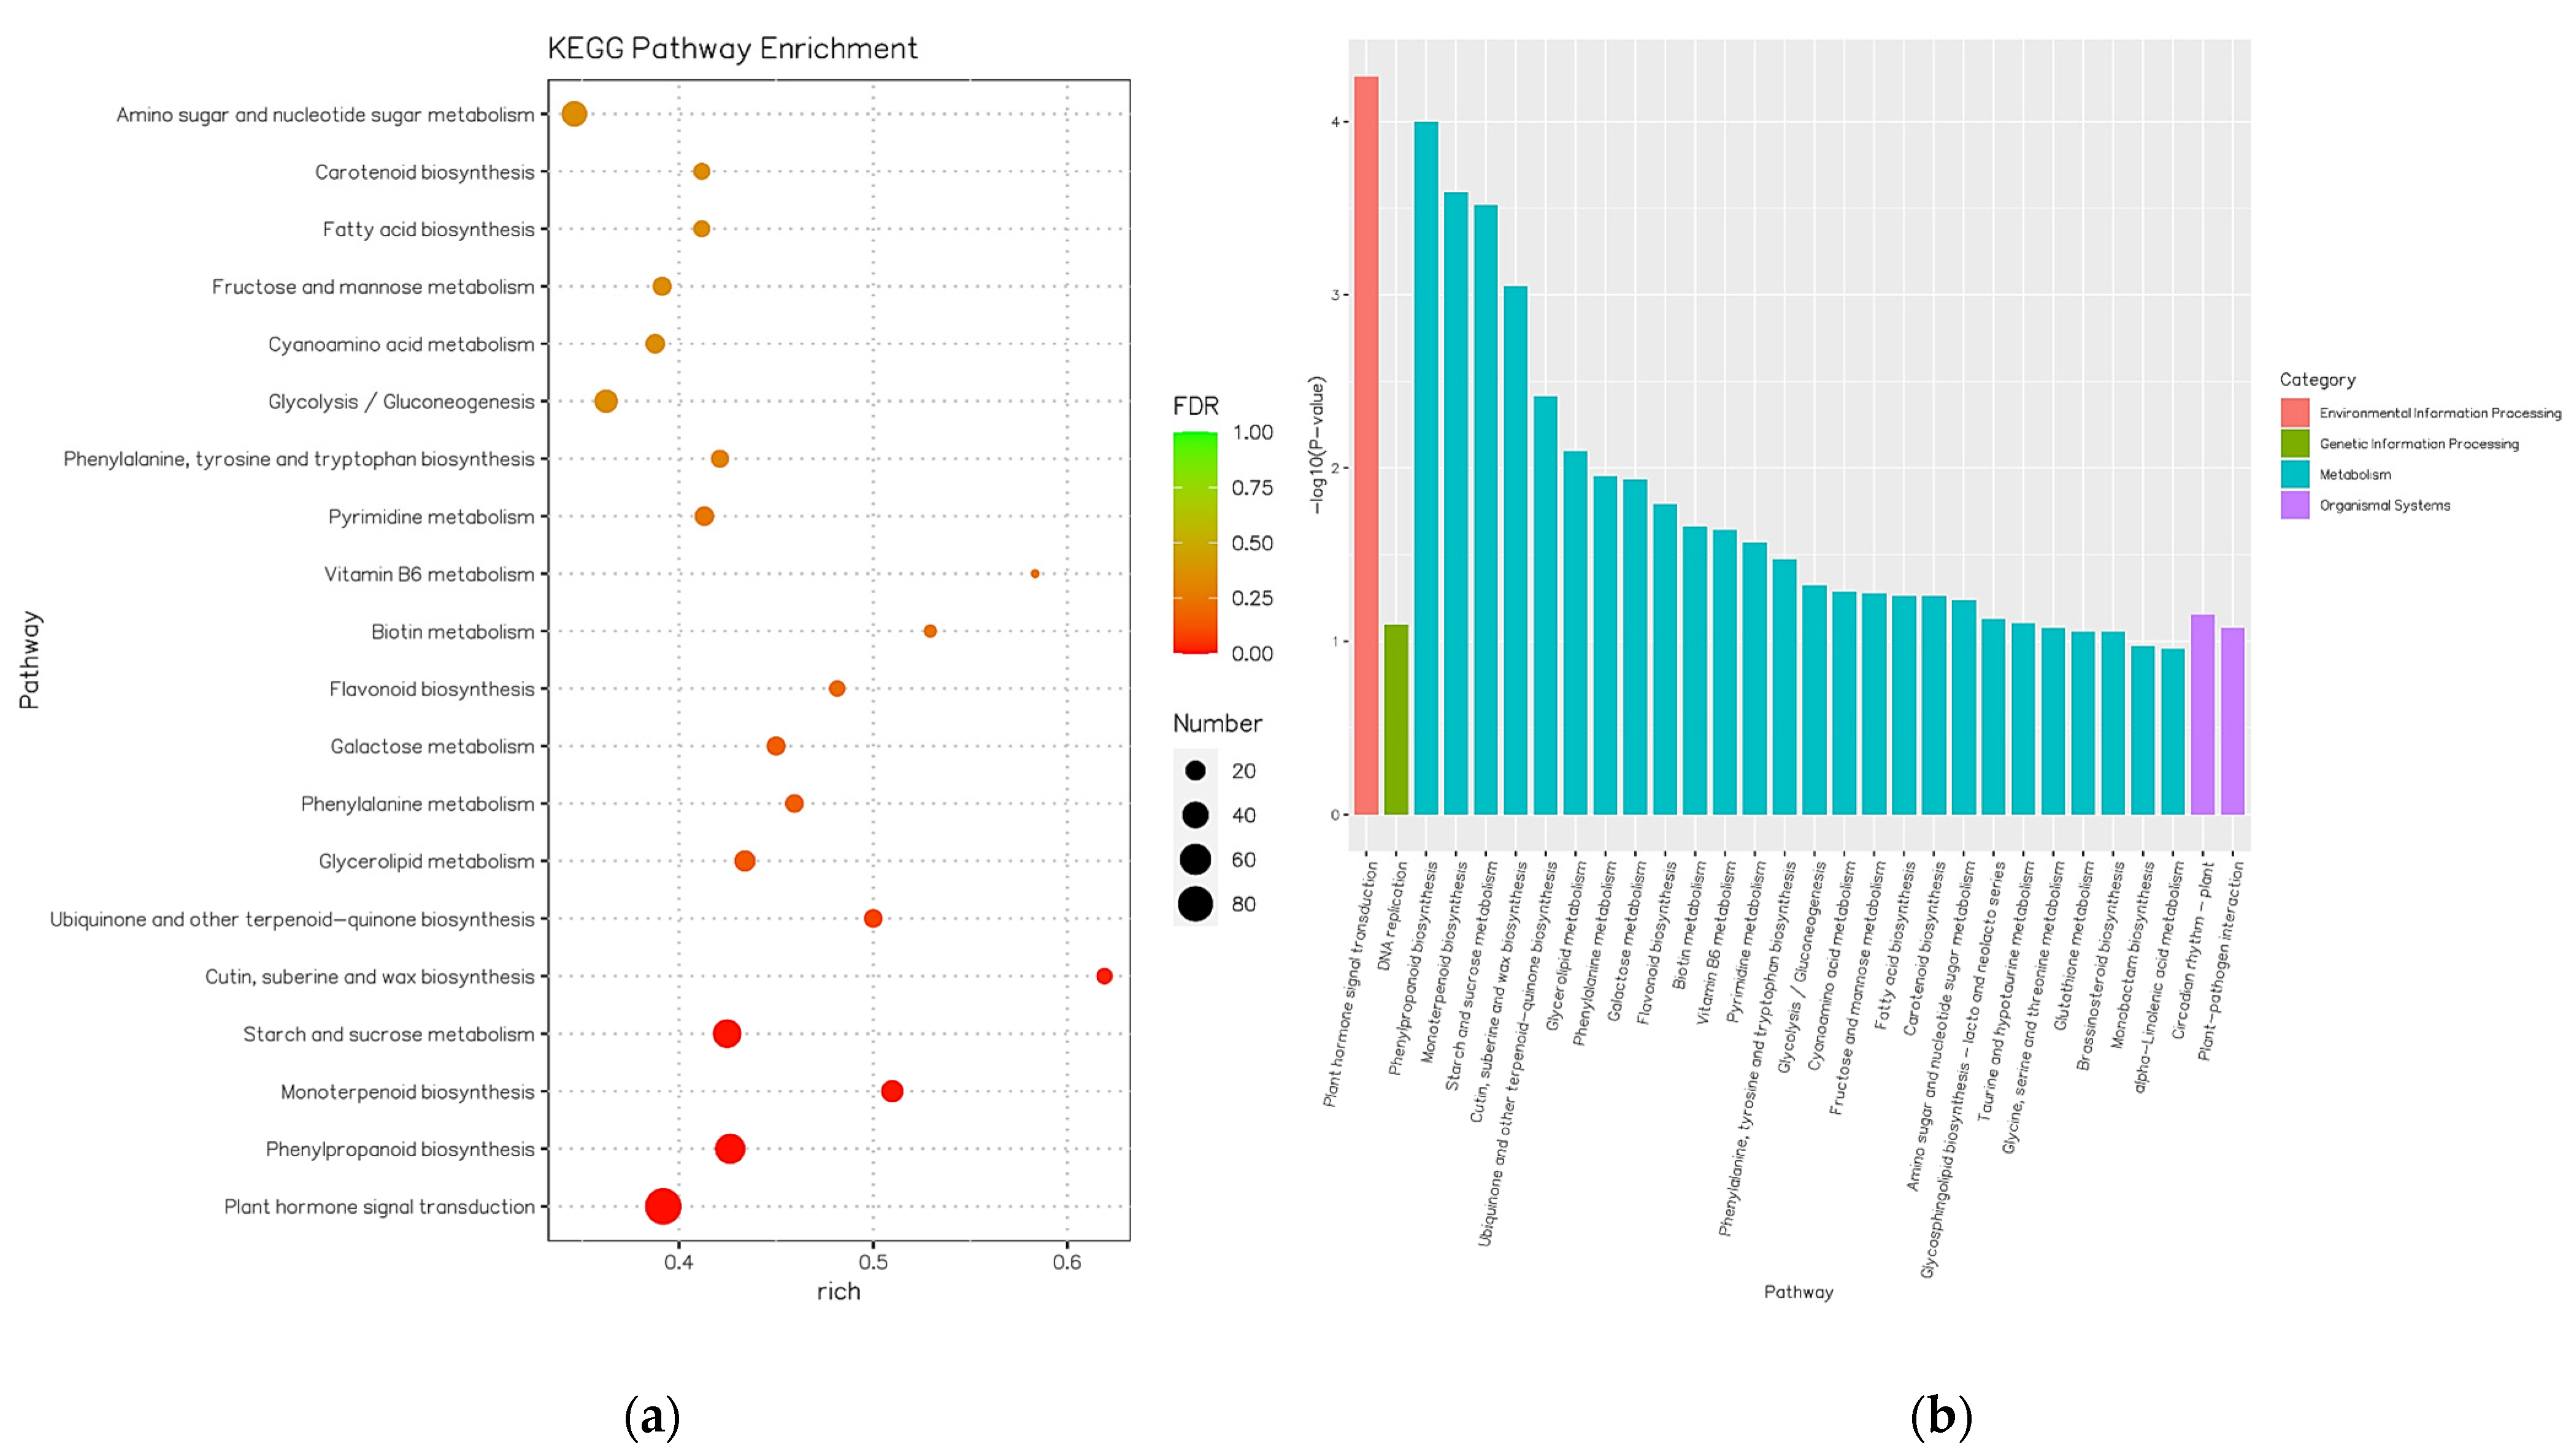
3.1. GO Enrichment and KEEG Pathway Enrichment Analysis of DEGs

Differentially expressed genes analysis showed that 7770 total DEGs included 3049 up-regulated genes and 4260 down-regulated genes (Figure 2). Phytohormone related genes SAUR20 was not expressed in non-infected samples (CKfr), while GH3.9 and SAUR40 were not expressed in ChP-infected samples (Fr3).
GO enrichment analysis indicated that the DEGs of this study were enriched in three categories: BP (biological process), CC (cell component), and MF (molecular function). Under BP, most of the DEGs belonged to three subcategories: oxidation–reduction process, aminoglycan catabolic process, and numerous metabolic processes. Under CC, most of the DEGs belonged to three subcategories: microtubule, supramolecular complex, and supramolecular polymer. Under MF, most of the DEGs belonged to three subcategories: oxidoreductase activity, catalytic activity, and various binding functions containing main DEGs (Figure 3).
The enrichment analysis of KEGG pathway revealed that the DEGs of this study were implicated in one hundred twenty-three pathways, many of which were involved in the phytohormone signal transduction, including all kinds of phytohormones pathways. Numerous DEGs were involved in several functional pathways such as phenylpropanoid biosynthesis, monoterpenoid biosynthesis, and starch and sucrose metabolism. The KEGG pathway enrichment is shown in Figure 4a, and the top 30 KEGG pathways are shown in Figure 4b.

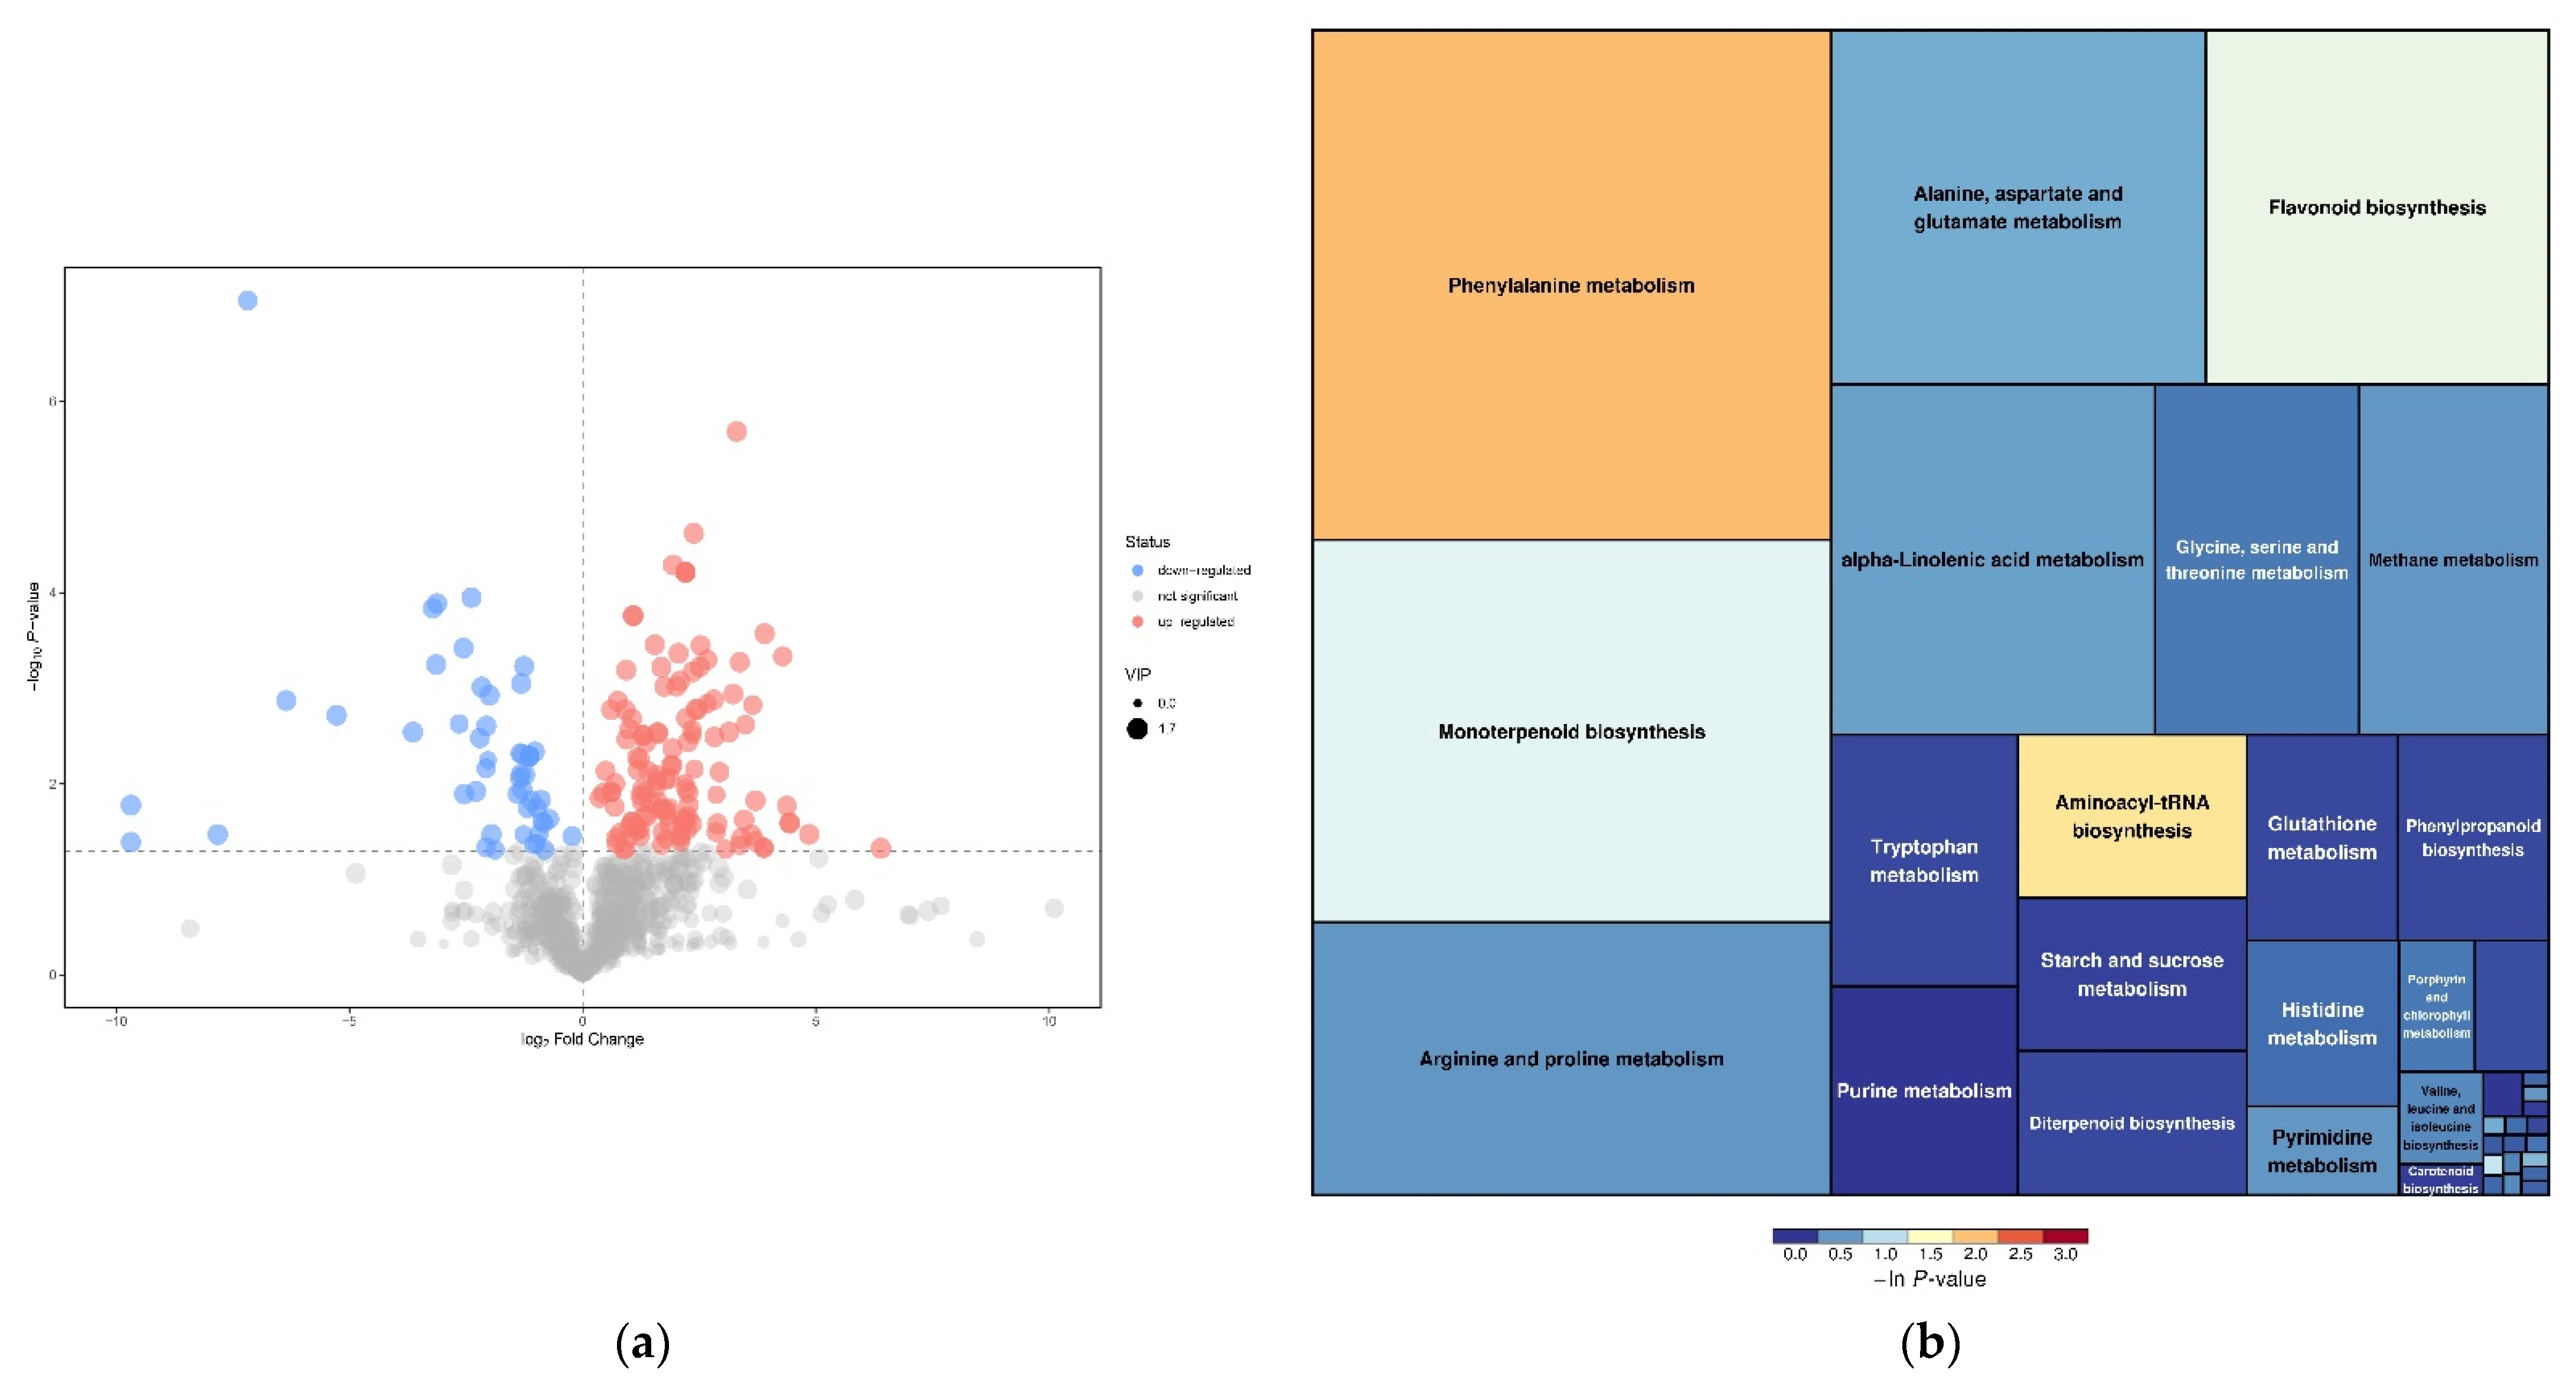
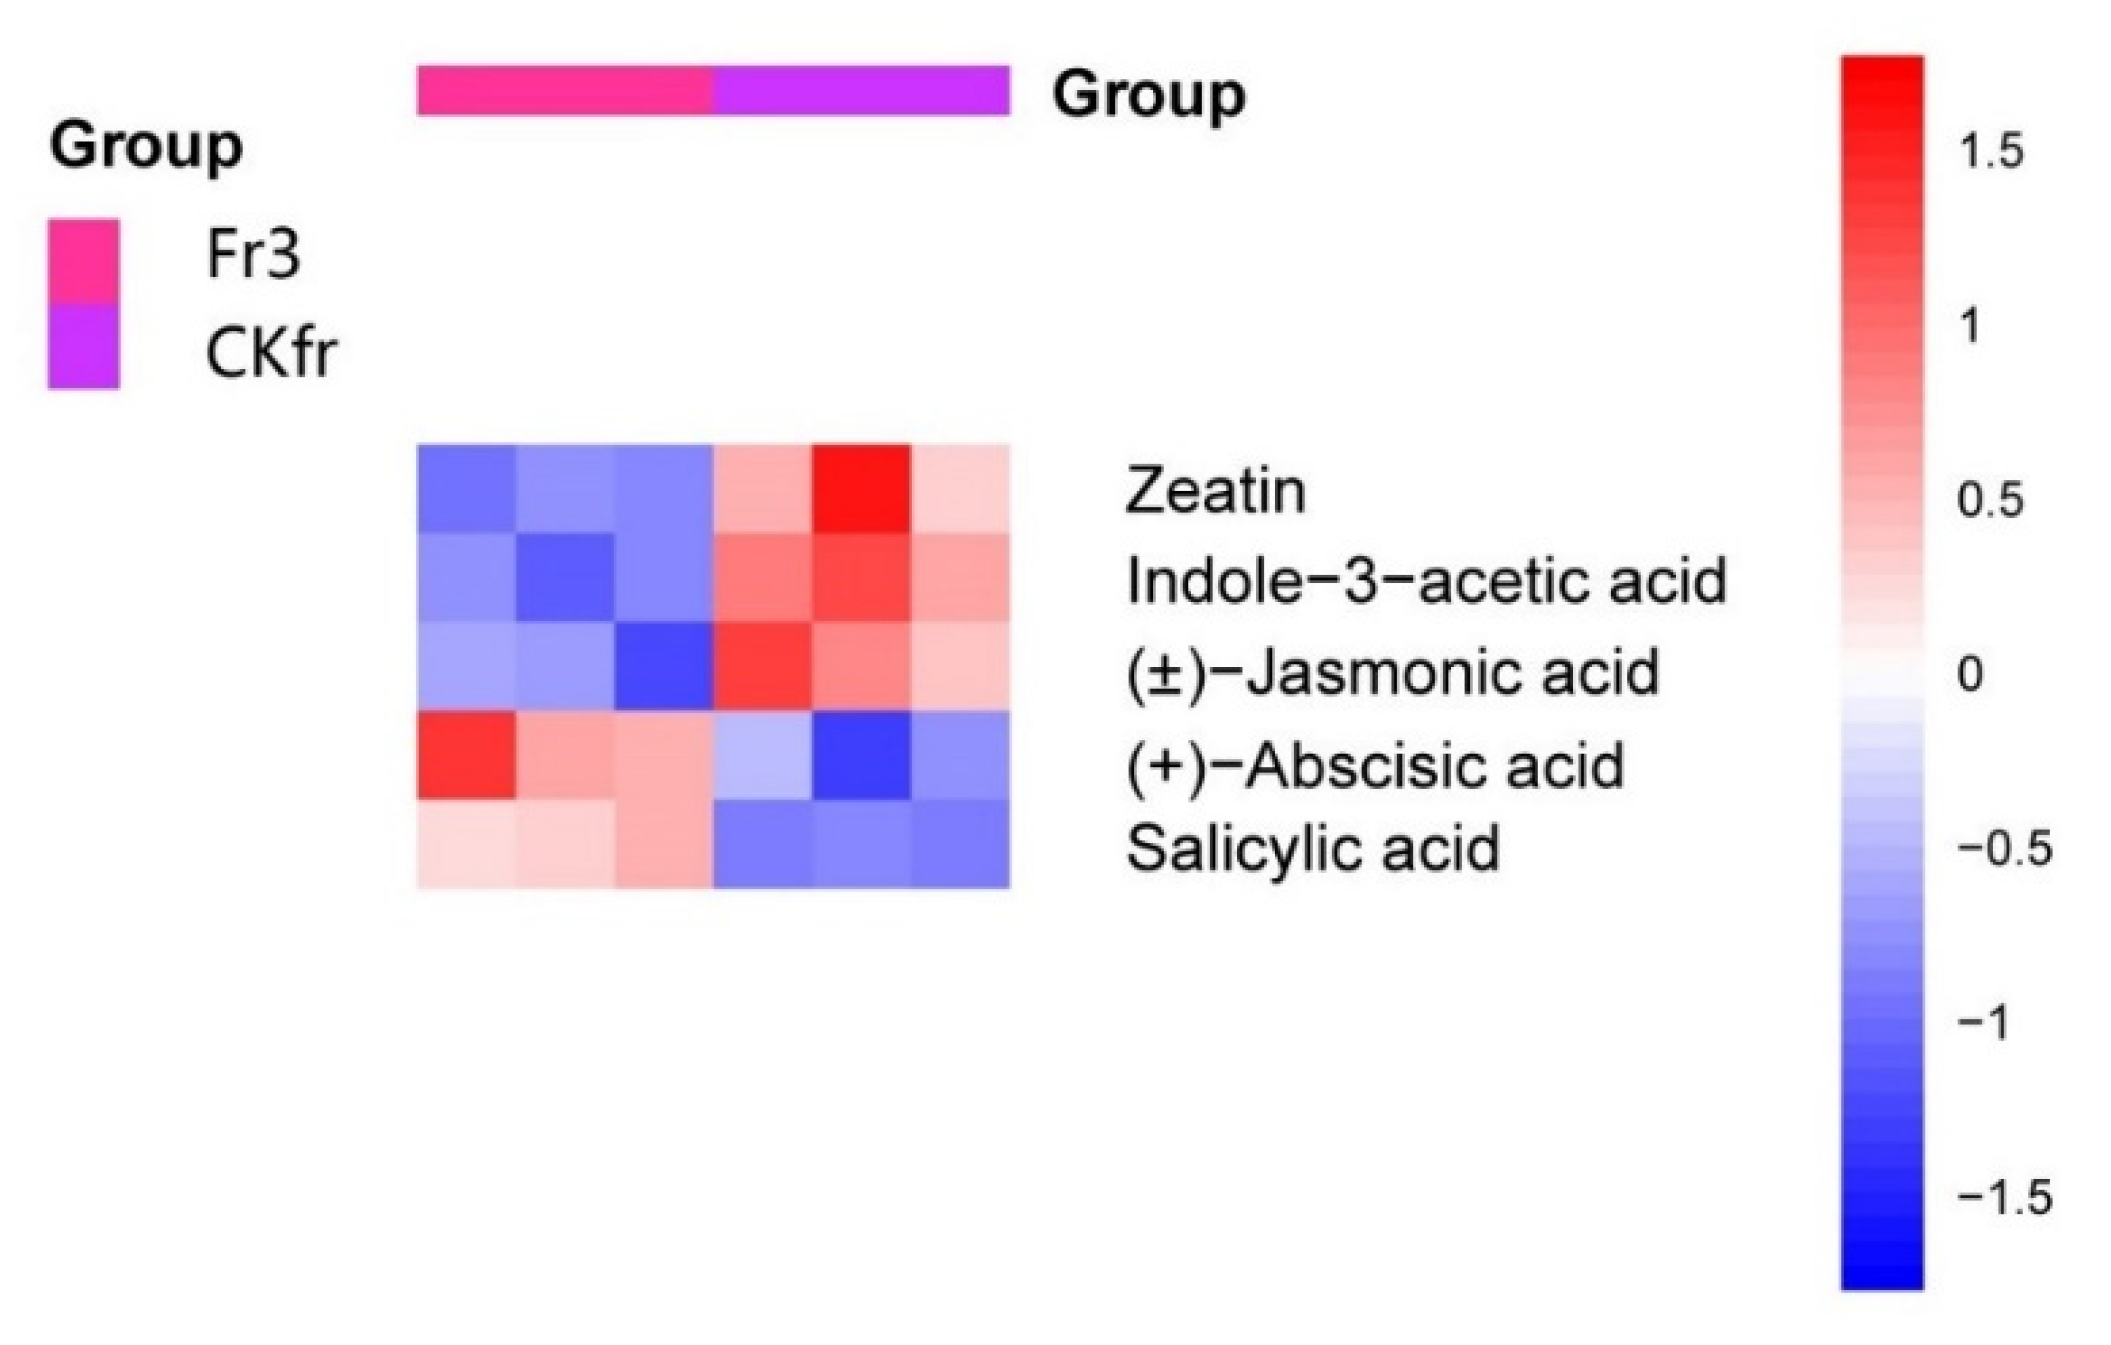
3.2. Differentially Accumulated Metabolites Analysis

Differentially accumulated metabolites (DAM) analysis shows 178 DAMs, including 127 up- and 51 down-accumulated compounds. (Figure 5a) The KEGG pathway analysis revealed that the metabolites were implicated in thirty-nine pathways, many of which were involved in the phenylalanine metabolism, aminoacyl-tRNA biosynthesis, flavonoid biosynthesis, and monoterpenoid biosynthesis (Figure 5b).
Quantification of phytohormones showed significant different accumulation between ChP-infected fruit and healthy fruit. ABA and salicylic acid contents of phytoplasma-infected fruit were higher than those of healthy fruit. In contrast, zeatin, jasmonic acid, and IAA levels of ChP-infected fruit were lower than those of healthy fruit (Figure 6).

3.3. Validation of RNA-Seq Data by qRT-PCR

To verify the reliability of RNA-seq data, forty-four DEGs related to phytohormone signal transduction and plant immunity response were selected. The qRT-PCR data exhibited the same tendency of genes expression as transcriptome except for the special genes SAUR71 and AREB3. If the Ct value of single gene exceeds 35, then it will be regarded as the gene is not expressed. The Ct value of forty-four genes was shown in Table S2. The current study found that GH3.9 in ChP-infected samples was not expressed, while SAUR40 in ChP-infected samples and SAUR20 in non-infected samples had relatively low transcription levels. In addition, IAA11 in ChP-infected samples produced few mRNA. Similarly, IAA14, GH3.17, and PR1a produced few mRNA in non-infected samples. More information about Log2FC, −∆∆Ct, and relative expression values of selected genes were shown in Table 1.

4. Discussion

The Chinese cherry is an important economic fruit crops that belongs to the Rosaceae family, with a history of more than three thousand years of cultivation [23]. Most cherry cultivars are susceptible to phytoplasma disease, which is a fatal and devastating disease in cherry. Thus, there is urgent need for study of ChP-resistant Chinese cherry germplasms, as well as detailed information about phytoplasma–plant interactions to further resist and prevent the disease. However, few previous studies focus on stiff fruit, which is caused by some phytohormones involved in signal transduction pathways in woody crops (Figure 3 and Figure 4). This study provided some new information about regulating the development of stiff fruit that plant immunity induced the expression of some genes and substance synthesis or metabolism, which led to changes in the content of phytohormones in the fruit and increases the occurrence of stiff fruit in Chinese cherry, such as ABA and auxin signaling pathway DEGs (PYL8, PYL2, PP2CA, SnRK2.3, SAUR32, and SAUR71); these were also involved in abiotic drought stress response (Table 1). Screening ChP-resistant Chinese cherry germplasms should pay more attention to ahk2 mutant and genes with improved disease resistance. In general, these findings could be helpful to reveal the pathogenic mechanism of cherry phyllody phytoplasma and provide available knowledge for the breeding of ChP-resistant plants. Furthermore, the current study contributes to a better understanding of phytohormones function in pathogen stress response and fruit development, especially those infected by pathogens.
Salicylic acid signal transduction pathway plays a central role in Chinese cherry against phytoplasma.
Like plants resisted other pathogens by SAR, phytoplasma-infected plants had increased SA content, and the transcription levels of SA signal transduction pathway genes were up-regulated, especially genes TGA10, PRB1, and PR1a. SA is produced by phenylalanine ammonia lyase (PAL) pathway and isochorismate synthase (ICS) pathway [24]. Up-accumulated phenylalanine metabolism pathway is directly connected to SA synthesis, and up-accumulated flavonoid biosynthesis is directly connected to pathogen resistance (Figure 5). SAR arouses the resistance genes to create phytoalexins and reinforce the cell wall [21,25,26]. DAMs analysis showed up-accumulated phytoalexins including chlorogenic acid, sakuranetin, wighteone, and capsidiol [27]. Phenylalanine is involved in S- and G-lignin biosynthesis during cell lignification [28]. Up-regulated lignin synthesis genes and phenylpropanoid biosynthesis pathway are directly associated with lignin synthesis (Figure 3, Figure 4 and Figure 5).
Most ChP-infected Chinese cherries cannot enter the fruit-set period. The occurrence of stiff fruit was the result of Chinese cherry effectively resisting phytoplasma. The current study surmised that exogenous SA treatment in early phase could improve phytoplasma resistance ability of plants. Phytoalexin synthesis pathway and mechanism should be further explained, and new substances with similar function deserve more attention.
AUXIN signal transduction pathway restricts fruit development and is involved in phytoplasma resistance.
Auxin plays a vital role in regulating each plant growth stage and fruit development. A transcriptome integrated with qRT-PCR showed that numerous genes were actively expressed in auxin signaling pathway, including up-regulated genes (IAA4, 9, 14, 31, SAUR20, 32, 71, 72, GH3.1, 3.17, ARF5, 9) and down-regulated genes (AUX22, IAA11, 12, 16, 26, 27, SAUR24, 40, 50, GH3.9, 3.10, ARF3) (Table 1, Figure 4). Low auxin content seemed to be considered to positively control defense responses and resist to pathogens [29,30], but repression of auxin signaling could reduce sensibility to pathogen (Figure 6). AUX22 is early auxin-responsive protein, which is repressed by low auxin content. Previous studies show than GH3.17 can conjugate free IAA with glutamate irreversibly and GH3.1 overexpression in citrus decreased free IAA content, which indicated that up-regulated GH3.1 and GH3.17 could be responsible for low IAA content in ChP-infected samples [31,32].
Some of these differentially expressed genes directly lead to abnormal fruit development and play an important role in the fruit development process affected by auxin. Tomato is a parthenocarpic fruit with down-regulation of IAA9 [33], and IAA14, 16 negatively regulate tomato development by suppressing auxin signal response [34]. In addition, down-regulation of IAA27 results in the formation of tomato fruit with a modified shape and reduced size [35,36]. IAA26 perform down-regulated expression level, which is related to fruit sac granulation in late-ripening navel orange [37]. During the early development of tomato fruit, ARF9 negatively controls the period of cell division by responding auxin dynamics [38]. Those genes expressed in phytoplasma-infected cherry may play a major role in occurrence of stiff fruit.
Some of these differentially expressed genes also play an essential role in morphogenesis, but there is a lack of research on their functions during fruit development. ARF3 is known to play a positive role in leaf polarity specification, gynoecium patterning, and floral meristem determinacy [39], and ARF5 acts predominantly in embryos, meristems, and organ primordia [40]. According to a previous study, IAA11 is specifically and strictly required for callus initiation in the lateral root formation area, and IAA12 prevents the formation of an embryonic root [41]. IAA16 promotes plant development and fertility in auxin and ABA response [42], and IAA26 promotes hypocotyl elongation [43]. The overexpression seedlings of IAA31 in Arabidopsis exhibit semi-dwarf phenotype [44]. Additionally, the overexpression of GH3.1 in rice causes dwarfism and significantly reduces both free auxin content and cell elongation [45]. GH3.9 influences primary root growth and is repressed by low content of exogenous IAA in seedlings [46], and the overexpression lines of GH3.10 in Arabidopsis have shorter hypocotyl than wild type [47]. In addition, SAUR50 promotes cell expansion during the development of apical hook [48]. Those genes have potential research value in regulation of fruit development.
Some of these differentially expressed genes possess cross regulation with other phytohormones. SAUR72, SAUR71, and SAUR40 belong to the SAUR41 subfamily, which is induced by ABA and negatively controls cell expansion in Arabidopsis seedlings [49]. Previous work also indicates that the balance between the expression of ABA-repressed and ABA-induced SAUR41 family may be indispensable for plant abiotic responses [50]. SAUR32 is dominantly expressed in roots and is highly induced by ABA and drought treatment [51]. It has been widely reported that cytokinin affects auxin levels through PIN5 and GH3.17 [52]. This indicates that CTK is involved in plant immunity and negatively regulates the synthesis of IAA via GH3.17.
The functions of some differentially expressed genes were out of the blue. SAUR20 and SAUR24, belonging to the SAUR19 subfamily, promote cell expansion [53]. In our study, SAUR20 was significantly positively expressed in ChP-infect samples, whereas SAUR24 had a negative expression level. We proposed two hypotheses, and the first one was that SAUR24 competed with SAUR20 for regulating downstream genes, and yet SAUR24 played a major role. The other was that SAUR19 family played minor role in fruit development, and their functions were covered by other negative genes. Transcriptome and RT-qPCR analysis demonstrated that GH3.9 was not expressed in ChP-infected fruit with low auxin content, so the current study speculated that GH3.9 could be expressed normally or positively under high concentration of IAA. Moreover, obvious growth phenotype was not observed in iaa4 mutant lines of Arabidopsis [54].
Stiff fruit is the result of abnormal fruit development, and it may be associated with auxin signal transduction. Therefore, the current study focused on auxin signaling pathway and conducted detailed research. The result provided numerous genes with potential value to deepen the cognition of fruit development in both promotion and inhibition.
ABA contributes both positive and negative sides to phytoplasma resistance.
It has been reported in detail that ABA is involved in plant response to abiotic stress, which may often be correlated with other phytohormones [55]. ABA majorly regulates the adaptation of plants to environment through a double negative regulatory system: PYL—|PP2C—|SnRK2. However, in the current study, the expression of down-regulated PYL4, up-regulated PYL8, PYL2, PP2CA, and SnRK2.3 was not in conformity with the double negative regulatory system mechanism. SnRK2.3 belongs to subclass III SnRK2s, which are positive regulators in ABA signaling pathway as a central hub and are essential for the formation of drought tolerance [56]. Previous studies showed that up-regulated PYL2, PYL4, and PYL8 elevated drought tolerance [57], and ABA induced SAUR31 and SAUR71, which are involved in auxin signaling pathway and have the same function. Nevertheless, the connection between biotic stress response through ABA-induced pathway and abiotic drought stress response should be further studied.
The β-aminobutyric acid (BABA) is a well-known activator in plant defense response and considered to restrict pathogens migration. Studies state that the ABA pathway seems to play a more important role than JA and ET signaling pathways in BABA-induced resistance [58]. In current study, β-aminobutyric acid accumulated at higher level, and JA accumulated at a lower level in phytoplasma-infected fruit, which was consistent with the above view. However, the mechanism and related genes in ABA signaling pathway inducing β-aminobutyric accumulation need to be more elucidated.
Previous work confirmed that AHK2 attenuate plant response to abiotic stress in ABA signaling regulation [59]. In this study, it was noticed that AHK2 involved in CTK signaling pathway was significantly up-regulated in phytoplasma-infected fruit. Many pathogens are capable of increasing ABA content, resulting in weakening basal defense responses of plants [60]. Therefore, the current study reckoned that phytoplasma impaired plant immunity, which was connected with ABA-induced expression of AHK2.
Cytokinin plays a negative role in fruit development.
It is considered that CTK signaling has complex effects on abiotic stress responses. As the current study shows, CTK signaling could respond to biotic phytoplasma stress as well by transcriptome and qRT-PCR validation. The CTK signal transduction pathway directly controls cell division and is involved in a multi-regulated system: AHK2–4 (AHK4 also named CRE1/WOL)–AHP–ARR. CTK mainly includes kinetin, zeatin, and 6-BA. Zeatin was detected in Chinese cherry fruit samples and accumulated at lower level in phytoplasma-infected samples. The AHK4–AHP1–ARR9 system was negatively expressed in response to low CTK content, which reduces cell division and further leads to smaller fruit. Up-regulated AHK2 could be responsive to ABA signaling rather than CTK and positively regulated downstream genes.
Other phytohormones make limited contribution to plant immunity.
JA and ethylene, as plant immunity signals, are considered equally important as SA. In ChP-infected fruit, the small expression of genes in the two signaling pathways might account for phytoplasma resistance. MYC2 is main regulator in JA signaling pathway exhibiting significantly positive expression, but only this single gene was up-regulated in the whole pathway, and its effect was limited. Ethylene signaling pathway had the similar situation.
Genes involved in the remaining phytohormones signaling pathways were slightly differentially expressed. For instance, the DELLA protein GAIPB was up-regulated in the gibberellin signaling pathway, and CYCD3 was down-regulated in the brassinosteroid signaling pathway. ARF5 and the BES1 co-regulated a subset of growth-promoting genes, and BES1 play a major role in auxin response in young seedlings [61]. During the cherry immunity process, BES1 and BEH2 could be responsive to auxin signal transduction in fruit rather than BRs.
The occurrence of stiff fruit is the result of resisting phytoplasma through phytoalexins synthesis, cell wall reinforcement, and the suppression of cells division and enlargement by expressing genes involved in phytohormone signal transduction in Chinese cherry. In ChP-infected cherry fruit, SA was the primary signaling in plant biotic stress response, and IAA was the central signaling in fruit development with the assistance of other phytohormones. Additionally, ABA had both positive and negative functions in plant immunity. The foremost purpose of plant immunity is to ensure survival. Plant immunity system copes with pathogens by biological active substance in first stage. When the plant immunity system fails to annihilate powerful pathogens, plants slow the development of pathogen-infected tissues and guide those parts to apoptosis status for whole-body survival.

5. Conclusions

This study revealed how complex signal network influenced the development of stiff fruit under phytoplasma infection. In summary, this study result showed auxin signaling play the master role in the stiff fruit development, SA signaling play the master role in phytoplasma resistance, and that ABA signaling could be hijacked by phytoplasma through AHK2 to impair plant immunity. Future research should pay attention to the candidate genes of phytoplasma resistance and ABA or auxin signal pathway (e.g., AHK2), and verify their function in mode plants. The connection between biotic stress response through ABA-induced pathway and abiotic drought stress response should be considered. Moreover, the current study contributed to better understanding of phytoplasma, Chinese cherry, and fruit development.

Supplementary Materials

The following supporting information can be downloaded at: https://www.mdpi.com/article/10.3390/agriculture12010012/s1, Table S1: primer sequence, Table S2: Ct value.

Author Contributions

J.L., investigation, conceptualization, draft, techniques and writing; S.C., investigation; W.W., investigation, supervision and funding acquisition; C.L., visualization, funding acquisition. All authors have read and agreed to the published version of the manuscript.

Funding

This research was funded by ‘the Fundamental Research Funds for the Central Universities’ (XDJK2018B038 (W.W.); XDJK2020C076(C.L.)).

Data Availability Statement

The origin RNA-seq data are available online at NCBI with BioProject accession number: PRJNA789672; The origin metabolism data are available online at https://doi.org/10.6084/m9.figshare.17263331.v1 (accessed on 10 November 2021).

Acknowledgments

Sequencing service were provided by Personal Biotechnology Co., Ltd. Shanghai, China.

Conflicts of Interest

The authors declare no conflict of interest.

References

  1. Granett, A.L.; Gilmer, R.M. Mycoplasmas associated with X- disease in various Prunus species. Phytopathology 1971, 61, 1036–1037. [Google Scholar] [CrossRef]
  2. Wang, J.W.; Zhu, S.F.; Liu, Q.; Davis, R.E.; Zhao, Y. First report of sweet cherry virescence disease in China and its association with infection by a ‘Candidatus Phytoplasma ziziphi’-related phytoplasma. Plant Dis. 2014, 98, 419. [Google Scholar] [CrossRef]
  3. Wang, J.; Ai, C.X.; Yu, X.M.; Zhang, K.P.; Gao, R.; Li, X.D. First report of ‘Candidatus phytoplasma asteris’ related strain associated with sweet cherry fasciation disease in China. Plant Dis. 2018, 102, 237. [Google Scholar] [CrossRef]
  4. Wang, J.; Liu, Q.; Wei, W.; Davis, R.E.; Tan, Y.; Lee, I.M.; Zhu, D.; Wei, H.; Zhao, Y. Multilocus genotyping identifies a highly homogeneous phytoplasma lineage associated with sweet cherry virescence disease in China and its carriage by an erythroneurine leafhopper. Crop Prot. 2018, 106, 13–22. [Google Scholar] [CrossRef]
  5. Gao, R.; Yang, S.K.; Wang, J.; Lu, X.B.; Sun, Y.G.; Tian, Y.P.; Wang, W.X. Molecular detection and identification of subgroup 16SrV-B phytoplasma associated with Chinese cherry phyllody disease in China. Acta Sci. Hortic. 2019, 46, 1249–1256. (In Chinese) [Google Scholar] [CrossRef]
  6. Ermacora, P.; Ruggero, O. Symptoms of Phytoplasma Diseases. In Methods in Molecular Biology; Musetti, R., Pagliari, L., Eds.; Springer Nature, LLC.: Berlin/Heidelberg, Germany, 2019; Volume 1875, pp. 53–67. [Google Scholar] [CrossRef]
  7. MacLean, A.M.; Sugio, A.; Makarova, O.V.; Findlay, K.C.; Grieve, V.M.; To’th, R.; Nicolaisen, M.; Hogenhout, S.A. Phytoplasma effector SAP54 induces indeterminate leaf-like flower development in Arabidopsis plants. Plant Physiol. 2011, 157, 831–841. [Google Scholar] [CrossRef] [Green Version]
  8. Lu, Y.T.; Li, M.Y.; Cheng, K.T.; Tan, C.M.; Su, L.W.; Lin, W.Y.; Shih, H.T.; Chiou, T.J.; Yang, J.Y. Transgenic plants that express the phytoplasma effector SAP11 show altered phosphate starvation and defense responses. Plant Physiol. 2014, 164, 1456–1469. [Google Scholar] [CrossRef] [Green Version]
  9. Minato, N.; Himeno, M.; Hoshi, A.; Maejima, K.; Komatsu, K.; Takebayashi, Y.; Kasahara, H.; Yusa, A.; Yamaji, Y.; Oshima, K.; et al. Thephytoplasmal virulence factor TENGU causes plant sterility bydownregulating of the jasmonic acid and auxin pathways. Sci. Rep. 2014, 4, 7399. [Google Scholar] [CrossRef] [Green Version]
  10. Huang, W.J.; MacLean, A.M.; Sugio, A.; Maqbool, A.; Busscher, M.; Cho, S.T.; Kanoun, S.; Kuo, C.H.; Immink, R.G.H.; Hogenhout, S.A. Parasitic modulation of host development by ubiquitin-independent protein degradation. Cell 2021, 184, 5201–5214.e1. [Google Scholar] [CrossRef]
  11. Janik, K.; Mithöfer, A.; Raffeiner, M.; Stellmach, H.; Hause, B.; Schlink, K. An effector of apple proliferation phytoplasma targets TCP transcription factors—a generalized virulence strategy of phytoplasma? Mol. Plant Pathol. 2017, 18, 435–442. [Google Scholar] [CrossRef]
  12. Wang, N.; Yang, H.; Yin, Z.; Liu, W.; Sun, L.; Wu, Y. Phytoplasma effector SWP1 induces witches’ broom symptom by destabilizing the TCP transcription factor BRANCHED1. Mol. Plant Pathol. 2018, 19, 2623–2634. [Google Scholar] [CrossRef]
  13. Zhou, J.; Ma, F.; Yao, Y.; Deng, M.; Chen, M.; Zhang, S.; Li, Y.; Yang, J.; Zhang, N.; Huang, J.; et al. JWB phytoplasma effectors SJP1 and SJP2 induce lateral bud outgrowth by repressing the ZjBRC1-controlled auxin efflux channel. Plant Cell Environ. 2021, 44, 3257–3272. [Google Scholar] [CrossRef]
  14. Sun, Y.L.; Detchemendy, T.W.; Pajerowska-Mukhtar, K.M.; Mukhtar, M.S. NPR1 in JazzSet with Pathogen Effectors. Trends Plant Sci. 2018, 23, 469–472. [Google Scholar] [CrossRef]
  15. Hagen, G.; Guilfoyle, T. Auxin-responsive gene expression: Genes, promoters and regulatory factors. Plant Mol. Biol. 2002, 49, 373–385. [Google Scholar] [CrossRef]
  16. Li, S.B.; Xie, Z.Z.; Hu, C.G.; Zhang, J.Z. A Review of Auxin Response Factors (ARFs) in Plants. Front. Plant Sci. 2016, 7, 47. [Google Scholar] [CrossRef] [Green Version]
  17. Hong, R.; William, M.G. SAUR Proteins as Effectors of Hormonal and Environmental Signals in Plant Growth. Mol. Plant 2015, 8, 1153–1164. [Google Scholar] [CrossRef] [Green Version]
  18. Guilfoyle, T.J.; Ulmasov, T.; Hagen, G. The ARF family of transcription factors and their role in plant hormone-responsive transcription. Cell. Mol. Life Sci. 1998, 54, 619–627. [Google Scholar] [CrossRef]
  19. Sarbottam, P.; Shrestha, S.K.; Brad, B.; Stewart, N.C.; Hewezi, T. Protein-protein interaction and gene co-expression maps of ARFs and Aux/IAAs in Arabidopsis. Front. Plant Sci. 2014, 5, 744. [Google Scholar] [CrossRef] [Green Version]
  20. Tiwari, S.B.; Hagen, G.; Guilfoyle, T. The roles of auxin response factor domains in auxin-responsive transcription. Plant Cell 2003, 15, 533–543. [Google Scholar] [CrossRef] [Green Version]
  21. Kumar, N.; Tokas, J.; Raghavendra, M.; Singal, H.R. Impact of exogenous salicylic acid treatment on the cell wall metabolism and ripening process in postharvest tomato fruit stored at ambient temperature. Int. J. Food Sci. Technol. 2021, 56, 2961–2972. [Google Scholar] [CrossRef]
  22. Livak, K.J.; Schmittgen, T.D. Analysis of relative gene expression data using real-time quantitative PCR and the 2−ΔΔCT method. Methods 2001, 25, 402–408. [Google Scholar] [CrossRef]
  23. Zhang, J.; Chen, T.; Wang, Y.; Chen, Q.; Sun, B.; Luo, Y.; Zhang, Y.; Tang, H.R.; Wang, X.R. Genetic Diversity and Domestication Footprints of Chinese Cherry [Cerasus pseudocerasus (Lindl.) G.Don] as Revealed by Nuclear Microsatellites. Front. Plant Sci. 2018, 9, 238. [Google Scholar] [CrossRef] [PubMed] [Green Version]
  24. Garcion, C.; Lohmann, A.; Lamodiere, E.; Catinot, J.; Buchala, A.; Doermann, P.; Metraux, J.-P. Characterization and Biological Function of the ISOCHORISMATE SYNTHASE2 Gene of Arabidopsis. Plant Physiol. 2008, 147, 1279–1287. [Google Scholar] [CrossRef] [Green Version]
  25. Shadle, G.L.; Wesley, S.V.; Korth, K.L.; Chen, F.; Lamb, C.; Dixon, R.-A. Phenylpropanoid compounds and disease resistance in transgenic tobacco with altered expression of l-phenylalanine ammonia-lyase. Phytochemistry 2003, 64, 153–161. [Google Scholar] [CrossRef] [Green Version]
  26. Napoleo, T.A.; Soares, G.; Vital, C.E.; Bastos, C.; Castro, R.; Loureiro, M.E.; Giordano, A. Methyl jasmonate and salicylic acid are able to modify cell wall but only salicylic acid alters biomass digestibility in the model grass brachypodium distachyon. Plant Sci. 2017, 263, 46. [Google Scholar] [CrossRef]
  27. Jeandet, P.; Clément, C.; Courot, E.; Cordelier, S. Modulation of Phytoalexin Biosynthesis in Engineered Plants for Disease Resistance. Int. J. Mol. Sci. 2013, 14, 14136–14170. [Google Scholar] [CrossRef] [Green Version]
  28. Zanardo, D.I.L.; Lima, R.B.; Ferrarese, M.D.L.; Bubna, G.A.; Ferrarese, O. Soybean root growth inhibition and lignification induced by p-coumaric acid. Environ. Exp. Bot. 2009, 66, 25–30. [Google Scholar] [CrossRef]
  29. Navarro, L.; Dunoyer, P.; Jay, F.; Arnold, B.; Dharmasiri, N.; Estelle, M.; Voinnet, O.; Jones, J.D.G. A plant miRNA contributes to antibacterial resistance by repressing auxin signalling. Science 2006, 312, 436–439. [Google Scholar] [CrossRef] [Green Version]
  30. Ferrari, S.; Galletti, R.; Pontiggia, D.; Manfredini, C.; Lionetti, V.; Bellincampi, D.; Cervone, F.; Lorenzo, G.D. Transgenic Expression of a Fungal endo-Polygalacturonase Increases Plant Resistance to Pathogens and Reduces Auxin Sensitivity. Plant Physiol. 2008, 146, 323–324. [Google Scholar] [CrossRef] [Green Version]
  31. Ludwig-Müller, J. Auxin conjugation: Growing out of the shade. Nat. Plants 2016, 2, 16044. [Google Scholar] [CrossRef]
  32. Zou, X.P.; Long, J.H.; Zhao, K.; Peng, A.H.; Chen, M.; Qin, L.; Chen, Y.R.; Chen, S.C.; Liu, J.H. Overexpressing GH3.1 and GH3.1L reduces susceptibility to xanthomonas citri subsp. citri by repressing auxin signalling in citrus (citrus sinensis osbeck). PLoS ONE 2019, 14, e0220017. [Google Scholar] [CrossRef] [Green Version]
  33. Wang, H.; Jones, B.; Li, Z.G.; Frasse, P.; Delalande, C.; Regad, F.; Chaabouni, S.; Latche’, A.; Pech, J.C.; Bouzayen, M. The tomato Aux/IAA transcription factor IAA9 is involved in fruit development and leaf morphogenesis. Plant Cell 2005, 17, 2676–2692. [Google Scholar] [CrossRef] [PubMed] [Green Version]
  34. Audran-Delalande, C.; Bassa, C.; Mila, I.; Regad, F.; Zouine, M.; Bouzayen, M. Genome-Wide Identification, Functional Analysis and Expression Profiling of the Aux/IAA Gene Family in Tomato. Plant Cell Physiol. 2012, 53, 659–672. [Google Scholar] [CrossRef] [Green Version]
  35. Bassa, C.; Mila, I.; Bouzayen, M.; Audran-Delalande, C. Phenotypes Associated with Down-Regulation of Sl-IAA27 Support Functional Diversity Among Aux/IAA Family Members in Tomato. Plant Cell Physiol. 2012, 53, 1583–1595. [Google Scholar] [CrossRef] [Green Version]
  36. Guillotin, B.; Etemadi, M.; Audran, C.; Bouzayen, M.; Becard, G.; Combier, J.P. Sl-IAA27 regulates strigolactone biosynthesis and mycorrhization in tomato (var. MicroTom). N. Phytol. 2017, 213, 1124–1132. [Google Scholar] [CrossRef] [Green Version]
  37. Wu, L.M.; Wang, C.; He, L.G.; Wang, Z.J.; Tong, Z.; Song, F.; Tu, J.F.; Qiu, W.M.; Liu, J.H.; Jiang, Y.C.; et al. Transcriptome analysis unravels metabolic and molecular pathways related to fruit sac granulation in a late-ripening navel orange (citrus sinensis osbeck). Plants 2020, 9, 95. [Google Scholar] [CrossRef] [Green Version]
  38. De Jong, M.; Wolters-Arts, M.; Schimmel, B.-C.J.; Stultiens, C.L.M.; de Groot, P.-F.-M.; Powers, S.J.; Tikunov, Y.M.; Bovy, A.G.; Mariani, C.; Vriezen, W.H.; et al. Solanum lycopersicum AUXIN RESPONSE FACTOR 9 regulates cell division activity during early tomato fruit development. J. Exp. Bot. 2015, 66, 3405–3416. [Google Scholar] [CrossRef] [PubMed] [Green Version]
  39. Liu, X.; Dinh, T.T.; Li, D.; Shi, B.; Li, Y.; Cao, X.; Guo, L.; Pan, Y.; Jiao, Y.; Chen, X. AUXIN RESPONSEFACTOR 3 integrates the functions of AGAMOUS and APETALA2 in floral meristem determinacy. Plant J. 2014, 80, 629–641. [Google Scholar] [CrossRef] [PubMed] [Green Version]
  40. Krogan, N.T.; Yin, X.; Ckurshumova, W.; Berleth, T. Distinct subclades of Aux/IAA genes are direct targets of ARF5/MP transcriptional regulation. N. Phytol. 2014, 204, 474–483. [Google Scholar] [CrossRef]
  41. Weijers, D.; Jürgens, G. Auxin and embryo axis formation: The ends in sight? Curr. Opin. Plant Biol. 2005, 8, 32–37. [Google Scholar] [CrossRef]
  42. Rinaldi, M.A.; Liu, J.; Enders, T.A.; Bartel, B.; Strader, L.C. A gain-of-function mutation in iaa16 confers reduced responses to auxin and abscisic acid and impedes plant growth and fertility. Plant Mol. Biol. 2012, 79, 359–373. [Google Scholar] [CrossRef] [PubMed] [Green Version]
  43. Reed, J.W.; Wu, M.F.; Reeves, P.H.; Hodgens, C.; Yadav, V.; Hayes, S.; Pierik, R. Three auxin response factors promote hypocotyl elongation. Plant Physiol. 2018, 178, 864–875. [Google Scholar] [CrossRef] [Green Version]
  44. Sato, A.; Yamamoto, K.T. Overexpression of the non-canonical Aux/IAA genes causes auxin-related aberrant phenotypes in Arabidopsis. Physiol. Plant. 2008, 133, 397–405. [Google Scholar] [CrossRef] [PubMed]
  45. Domingo, C.; Andrés, F.; Tharreau, D.; Iglesias, D.J.; Talón, M. Constitutive expression of osgh3.1 reduces auxin content and enhances defense response and resistance to a fungal pathogen in rice. Mol. Plant Microbe Interact. 2009, 22, 201–210. [Google Scholar] [CrossRef] [Green Version]
  46. Khan, S.; Stone, J.M. Arabidopsis thaliana GH3.9 influences primary root growth. Planta 2007, 226, 21–34. [Google Scholar] [CrossRef] [Green Version]
  47. Takase, T.; Nakazawa, M.; Ishikawa, A.; Manabe, K.; Matsui, M. DFL2, a New Member of the Arabidopsis GH3 Gene Family, is Involved in Red Light-Specific Hypocotyl Elongation. Plant Cell Physiol. 2003, 44, 1071–1080. [Google Scholar] [CrossRef] [PubMed] [Green Version]
  48. Wang, J.; Sun, N.; Zhang, F.; Yu, R.; Wei, N. Differential regulation of Arabidopsis PP2C-D1 by SAUR17 and SAUR50 in apical hook development and cotyledon opening. Plant Cell 2020, 32, 3792–3811. [Google Scholar] [CrossRef]
  49. Zeng, Y.; Zhao, T.; Kermode, A.R. A conifer ABI3-interacting protein plays important roles during key transitions of the plant life cycle. Plant Physiol. 2012, 161, 179–195. [Google Scholar] [CrossRef] [PubMed] [Green Version]
  50. Qiu, T.; Qi, M.; Ding, X.; Zheng, Y.; Wang, J. The SAUR41 subfamily of SMALL AUXIN UP RNA genes is abscisic acid-inducible to modulate cell expansion and salt tolerance in Arabidopsis thaliana seedlings. Ann. Bot. 2019, 125, 805–819. [Google Scholar] [CrossRef] [Green Version]
  51. He, Y.J.; Liu, Y.; Li, M.Z.; Lamin-Samu, A.T.; Yang, D.-D.; Yu, X.L.; Izhar, M.; Jan, I.; Ali, M.; Lu, G. The Arabidopsis SMALL AUXIN UP RNA32 Protein Regulates ABA-Mediated Responses to Drought Stress. Front. Plant Sci. 2021, 12, 259. [Google Scholar] [CrossRef]
  52. Mambro, D.R.; Svolacchia, N.; Dello Ioio, R.; Pierdonati, E.; Salvi, E.; Pedrazzini, E.; Vitale, A.; Perilli, S.; Sozzani, R.; Benfey, P.-N.; et al. The Lateral Root Cap Acts as an Auxin Sink that Controls Meristem Size. Curr. Biol. 2019, 29, 1199–1205.e4. [Google Scholar] [CrossRef] [Green Version]
  53. Spartz, A.K.; Sang, H.L.; Wenger, J.P.; Gonzalez, N.; Itoh, H.; Inzé, D.; Peer, W.A.; Murphy, A.S.; Overvoorde, P.J.; Gray, W.M. The SAUR19 subfamily of SMALL AUXIN UP RNA genes promote cell expansion. Plant J. 2012, 70, 978–990. [Google Scholar] [CrossRef] [Green Version]
  54. Overvoorde, P.J.; Okushima, Y.; Alonso, J.M.; Chan, A.; Chang, C.; Ecker, J.R.; Hughes, B.; Liu, A.; Onodera, C.; Quach, H.; et al. Functional genomic analysis of the AUXIN/INDOLE-3-ACETIC ACID gene family members in Arabidopsis thaliana. Plant Cell 2005, 17, 3282–3300. [Google Scholar] [CrossRef] [Green Version]
  55. Cao, F.Y.; Yoshioka, K.; Desveaux, D. The roles of ABA in plant–pathogen interactions. J. Plant. Res. 2011, 124, 489–499. [Google Scholar] [CrossRef] [PubMed]
  56. Nakashima, K.; Fujita, Y.; Kanamori, N.; Katagiri, T.; Umezawa, T.; Kidokoro, S.; Maruyama, K.; Yoshida, T.; Ishiyama, K.; Kobayashi, M.; et al. Three Arabidopsis SnRK2 protein kinases, SRK2D/SnRK2.2, SRK2E/SnRK2.6/OST1 and SRK2I/SnRK2.3, involved in ABA signaling are essential for the control of seed development and dormancy. Plant Cell Physiol. 2009, 50, 1345–1363. [Google Scholar] [CrossRef] [PubMed] [Green Version]
  57. Cao, M.-J.; Zhang, Y.L.; Liu, X.; Huang, H.; Zhou, X.E.; Wang, W.L.; Zeng, A.; Zhao, C.Z.; Si, T.; Du, J.M.; et al. Combining chemical and genetic approaches to increase drought resistance in plants. Nat. Commun. 2017, 8, 1183. [Google Scholar] [CrossRef]
  58. Ji, H.L.; Kyndt, T.; He, W.; Vanholme, B.; Gheysen, G. β-Aminobutyric Acid–Induced Resistance Against Root-Knot Nematodes in Rice Is Based on Increased Basal Defense. Mol. Plant Microbe Interact. 2015, 28, 519–533. [Google Scholar] [CrossRef] [Green Version]
  59. Tran, L.S.P.; Urao, T.; Qin, F.; Maruyama, K.; Kakimoto, T.; Shinozaki, K.; Yamaguchi-Shinozaki, K. Functional analysis of ahk1/athk1 and cytokinin receptor histidine kinases in response to abscisic acid, drought, and salt stress in Arabidopsis. Proc. Natl. Acad. Sci. USA 2007, 104, 20623–20628. [Google Scholar] [CrossRef] [Green Version]
  60. De Torres-Zabala, M.; Truman, W.; Bennett, M.; Lafforgue, G.; Mansfield, J.; Egea, P.; Bögre, L.; Grant, M. Pseudomonas syringae pv. tomato hijacks the Arabidopsis abscisic acid signalling pathway to cause disease. EMBO J. 2007, 26, 1434–1443. [Google Scholar] [CrossRef] [PubMed]
  61. Galstyan, A.; Nemhauser, J.L. Auxin promotion of seedling growth via ARF5 is dependent on the brassinosteroid-regulated transcription factors BES1 and BEH4. Plant Direct 2019, 3, e0016. [Google Scholar] [CrossRef] [Green Version]
Figure 1. (a): Stiff fruit in the tree show abnormal shape and stagnant development. (b): Healthy fruit in the tree show spherical shape and well-development. (c): Stiff fruit fail to mature and keep abnormal shape when healthy fruit is ripe. (d): Ripe healthy fruit show red color and spherical shape.
Agriculture 12 00012 g001
Figure 2. (a): Different expression genes’ heatmaps. The abscissa is simple name, and the integration is gene. Red color represents high expression genes, and green color indicates low expression genes; (b): different expression genes volcano map. The abscissa is log2foldchange, and the integration is −log10 (p-value). The two vertical dashed lines in the figure are 2 times expressed difference threshold, the transverse line is a p-value = 0.05 threshold. The red color dot indicates that the group is up-regulated, the blue color dot indicates that the group is reduced, and the ash represents a non-significant difference expression gene.
Agriculture 12 00012 g002
Figure 3. (a): GO enrichment analysis bubble map. The figure abscissa is Rich factor, and the figure integration is GO term. Rich factor is positively correlated with enrichment, and the FDR value is negatively correlated with enrichment; (b): top GO terms. The figure abscissa is GO level 2 term name, and the figure integration is −log10 (p-value).
Agriculture 12 00012 g003
Figure 4. (a) KEEG enrichment analysis bubble map. The abscissa is rich factor, and the integration is KEEG pathway. Rich factor is positively correlated with enrichment, and the FDR value is negatively correlated with enrichment; (b) top KEEG pathways. The abscissa KEEG pathway name, and the integration is −log10 (p-value).
Agriculture 12 00012 g004
Figure 5. (a): Different accumulated metabolites volcano map. The abscissa is log2foldchange, and the integration is −log10 (p-value). The red color dot indicates that the metabolite is up-regulated, the blue color dot indicates that the metabolite is reduced, and the ash represents a non-significant difference expression metabolite; (b): KEEG pathway analysis treemap plot. Each block represents an enriched metabolic pathway, each block size indicates that the impact of the pathway in topology analysis. The color of each block shows the enrichment of pathway.
Agriculture 12 00012 g005
Figure 6. Heatmap of phytohormones.
Agriculture 12 00012 g006
Table 1. Log2FC, −∆∆Ct, and relative expression values of selected genes.
Genelog2FC(FR3/CKfr)∆∆CtRelative Expression
Pav_sc0000998.1_g200.1.mk (IAA4)2.313.7313.29
Pav_sc0002327.1_g560.1.mk (IAA9)1.533.3610.25
Pav_sc0000716.1_g230.1.mk (IAA17)1.132.264.78
Pav_sc0000478.1_g250.1.mk (IAA31)2.493.6612.62
Pav_sc0000752.1_g190.1.br (SAUR20)/3.8214.17
Pav_sc0000586.1_g800.1.mk (SAUR32)2.664.3420.21
Pav_sc0001583.1_g270.1.br (SAUR72)1.522.927.55
Pav_sc0004359.1_g050.1.br (ARF5)4.923.068.31
Pav_sc0002250.1_g170.1.mk (ARF9)1.444.8228.27
Pav_sc0000049.1_g070.1.mk (GH3.1)1.502.294.90
Pav_sc0001540.1_g090.1.mk (GH3.17)4.81//
Pav_sc0000554.1_g390.1.mk (PP2CA)1.462.224.66
Pav_sc0000848.1_g040.1.mk (AHP2)2.602.545.80
Pav_sc0000157.1_g130.1.mk (AHK2)1.495.1535.45
Pav_sc0001335.1_g500.1.mk (PYL8)1.261.903.73
Pav_sc0001242.1_g120.1.mk (SnRK2.3)1.293.098.53
Pav_sc0008321.1_g030.1.mk (TGA10)4.194.9430.72
Pav_sc0004469.1_g010.1.br (ARG7)3.794.2018.36
Pav_sc0000567.1_g900.1.mk (PAN)2.293.7213.19
Pav_sc0000568.1_g810.1.br (PR1a)4.94//
Pav_co4011651.1_g010.1.br (PRB1)3.283.4410.85
Pav_sc0006499.1_g050.1.mk (MYC2)1.963.209.21
Pav_sc0002181.1_g160.1.mk (IAA11)−2.78//
Pav_sc0000545.1_g110.1.mk (IAA12)−5.76−3.990.06
Pav_sc0000800.1_g500.1.mk (IAA26)−2.43−1.420.37
Pav_sc0000212.1_g380.1.mk (IAA27)−2.28−0.810.57
Pav_sc0000568.1_g290.1.br (SAUR24)−4.29−1.490.35
Pav_sc0000395.1_g310.1.mk (SAUR40)/−5.240.03
Pav_sc0001248.1_g030.1.mk (SAUR50)−3.85−1.090.47
Pav_sc0000752.1_g020.1.mk (SAUR71)−1.170.391.31
Pav_sc0000373.1_g220.1.mk (LAX2)−3.82−3.050.12
Pav_sc0001900.1_g150.1.mk (ARF3)−2.58−3.040.12
Pav_sc0000852.1_g400.1.mk (CYCD3-1)−1.57−0.500.71
Pav_sc0001807.1_g180.1.mk (CYCD3-2)−2.50−1.100.47
Pav_sc0009346.1_g010.1.mk (AREB3)−1.560.081.05
Pav_sc0000893.1_g690.1.mk (WOL)−4.27−4.790.036
Pav_sc0000700.1_g840.1.mk (AHP1)−1.99−1.020.49
Pav_sc0001801.1_g110.1.mk (TGA9)−2.31−1.160.45
Pav_sc0000848.1_g820.1.mk (GH3.9)///
Pav_sc0002360.1_g300.1.mk (GH3.10)−3.14−1.190.44
Pav_sc0001341.1_g250.1.mk (PYL4)−1.80−0.460.73
The ‘/’ mean value of this item cannot be calculated, as numerator or denominator is zero.
Publisher’s Note: MDPI stays neutral with regard to jurisdictional claims in published maps and institutional affiliations.

