Article

Evaluation of Drought Tolerance in Maize Inbred Lines Selected from the Shaan A Group and Shaan B Group

The Key Laboratory of Biology and Genetic Improvement of Maize in Arid Area of Northwest Region, Maize Engineering & Technology Research Centre, Ministry of Agriculture and Rural Affairs, College of Agronomy, Northwest A&F University, Xianyang 712100, China
*
Author to whom correspondence should be addressed.
Agriculture 2022, 12(1), 11; https://doi.org/10.3390/agriculture12010011
Submission received: 5 November 2021 / Revised: 16 December 2021 / Accepted: 16 December 2021 / Published: 22 December 2021
(This article belongs to the Special Issue Optimizing Grain Yield and Water Use Efficiency in Maize Production)

Abstract

:
Drought is one of the most prevailing abiotic stresses affecting the growth, development, and productivity of maize. Knowledge of drought tolerance could help in maize improvement. However, less research has been done to comprehensively evaluate the drought tolerance of maize inbred lines. We used 27 elite maize inbred lines selected from Shaan A group and Shaan B group breeding populations to estimate their drought tolerance in 3 years 2 locations under normal field conditions and low irrigation. Using principal component analysis (PCA) and GGE biplots, all inbred lines, including the controls, could be divided into four types. Ten lines could be categorized as the high-yield drought-resistant type (‘KB081’, ‘KA105’, ‘KB417’, ‘KB215’, ‘KB-7’, ‘2013KB-37’, ‘KA203’, ‘2012KA-34’, ‘KA225’, and ‘91227’) because of their stability and wide adaptability. Compared with the controls, a large proportion of the inbred lines selected from Shaan A and Shaan B breeding populations demonstrated higher drought resistance. Our results suggest that multi-year drought screening can be used as a tool to improve the drought resistance of maize inbred lines and provide a scientific basis for making better use of the Shaan A and Shaan B maize inbred lines to breed new varieties and to identify existing drought-resistant maize varieties.

1. Introduction

With the increase in global warming caused by human activities, drought has become more serious. The agricultural losses caused by drought are equivalent to 60% of the losses attributed to all climatic disasters. Water shortage has become a serious ecological problem that restricts the development of global agricultural production [1]. In China, drought is the most common and most influential climatic disaster, with the average area affected by drought annually being 2 × 10⁷ ha, which accounts for about one-sixth of the total cultivated land in China [2]. Maize is a staple crop that has some of the highest yield and planting areas all over the world, and thus improving its productivity and decreasing the effect of drought is an urgent problem. It has been proven that the large-scale cultivation and promotion of stress-resistant varieties in production is the most important reason for the increased maize production, due especially to the development of breeding processes [3]. More research supports the concept that production is equivalent to or reflects stress resistance [3]. In other words, the increased stress resistance of maize varieties has contributed to the increase in yield [4]. Therefore, improving drought resistance in maize has become an important problem in the development of new varieties. The first step is to identify drought-resistant materials. Previous studies have suggested that the tolerance of maize hybrids is inherited from both parents [5]. When the inbred lines have drought tolerance, the hybrids also have drought tolerance. On the contrary, if the inbred lines have weak drought tolerance, their hybrids are also relatively weak in drought tolerance [6]. Therefore, exploring the drought tolerance of maize inbred lines and breeding new drought-tolerant varieties have become important ways to improve maize yield.
The ultimate goal of agricultural production is to achieve maximum crop yields for optimal economic benefits. The yield of genotypes under drought stress and in a suitable growing environment can be used as a criterion for judging whether the variety is satisfactory in a habitat with unknown rainfall [7]. The research of Monneveux et al. [8] on maize yield and its components also indicates that yield is feasible and effective in a drought resistance study. Therefore, using yield to evaluate the drought tolerance of maize inbred lines is the most direct and reliable.
At present, there are many germplasm resources collected and preserved in China [9]. Exploring and utilizing germplasm resources were of great significance to China’s corn production. But the research on drought-tolerant breeding of maize in China is still in its infancy, and the research on germplasm resources is lagging. It is urgent to excavate drought-tolerant genes, identify drought-tolerant materials, and study drought-tolerant germplasm improvement techniques.
The aims of this study were to (i) evaluate and screen the drought resistance of maize inbred lines planted in several environments, and (ii) optimize Shaan A group and Shaan B group varieties and provide a scientific basis for breeding new maize varieties.

2. Materials and Methods

Twenty-seven maize inbred lines were selected for the study from the Shaan A group and Shaan B group, as well as four controls (ZHENG58, CHANG7-2, PH6WC, and PH4CV). Shaan A group and Shaan B group varieties were developed by the Key Laboratory of Biology and Genetic Improvement of Maize in the Arid Area of Northwest Region at Northwest A&F University. According to the theory of maize breeding in China and overseas, we simplified the model of heterosis, adopted two-way promotion and two-way clustering breeding strategies, and established the dominant groups of Shaan A and Shaan B. Drought resistance was achieved through artificial selection and implementing a 30-point joint improvement in seven rounds from 2009 to 2015, a multisite, high-density technical route with low fertilization and low irrigation. Details of the source of the material are shown in Table 1.
The experiment was conducted in 2015, 2016 and, 2017 at the Yangling Maize Experimental Base (34°16′ N, 108°40′ E) at the Northwest A&F University and Yulin Academy of Agricultural Sciences (38°30′ N, 109°77′ E) in Shaanxi Province. Yangling is a semihumid and semiarid climate zone of East Asia, with an average annual temperature of 12.9 °C and average annual precipitation of 635.1 mm. Yulin has a semiarid continental monsoon climate from the warm temperate zone to the mid-temperate zone, with an average annual temperature of 8 °C and average annual precipitation of about 400 mm. A split-plot design was adopted, with two rows per plot, a row length of 5 m with a row spacing of 0.6 m, and a density of 67,500 plants per ha. Two rows of border rows were planted around the plots. Two irrigation treatments were applied. The control treatment ensured sufficient water supply throughout the entire growth period, and the drought stress was imposed from the beginning of the V12 stage to the flowering stage, the soil water content naturally drops to 10–12% (to achieve moderate drought). During this planting season, the amount of water used is about 1500 m3/hm2. The experiment was conducted with three replicates.
All material was harvested at the ripening stage and the yield was calculated. The corn grain moisture content was measured with a corn moisture apparatus (PM-8188, Kett, Tokyo, Japan) and the yield was calculated at a standard moisture content of 14%.
Various indices for estimating drought tolerance based on production have been used: the stress susceptibility index (SSI) [10], the yield stability index (YSI) [11], the tolerance index (TOL) [12], mean productivity (MP) [12], geometric mean productivity (GMP) [13], the stress tolerance index (STI) [13], and the drought resistance index (DRI) [14]. These are calculated as follows
S S I = 1 ( Y s ÷ Y p ) 1 ( Y s i ÷ Y p i ) ; Y S I = Y s Y p ; T O L = Y p Y s ; M P = Y s + Y p 2 ; G M P = Y s × Y p ; S T I = Y s × Y p Y p i × Y p i ; D R I = Y s i × Y s Y s i ;
where Ys is the yield of a variety under water stress, Yp is the yield of a control variety, Ysi is the average yield of all the varieties under stress, and Ypi is the average yield of all the control varieties.
SAS (Statistics Analysis System) was used to assess the Best linear unbiased prediction (BLUP), and a mixed linear model for each line was applied as follows:
y i = μ + G i + E i + e i
where yi is the phenotypic value; μ is the grand mean value of the total yield in all environments; Gi is the genotype effect; Ei is the environment effect, and ei is the random error. Genotype effect and environment effect were random effects, with The others assumed to be fixed.
Data were collated with Microsoft Excel 2016 (Microsoft Corporation, Redmond, WA, USA) and best linear unbiased predictors (BLUPs) were used to calculate the breeding value of each inbred line. The SAS version 9.2 package (North Carolina State Univ., Cary, NC, USA) was used for ANOVA, OriginPro 2016 (OriginLab, Northampton, MA, USA) was used for Three-dimensional mapping, GenStat (VSN International Ltd. Guanzhou, China) was used for PCA and GGE biplot mapping, and SPSS version 19.0 (IBM, Armonk, NY, USA) was used for statistical analysis and correlation.

3. Results

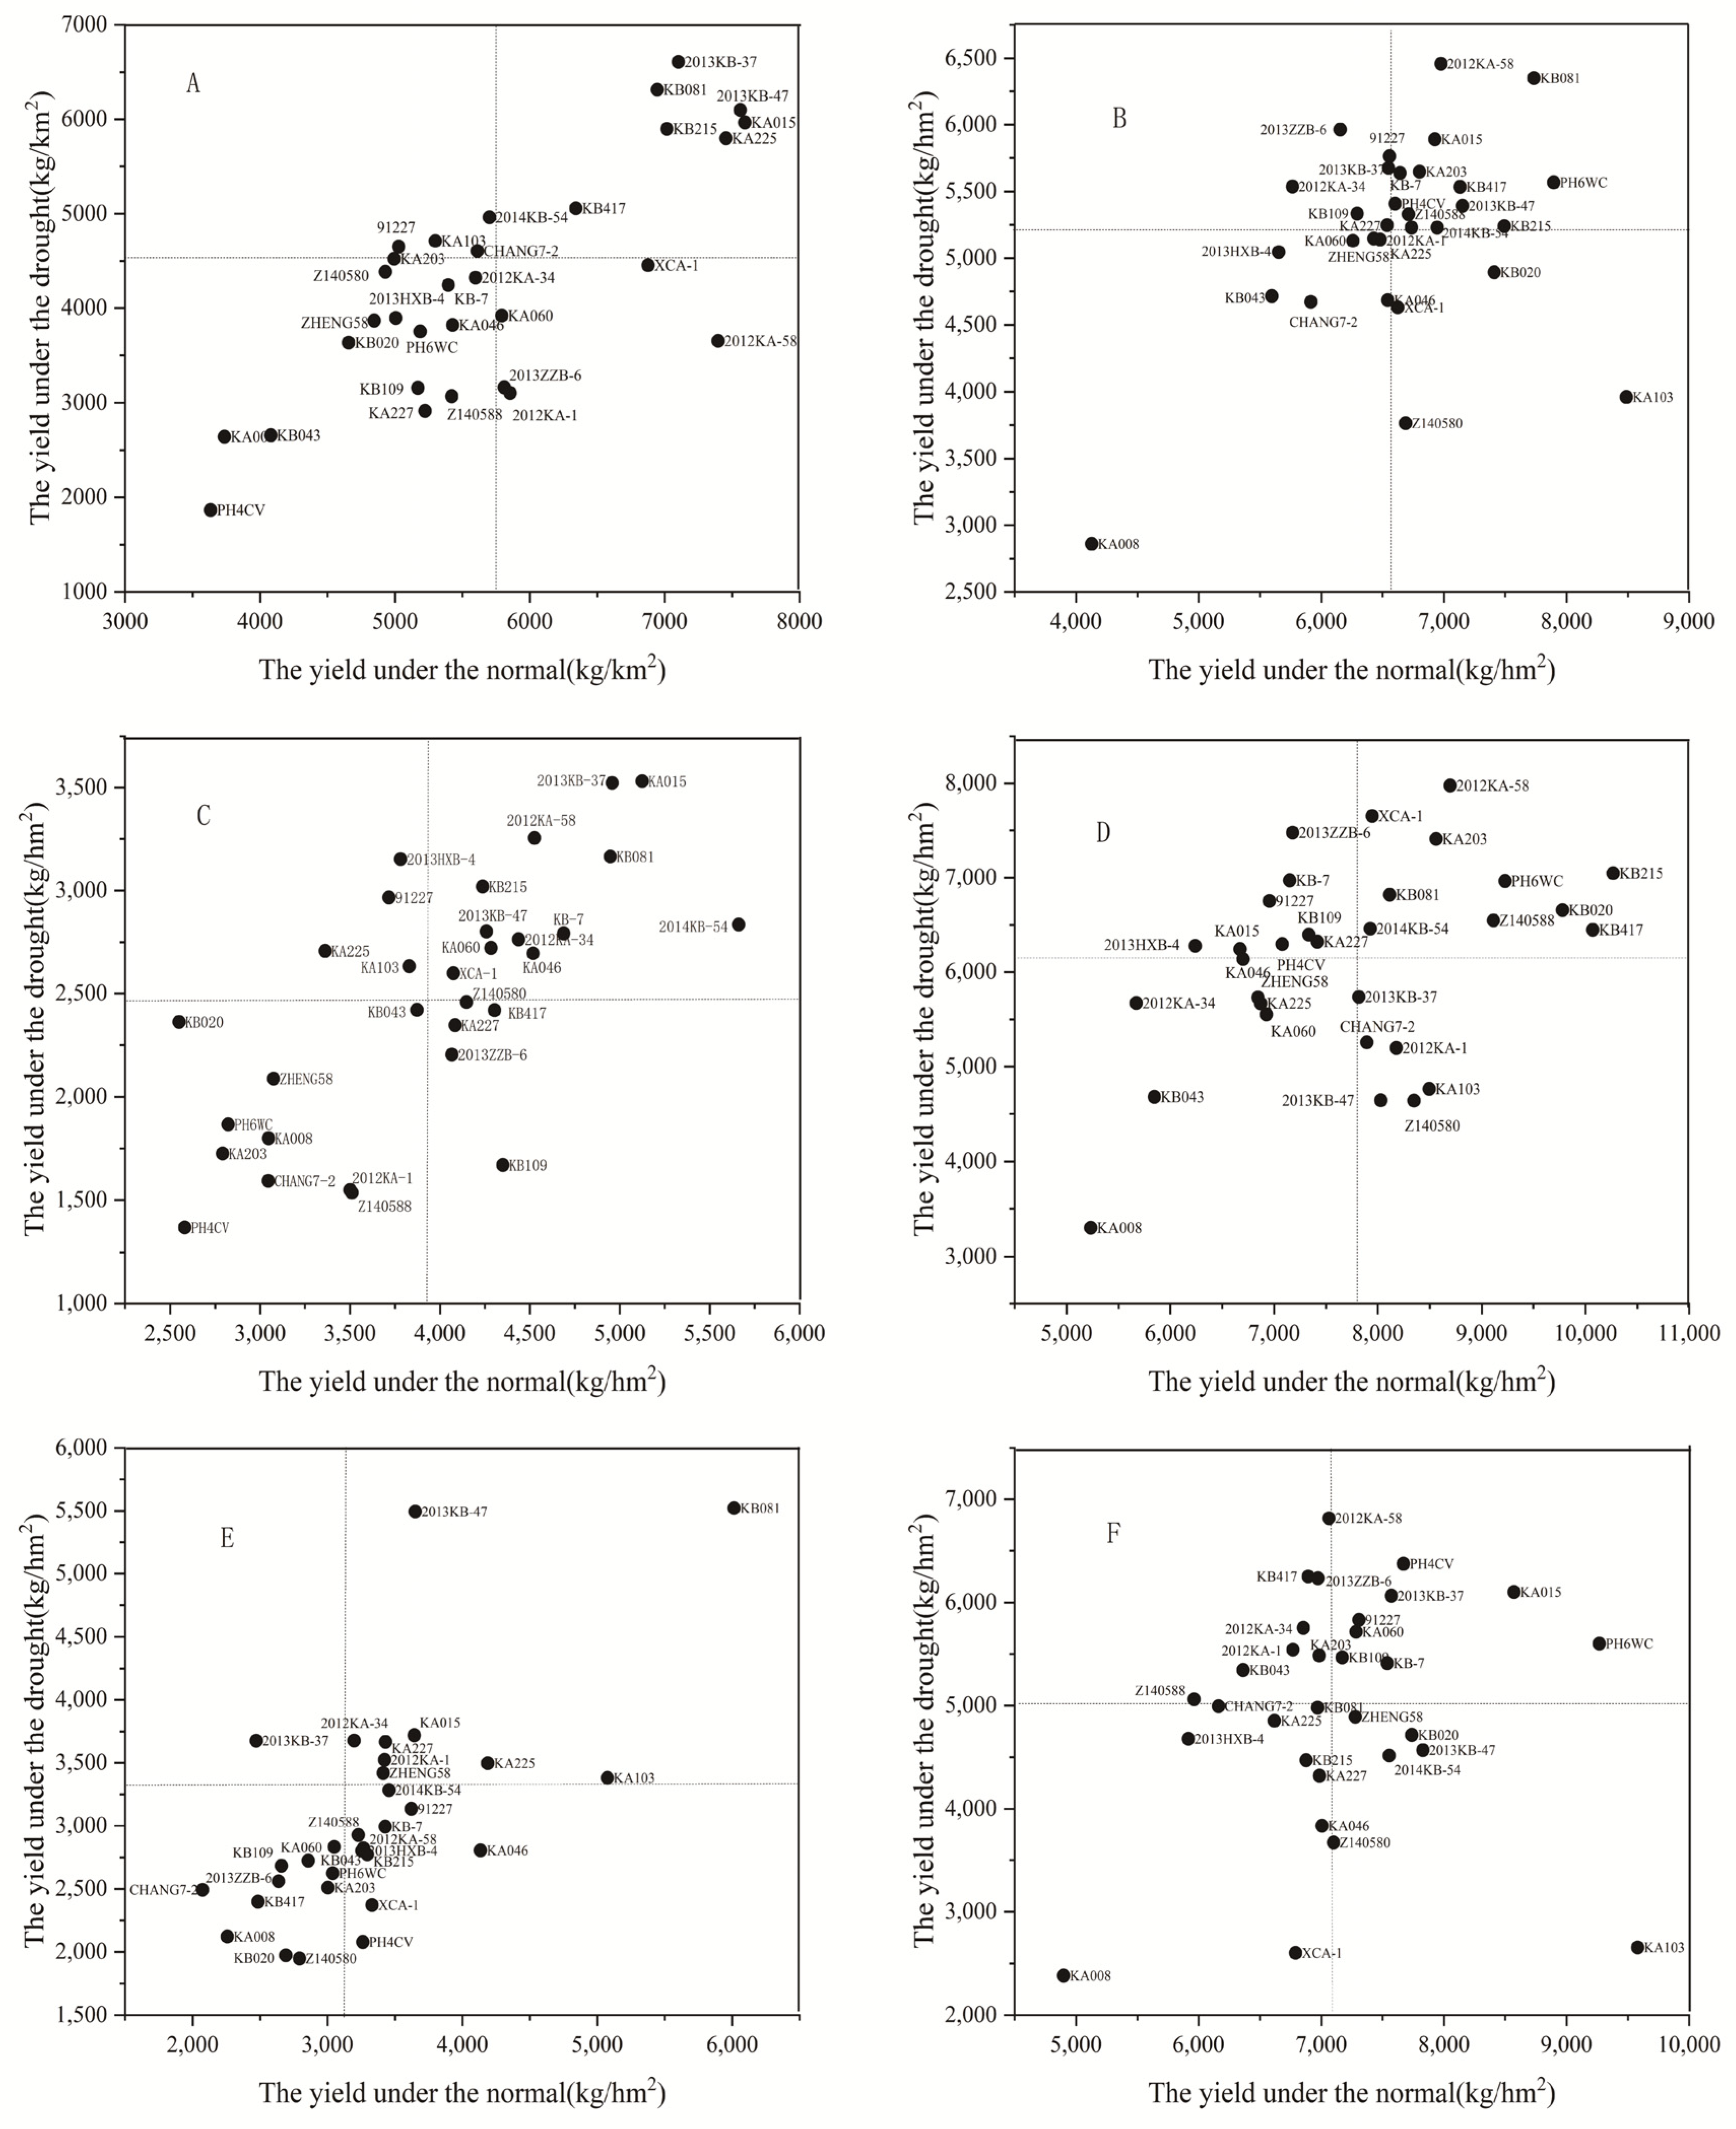
3.1. Yield Analysis and ANOVA

The scatter plot analysis of the inbred lines under two different water treatments at two different locations in the 3 years and the average yield under drought and normal conditions are shown in Figure 1. The first quadrant contains the relatively drought-resistant varieties overall 3 years at both locations: KA105, KB081, 2013KB-37, KB215, KB417, KB-7, 2013KB-47, XCA-1, 2014KB-54, 2012KB-34, and KA225. This indicates that these inbred lines have a certain degree of stability and wide adaptability.
The ANOVA results (Table 2) showed that the differences among the genotypes, treatments, and environments were significant. The difference between environments was the greatest, indicating wide differences between different locations in different years. This may be because Yangling and Yulin are in two different ecosystem types or the different climate conditions over the years. To better capture environmental errors and to accurately analyze the differences in drought resistance between different genotypes, the BLUPs of yield under normal conditions and drought stress were calculated from the yield data of both locations in all 3 years (Table 3). The results are shown in Table 3. The other drought tolerance indicators were calculated using BLUP as shown in Table 3. The PCA and GGE analyses were performed using drought tolerance indicators.

3.2. Correlation Analysis

The correlation coefficients among BLUPs for control conditions (control BLUPs), BLUPs for the drought stress treatment, and the drought tolerance indices were also analyzed (Table 4). It can be seen that the correlations between control BLUPs and MP, GMP, and STI are high, but the correlation between drought stress BLUPs and MP, GMP, STI, and DRI are higher, so the three indices MP, GMP, and STI should be the preferred indicators for screening drought-tolerant maize varieties.
Out of these three indices, GMP was highly correlated with the control BLUPs and drought stress BLUPs, so it can be used as an indicator for screening drought-tolerant varieties. A three-dimensional map of the control BLUPs, the drought-stress BLUPs, and GMP is shown in Figure 2. The inbred lines are more intuitively classified according to their performance under stress and non-stress conditions, which provides a basis for subsequent analysis. It can be clearly seen that 2013KB-37, KB215, KB081, KA105, KA203, 2013KB-47, KB-7, 2013ZZB-6, KA225, and 91227 not only have high yield under normal conditions but also have high yield under drought conditions. Thus the inbred lines will be selected for subsequent breeding programs in the future.

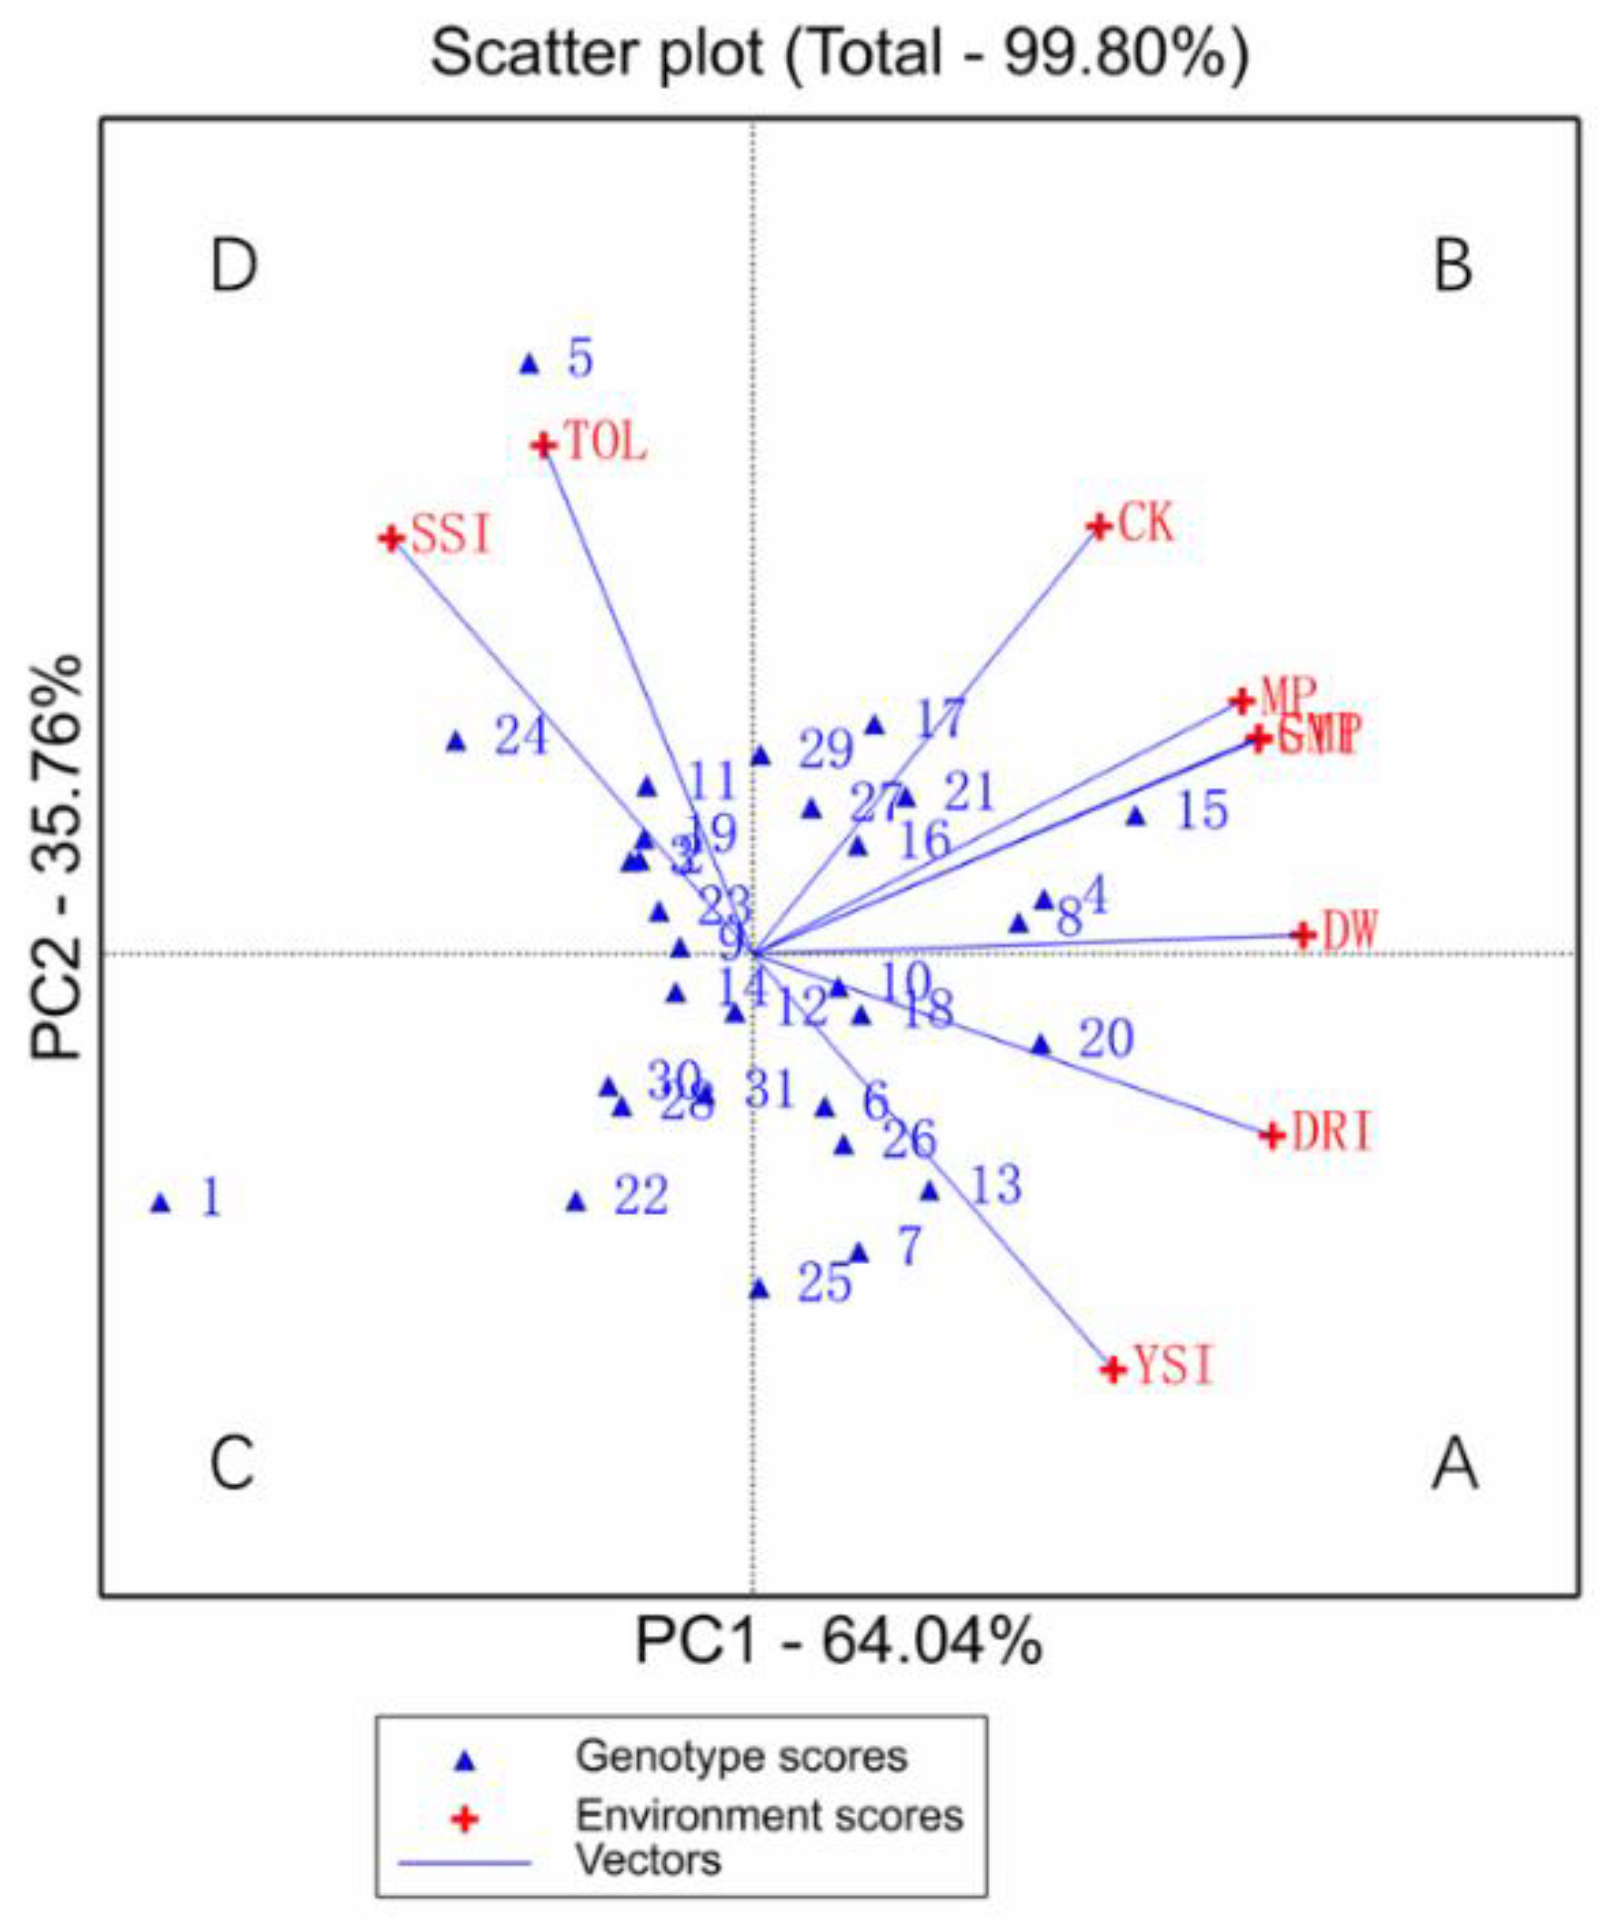
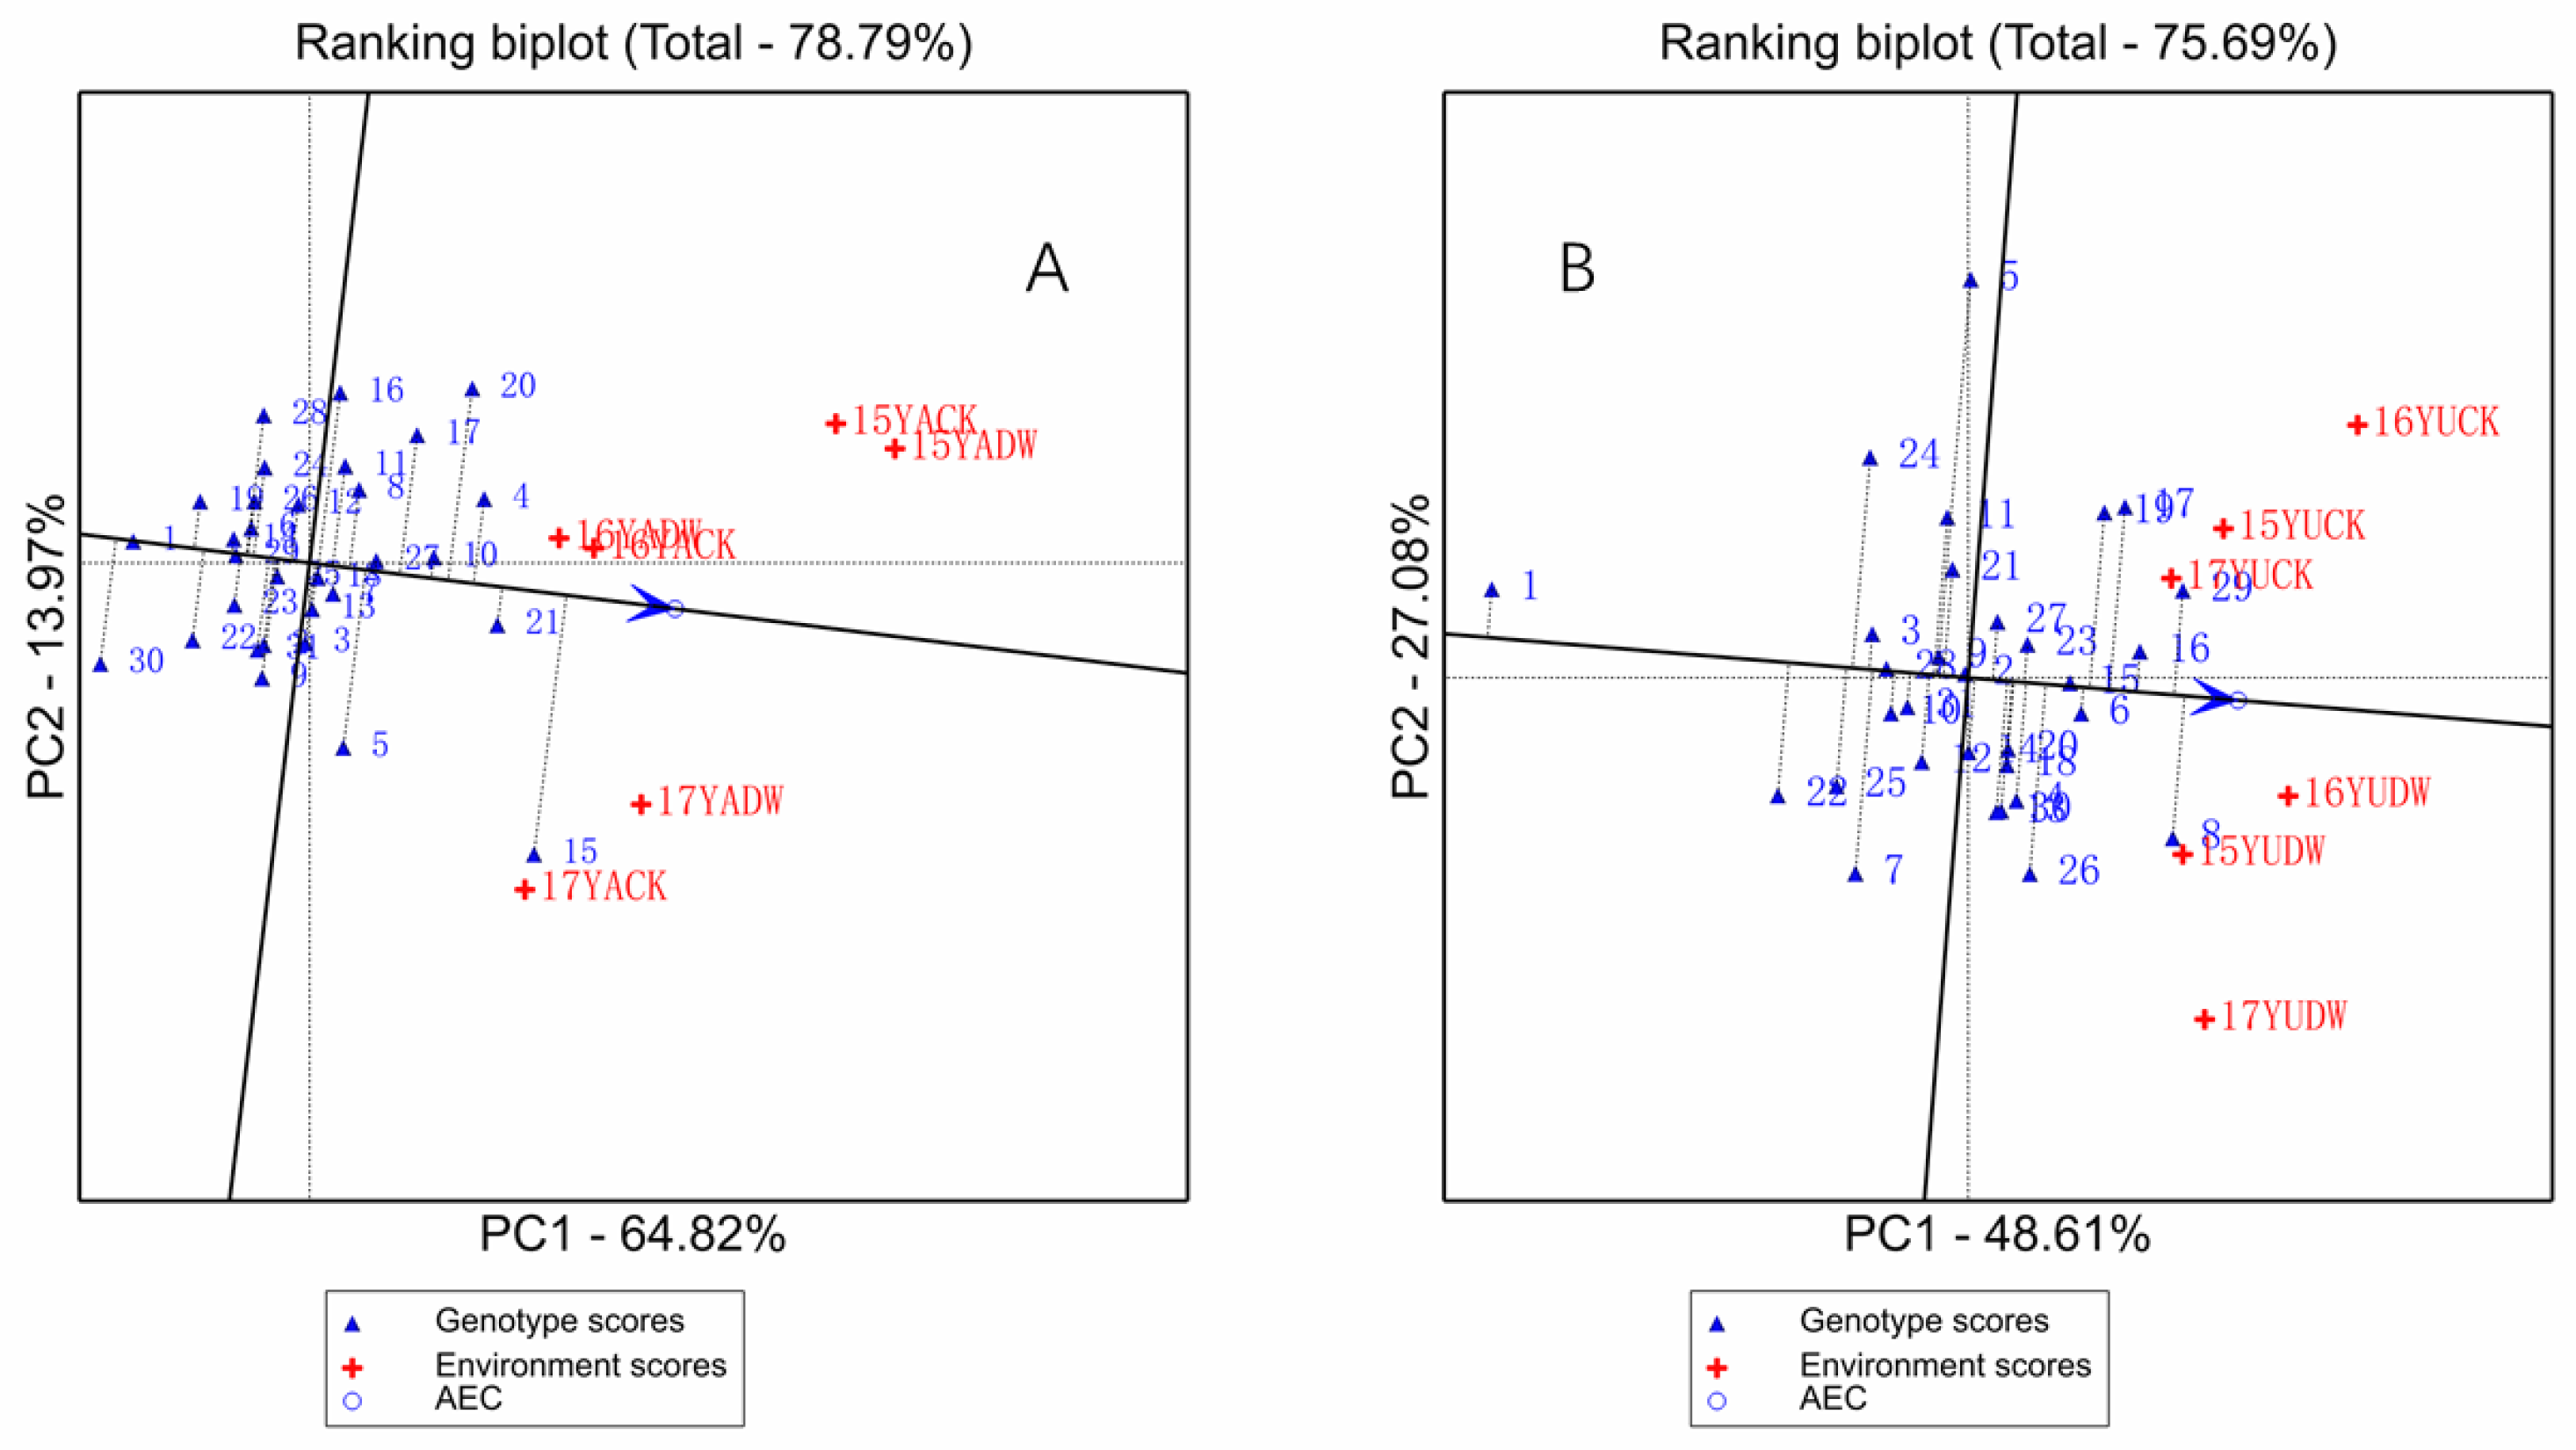
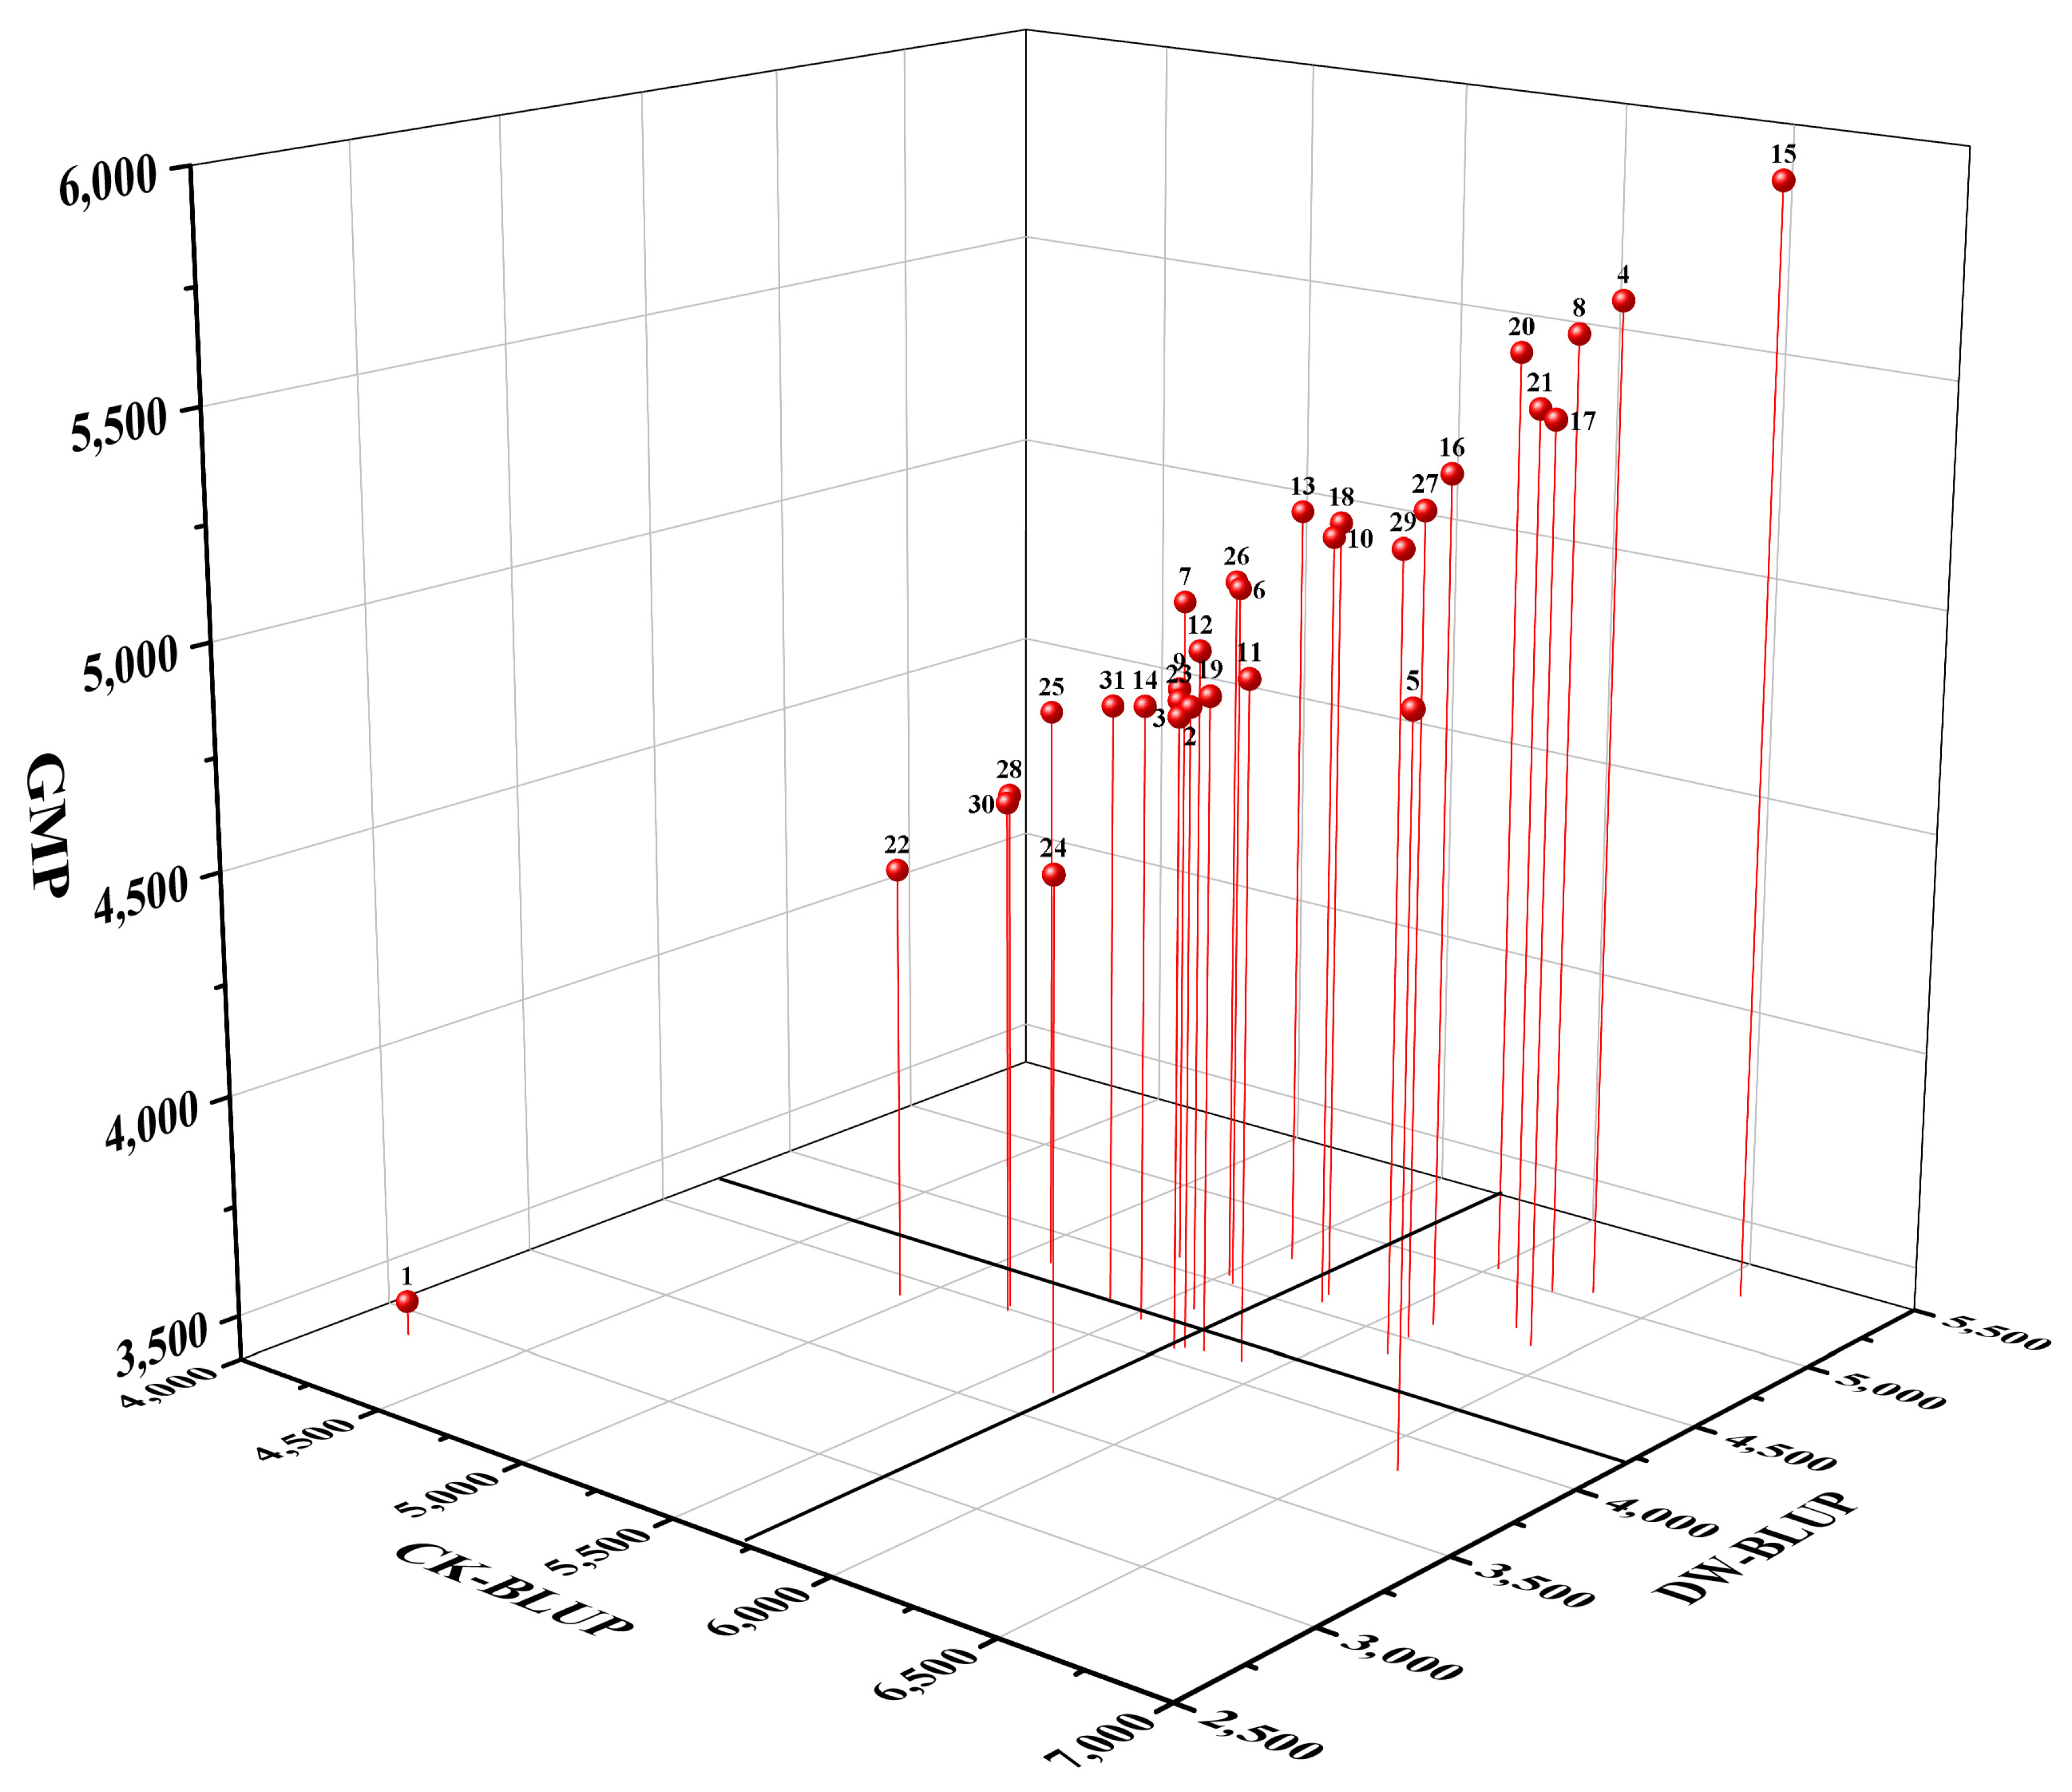
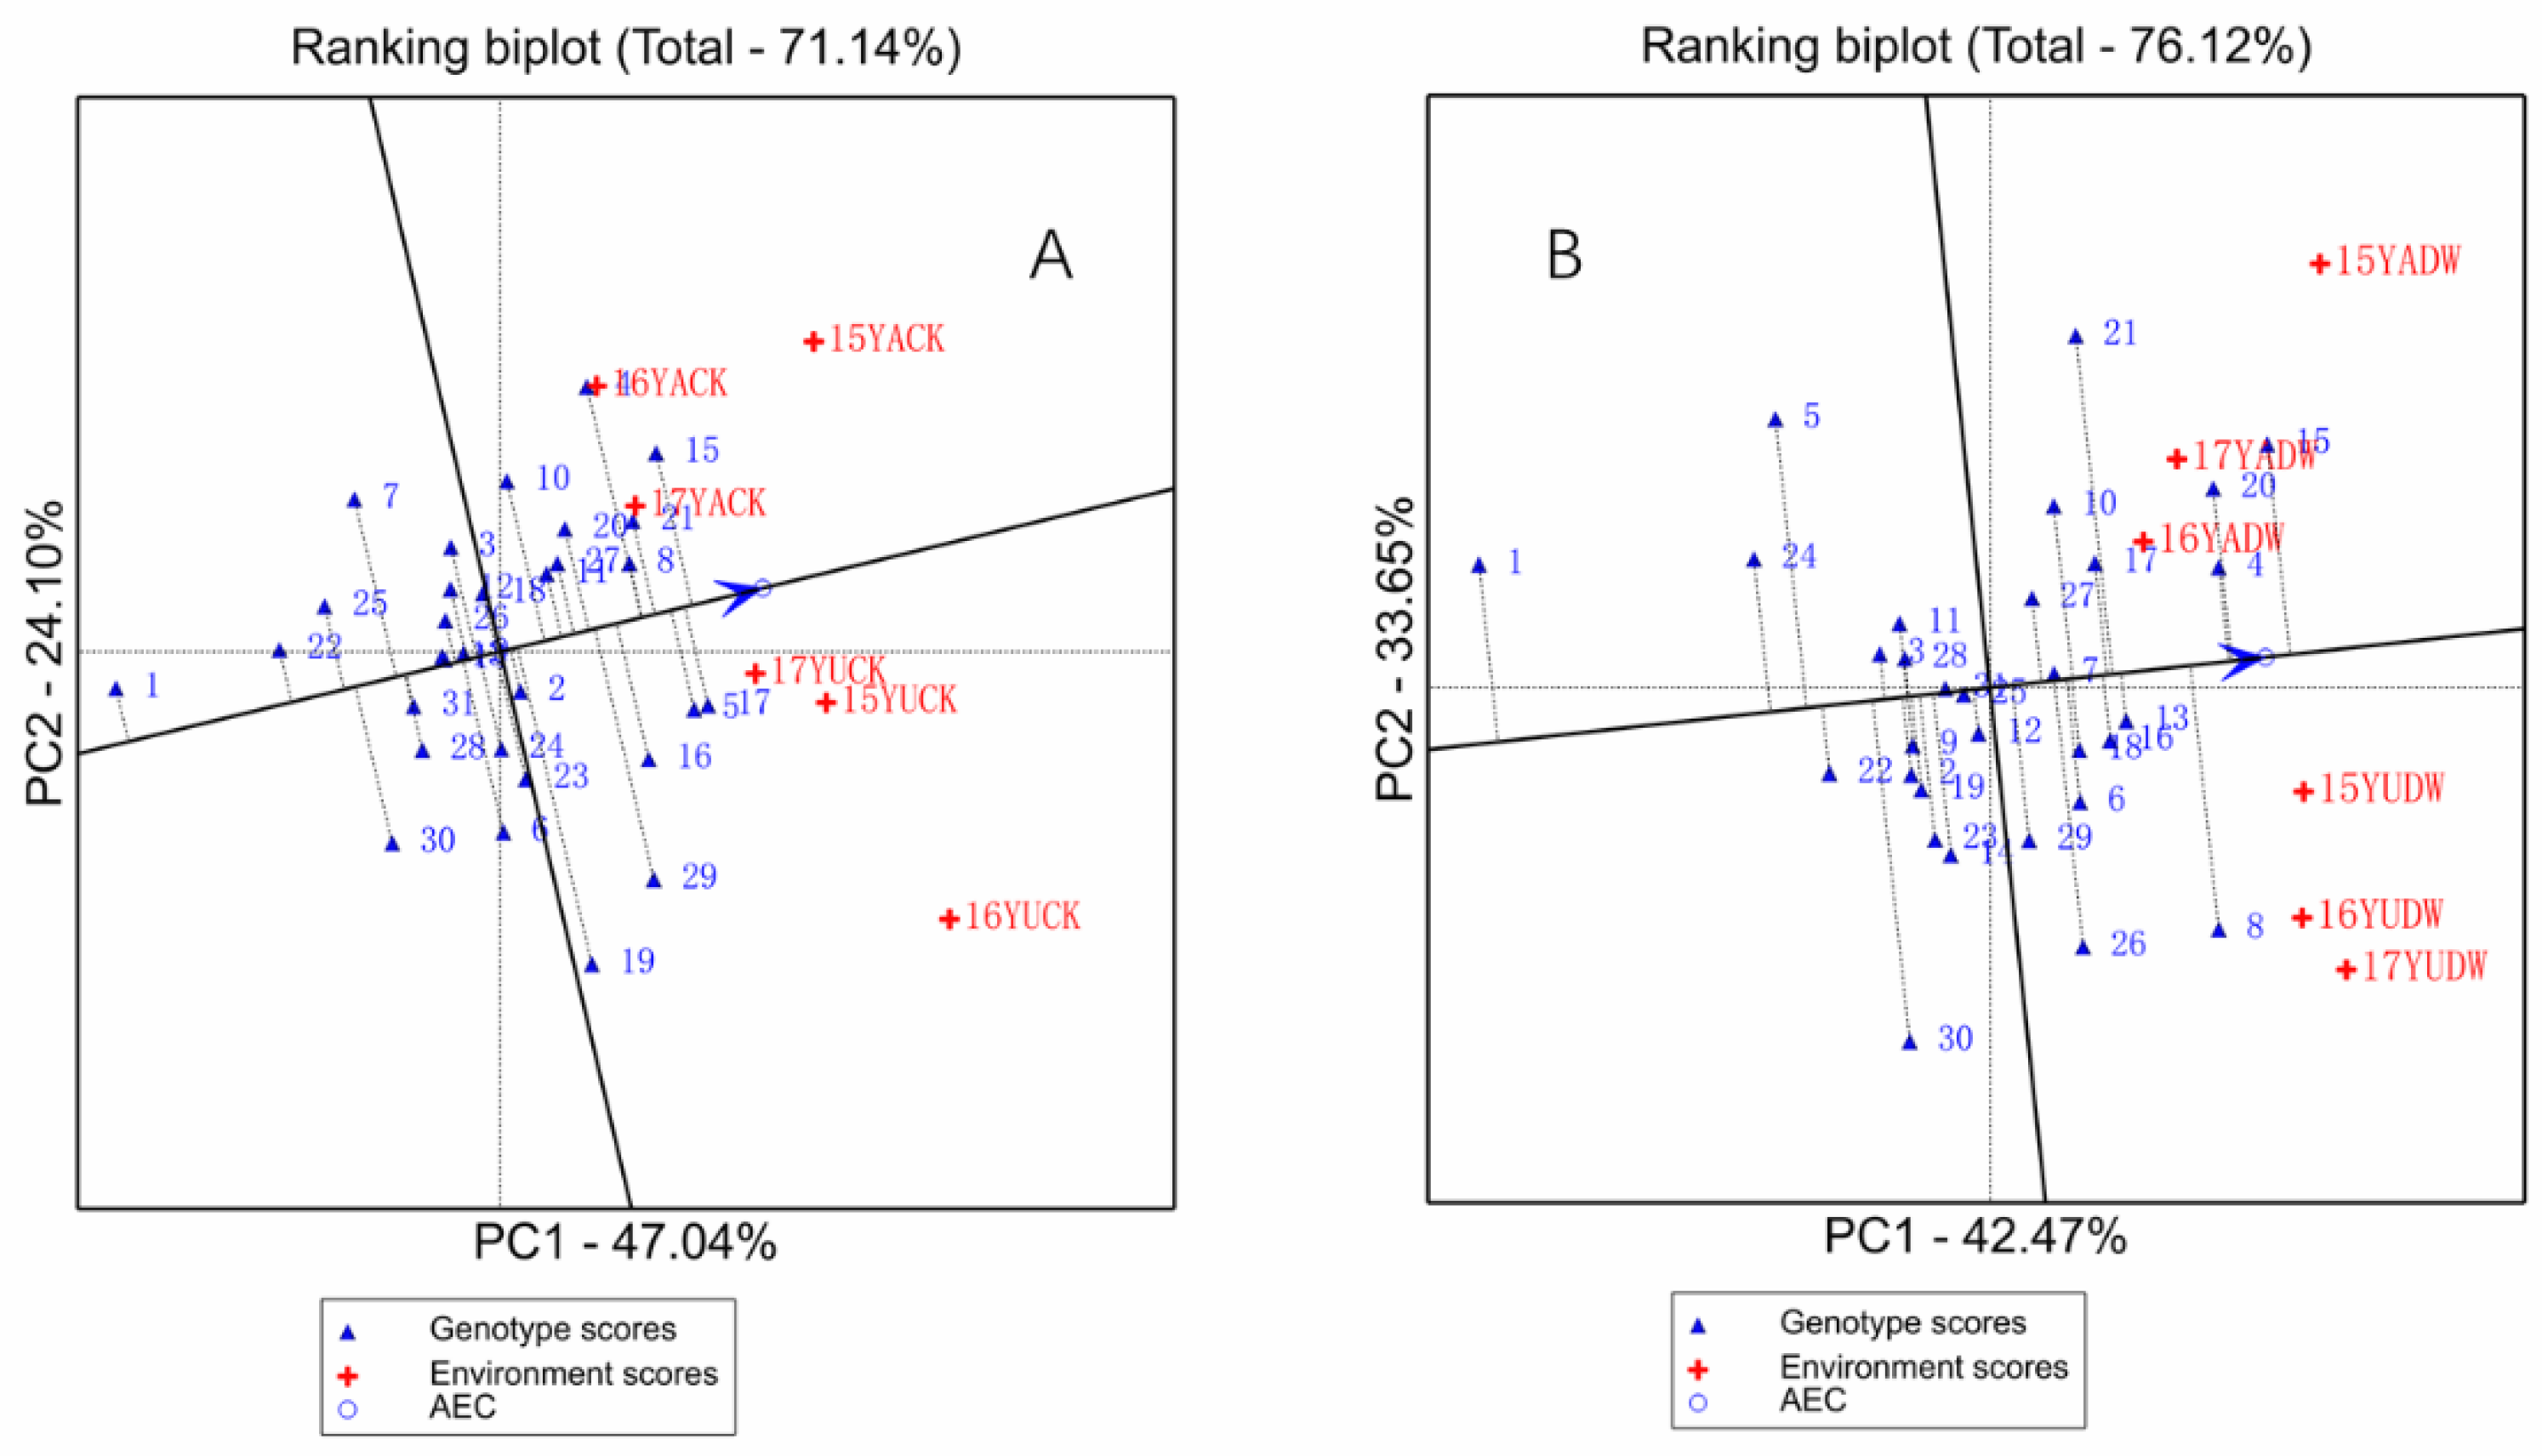
3.3. Principal Component Analysis and GGE Biplot Graphical Display

Principal component analysis (PCA) showed that the contribution rate of the first principal component was 64.04%, in which GMP, STI, and DRI had the highest positive coefficients under both conditions (Table 5). Therefore, the first principal component can be referred to as the drought-tolerant high-yield component. When the first principal component was larger, this indicated better drought resistance and yield in the inbred lines, such as was found by Kumar et al. [15]. The contribution rate of the second principal component was 35.76%, in which SSI, YIS, and TOL had the highest positive coefficients under both conditions. The second principal component can be referred to as the drought susceptibility component, in which a larger second principal component indicates lower drought resistance in the inbred lines. Similar results were obtained by Shirinzadeh et al. [16] and Meena et al. [17]. Thus, a high-yielding drought-resistant inbred line should have a higher first principal component and a lower second principal component.
In the PCA, the first and the second principal components accounted for 99.81% of the variance, so the first and second components could be used to draw a GGE biplot (Figure 3). Four groups were identified (A, B, C, and D), according to the derived coefficients for the different components; for example, Group A includes the lower right-hand corner of the GGE biplot graph. Group A contained genotypes that had high yield and high drought tolerance, Group B contained genotypes that had high yield and poor drought tolerance, Group C contained genotypes that had poor yield and poor drought tolerance and Group D contained genotypes that had poor yield and high drought tolerance. In the biplot, the lines KB-7, 2013KB-37, KA203, 2012KA-34, 2013HXB-4, 2013ZZB-6, KA225, and 91227 had high yield and high drought tolerance (Figure 3).
Next, GGE biplots for mean versus stability were created to illustrate the yield and stability of a variety [18]. The average environmental axis (straight line with the arrow) refers to the average yield of the variety in all environments. The line which runs perpendicular to the average environmental axis and passes through the origin represents the propensity of each species to interact with each environment; the arrow points outwards towards greater instability. Increased deviation from the average environmental axis indicates greater instability [19]. In a comprehensive comparative analysis (Figure 4), KA105, 2012KA-58, KB081, and 2013KB-37 were found to have good yields, whereas 2012KA-1, KB-7, KB043, 2013HXB-4, 2014KB-54, XCA-1, KA060, and ZHENG58 were found to have good stability. These results might be confirmed further. The GGE biplot regarding drought treatment diverges more than the control GGE biplot on the environmental axis. Therefore, the first plot was better suited for selecting drought-resistant materials under lower irrigation than under normal conditions. In Figure 5, there was a larger correlation between different treatments in the same year; there was also no significant difference in the yield results of inbred lines in different years, indicating that the yield of inbred lines were unstable in different years in Yangling. The correlations between the same treatments were large, indicating that the yield results of inbred lines in different years at Yulin were relatively stable. Therefore, Yulin was a more suitable location for evaluating the drought resistance of inbred lines.

4. Discussion

Here, we used the yield to calculate drought tolerance indicators and combine PCA and GGE biplot analysis to classify the inbred lines of maize. Khalatbari [20] showed that GMP and STI are suitable indices for evaluating drought tolerance in maize inbred lines, as these consider yield stability and also high yield. The results of Zhao et al. [21] showed that DRI can be used as an indicator to evaluate the drought resistance of wheat (Triticum aestivum L.) varieties. Within the drought tolerance research literature, various index systems have been established to evaluate the drought tolerance of plant materials, but they all indicate systematic consistency. Therefore, the indicators of drought tolerance in maize inbred lines can also be applied to newly selected inbred lines. A comprehensive evaluation of drought tolerance is more reasonable. Comprehensive consideration of the three indices (MP, GMP, and STI) should be preferred for screening drought-tolerant maize varieties with the same as that of Fernandez [13] and Shaban et al. [22].
In the process of investigating drought tolerance, researchers have established different comprehensive analysis methods. Su et al. [23] screened the drought tolerance evaluation index of maize through canonical correlation analysis and used the factor analysis method of calculating the comprehensive drought tolerance coefficients to evaluate the drought tolerance of 196 maize inbred lines. Grzesiak et al. [24] calculated the drought sensitivity index of several maize varieties for yield, and divided the different genotype materials into drought-tolerant and drought-sensitive classes. Most of the previous studies focused on comparisons of the main effects of varieties and neglected the interaction between varieties and the environment. The use of GGE biplot graphics can be useful here, and this method has also been applied in some crop research, such as the screening of drought tolerance indicators in wheat varieties [25]. Pozveh and Golparvar [26] used PCA to obtain the first principal component and the second principal component to generate a GGE biplot graphic to identify drought tolerance in wheat and used this method to classify drought tolerance in wheat into four categories. In maize, the GGE biplot method has seldom been applied to evaluate drought tolerance. Through an analysis of yield and the use of the GGE biplot method, 10 maize inbred lines (KB081, KA105, KB417, KB215, KB-7, 2013KB-37, KA203, 2012KA-34, KA225, and 91227) were identified as having good stability and wide adaptability.
Stability is only practical when it is combined with high yields. If a variety is stable but low-yielding, it is worthless in terms of production. Therefore, under the assumption that higher yields result from better tolerance, the screening of inbred lines with good drought resistance follows actual production needs. After an initial yield analysis and the first GGE biplot, we used a GGE biplot of mean vs. stability to further verify the stability of the selected maize inbred lines. This approach was effective for selecting drought-resistant materials under low irrigation conditions than normal conditions. Similarly, Wang [27] screened ZHENG58 as a drought-tolerant inbred line and CHANG7-2 as a moderately drought-tolerant inbred line when evaluating the drought tolerance of inbred lines of maize in China. Guo et al. [28] also considered ZHENG58 to be superior to PH4CV in terms of drought tolerance. The drought resistance of ZHENG58 was considered of medium tolerance within our maize inbred lines because the maize inbred lines selected by our research group came from many locations and were grown at high density with less fertilizer and low irrigation. Our inbred lines also had higher drought resistance overall. This suggests that an evaluation of inbred lines from many locations grown at high density with less fertilizer and low irrigation can be relatively accurate.
In addition, the results also provided empirical evidence for the practical use of maize inbred lines. Our research group selected the high-yielding and stable inbred line 91227, identified through this study, for crossing with the nationally popular variety Shaandan 609 and the Shaanxi-approved variety Shaandan 623. Furthermore, KA203 was selected for crossing with the Shaanxi-approved variety Shaandan 628. KA105 was selected for crossing with Shaanxi province’s first mechanical harvesting varieties Shandan 636, Shaandan 619, Shaandan 620, and Shaandan 650. Thus, growing inbred lines under high stress was a highly efficient and feasible concept.

5. Conclusions

Comprehensive yield analysis and GGE biplots helped identify 10 high-yielding drought-resistant materials (KB081, KA105, KB417, KB215, KB-7, 2013KB-37, KA203, 2012KA-34, KA225, and 91227). These particular lines had reliable stability and wide adaptability, it was more effective to select drought-resistant materials under low irrigation, and Yulin was a more suitable location for evaluating the drought resistance of inbred lines. The concept of using inbred lines from many locations grown at high density with less fertilization and less irrigation of the selected inbred lines was relatively reliable. Compared with the control varieties, the inbred lines from the Shaan A group and Shaan B group showed high drought tolerance.

Author Contributions

X.Z. and J.X. conceived and designed the experiments. Y.S., Y.W. and Y.L. performed the experiments. Y.L., Y.W. and Y.D. analyzed the data. Y.D., Y.S. and Y.W. carried out the field trials. Y.L., Y.D. and S.X. wrote the paper. S.X. and J.X. helped to improve the manuscripts. All authors have read and agreed to the published version of the manuscript.

Funding

This study was supported by National Corn Industry Techenology system (CARS-02-64) and the Key Research and Development Program of Shaanxi Province (2021ZDLNY01-06).

Institutional Review Board Statement

Not applicable.

Informed Consent Statement

This article does not contain any studies with human participants or animals performed by any of the authors.

Data Availability Statement

Data can be achieved by contacting with the first author and respondense author.

Conflicts of Interest

The authors declare no conflict of interest.

References

  1. Qin, D.M. Climate change and drought. Sci. Technol. Rev. 2009, 11, 3. [Google Scholar]
  2. Huang, R.H.; Zhen, C. Evolution characteristics and trend of droughts and floods in China under the background of global warming. Chin. J. Nat. 2010, 4, 187–195. [Google Scholar]
  3. Duvick, D.N. The contribution of breeding to yield advances in maize (Zea mays L.). Adv. Agron. 2005, 86, 83–145. [Google Scholar]
  4. Tollenaar, M. Seeking the Upper Limit of Corn Production. Batter Crops. 1986, 75, 6–8. [Google Scholar]
  5. Yang, X.Q.; Zhang, R.H.; Xue, J.Q.; Tai, S.J.; Zhang, X.H.; Hai-Dong, L.U.; Guo, Y.P. Effects of abiotic stress on yield traits of maize hybrids and their parental inbred lines. Acta Agron. Sin. 2013, 39, 1325. [Google Scholar] [CrossRef]
  6. Fenghai, L. Selection of Drought Resistance Index and Genetic Research; Shenyang Agricultural University: Shenyang, China, 2011. [Google Scholar]
  7. Mohammadi, A.H.; Belandria, V.; Richon, D. Use of an artificial neural network algorithm to predict hydrate dissociation conditions for hydrogen + water and hydrogen + tetra-n-butyl ammonium bromide + water systems. Chem. Eng. Sci. 2010, 65, 4302–4305. [Google Scholar] [CrossRef]
  8. Monneveux, P.; Sanchez, C.; Beck, D.; Edmeades, G.O. Drought tolerance improvement in tropical maize source populations: Evidence of progress. Crop Sci. 2006, 46, 180–191. [Google Scholar] [CrossRef]
  9. Fang, P.; Yao, Q.L.; Chen, M.; Tan, C.L.; Xu, J. Study on the main biological traits of maize landraces under drought stress and screening for drought-intolerant germplasm at seedling stage. J. Maize Sci. 2012, 20, 6–11. [Google Scholar]
  10. Rosielle, A.A.; Hamblin, J. Theoretical aspects of selection for yield in stress and non-stress environment. Crop Sci. 1981, 21, 943–946. [Google Scholar] [CrossRef]
  11. Bouslama, M.; Schapaugh, W.T. Stress tolerance in soybeans. I. Evaluation of three screening techniques for heat and drought tolerance. Crop Sci. 1984, 5, 933. [Google Scholar] [CrossRef]
  12. Fischer, R.A.; Maurer, R. Drought resistance in spring wheat cultivars: 1. Grain yield response. Agric. Res. 1978, 5, 897–912. [Google Scholar] [CrossRef]
  13. Fernandez, G.C.J. Effective Selection Criteria for Assessing Stress Tolerance. In Proceedings of the International Symposium on Adaptation of Vegetables and Other Food Crops in Temperature and Water Stress, Taipei, Taiwan, 13–18 August 1992. [Google Scholar]
  14. Jusheng, L.; Fushun, H. The concept and statistical method of drought resistance index in crops. Acta Agric. Boreali—Sin. 1990, 2, 20–25. [Google Scholar]
  15. Kumar, A.; Verulkar, S.; Dixit, S.; Chauhan, B.; Bernier, J.; Venuprasad, R.; Zhao, D.; Shrivastava, M.N. Yield and yield-attributing traits of rice (Oryza sativa L.) under lowland drought and suitability of early vigor as a selection criterion. Field Crops Res. 2009, 114, 99–107. [Google Scholar] [CrossRef]
  16. Shirinzadeh, A.; Zarghami, R.; Azghandi, A.V.; Shiri, M.R.; Mirabdulbaghi, M. Evaluation of drought tolerance in mid and late mature corn hybrids using stress tolerance indices. Asian J. Plant Sci. 2010, 9, 67–73. [Google Scholar] [CrossRef]
  17. Meena, R.P.; Tripathi, S.C.; Chander, S.; Chookar, R.S.; Verma, M.A.; Sharma, R.K. Identifying drought tolerant wheat varieties using different indices. SAARC J. Agric. 2015, 1, 148–161. [Google Scholar] [CrossRef] [Green Version]
  18. Yan, W. GGEbiplot—A windows application for graphical analysis of multienvironment trial data and other types of two-way data. Agron. J. 2001, 5, 1111–1118. [Google Scholar] [CrossRef] [Green Version]
  19. Yan, W. Optimal use of biplots in analysis of multi-location variety test data. Acta Agron. Sin. 2010, 11, 1805–1819. [Google Scholar]
  20. Khalatbari, A.A.; Bihamta, M.R.; Khalatbari, A.M. An Evaluation of quantitative traits related to drought resistance in inbred lines of maize in stress and non-stress conditions. Asian J. Plant Sci. 2007, 6, 1293–1296. [Google Scholar] [CrossRef]
  21. Zhao, H.M.; Guo, C.J.; Duan, W.W.; Yong, Q.I.; Wang, X.Y.; Yan, M.L. Studies on evaluation indices for drought resistance capacity in wheat varieties. J. Plant Genet. Resour. 2007, 1, 76–81. [Google Scholar]
  22. Shaban, M.; Mansourifar, S.; Ghobadi, M.; Parchin, R.A. Effect of drought stress and starter nitrogen fertilizer on root characteristics and seed yield of four chickpea (Cicer arietinum L.) genotypes. Seed Plant Prod. J. 2012, 27, 451–470. [Google Scholar]
  23. Su, Z.J.; Hao, Z.F.; Xie, C.X.; Li, M.S.; Zhang, S.H.; Li, X.H. Evaluation of drought tolerance of commonly used maize inbred lines in China. J. Maize Sci. 2009, 5, 19. [Google Scholar]
  24. Grzesiak, M.T.; Marcińska, I.; Janowiak, F.; Rzepka, A.; Hura, T. The relationship between seedling growth and grain yield under drought conditions in maize and triticale genotypes. Acta Physiol. Acta Physiol. Plant. 2012, 5, 1757–1764. [Google Scholar] [CrossRef]
  25. Yang, J.W.; Zhu, J.G.; Wang, S.G.; Sun, D.Z.; Shi, Y.G.; Chen, W.G. Drought-resistance of local wheat varieties in Shanxi Province of China: A comprehensive evaluation by using GGE biplot and subordinate function. Chin. J. Appl. Ecol. 2013, 4, 1031–1038. [Google Scholar]
  26. Pozveh, H.H.; Golparvar, A.R. Assessment of genetic diversity for drought tolerance and determination of the best resistance indices for some common wheat (Triticum aestivum L.) genotypes. Res. Crops 2016, 17, 347. [Google Scholar] [CrossRef]
  27. Wang, Y.J.; Xi, H.J.; Li, M.D.; Hao, D.X.; Li, M.S.; Liu, W.X. Drought tolerance evaluation of 47 main maize inbred lines in China. J. Maize Sci. 2018, 4, 10–16. [Google Scholar]
  28. Guo, J.L.; Peng, L.; Fan, R.N.; Zhan, Q.D.; Li, B.Z. Comparative analysis of drought tolerance at seedling stage between maize ‘Zheng58’ and ‘PH4CV’. Chin. Agric. Sci. Bull. 2017, 4, 10–16. [Google Scholar]
Figure 1. Scatterplots showing the yield under drought and normal conditions: (A) Yangling in 2015, (B) Yulin in 2015, (C) Yangling in 2016, (D) Yulin in 2016, (E) Yangling in 2017, (F) Yulin in 2017.
Agriculture 12 00011 g001
Figure 2. Three-dimensional map of inbred lines based on yield and drought tolerance. Numbers assigned to the genotypes Are: (1) KA008; (2) 2012KA-1; (3) KA064; (4) KA105; (5) KA103; (6) KA203; (7) 2012KA-34; (8) 91227; (9) KA227; (10) KA225; (11) XCA-1; (12) KA060; (13) 2012KA-58; (14) KB109; (15) KB081; (16) KB417; (17) KB215; (18) KB-7; (19) KB020; (20) 2013KB-37; (21) 2013KB-47; (22) KB043; (23) Z140588; (24) Z140580; (25) 2013HXB-4; (26) 2013ZZB-6; (27) 2014KB-54; (28) CHANG7-2; (29) PH6WC; (30) PH4CV, and (31) ZHENG58.
Agriculture 12 00011 g002
Figure 3. GGE biplot graphic based on the two first principal components for 31 inbred lines of maize and different drought tolerance indices. Numbers assigned to the genotypes Are: (1) KA008; (2) 2012KA-1; (3) KA064; (4) KA105; (5) KA103; (6) KA203; (7) 2012KA-34; (8) 91227; (9) KA227; (10) KA225; (11) XCA-1; (12) KA060; (13) 2012KA-58; (14) KB109; (15) KB081; (16) KB417; (17) KB215; (18) KB-7; (19) KB020; (20) 2013KB-37; (21) 2013KB-47; (22) KB043; (23) Z140588; (24) Z140580; (25) 2013HXB-4; (26) 2013ZZB-6; (27) 2014KB-54; (28) CHANG7-2; (29) PH6WC; (30) PH4CV, and (31) ZHENG58.
Agriculture 12 00011 g003
Figure 4. Mean vs. stability GGE biplots for normal conditions (A) and drought treatments (B).
Agriculture 12 00011 g004
Figure 5. Mean vs. stability GGE biplots for Yangling (A) and Yulin (B).
Agriculture 12 00011 g005
Table 1. Code of tested maize inbred lines and their origins.
NameOriginNameOrigin
KA008Shaan AKB215Shaan B
2012KA-1Shaan AKB-7Shaan B
KA064Shaan AKB020Shaan B
KA105Shaan A2013KB-37Shaan B
KA103Shaan A2013KB-47Shaan B
KA203Shaan AKB043Shaan B
2012KA-34Shaan AZ140588Shaan B
91227Shaan AZ140580Shaan B
KA227Shaan A2013HXB-4Shaan B
KA225Shaan A2013ZZB-6Shaan B
XCA-1Shaan A2014KB-54Shaan B
KA060Shaan ACHANG7-2Control
2012KA-58Shaan APH6WCControl
KB109Shaan BPH4CVControl
KB081Shaan BZHENG58Control
KB417Shaan B--
Table 2. ANOVA results for maize grain yield under two treatments at two locations in 3 years.
Source of VariationDegrees of FreedomSum of Squares (SS)Percent of SSMean Squaresf-Valuep-Value
Genotype30830,645.827.2627,688.199.45 **<0.001
Treatment11,476,044.0212.891,476,044.02503.93 **<0.001
Environment56,420,688.3956.091,284,137.68438.42 **<0.001
Genotype × environment1501,088,776.849.517258.512.48 **<0.001
Error5571,631,477.5214.252929.04--
Total74311,447,632.59----
** indicates significant difference at p < 0.01 level.
Table 3. Best linear unbiased predictor (BLUP) values of yield and seven drought tolerance indices of 31 inbred lines of maize.
NameCK-BLUPDW-BLUPSSIYSITOLMPGMPSTIDRI
KA0084198.942881.191.300.691317.753540.063478.210.370.45
2012KA-15742.084088.461.190.711653.624915.274845.230.710.67
KA0465724.524066.641.200.711657.884895.584824.890.710.66
KA1056305.465064.910.810.801240.565685.185651.250.970.94
KA1036613.723816.051.750.582797.675214.895023.770.770.51
KA2035558.384510.260.780.811048.125034.325006.970.760.84
2012KA-345335.704566.700.600.86769.004951.204936.250.740.90
2012KA-586221.285001.470.810.801219.815611.385578.130.950.92
KA2275633.924179.071.070.741454.854906.504852.270.720.71
KA2255813.084558.820.890.781254.265185.955147.890.810.82
XCA-15905.734110.511.260.701795.225008.124927.020.740.66
KA0605596.004305.160.950.771290.844950.584908.330.730.76
912275565.994750.390.610.85815.615158.195142.040.800.93
KB1095537.274163.951.020.751373.334850.614801.760.700.72
KB0816608.745290.660.820.801318.085949.705913.091.060.97
KB4176124.554617.821.020.751506.735371.195318.090.860.80
KB2156395.594663.101.120.731732.495529.345461.070.910.78
KB-75795.074610.390.840.801184.685202.735168.900.810.84
KB0205792.724101.111.210.711691.614946.924874.070.720.67
2013KB-376020.395042.280.670.84978.115531.335509.670.920.97
2013KB-476297.574736.681.020.751560.895517.135461.650.910.82
KB0434960.283888.770.890.781071.514424.524391.970.590.70
Z1405885671.594131.861.120.731539.734901.734840.890.710.69
Z1405805679.733650.751.480.642028.984665.244553.600.630.54
2013HXB-45105.214316.760.640.85788.454710.994694.460.670.84
2013ZZB-65515.444550.020.720.82965.435032.735009.530.760.86
2014KB-546127.384508.131.090.741619.265317.755255.760.840.76
CHANG7-25222.694017.160.950.771205.544619.934580.440.640.71
PH6WC6153.844386.851.190.711766.995270.355195.760.820.72
PH4CV5239.793988.180.990.761251.614613.994571.350.630.70
ZHENG585386.184222.060.890.781164.124804.124768.730.690.76
Table 4. Correlation analysis of yield best linear unbiased predictor (BLUP) values and seven drought tolerance indices.
CK-BLUPDW-BLUPSSIYSITOLMPGMPSTIDRI
CK-BLUP1--------
DW-BLUP0.621 **1-------
SSI0.205−0.637 **1------
YSI−0.2030.637 **−0.999 **1-----
TOL0.501 **−0.368 *0.946 **−0.944 **1----
MP0.908 **0.893 **−0.2230.2250.0911---
GMP0.872 **0.925 **−0.2970.2980.0140.997 **1--
STI0.868 **0.922 **−0.2920.2950.0120.993 **0.996 **1-
DRI0.2830.925 **−0.878 **0.878 **−0.687 **0.658 **0.713 **0.712 **1
** Significant at the 0.01 probability level.
Table 5. Principal component analysis of best linear unbiased predictors for yield and the drought tolerance indices.
Cumulative (%)CK-BLUPDW-BLUPSSIYSITOLMPGMPSTIDRI
Principal component 164.04%0.260.41−0.270.27−0.160.370.380.380.39
Principal component 299.80%0.430.190.42−0.420.510.260.220.22−0.18
Publisher’s Note: MDPI stays neutral with regard to jurisdictional claims in published maps and institutional affiliations.

