Biomass and Protein Yields of Field Peas and Oats Intercrop Affected by Sowing Norms and Nitrogen Fertilizer at Two Different Stages of Growth

 , , ,
, , ,  and
and
Abstract
:1. Introduction
2. Materials and Methods
2.1. Trial Design
2.2. Plant and Yield Measurements
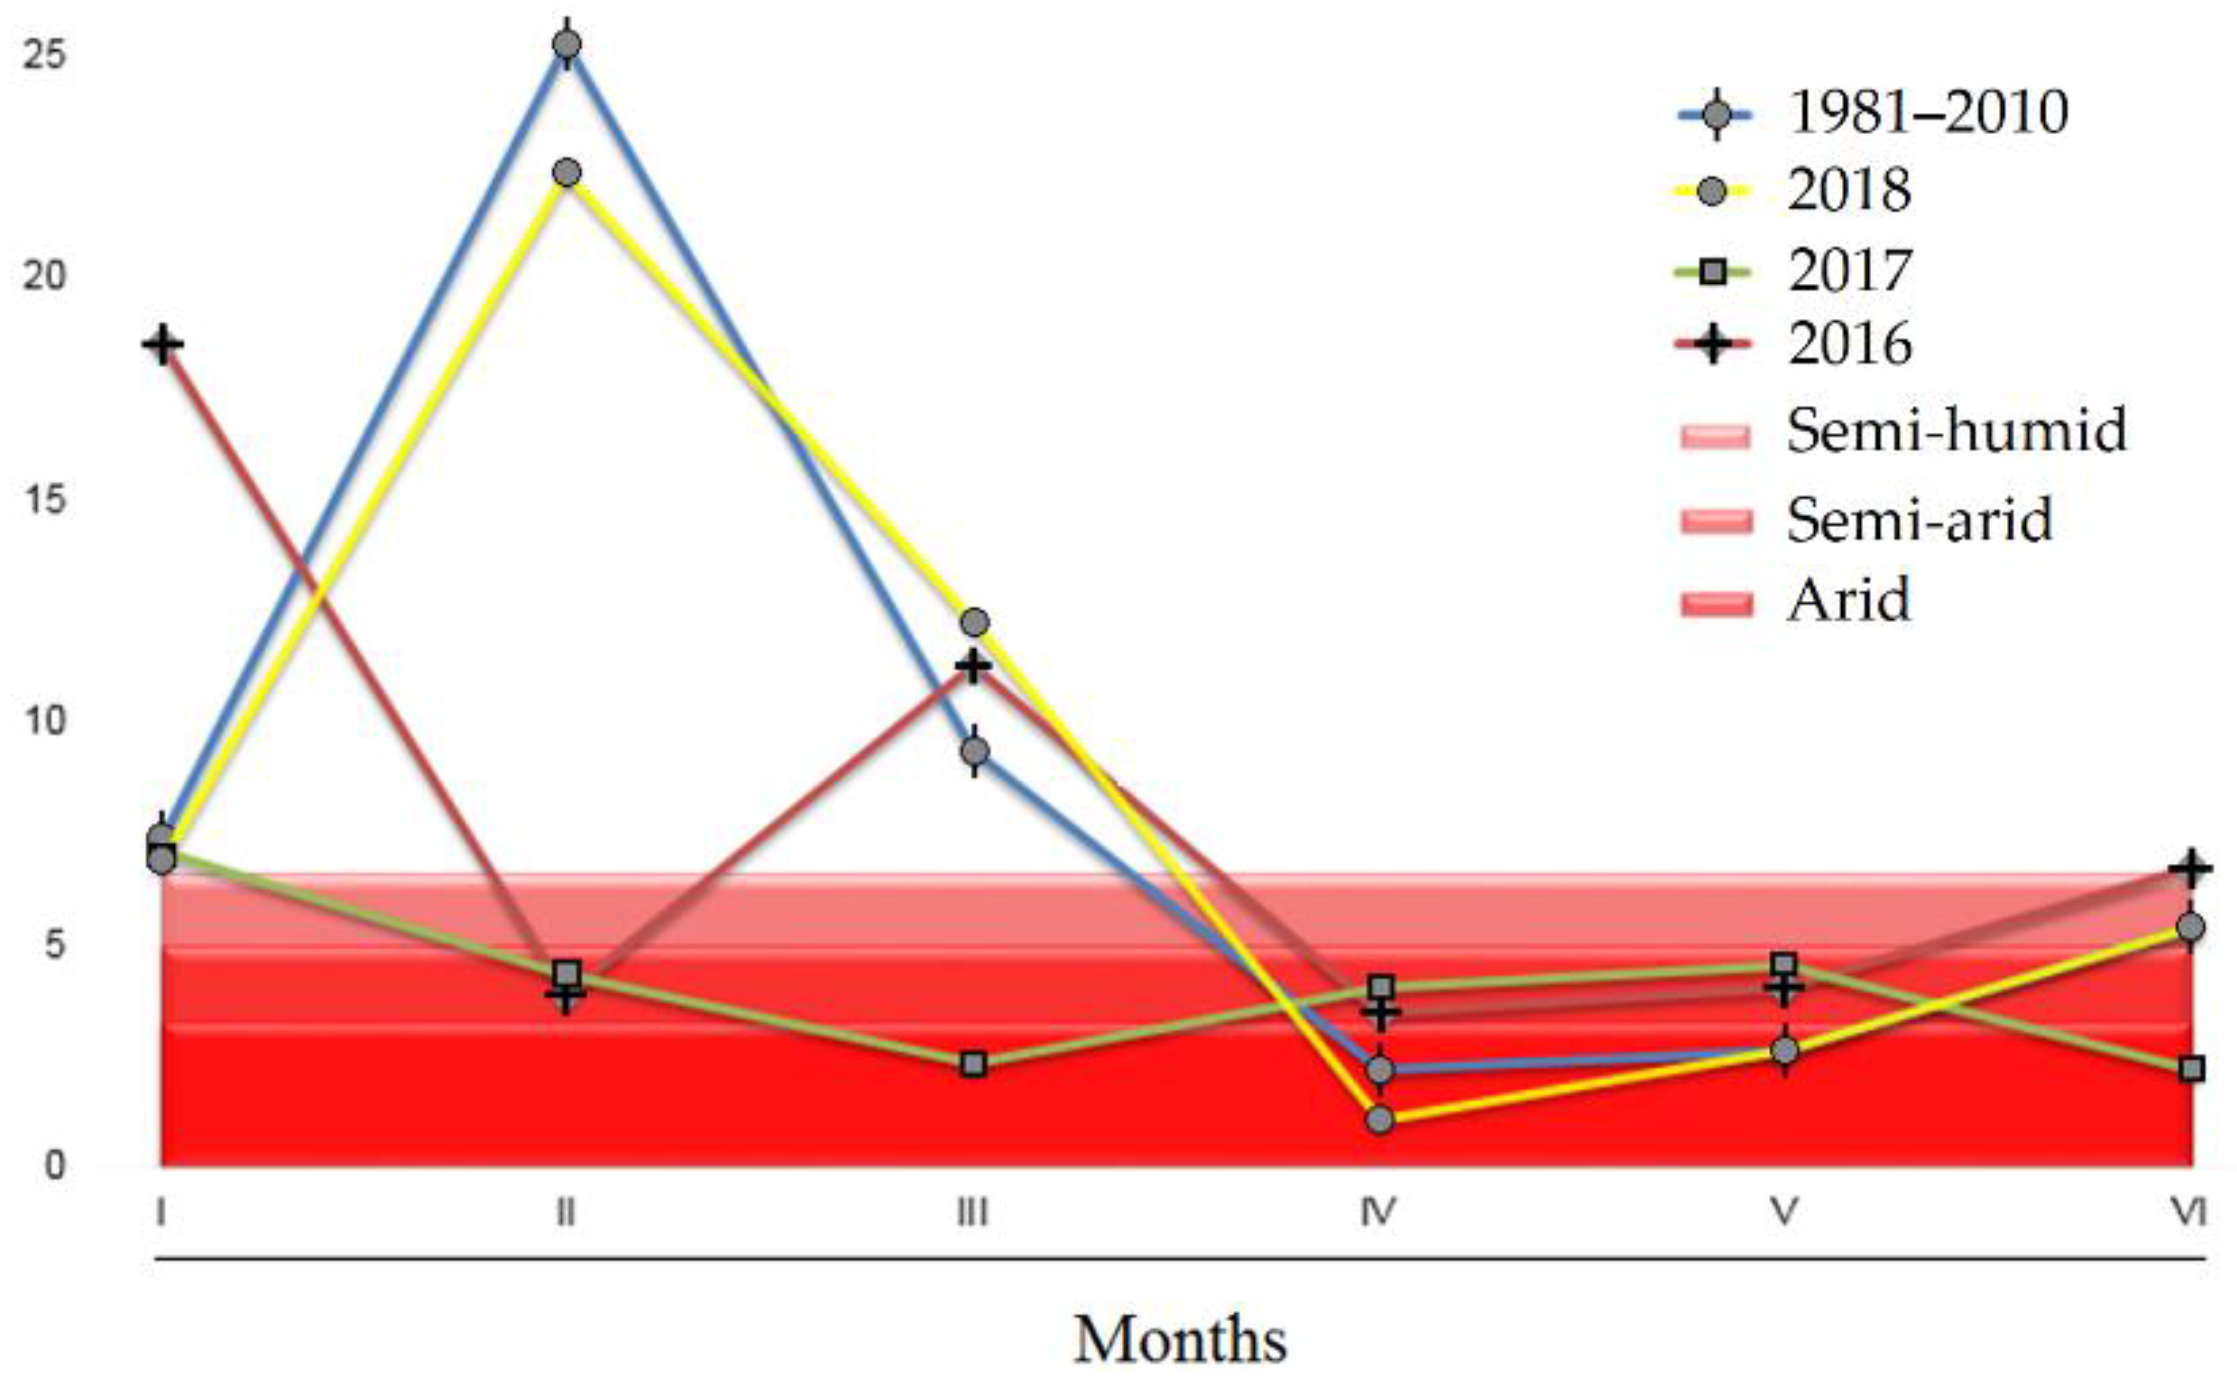
2.3. Soil and Meteorological Conditions
2.4. Statistical Analysis
2.5. Economic Efficiency
3. Results
3.1. Field Pea and Oat Yields and Yield Components
3.2. Field Peas Share in Yield and Land Equivalent Ratio
3.3. Economic Contributions of Field Pea and Oats Mixtures
4. Discussion
4.1. Plant Height and the Number of Internodes
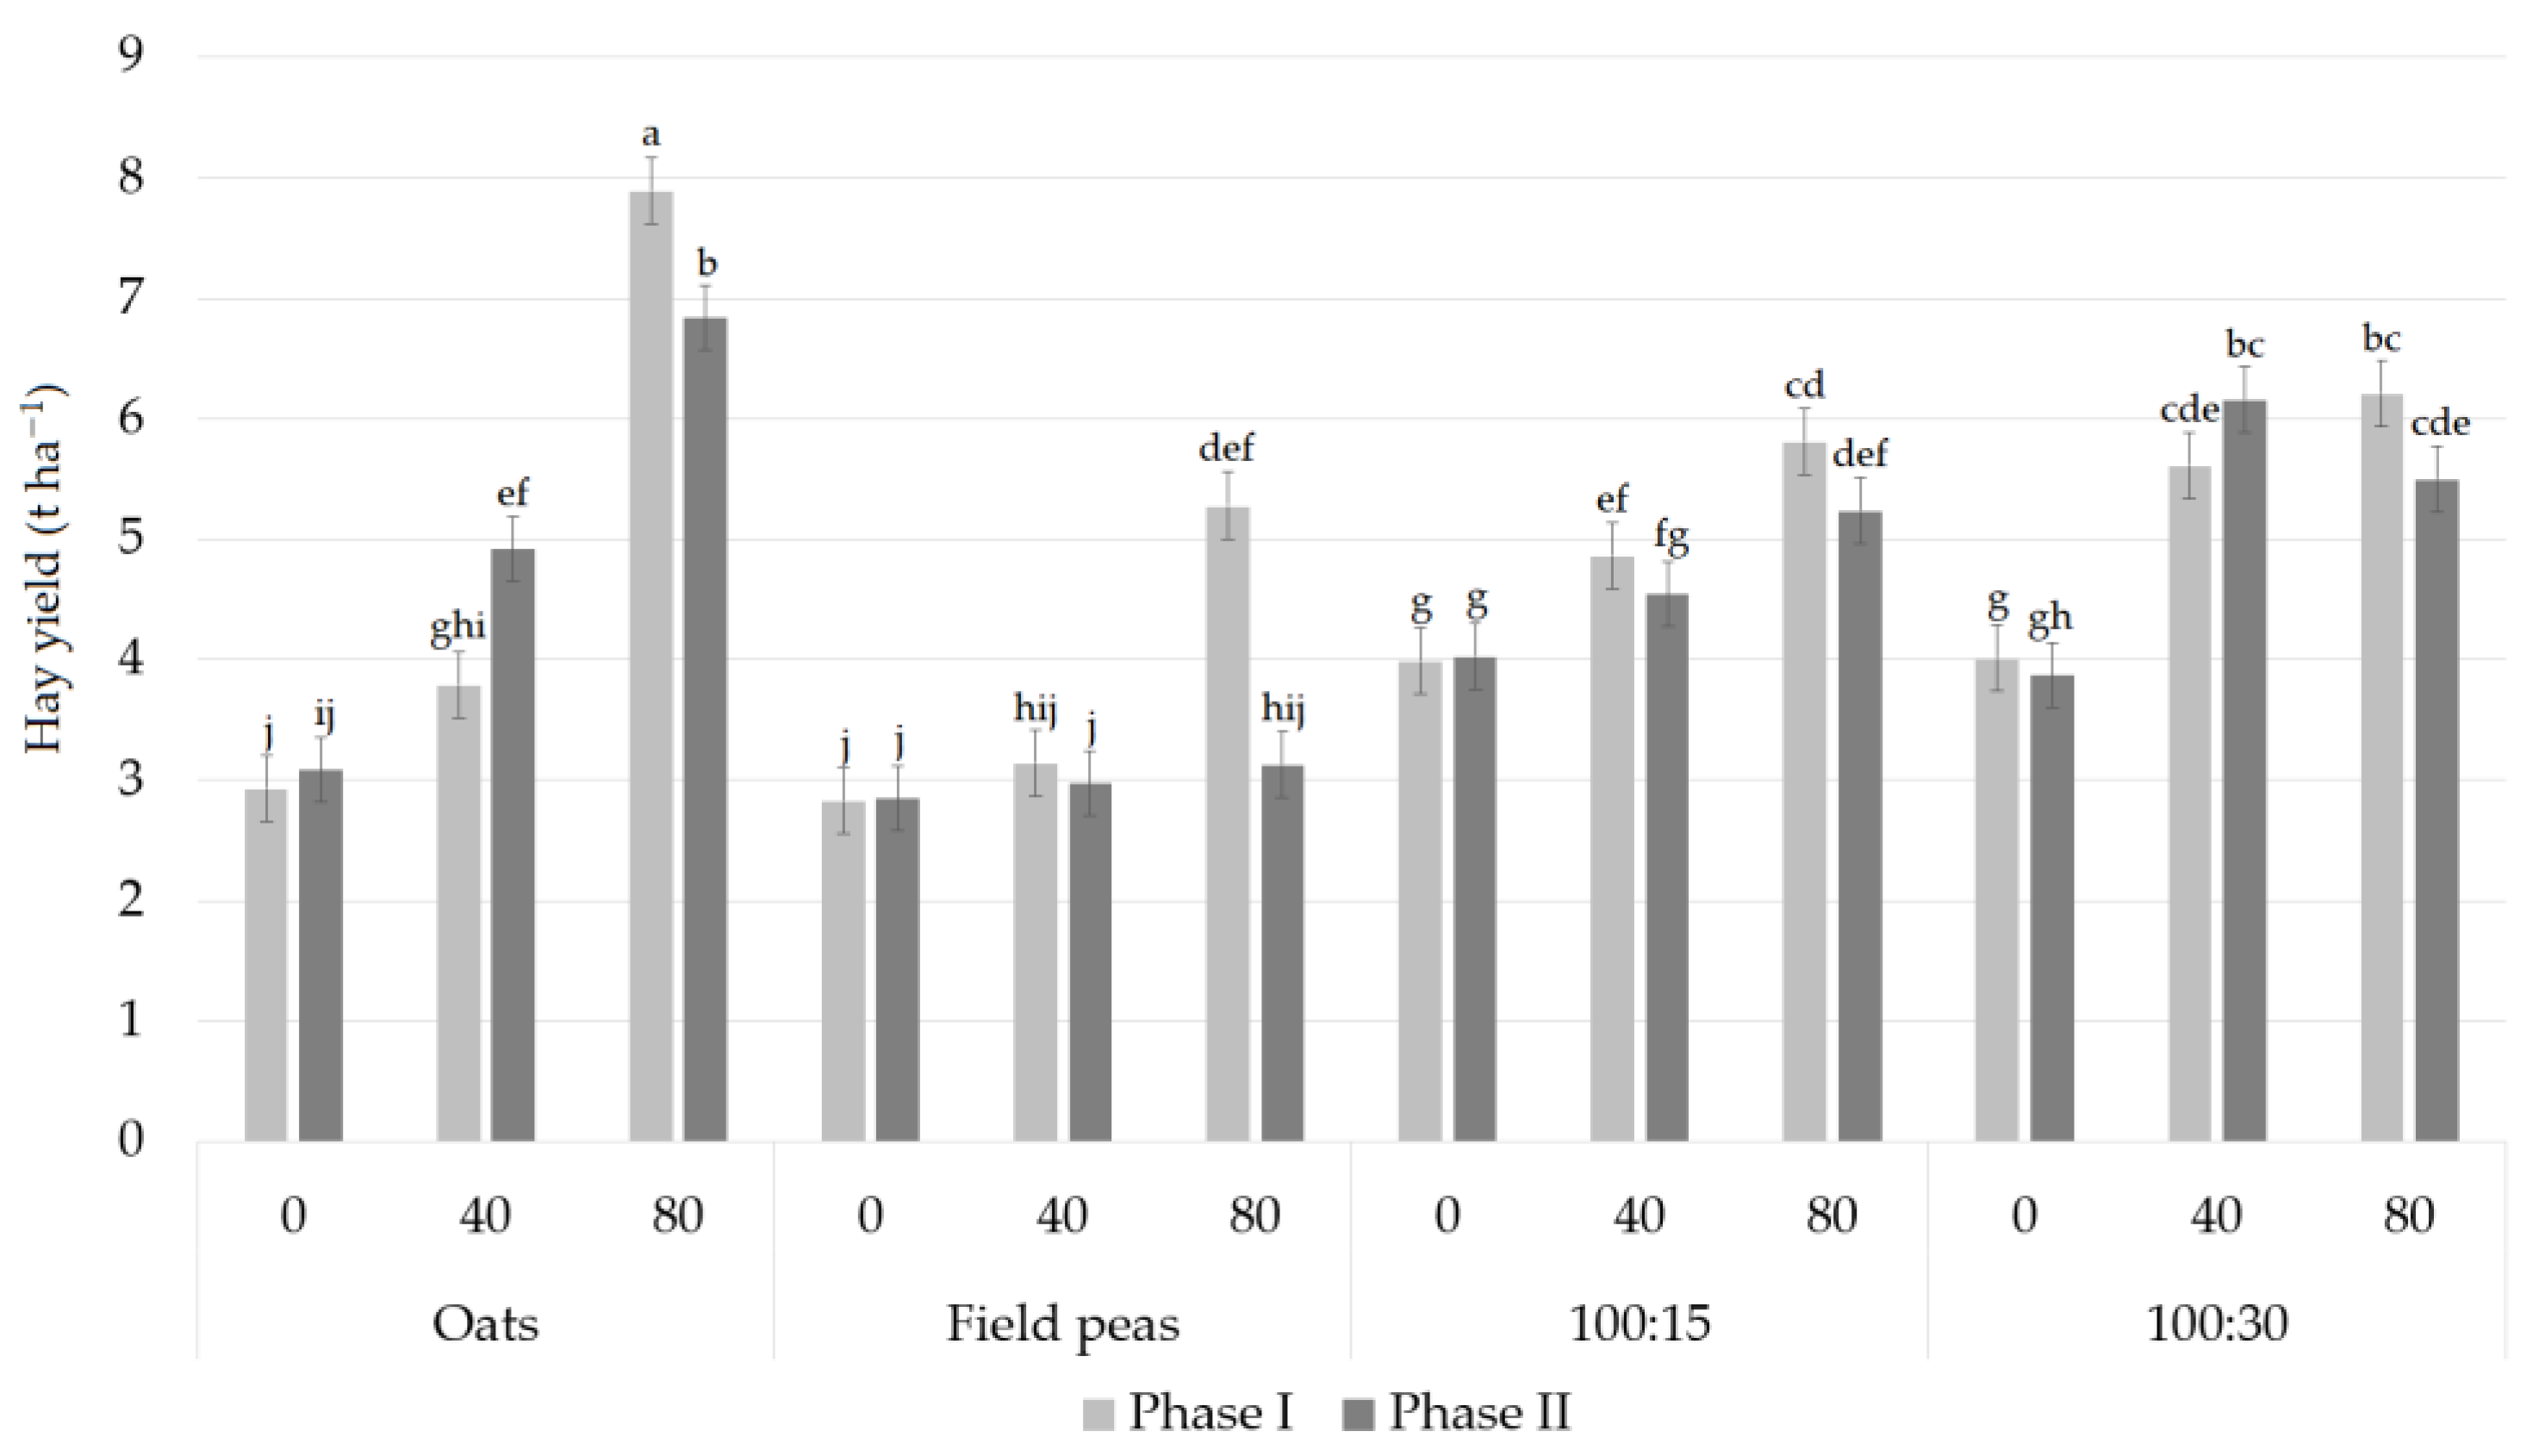
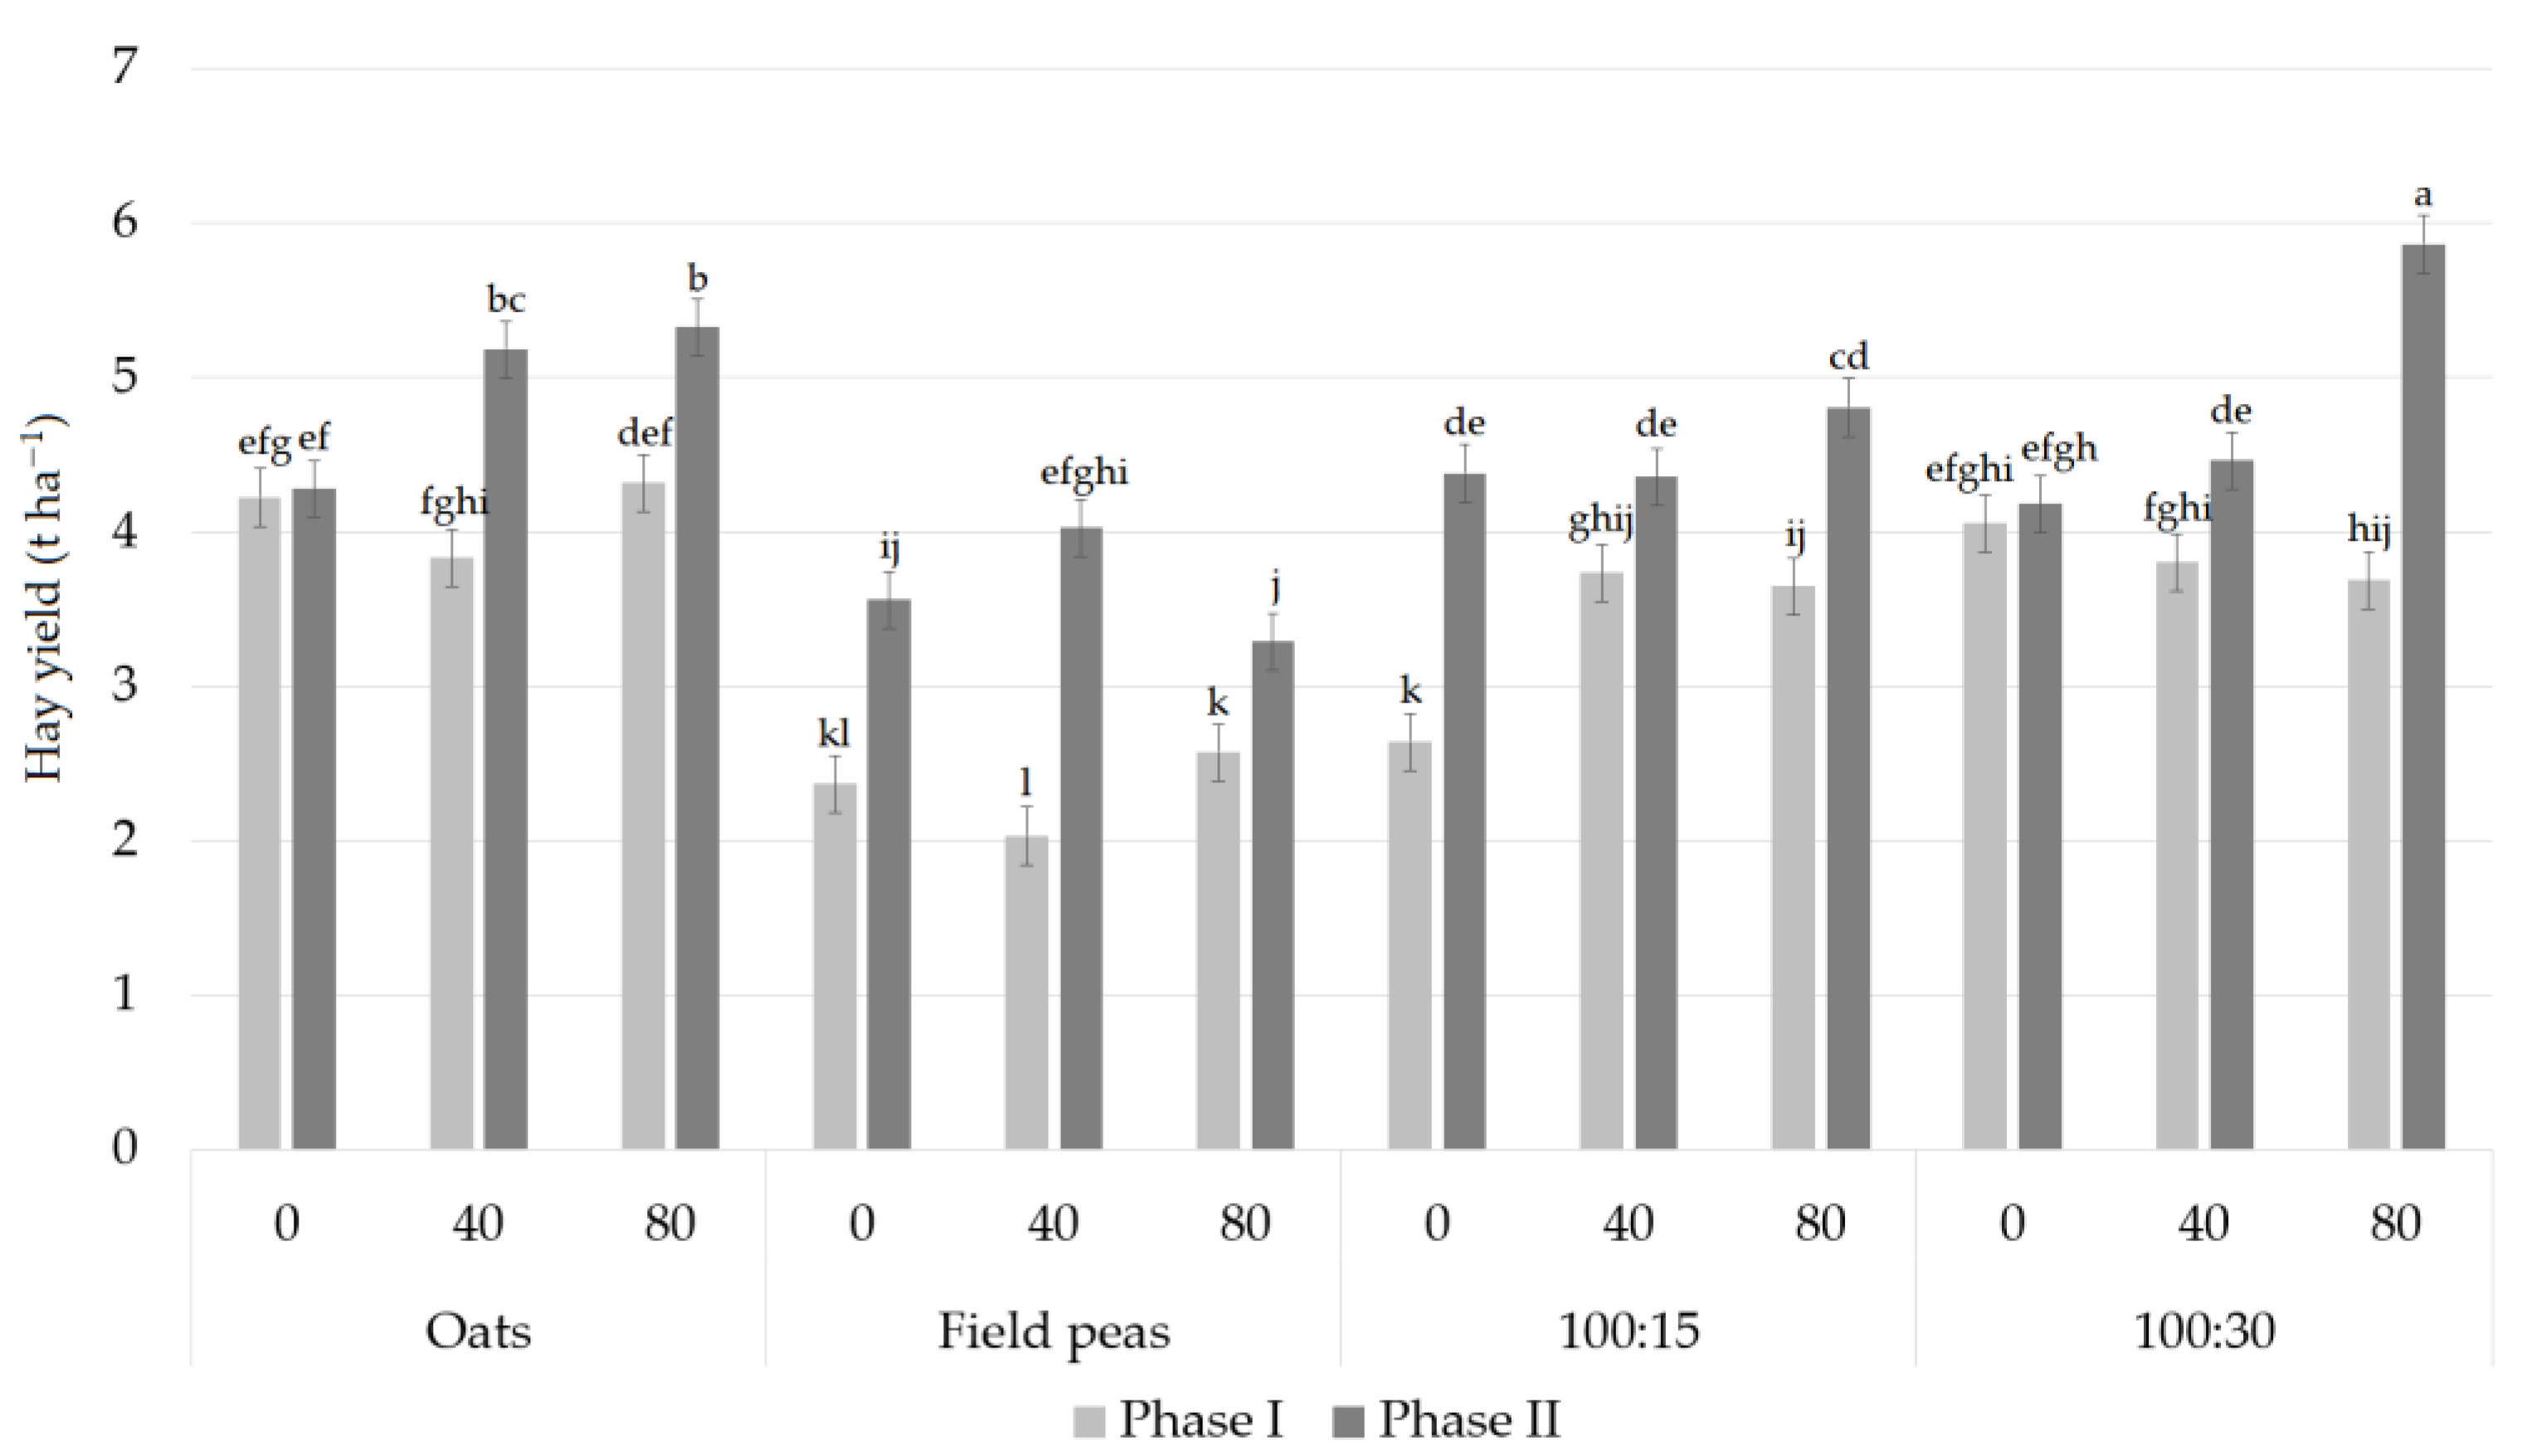
4.2. Biomass and Hay Yields
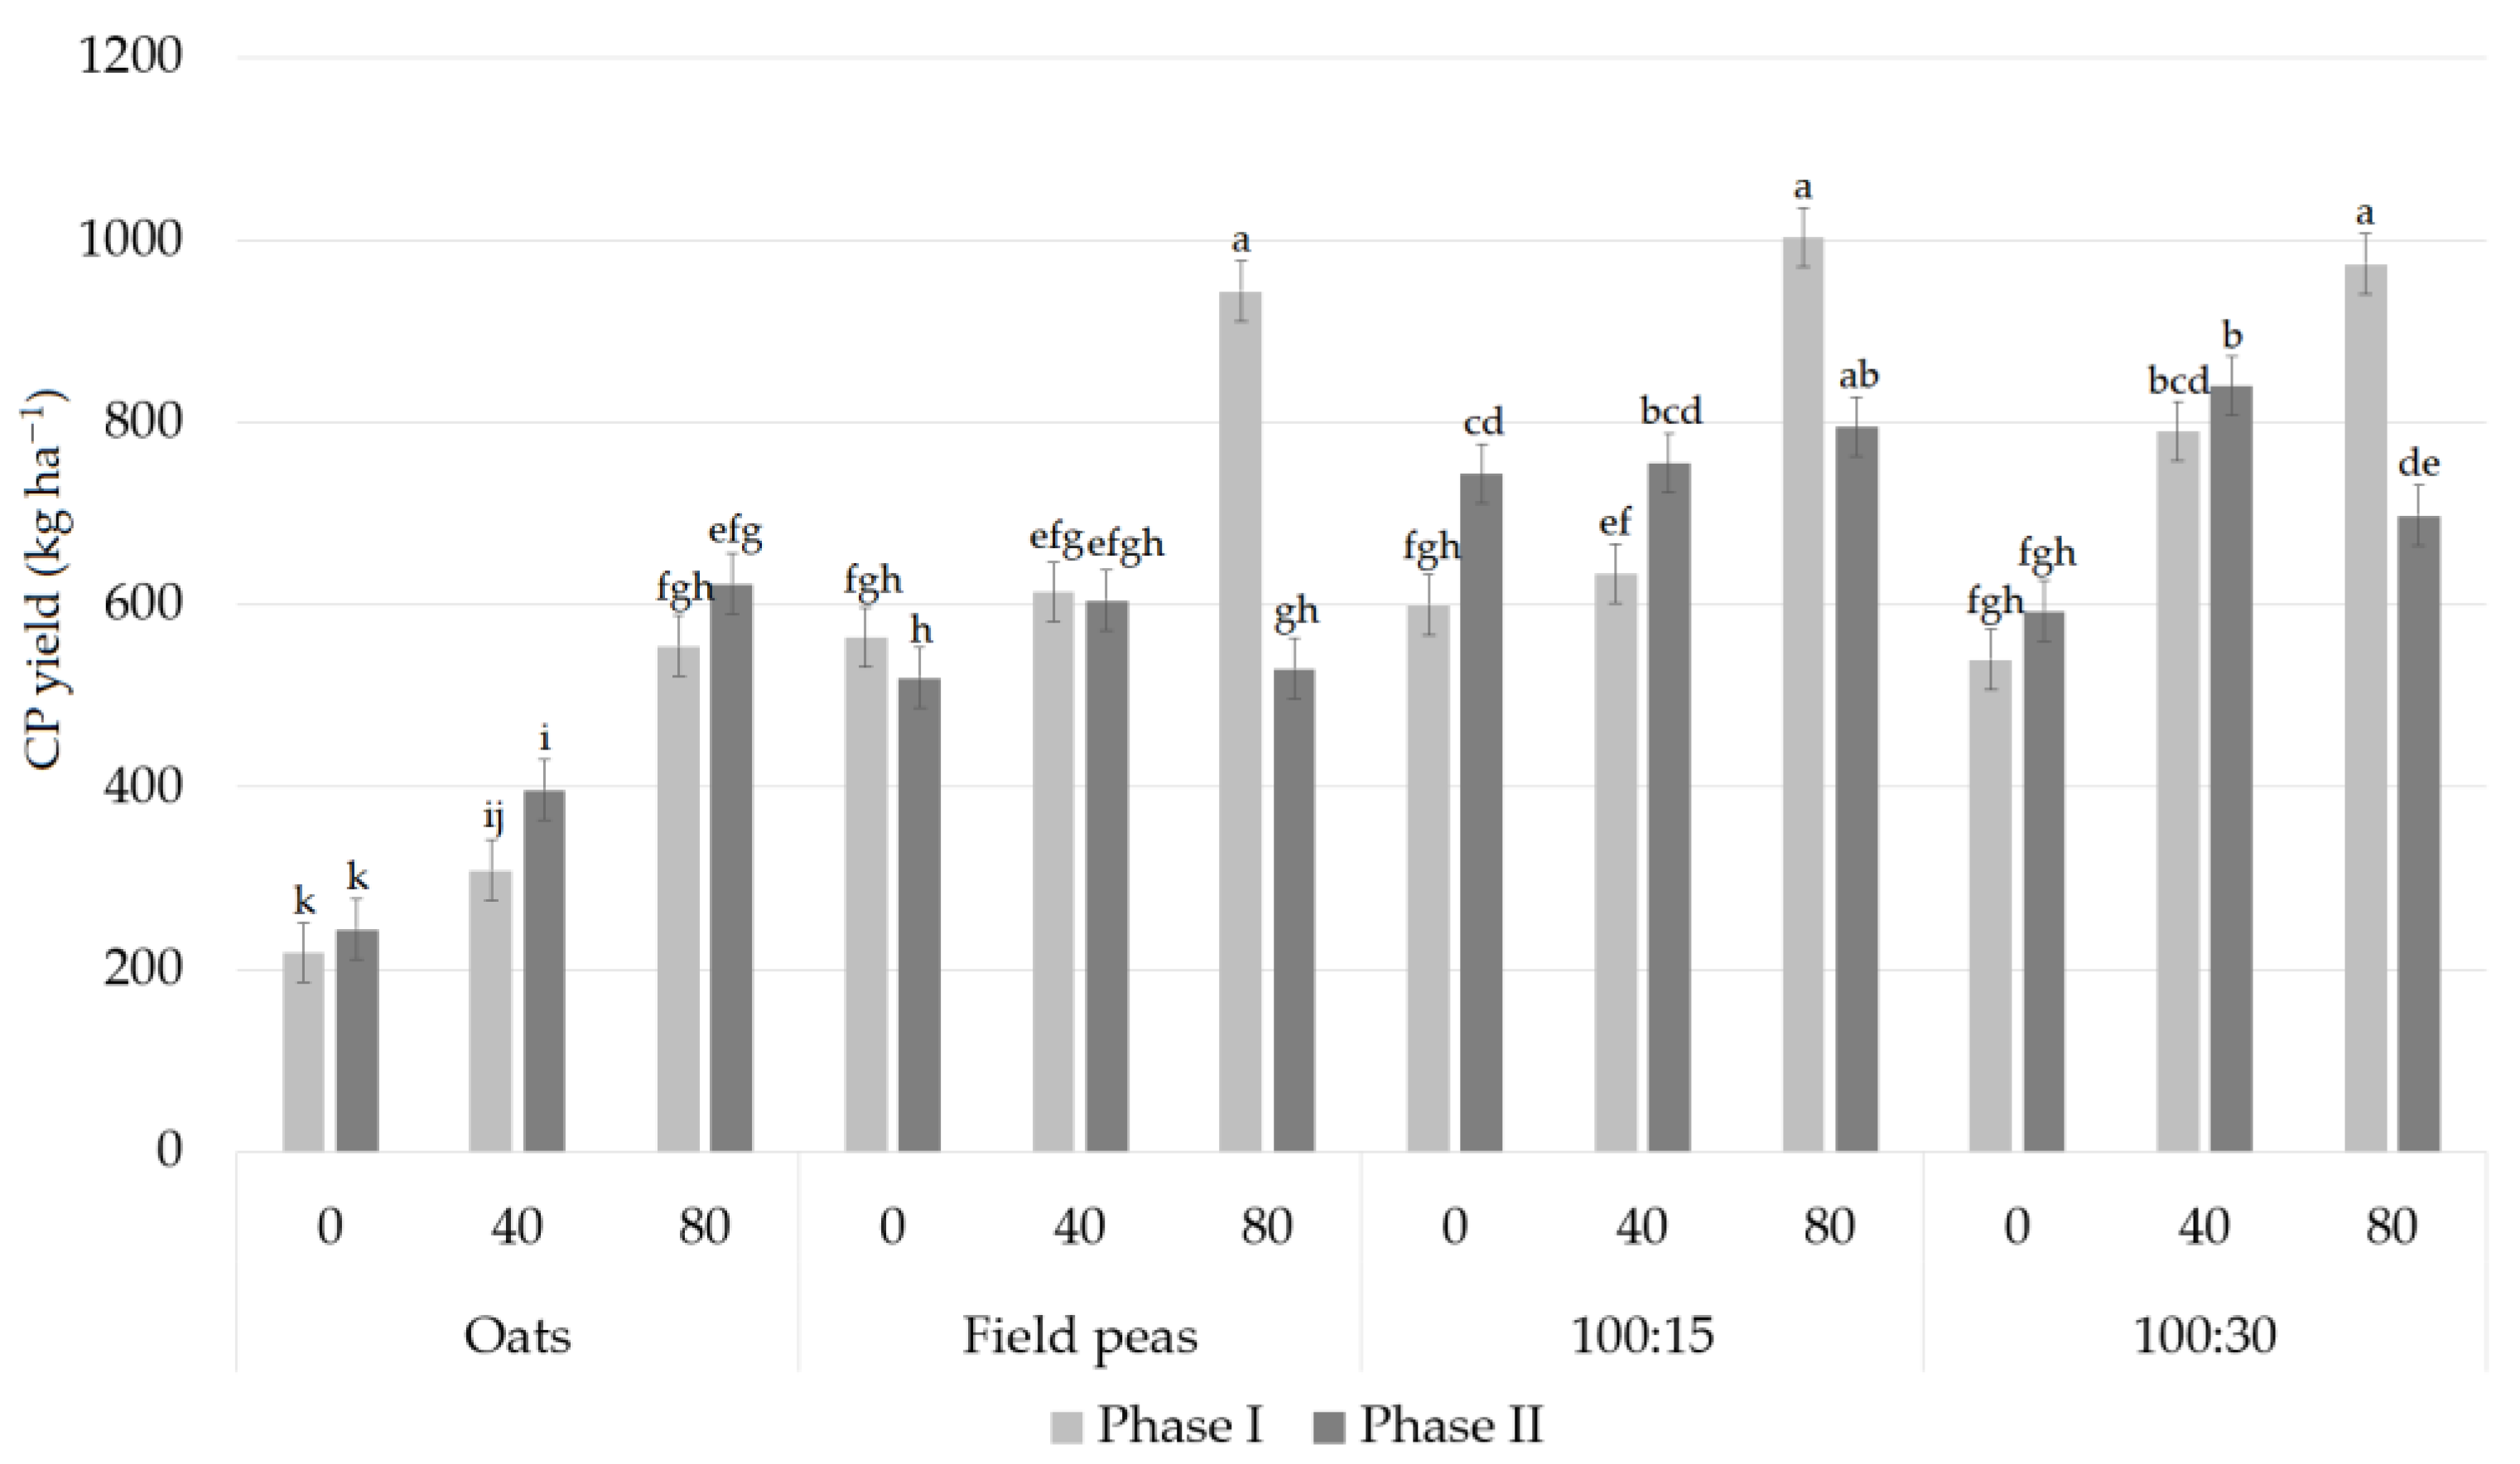
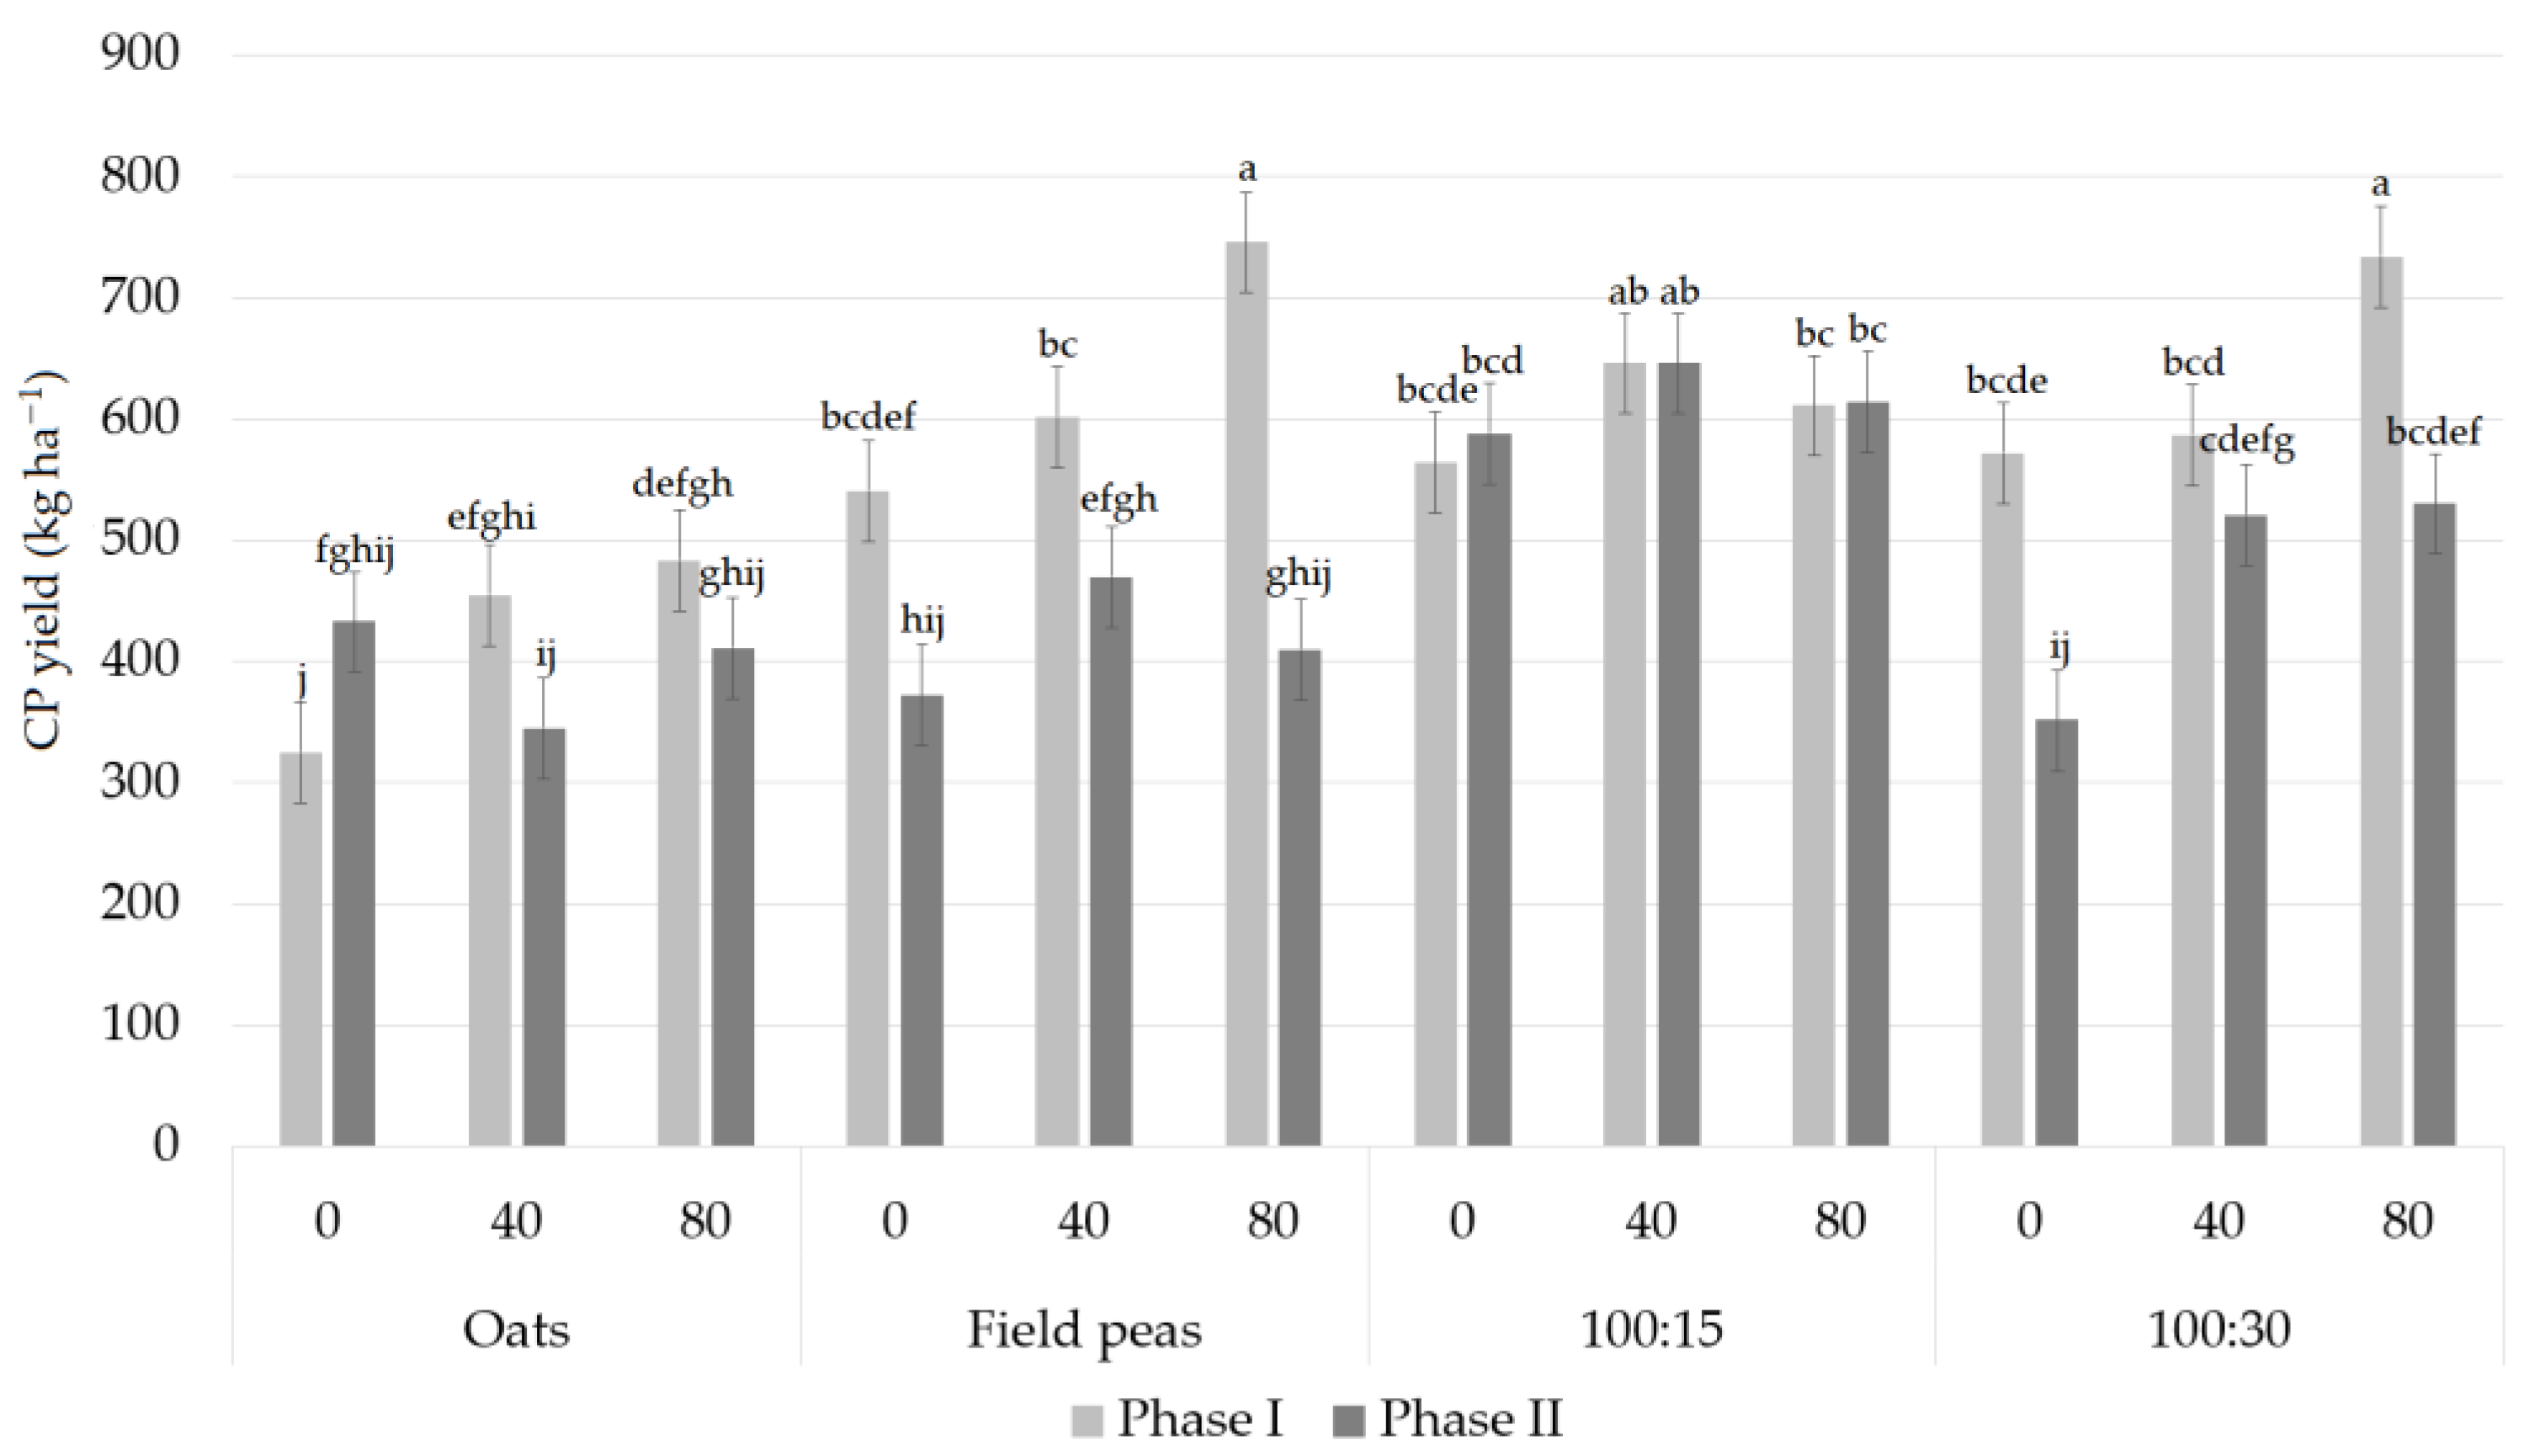
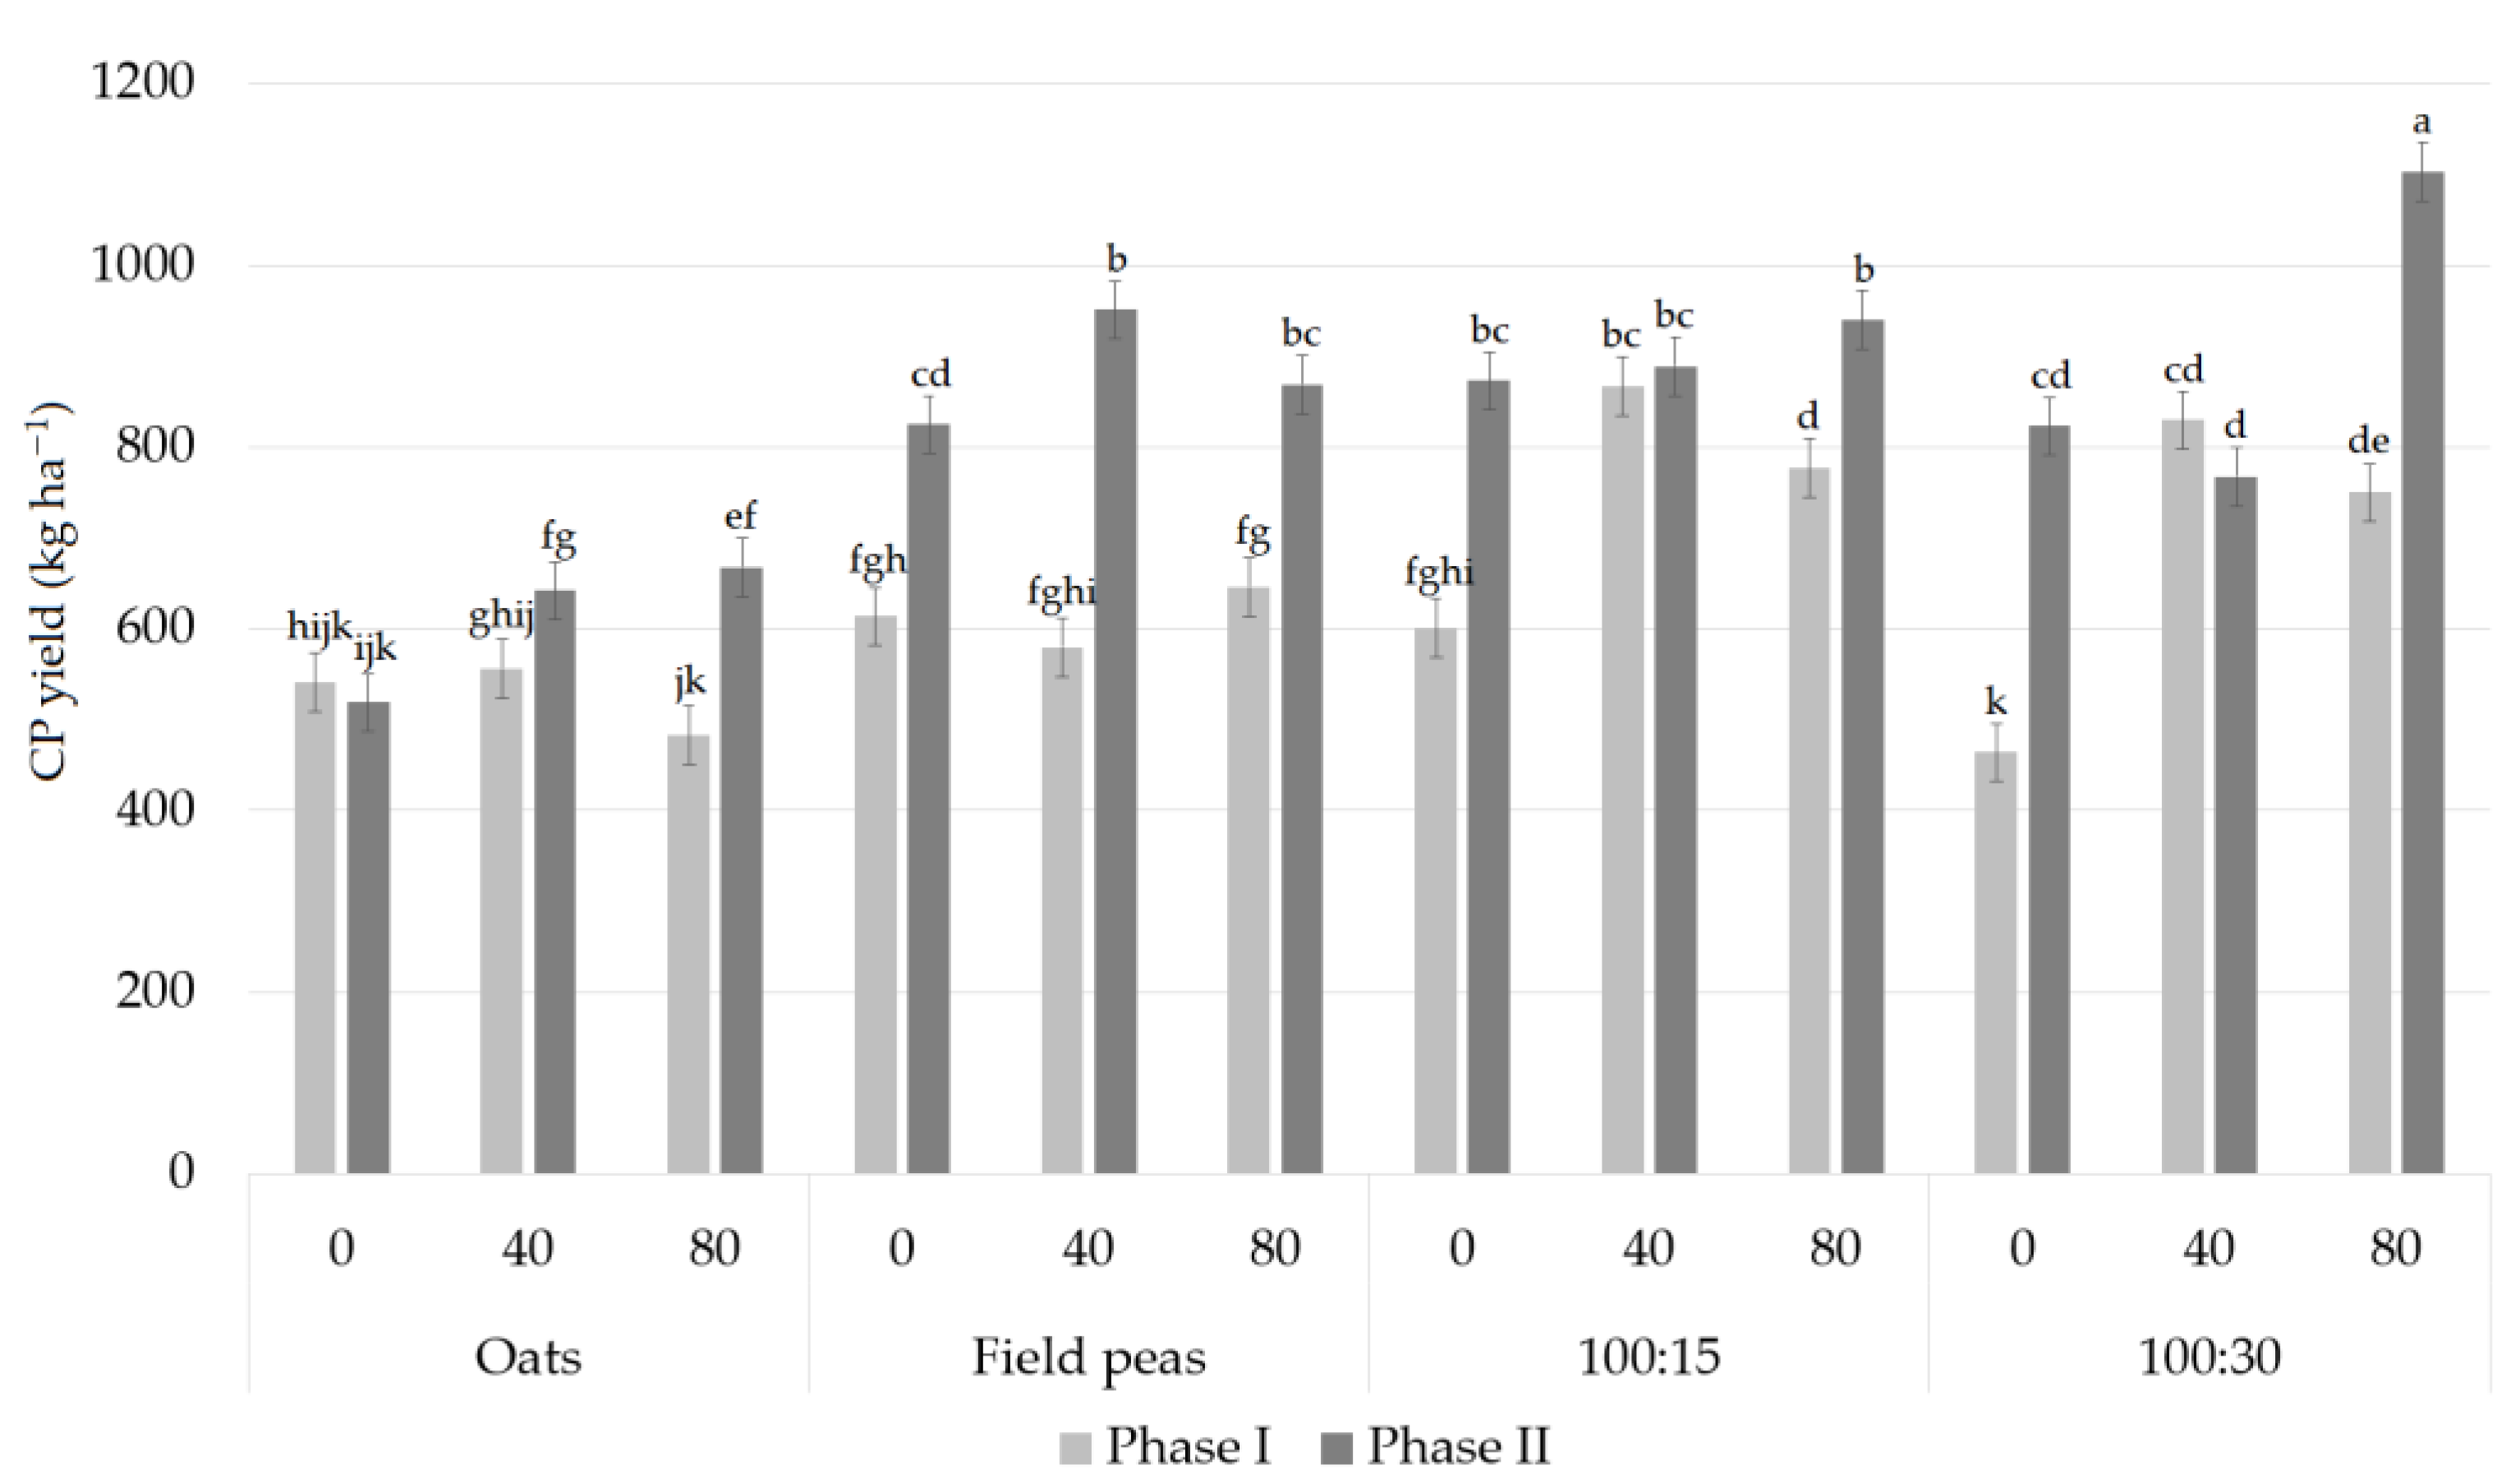
4.3. Crude Protein Yields
4.4. Field Peas’ Share in the Yield and LER
4.5. Economic Analysis
5. Conclusions
Author Contributions
Funding
Institutional Review Board Statement
Informed Consent Statement
Data Availability Statement
Acknowledgments
Conflicts of Interest
References
- Watson, C.A.; Reckling, M.; Preissel, S.; Bachinger, J.; Bergkvist, G.; Kuhlman, T.; Lindström, K.; Nemecek, T.; Topp, C.F.E.; Vanhatalo, A.; et al. Chapter Four—Grain Legume Production and Use in European Agricultural Systems. Adv. Agron. 2017, 144, 235–303. [Google Scholar]
- Samardžić, M.; Vasin, J.; Jajić, I.; Latković, D.; Andreeva, I.; Vasenev, I. Impact of Different Agricultural Practices on Soil Organic Matter Content in Chernozems of the Vojvodina region. Geophys. Res. Abstr. 2018, 20, EGU2018–13902. [Google Scholar]
- Tsiafouli, M.A.; Thébault, E.; Sgardelis, S.P.; De Ruiter, P.C.; van der Putten, W.H.; Birkhofer, K.; Hemerik, L.; de Vries, F.T.; Bardgett, R.D.; Brady, M.V.; et al. Intensive agriculture reduces soil biodiversity across Europe. Glob. Chang. Biol. 2014, 21, 973–985. [Google Scholar] [CrossRef] [PubMed]
- Dordas, C.A.; Vlachostergios, D.N.; Lithourgidis, A.S. Growth dynamics and agronomic-economic benefits of pea-oat and pea-barley intercrops. Crop Pasture Sci. 2012, 63, 45–52. [Google Scholar] [CrossRef]
- Bacchi, M.; Monti, M.; Calvi, A.; Lo Presti, E.; Pellicanò, A.; Preiti, G. Forage Potential of Cereal/Legume Intercrops: Agronomic Performances, Yield, Quality Forage and LER in Two Harvesting Times in a Mediterranean Environment. Agronomy 2021, 11, 121. [Google Scholar] [CrossRef]
- Krga, I.; Simić, A.; Bijelić, Z.; Mandić, V.; Vasiljević, S.; Karagić, Đ.; Milić, D. Interspecies relations and yield of different field pea/oats mixtures. In Analele Universitatii din Craiova-Agricultura, Montanologie, Cadastru; University of Craiova: Craiova, Romania, 2016; Volume 46, pp. 199–205. [Google Scholar]
- Daryanto, S.; Fu, B.; Zhao, W.; Wang, S.; Jacinthe, P.-A.; Wang, L. Ecosystem service provision of grain legume and cereal intercropping in Africa. Agric. Syst. 2020, 178, 102761. [Google Scholar] [CrossRef]
- Ginwal, D.S.; Kumar, R.; Ram, H.; Meena, R.K.; Kumar, U. Quality characteristics and nutrient yields of maize and legume forages under changing intercropping row ratios. Indian J. Anim. Sci. 2019, 89, 281–286. [Google Scholar]
- Cowden, R.J.; Shah, A.N.; Lehmann, L.M.; Kiær, L.P.; Henriksen, C.B.; Ghaley, B.B. Nitrogen Fertilizer Effects on Pea–Barley Intercrop Productivity Compared to Sole Crops in Denmark. Sustainability 2020, 12, 9335. [Google Scholar] [CrossRef]
- Rodriguez, C.; Carlsson, G.; Englund, J.-E.; Flöhr, A.; Pelzer, E.; Jeuffroy, M.-H.; Makowski, D.; Jensen, E.S. Grain legume-cereal intercropping enhances the use of soil-derived and biologically fixed nitrogen in temperate agroecosystems. A meta-analysis. Eur. J. Agron. 2020, 118, 126077. [Google Scholar] [CrossRef]
- Zhao, J.; Zeng, Z.; He, X.; Chen, H.; Wang, K. Effects of monoculture and mixed culture of grass and legume forage species on soil microbial community structure under different levels of nitrogen fertilization. Eur. J. Soil Biol. 2015, 68, 61–68. [Google Scholar] [CrossRef]
- Bedoussac, L.; Journet, E.; Hauggaard-Nielsen, H.; Naudin, C.; Corre-Hellou, G.; Jensen, S.E.; Prieur, L.; Justes, E. Eco-logical principles underlying the increase of productivityachieved by cereal-grain legume intercrops in organic farming. A review. Agron. Sustain. Dev. 2015, 35, 911–935. [Google Scholar] [CrossRef]
- Shao, Z.; Wang, X.; Gao, Q.; Zhang, H.; Yu, H.; Wang, Y.; Zhang, J.; Nasar, J.; Gao, Y. Root Contact between Maize and Alfalfa Facilitates Nitrogen Transfer and Uptake Using Techniques of Foliar 15N-Labeling. Agronomy 2020, 10, 360. [Google Scholar] [CrossRef] [Green Version]
- Thilakarathna, M.S.; McElroy, M.S.; Chapagain, T.; Papadopoulos, Y.A.; Raizada, M.N. Belowground nitrogen transfer from legumes to non-legumes under managed herbaceous cropping systems. A review. Agron. Sustain. Dev. 2016, 36, 58. [Google Scholar] [CrossRef] [Green Version]
- Neugschwandtner, R.W.; Kaul, H.-P. Nitrogen uptake, use and utilization efficiency by oat–pea intercrops. Field Crops Res. 2015, 179, 113–119. [Google Scholar] [CrossRef]
- Šarūnaite, L.; Deveikyte, I.; Arlauskiene, A.; Kadžiuliene, Ž.; Maikšteniene, S. Pea and spring cereal intercropping systems: Advantages and suppression of broad-leaved weeds. Pol. J. Environ. Stud. 2012, 22, 541–551. [Google Scholar]
- Gronle, A.; Böhm, H.; Heß, J. Weed suppressive ability in sole and intercrops of pea and oat and its interaction with ploughing depth and crop interference in organic farming. Org. Agric. 2015, 5, 39–51. [Google Scholar] [CrossRef]
- Lorin, M.; Jeuffroy, M.-H.; Butier, A.; Valantin-Morison, M. Undersowing winter oilseed rape with frost-sensitive legume living mulches to improve weed control. Eur. J. Agron. 2015, 71, 96–105. [Google Scholar] [CrossRef]
- Kocer, A.; Albayrak, S. Determination of forage yield and quality of pea (Pisum sativum L.) mixtures with oat and barley. Turk. J. Field Crops 2012, 17, 96–99. [Google Scholar]
- Vann, R.A.; Reberg-Horton, S.C.; Castillo, M.S.; McGee, R.J.; Mirsky, S.B. Winter Pea, Crimson Clover, and Hairy Vetch Planted in Mixture with Small Grains in the Southeast United States. Agron. J. 2019, 111, 805–815. [Google Scholar] [CrossRef]
- Tsialtas, I.T.; Baxevanos, D.; Vlachostergios, D.N.; Dordas, C.; Lithourgidis, A. Cultivar complementarity for symbiotic nitrogen fixation and water use efficiency in pea-oat intercrops and its effect on forage yield and quality. Field Crops Res. 2018, 226, 28–37. [Google Scholar] [CrossRef]
- Neugschwandtner, R.W.; Kaul, H.-P. Sowing ratio and N fertilization affect yield and yield components of oat and pea in intercrops. Field Crops Res. 2014, 155, 159–163. [Google Scholar] [CrossRef]
- Pellicanò, A.; Romeo, M.; Pristeri, A.; Preiti, G.; Monti, M. Cereal-pea intercrops to improve sustainability in bioethanol production. Agron. Sustain. Dev. 2015, 35, 827–835. [Google Scholar] [CrossRef]
- Baxevanos, D.; Tsialtas, T.I.; Vlachostergios, N.D.; Hadjigeorgiou, I.; Dordas, C.; Lithourgidis, A. Cultivar competitiveness in pea-oat intercrops under Mediterranean conditions. Field Crops Res. 2017, 214, 94–103. [Google Scholar] [CrossRef]
- Li, Y.; Pan, F.; Yao, H. Response of symbiotic and asymbiotic nitrogen-fixing microorganisms to nitrogen fertilizer application. J. Soils Sediments 2019, 19, 1948–1958. [Google Scholar] [CrossRef]
- Meier, U. Growth Stages of Mono-and Dicotyledonous Plants—BBCH Monograph; Federal Biological Research Centre for Agriculture and Forestry: Bonn, Germany, 2001; p. 139. [Google Scholar]
- AOAC. Official Methods of Analysis of the AOAC, 15th ed; Method 984.13; Association of Official Analytical Chemists: Arlington, VA, USA, 1990. [Google Scholar]
- Milentijević, N.; Dragojlović, J.; Ristić, D.; Cimbaljević, M.; Demirović, D.; Valjarević, A. The assessment of aridity in Leskovac basin, Serbia (1981–2010). J. Geogr. Inst. Jovan Cvijic, SASA 2018, 68, 249–264. [Google Scholar] [CrossRef]
- Mead, R.; Willey, R.W. The Concept of a ‘Land Equivalent Ratio’ and Advantages in Yields from Intercropping. Exp. Agric. 1980, 16, 217–228. [Google Scholar] [CrossRef] [Green Version]
- Subić, J.; Roljević Nikolić, S.; Simonović, Z. Evaluation of economic sustainability ecological production vegetables on family farms in Serbia. In Proceedings of the International Symposium “Agrarian Economy and Rural Development—Realities and Perspectives for Romania”, Bucharest, Romania, 14 November 2019; pp. 35–44. [Google Scholar]
- Yang, C.; Fan, Z.; Chai, Q. Agronomic and Economic Benefits of Pea/Maize Intercropping Systems in Relation to N Fertilizer and Maize Density. Agronomy 2018, 8, 52. [Google Scholar] [CrossRef] [Green Version]
- Ballabio, C.; Lugato, E.; Fernández-Ugalde, O.; Orgiazzi, A.; Jones, A.; Borrelli, P.; Montanarella, L.; Panagos, P. Mapping LUCAS topsoil chemical properties at European scale using Gaussian process regression. Geoderma 2019, 355, 113912. [Google Scholar] [CrossRef]
- Blagojević, M.B. Effect of Mutual Relationship, Stage of Development and Inoculation on Silage Quality of Annual Legume and Grain. Ph.D. Thesis, Faculty of Agriculture, University of Belgrade: Belgrade, Serbia, 2017; p. 41. Available online: https://nardus.mpn.gov.rs/bitstream/id/13739/Disertacija.pdf (accessed on 7 April 2021).
- Uzun, A.; Asik, F. The effect of Mixture rates and cutting stages on some yield and quality characters of pea (Pisum sativum L.) + oat (Avena sativa L.) mixture. Turk. J. Field Crop 2012, 17, 62–66. [Google Scholar]
- Maxin, G.; Andueza, D.; Le Morvan, A.; Baumont, R. Effect of intercropping vetch (Vicia sativa L.), field pea (Pisum sativum L.) and triticale (X Triticosecale) on dry-matter yield, nutritive and ensiling characteristics when harvested at two growth stages. Grass Forage Sci. 2017, 72, 777–784. [Google Scholar] [CrossRef]
- Aşci, Ö.Ö.; Acar, Z.; Arici, Y.K. Hay yield, quality traits and interspecies competition of forage pea—Triticale mixtures harvested at different stages. Turk. J. Field Crops 2015, 20, 166–173. [Google Scholar] [CrossRef] [Green Version]
- Yu, Y.; Stomph, T.-J.; Makowski, D.; Zhang, L.; van der Werf, W. A meta-analysis of relative crop yields in cereal/legume mixtures suggests options for management. Field Crops Res. 2016, 198, 269–279. [Google Scholar] [CrossRef] [Green Version]
- Chen, C.; Westcott, M.; Neill, K.; Wichman, D.; Knox, M. Row Configuration and Nitrogen Application for Barley-Pea Intercropping in Montana. Agron. J. 2004, 96, 1730–1738. [Google Scholar] [CrossRef] [Green Version]


| 1. Deep plowing was carried out in the fall to a depth of 25 cm. | 2. Phosphorus and potassium fertilizer was applied approximately one month before sowing. | 3. Seedbed preparation was carried out several days before sowing (5 cm depth). |
| 4. Sowing was performed manually in strips, row spacing 15 cm, in the second half of March. | 5. Seed rates were 150 kg ha−1 for full sowing norms (100%) for both species. | 6. Nitrogen was applied when the first true leaves were formed. |
| 7. After sowing, the experimental plot was rolled to ensure better contact between the seeds and the soil. | 8. Weed removal was performed manually and when necessary. | 9. Harvest was carried out 70–75 days after the sowing (full flowering and full pod formation stage). |
| Harvest Period | I—Approx. 65–70 Days after the Sowing (Full Flowering Phase, BBCH 65–70) | II—Approx. 75 Days after the Sowing (Full Pod Formation Phase, BBCH 75–76) | ||||
|---|---|---|---|---|---|---|
| Nitrogen | 0 kg ha−1 N | 40 kg ha−1 N | 80 kg ha−1 N | 0 kg ha−1 N | 40 kg ha−1 N | 80 kg ha−1 N |
| Crops/Mixtures | Oats | Oats | Oats | Oats | Oats | Oats |
| F. pea | F. pea | F. pea | F. pea | F. pea | F. pea | |
| 100:15% | 100:15% | 100:15% | 100:15% | 100:15% | 100:15% | |
| 100:30% | 100:30% | 100:30% | 100:30% | 100:30% | 100:30% | |
| Year | Organic Matter % | pH Value (KCl) | pH Value (H2O) | N % | P2O5 mg 100 g−1 | K2O mg 100 g−1 |
|---|---|---|---|---|---|---|
| 2016 | 2.163 | 6.32 | 7.05 | 0.06 | 0.2 | 12.3 |
| 2017 | 3.14 | 4.9 | 5.91 | 0.14 | 4.97 | 19.84 |
| 2018 | 2.77 | 6.43 | 7.36 | 0.2 | 42.65 | 21.56 |
| Tested Factors | Plant Height (cm) | Number of Internodes | Biomass Yield (t ha−1) | Hay Yield t ha−1 | Crude Protein Yield (kg ha−1) | ||||||||||
|---|---|---|---|---|---|---|---|---|---|---|---|---|---|---|---|
| Phase | 2016 | 2017 | 2018 | 2016 | 2017 | 2018 | 2016 | 2017 | 2018 | 2016 | 2017 | 2018 | 2016 | 2017 | 2018 |
| I | 112 b | 100.1 b | 87 b | 15.2 b | 14.5 b | 14.3 | 22.79 a | 20.57 a | 18.71 a | 4.51 | 4.64 a | 3.41 b | 572.3 a | 645.5 a | 642.4 b |
| II | 128 a | 109.3 a | 99.5 a | 16.4 a | 15.6 a | 14.6 | 19.14 b | 17.98 b | 17.58 b | 4.64 | 4.43 b | 4.48 a | 474.3 b | 612.2 b | 822.4 a |
| Crop | |||||||||||||||
| Oats | - | - | - | - | - | - | 22.93 a | 17.55 d | 19.34 a | 5.63 a | 4.8 b | 4.53 a | 408.8 c | 391.1 c | 568.3 c |
| F. pea | 119.6 | 108.4 a | 96.9 a | 15.2 b | 14.6 | 13.7 b | 17.97 b | 16.02 c | 16.13 c | 3.16 c | 3.37 c | 2.98 c | 523.6 b | 629.5 b | 747.5 b |
| 100:15 | 121.9 | 104.3 b | 93.1 a b | 16.3 a | 15.2 | 14.8 a | 21.25 a | 21.07 b | 18.17 b | 4.65 b | 4.75 b | 3.93 b | 611.4 a | 755.4 a | 824.4 a |
| 100:30 | 118.5 | 101.4 b | 89.8 b | 15.8 a b | 15.4 | 14.8 a | 21.71 a | 22.45 a | 18.96 a b | 4.88 b | 5.23 a | 4.34 a | 549.4 b | 739.4 a | 789.4 a |
| N (kg ha−1) | |||||||||||||||
| 0 | 120.5 | 101.9 b | 92.7 | 15.7 | 14.2 | 14.5 | 19.75 b | 16.1 c | 17.4 b | 4.31 b | 3.45 c | 3.71 c | 468.3 b | 503.0 c | 657.4 b |
| 40 | 119.8 | 106.5 a | 93.2 | 15.7 | 15.8 | 14.4 | 20.53 b | 19.31 b | 18.22 a | 4.38 b | 4.50 b | 3.93 b | 534.1 a | 618.1 b | 760.5 a |
| 80 | 119.5 | 105.7 a | 93.9 | 15.9 | 15.2 | 14.5 | 22.61 a | 22.42 a | 18.83 a | 5.04 a | 5.66 a | 4.19 a | 567.5 a | 765.4 a | 779.4 a |
| F test | |||||||||||||||
| Phase | ** | ** | ** | ** | * | ns | ** | ** | ** | ns | * | ** | ** | * | ** |
| Crop | ns | ** | ** | * | ns | ** | ** | ** | ** | ** | ** | ** | ** | ** | ** |
| N | ns | * | ns | ns | ns | ns | ** | ** | ** | ** | ** | ** | ** | ** | ** |
| Phase × Crop | ns | ns | ns | ns | ns | ns | ns | ns | ns | ns | ** | ns | ** | ** | ** |
| Phase × N | ns | ns | ns | ns | ns | ns | ns | ** | ns | ns | ** | * | ns | ** | ** |
| Crop × N | ns | ** | ns | ns | ns | ns | ns | ** | * | ns | ** | * | ns | ** | ** |
| Phase × Crop × N | ns | * | ns | ns | ns | ns | * | ** | * | ns | * | ** | ns | ** | ** |
| Tested Factors | Share in Yield % | LER | ||||
|---|---|---|---|---|---|---|
| Mowing phase | 2016 | 2017 | 2018 | 2016 | 2017 | 2018 |
| I | 58.32 | 57.30 a | 47.89 b | 1.03 b | 1.36 | 1.08 |
| II | 61.75 | 51.23 b | 56.13 a | 1.27 a | 1.3 | 1.05 |
| Crop | ||||||
| 100:15 | 66.33 a | 56.86 a | 58.67 a | 1.17 | 1.29 | 1.05 |
| 100:30 | 53.74 b | 51.67 b | 45.35 b | 1.14 | 1.37 | 1.07 |
| N (kg ha−1) | ||||||
| 0 | 65.88 a | 57.57 a | 54.95 | 1.13 | 1.39 a | 0.98 b |
| 40 | 62.33 a | 53.74 a b | 50.83 | 1.19 | 1.42 a | 1.1 a |
| 80 | 51.9 b | 51.48 b | 50.25 | 1.14 | 1.19 b | 1.11 a |
| F test | ||||||
| Phase | ns | ** | ** | ** | ns | ns |
| Crop | ** | ** | ** | ns | ns | ns |
| N | ** | * | ns | ns | * | ** |
| Phase × Crop | ns | ns | * | ns | ns | ns |
| Phase × N | * | ns | ns | ns | ns | ** |
| Crop × N | ns | ns | ns | ns | ns | ns |
| Phase × Crop × N | ns | ns | ns | ns | * | ns |
| Mixture 100:15 | Mixture 100:30 | ||||||
|---|---|---|---|---|---|---|---|
| Item Description | Rate of nitrogen (kg ha−1) | ||||||
| 0 | 40 | 80 | 0 | 40 | 80 | ||
| A | Farm machinery operation cost with labor force (EUR h−1) | ||||||
| Plowing | 48.2 | 48.2 | 48.2 | 48.2 | 48.2 | 48.2 | |
| Application of mineral fertilizers | 11.9 | 11.9 | 11.9 | 11.9 | 11.9 | 11.9 | |
| Tilling | 12.7 | 12.7 | 12.7 | 12.7 | 12.7 | 12.7 | |
| Harrowing | 7.6 | 7.6 | 7.6 | 7.6 | 7.6 | 7.6 | |
| Sowing | 21.2 | 21.2 | 21.2 | 21.2 | 21.2 | 21.2 | |
| Rolling | 5.9 | 6.8 | 6.8 | 6.8 | 6.8 | 6.8 | |
| Top dressing with N | 0.0 | 11.9 | 11.9 | 0.0 | 11.9 | 11.9 | |
| Crop mowing | 70.0 | 70.0 | 70.0 | 70.0 | 70.0 | 70.0 | |
| Transport | 12.3 | 12.3 | 12.3 | 12.3 | 12.3 | 12.3 | |
| Total | 189.8 | 201.7 | 201.7 | 189.8 | 201.7 | 201.7 | |
| B | Raw materials cost (EUR h−1) | ||||||
| Seed pea | 159.0 | 159.0 | 159.0 | 159.0 | 159.0 | 159.0 | |
| Sed oats | 11.5 | 11.5 | 11.5 | 22.90 | 22.90 | 22.90 | |
| Phosphate (KH2PO4) | 94.8 | 94.8 | 94.8 | 94.8 | 94.8 | 94.8 | |
| Potash (K2SO4) | 61.8 | 61.8 | 61.8 | 61.8 | 61.8 | 61.8 | |
| Nitrogen (27% N) | 0.0 | 13.2 | 26.3 | 0.0 | 13.2 | 26.3 | |
| Total | 327.0 | 340.2 | 353.4 | 338.49 | 351.1 | 364.8 | |
| Inputs* (A + B) | 516.8 | 541.9 | 555.1 | 528.3 | 553.3 | 566.5 | |
| Subsidies (EUR ha−1) | 33.9 | 33.9 | 33.9 | 33.9 | 33.9 | 33.9 | |
| 1 | Total inputs (EUR ha−1) | 482.9 | 508.0 | 521.2 | 494.4 | 519.4 | 532.6 |
| 2 | Yield dry fodder mass (kg ha−1) * | 4006.9 | 4443.6 | 4871.2 | 4348.8 | 4779.0 | 5321.7 |
| 3 | Share of pea in the yield (%) * | 62.9 | 64.2 | 54.8 | 56.1 | 47.1 | 47.6 |
| 4 | Price of dry pea mass (EUR kg−1) | 0.15 | 0.15 | 0.15 | 0.15 | 0.15 | 0.15 |
| 5 | Price of dry pea oats (EUR kg−1) | 0.08 | 0.08 | 0.08 | 0.08 | 0.08 | 0.08 |
| 6 | Total Output (EUR ha−1) * | 511.3 | 571.5 | 596.3 | 533.8 | 560.2 | 625.1 |
| 7 | Net Returns (EUR ha−1) | 28.4 | 63.5 | 75.1 | 39.4 | 40.8 | 92.5 |
| 8 | Benefit–cost Ratio | 0.06 | 0.13 | 0.14 | 0.08 | 0.08 | 0.17 |
Publisher’s Note: MDPI stays neutral with regard to jurisdictional claims in published maps and institutional affiliations. |
© 2021 by the authors. Licensee MDPI, Basel, Switzerland. This article is an open access article distributed under the terms and conditions of the Creative Commons Attribution (CC BY) license (https://creativecommons.org/licenses/by/4.0/).
Share and Cite
Krga, I.; Simić, A.; Dželetović, Ž.; Babić, S.; Katanski, S.; Nikolić, S.R.; Damnjanović, J. Biomass and Protein Yields of Field Peas and Oats Intercrop Affected by Sowing Norms and Nitrogen Fertilizer at Two Different Stages of Growth. Agriculture 2021, 11, 871. https://doi.org/10.3390/agriculture11090871
Krga I, Simić A, Dželetović Ž, Babić S, Katanski S, Nikolić SR, Damnjanović J. Biomass and Protein Yields of Field Peas and Oats Intercrop Affected by Sowing Norms and Nitrogen Fertilizer at Two Different Stages of Growth. Agriculture. 2021; 11(9):871. https://doi.org/10.3390/agriculture11090871
Chicago/Turabian StyleKrga, Ivan, Aleksandar Simić, Željko Dželetović, Snežana Babić, Snežana Katanski, Svetlana Roljević Nikolić, and Jelena Damnjanović. 2021. "Biomass and Protein Yields of Field Peas and Oats Intercrop Affected by Sowing Norms and Nitrogen Fertilizer at Two Different Stages of Growth" Agriculture 11, no. 9: 871. https://doi.org/10.3390/agriculture11090871
APA StyleKrga, I., Simić, A., Dželetović, Ž., Babić, S., Katanski, S., Nikolić, S. R., & Damnjanović, J. (2021). Biomass and Protein Yields of Field Peas and Oats Intercrop Affected by Sowing Norms and Nitrogen Fertilizer at Two Different Stages of Growth. Agriculture, 11(9), 871. https://doi.org/10.3390/agriculture11090871