Abstract
Nitrogen is an essential nutrient element required for optimum crop growth and yield. If a specific amount of nitrogen is not applied to crops, their yield is affected. Estimation of nitrogen level in crops is momentous to decide the nitrogen fertilization in crops. The amount of nitrogen in crops is measured through different techniques, including visual inspection of leaf color and texture and by laboratory analysis of plant leaves. Laboratory analysis-based techniques are more accurate than visual inspection, but they are costly, time-consuming, and require skilled laboratorian and precise equipment. Therefore, computer-based systems are required to estimate the amount of nitrogen in field crops. In this paper, a computer vision-based solution is introduced to solve this problem as well as to help farmers by providing an easier, cheaper, and faster approach for measuring nitrogen deficiency in crops. The system takes an image of the crop leaf as input and estimates the amount of nitrogen in it. The image is captured by placing the leaf on a specially designed slate that contains the reference green and yellow colors for that crop. The proposed algorithm automatically extracts the leaf from the image and computes its color similarity with the reference colors. In particular, we define a green color value (GCV) index from this analysis, which serves as a nitrogen indicator. We also present an evaluation of different color distance models to find a model able to accurately capture the color differences. The performance of the proposed system is evaluated on a Spinacia oleracea dataset. The results of the proposed system and laboratory analysis are highly correlated, which shows the effectiveness of the proposed system.
1. Introduction
After water, nitrogen (N) is one of the most important macronutrients in plants [1], as it is associated with proteins that are directly involved in plant metabolic processes. Therefore, to get higher crop production and to improve food quality, an adequate supply of nitrogen is required by plants. It plays a fundamental role in enhancing the yield and productivity [2]. Nitrogen deficiency is characterized by poor plant growth and pale yellow leaves due to insufficient chlorophyll content and some environmental stresses [3].
Nitrogen is a key component of the chlorophyll that intensifies photosynthesis in crops [4,5,6,7], and plant yield is affected by irregularity in nitrogen content [8,9,10]. The amount of nitrogen required for each crop varies [11,12,13,14]. Leaf color is an indicator of many plants’ nutrients status especially the chlorophyll content in the leaf [15]. The color and texture of the leaf determine the nitrogen status in the crop as the nitrogen deficiency changes the color of the leaf [16,17]. If the color of the leaf is green, it means that the leaf is healthy, and it tends to be yellow if the plant suffers from nitrogen deficiency.
Chlorosis or leaf yellowing in plant leaves mainly occurs due to interference in the production of chlorophyll contents of the plant. Yellowing in leaves may appear for different reasons, e.g., improper irrigation, poor drainage, root damage or compacted roots, improper soil pH, and lack of proper nutrients. Improper nutrient supply is the major cause of depigmentation and lowers chlorophyll contents in leaves. However, causes can be differentiated based on other symptoms that accompanied pigmentation and some special characteristics of pigmentation. For instance, in the case of nitrogen deficiency, a general yellowing has been observed [18]. Older, inner leaves turn yellow first, and as it progresses, yellowing moves outward, eventually reaching young leaves.
Different techniques are used for nitrogen measurement in plants and crops, including chemical analysis of leaves in laboratory, texture analysis, leaf color matching chart, etc. [19,20]. These techniques are very time-consuming, require skilled manpower, and are costly, which can lead to economic crisis [21]. Moreover, the traditional methods used for nitrogen estimation in plants do not enjoy high accuracy because of different environmental factors and human error during analysis. In this era of automation, the techniques used by farmers are mostly manual and require some external devices and their experts.
To overcome these challenges, agricultural methods have been becoming automated for years, and computer vision is proving to help achieve this goal. Most computer-aided systems examine the leaf images taken by cameras and apply different image processing techniques to estimate the nutrients or chlorophyll content in the leaves. Some of these systems require an external hardware device to operate them [4,22], and others require a specific camera to capture these images [23]. Many methods using RGB-based segmentation are centered on agronomic plants [24,25,26,27,28,29,30,31]; thus, they are restricted in tropical trees study. The existing systems work in a specific environment with controlled illumination and fixed parameters. A major limitation of these existing systems is that they are not easily accessible, and they are also expensive. It is difficult for farmers to develop a controlled environment or take images with specific cameras.
The major contribution of this research is the proposal of an image processing framework for nitrogen nutrient (n-nutrient) estimation in field crops and plants. The proposed framework is fully automated and requires minimum human assistance, limited to capturing the plant leaf images. Moreover, the proposed framework is customizable for image color models and leaf color analysis methods. Finally, we present an efficient method to estimate the N nutrients in plants. In the proposed method, a crop leaf is placed in a specially designed slat, and its image is captured with any normal camera, including the smartphone camera. The leaf image is processed to extract the leaf and the reference colors from the image. Various statistical properties of these colors are computed and analyzed to predict the nitrogen content in the leaf. We also evaluated different existing color distance models to find the best model that accurately captures the difference between the leaf color and reference colors. In the present study, the performance of the proposed system is tested on Spinacia oleracea leaves, and the results are found to be favorable.
2. Review of Existing Methods
Nitrogen measurement in plants is carried out by four manual methods: chemical test, normalized vegetation index, leaf color chart, and SPAD meter [32]. the Kjeldahl-digestion method is a popular chemical analysis-based method for nitrogen nutrition estimation. The method was developed by Johan Kjeldahl [33], and it works in three steps. First, sample leaf powder is mixed in a Kjeldahl flask with concentrated acid in a specific ratio. To evolve the CO, the mixture is heated at high flame, and the end product is an ammonium sulfate solution. Second, to get ammonia from ammonium ion (present in ammonium sulfate), sodium hydroxide is added into the mixture. Ammonia gas is evolved by heating the solution, which is trapped in the solution of boric acid and standard acid in the flask. In the final step, titration is used for ammonia estimation in the sample; the ammonia concentration is proportional to the nitrogen content. The reagents used in this process are analyzed in the study [34]. This method gives quite accurate results, but it is very tedious and time-consuming [32].
Soil–Plant Analysis Development (SPAD) is one of the optimal methods for the calculation of plant chlorophyll content. The SPAD meter does not give accurate values but a unitless relative chlorophyll value which can be converted into nitrogen quantity [35]. However, SPAD gives more accurate results for small samples, especially in ornamental plants as it is sensitive to chemical changes in leaves [36].
The leaf color chart is another means to estimate n-nutrition status in plants. This chart has different shades of green, which are matched to the leaf color to get an estimate of nitrogen content in the leaf. Every crop has its leaf color chart with different shades of green according to its possible leaf colors [37]. This method is simple but not very accurate [21].
All the above-mentioned methods are manual and very time-consuming, and some of them also require skilled staff. Recently, computer-aided design (CAD) for nitrogen estimation has attracted significant research efforts. In particular, image processing, optical, and multi-spectral based nitrogen estimation techniques have been proposed for different crops and vegetables, e.g., [4,13,20,21,22,24,28,30]. Normalized difference vegetation index (NDVI) is a remote sensing technique for vegetation, which has been used for quite some time now [38]. To determine the live green vegetation of the crop, NDVI uses the visible and near-infrared band of the spectrum. This method, however, is expensive and is not suitable for nitrogen estimation in a small area of crops [21]. Numerous methods e.g., [29,30,31] exploit the red–green–blue (RGB) color model for chlorophyll estimation and nitrogen content in the plants and crops.
The chlorophyll meter was the very first tool introduced for the measurement of the chlorophyll contents in plants. The leaf chlorophyll has the property of absorbing the red frequency, but infrared cannot be absorbed in it. Therefore the chlorophyll meter emits the red and infrared frequencies of light and uses the difference in absorption of both frequencies. Based on this differences, the meter estimates the chlorophyll content in the leaf [39]. The studies in [11,40] use reflectance and absorbance in tropical tree areas to estimate nitrogen in plants. Kawashima et al. [23] proposed a system for measuring chlorophyll content in crops. They use a digital camera to capture leaf images and calculate the ratios of different combinations of red (R), green (G), and blue (B) colors. The research concluded that the ratio of the red and blue channels gives the best correlation with the chlorophyll content. The nitrogen estimation algorithms presented in [20,41,42] also use color image analysis. The system in [43] uses three-wavelength diffuse reflectance for nitrogen estimation in plants. Similarly, systems proposed in [44] used the CIE-LAB color system to estimate nitrogen content in leaves. The system proposed in [4] presents a manually operated trolley by which images of crop leaves were captured to predict nitrogen amount in a specific field. The system consists of a camera to capture an image, four lights for proper lighting, and a laptop for system processing. The system was semi-automated and required an operator to handle and operate it properly. The image processing-based system proposed in [45] estimates the leaf chlorophyll content at a canopy scale. It presented a triangular greenness Index (TGI) and other spectral indices for a low-cost indicator of fertilizer requirement in various crops.
The study presented in [46] analyzed various image processing techniques and concluded that color model-based techniques give the most accurate results of nitrogen measurement in plants. The system in [47] uses an artificial neural network to predict the leaf color chart (LCC) panel of the leaf. The system correctly classified the LCC chart cum SPAD meter with good accuracy for rice leaves. The system proposed in [48] also uses a digital camera to calculate nitrogen measurement in cotton plants. The method presented in [49] uses three color models for estimating nitrogen in rice crops. After image segmentation, 13 color indices were calculated from three color models (i.e., RGB, Lab, and HSV). The values were compared with plant nitrogen status, and a significant correlation was found. The algorithm proposed in [50] uses an optical method for the measurement of chlorophyll content in crops. The method in [1] also uses the RGB color image analysis nitrogen estimation in crops. The study presented in [51] used nursery plants seedlings of five tropical trees, and 10 different indexes of RGB were calculated and correlated with SPAD results.
3. Methodology
The amount of nitrogen nutrient in plants is estimated by analyzing the color of the leaves. In most crops, the leaf color shows the level of nitrogen in the plants and crops; the crop is healthy if the color is lush green but gets pale-yellow with a deficiency of nitrogen in the absence of biotic and abiotic stresses. Like many other image-processing-based systems, the proposed method also exploits this basic phenomenon to estimate the n-nutrient in crops. The proposed method has three steps. First, the image of the selected leaf is captured using any ordinary camera and a specially designed leaf board, also known as slate. The leaf board is white in color with two reference green and yellow-colored circles. Second, the leaf and the reference color circles are automatically segmented from the image using different image processing techniques. Third, the average color of the leaf is computed and compared with the reference colors to estimate the green color value (GCV) index, which is found to be highly correlated with the chlorophyll content in the plants. Moreover, we also evaluate many existing color based methods for n-nutrient estimation and compare their performance with the proposed method using various statistical tools.
3.1. Image Processing
3.1.1. Image Acquisition
The first step in any computer-based algorithm for n-nutrient estimation is leaf image acquisition. This is a critical step as the quality of the image can affect the accuracy of the later processing steps. The lighting conditions can affect the leaf color in the image. For example, if the image is taken in bright light, the RGB values are higher than the original leaf color and the image becomes brighter. Conversely, when the image is taken in low light, the RGB values are lesser than the original colors, so it becomes darker than the original. Therefore, it is important to control the illumination and other factors that can impact the color of the leaf and hence the accuracy of the method. Some existing systems use a digital camera, e.g., [25,28,31,52], others use smartphone camera [29,53], and still other use scanners [27,30,54] or hyperspectral imaging systems [55] for image acquisition. Many existing systems capture images in a specially controlled environment, e.g., [4,26,28,29].
In order to overcome the above-mentioned problems, the proposed system obtains the reference colors from the same leaf image. To ensure accurate results in both dark and bright environments, a special slate was made having a green and a yellow color circle on it. These circles are used as reference colors in the n-nutrient estimation. The designed slate and a sample leaf image are shown in Figure 1. Leaves were placed on the above-mentioned slates and images were captured by using an ordinary smartphone camera.
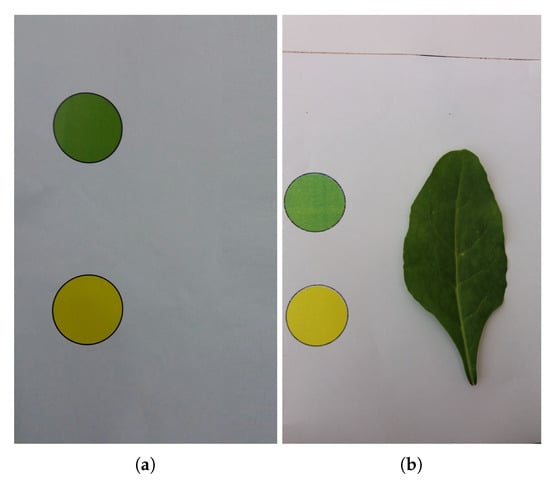
Figure 1.
(a) Slate being used to capture the plant leaf image, (b) a sample spinach leaf image captured with a smartphone camera using the slate in (a).
3.1.2. Region of Interest Detection
To analyze the leaf color with the reference green and yellow colors, the leaf and the two reference color circles must be identified and extracted from the image. For object detection, the bounding box method is used, which identifies each object as one bounding box. The process starts by converting the image into grayscale, and then Otsu’s method is applied to obtain its global threshold for converting the grayscale image to a binary image. Finally, all the bounding boxes in that image are detected. Let I be a leaf image of size and be its the binary image. Each pixel of the binary image is picked, and its 8-connected pixels are checked by voting technique. The connected pixels with a value of 1 correspond to a region and are considered as one bounding box. Let , be the n bounding boxes detected in image I. For each bounding box, four attributes are computed, namely , , , and , representing starting x value, starting y value, width, and height of the box, respectively. Some of the detected bounding boxes are too small, and a few are very large, covering the whole page. Figure 2a shows the results of detecting the bounding boxes on the image shown in Figure 1b, and the detected bounding boxes are highlighted in red color.
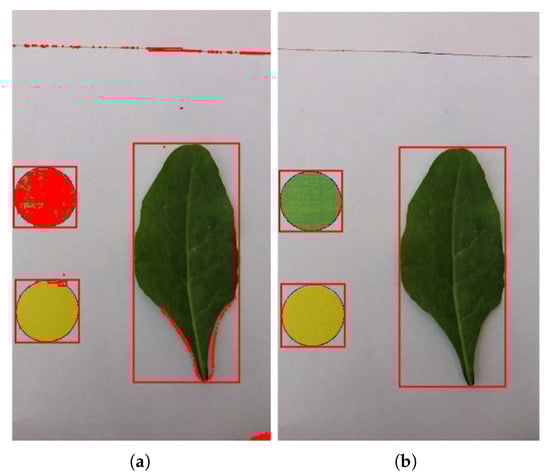
Figure 2.
Objects detection. (a) All objects detected in the image (Figure 1b) using the bounding box algorithm, (b) the detected three regions of interests containing the reference color circles and the leaf using the proposed strategy.
From all the detected bounding boxes, we are concerned only with the boxes containing the reference circles, which may appear in oval or elliptical shape due to change in camera orientation while capturing the image. We devise a method using the ratio between the width and the height of the boxes to efficiently identify the objects of interests. Let be the ratio of box width to height and let be the ratio of box height to width.
The boxes containing the reference color circles appear as (nearly) square, and they can be detected by the ratio and . Since they are almost square, these ratio should be close to 1. From the experiments, we found that the following limits serve the best in detecting the reference color circles.
It is observed that sometimes the whole page is detected as a square or elliptical box. Obviously it can not be the circle we are interested in, and such cases are rectified by confirming that the ratio of the the box height to the image height is not large; it should be less than 0.6; that is, a valid reference color box should satisfy the following relation:
where is the box height and N is image height. With the help of (3) and (4), the two boxes containing the green and the yellow reference circles are detected and extracted from the original image; that is, a bounding box contains the reference circles if
The remaining image contains only the leaf, which is extracted by background removal using the Gaussian mixture model that is explained in the following Section 3.1.3.
In Figure 2, the results of the proposed object detection strategy are presented. Figure 2a shows the objects detected in the image (Figure 1b) using the bounding box algorithm. Figure 3 shows the detected regions of interests containing the reference color circles (Figure 3a,b. The rest of the image, excluding the circles’ region, is shown in Figure 3c. These regions containing the green and yellow color circles are referred to as and , respectively and the remaining image containing the leaf is denoted as in the rest of the text.
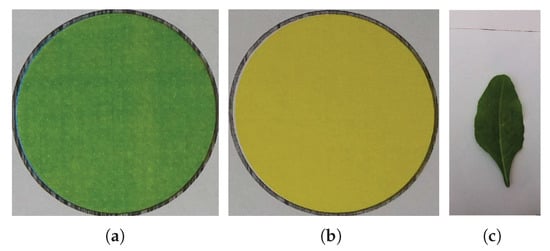
Figure 3.
The extracted regions of interest in Figure 2b: (a) , (b) , (c) .
3.1.3. Background Removal
In order to accurately calculate the color, the background of the circles and the leaf must be removed. It can be achieved by color-based thresholding techniques but from experiments, we found that such techniques are not very accurate. Therefore, to ensure that only green and yellow colors are used in the analysis for reference color, the backgrounds of both images () was removed by applying different rules based on the distance of pixels from radius. For each region, and , their centers () are estimated,
where and represent the width and the height of image , respectively. Since the circle is inscribed in the square box, its radius is half the width or height (i.e., ) of the box. The pixels with distance greater than the radius lie outside the circle and are removed. For each pixel location , its value is updated according to the following rule.
where is the distance of the pixel from the center of the box (), calculated as,
The background of the other circle () is removed analogously. However, since the leaf image may contain complex structures, e.g., veins and different colors, it is difficult to obtain an accurate segmentation using simple color-based thresholding. The background of the leaf image () is removed by using Gaussian Mixture Model (GMM). It divides the image into two clusters, and pixels are characterized in RGB space by their intensity [56,57]. Each pixel in the image is modeled into Gaussian distribution. The likelihood of a pixel in the image () at time t of each cluster is calculated.
where K is the number of clusters (here assumed as two, i.e., foreground and background), is a weight associated with the Gaussian in image at t with mean and standard deviation :
Since the background is dominant in the images, the background pixels are expected to have more weight and less variance. Therefore, the first b Gaussian distributions having weights greater than the designated threshold T are background pixels; therefore, the pixels are classified as background pixels (B) by the following rule, and the rest is foreground.
If a pixel matches with a K-Gaussian, the values of , , and are updated; otherwise, only ’s value is updated. Using the above-mentioned model, the leaf pixels were separated from the background, turning the background pixels into black and keeping the leaf pixels unchanged.
It is observed that even after applying the GMM, some background pixels may still appear as foreground. To resolve this issue, the image is converted into HSI space, with , , and representing the hue, saturation, and intensity, respectively. We observed that the leaf pixels always has hue and saturation components greater than and , respectively. Therefore, any non-leaf pixel incorrectly marked as leaf is removed by holding these two conditions. That is,
and
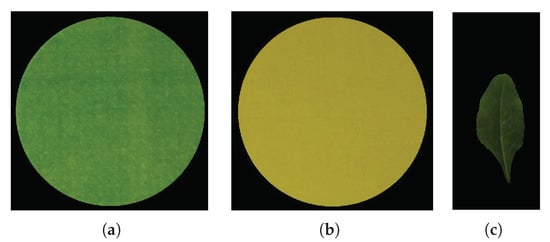
Figure 4.
The reference color circles and the leaf image after background removal: (a) , (b) , (c) .
3.1.4. Nitrogen Estimation
After removing the background, we have both the reference circles and the leaf. The mean color value of the three objects is computed for each color channel, red, green, and blue denoted, as and , respectively.
The mean color values of the reference yellow circle () and the leaf () are also calculated analogously. The green color value (GCV) index of the leaf is now computed by calculating the distance of the leaf mean color from the reference green and yellow colors. Let be the distance of the leaf from the green reference color and be the distance of the leaf from the yellow reference color computed using any color distance model. The GCV is then computed as the percentage of their ratio.
The value of GCV represents the n-nutrient percentage present in the leaf. There exist numerous ways to compute the color differences and , which are briefly explained in the following section.
3.2. Model Development
Numerous color distance models are available that can be used to compute the leaf color difference from the reference colors. We evaluated these models to find the most suitable model for the problem at hand. These models are briefly introduced in the following sections.
3.2.1. Euclidean Distance
The simplest method of finding distance between two colors within a RGB color space is the Euclidean distance. It computes the distance between two colors and as
where , , and .
3.2.2. Color Approximation Distance
The perception of brightness in the human eye is non-linear. From the experiments, it appears that the curve for this non-linearity is not the same for each color [58,59]. Therefore, there have been many attempts to weight RGB values to better fit human perception, where the components are commonly weighted. The color approximation distance between two colors and is calculated as:
where .
3.2.3. CIEXYZ
The RGB color space is not visualized clearly. Since the human eye has three types of color sensors that correspond to different wavelengths, a full plot of visible color is three-dimensional color. The CIE XYZ [60] color space includes all the colors that are visible to a human eye. Therefore, in order to obtain more precise results, the color values were first converted into CIE XYZ color space and then their distance was calculated. The following transformation is used to convert mean values into the CIE XYZ color space.
The normalized tristimulus values x, y, and z were calculated from X, Y, and Z, and the difference between two colors in xy-chromaticity space is computed by the simple distance formula:
The position of the reference colors and the leaf is shown in the Figure 5. The distance to the leaf from both reference colors is shown as and .
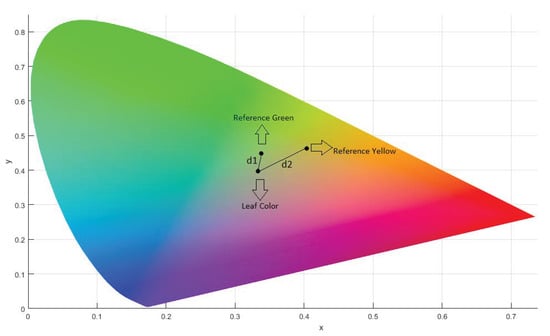
Figure 5.
CIEXYZ Chromaticity Diagram.
3.2.4. CIE76
The CIELAB (L*a*b*) color space was introduced in 1076, which was said to be a uniform color-space [61]. In any uniform color space, the color difference is easily calculated by Euclidean formula and expressed as a straight line. The difference between two colors and in CIELAB color space is calculated by following formula.
where , , and .
3.2.5. CIE94
Different color distance models have been explored to address the non-uniformities by retaining the CIELAB color space. These methods are generally more accurate for human perception to colors differences. was defined in color space with differences in lightness, chroma, and hue calculated from Lab-coordinates [62,63]. The difference between two colors and is computed as
where , . The further details of the model can be found in [62].
3.2.6. CIEDE2000
The CIE organization decided to fix the lightness inaccuracies by introducing . It is currently the most complicated, CIE color difference algorithm, yet it is accurate [64,65,66]. The difference between two colors is calculated in as follows.
A comprehensive description of the model and its computation can be found in [65].
3.2.7. CMC l:c
Since the human eye is sensitive to chroma, the difference of colors can be visualized more clearly in color space [66]. calculates the color difference in LCh color space. It has two parameters, lightness (l) and chroma (c), allowing the users to weight the difference based on the ratio of that is deemed appropriate for the application. The distance between two colors and is found as:
where , , and are computed from the l and c components, as explained in [66].
4. Evaluation of Dataset
In this section, we introduce the dataset used to test the performance of the proposed nitrogen estimation method. In the second part of the section, we present the various statistical metrics and tools used to evaluate the performance the proposed method.
4.1. Sample Collection and Processing
To evaluate the performance of the proposed method, a set of 15 spinach leaves were collected from the field. They were not grown under controlled conditions. The choice of plants was done in such a way that the dataset contains samples with different n-nutrient contents. One leaf from each selected plant was taken for experiment. The leaves were placed one by one on the designed slate and images were captured by using a simple mobile phone camera. To test the robustness of the system, the leaf was placed in different locations on the slate, confirming all four positions of the circles, i.e., circles on the left, right, top, and bottom of the leaf. It may be noted that leaves have different orientations and shape, making the dataset challenging for accurate leaf and reference circle detection. The amount of nitrogen in each leaf was calculated by KJeldahl’s method (discussed in Section 2), which serves as the ground truth for the test dataset.
4.2. Performance Evaluation Parameters
We evaluated the performance of the proposed algorithm and compared the results with various existing color-based n-nutrient estimation algorithms. For each test image, the leaf n-nutrient in terms of GCV is computed. For test leaves in the dataset, their nitrogen values were calculated in the laboratory by the KJeldahl method and are used as ground truth in this analysis. The objective scores computed by the proposed method were compared with the corresponding ground truth to estimate different correlations to assess its accuracy. We used the logistic function for non-linear mapping outlined in [67] of nitrogen values with the proposed system results and other compared methods before computing the performance parameters.
Different correlations between the objective scores and the ground truths are computed to evaluate the performance of the proposed method. In addition to the conventionally used coefficient of determination, also known as R-squared (R), we used various other statistical metrics in performance evaluation. These include Pearson linear correlation coefficient, Spearman rank correlation coefficient, Kendall rank correlation coefficient, and root mean square error.
The coefficient of determination, also known as R-squared (R), measures the degree of variability of one variable that can be caused by its relationship to another related variable. Its value varies between 0 and 1, and a higher value indicates a better fit for the observations.
where are the fitted (predicted) values against the actual values y and is the mean of the y values.
The Pearson linear correlation coefficient (PLCC) is the most common measure of correlation. It shows the linear relationship between two sets of data. It is a normalized measure of covariance, such that it gives results between −1 and 1. If the result is 0, there is no correlation between points. A positive result shows a positive correlation, and a negative resultant value shows a negative correlation between data points.
where and are the mean values of x and y values.
The Spearman’s rank correlation coefficient (SROCC) is a non-parametric version of PLCC measuring the direction and strength of both ranked values association. It assesses how well the relationship between two data points can be described using a monotonic function. If the rank between the two data values is similar, the SROCC has high values; otherwise, if the data values are not (or less) similar, its value is low. We therefore correlate the proposed values with ground truth in order to get the similarity measure between them using the monotonic function.
where n is number of observations.
Kendall rank correlation coefficient (KROCC) is also a non-parametric measure to determine the strength of dependence between two data points on an ordinal scale. It measures the similarity of the orderings of the data when ranked by each of the quantities and tells us that how many the data points are dependent on each other.
where is the number of concordant and is the number of discordant.
Root mean square error (RMSE) is the commonly used measure of difference between predicted and the actual values. It is the standard deviation of residual (prediction error). It measures the error between the predicted and actual values. Lower values mean there is less difference in both values; i.e., if the correlation coefficient is 1, the RMSE is 0. Since the errors are squared before taking average, RMSE is high in large errors. Therefore, it is more useful when dealing with large errors.
5. Results and Discussion
In this section, we report the experiments performed to evaluate the performance of the proposed method and also compare it with the performance of existing similar methods introduced to estimate the nitrogen in plants. Moreover, numerous experiments were also performed to test the performance of different color distance models to find the best-suited model for the nitrogen estimation.
In the first experiment, we evaluate the performance of the proposed system with different color distance models, introduced in Section 3.2. The proposed method with each color distance model was executed on the whole test dataset, and nitrogen percentage was computed. The performance parameters were computed with the obtained scores and the ground truth values. The results of these experiments are presented in Table 1.

Table 1.
Performance of different methods used for nitrogen calculation. The best results are marked in bold.
The RGB color-space -based distance models showed more than 65% R, performing better than the CIEXYZ, and CMC l:c models, which achieved less than 12% R. The performance of CIE76 and CIE94 models are similar to the RGB color-space-based distance models, achieving R of 66% and 63%, respectively. The results show that the CIEDE2000 model performs the best, with more than 91% R. The results in terms of PLCC are similar to R. For example, the RGB color-space-based distance models show more than 80% PLCC, performing better than the CIEXYZ and CMC l:c, based models, which achieved less than 43% PLCC. The best results were found by using CIEDE2000 distance calculation method, showing the PLCC of more than 95%. A similar trend can be observed with SROCC and KROCC measures and RMSE. Therefore, in the proposed algorithm, we choose the CIEDE2000 model for measuring the difference between the leaf and the reference colors.
Scatter plots are typically used to show the agreement between two or more variables of data. A scatter plot is a type of plot or mathematical diagram using Cartesian coordinates to display values for typically two variables for a set of data. We use this plot to show how well the nitrogen content in the leaves correlates with the values extracted from the pictures. Figure 6 shows the scatter plot where the x-axis represents the values (%) estimated by the proposed system, and the y-axis represents the ground truth nitrogen percentage. The plot shows that the straight line comfortably fits the data, showing a strong positive correlation between the estimated and the ground truth values. The figure also shows the variation in the selected dataset as the nitrogen estimates vary from approximately 0.17% to 0.80%.
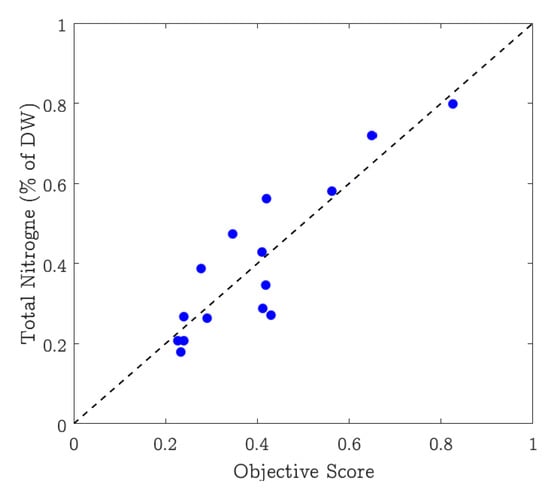
Figure 6.
Scatter plot between the nitrogen estimate by the proposed method and the corresponding ground truth values.
To further investigate the performance of the proposed method, its results are compared with different RGB color-space-based n-nutrient estimation metrics. These metrics have been proposed in different studies, e.g., [24,25,26,27,28,29,30,31,51]. These algorithms compute different ratios of red (R), green (G), and blue (B) components of the leaf color. For ease of reference, these are labeled as M1, M2, ⋯, and M17 in this study and are briefly described in Table 2.
Table 2.
List of leaf color-analysis-based nitrogen estimation metrics used in performance comparison.
The research presented in [23] evaluated different RGB color-space-based methods and reported that metric M11 performs the best. The metric M5 was proposed as optimal in [24,48]. In [51], the metrics M16 and M17 achieved good correlation with the nitrogen value in grape leaves. Moreover, the study in [68] proposed that the red color (R) is the most accurate predictor of nitrogen. In the proposed system, all these methods were calculated, and the correlation with nitrogen value showed the best results with the proposed system. All the compared methods, M1 to M17, were executed on the whole dataset, and the performance parameters were computed. The results are presented in Table 3. These results show that the proposed method outperforms all the competing methods, achieving 0.9198 R, 0.9590 PLCC, 0.7643 SROCC, and 0.6190 KROCC, with the minimum root mean square error of 0.08.
Table 3.
Performance of the proposed and the compared methods on the whole test dataset. The best results are marked in bold and the second-best in italic.
We also compare the performance of the proposed method with numerous existing vision-based plant-N nutrition estimation methods. These methods include [23,69,70,71,72,73,74,75,76], and their performance comparison is presented in Table 4. In [69], Liu et al. investigated the use of SPAD-502 (Minolta, Japan) for nitrogen estimation in spinach plants. Their results showed that the accuracy of using SPAD-502 for N-nutrient estimation in spinach is 0.89. The study presented by Muchecheti et al. [70] also explored the efficacy of SPAD-502 for N-nutrient estimation in spinach plants. They achieved R values of 0.84, 0.89, and 0.91 for different datasets, and on the whole dataset, the coefficient of determination was . A vision-based method was developed in [71] for assessing the n-nutrition status of barley plants. Their method applies the principal component analysis (PCA) to digital images and computed a greenness index using RGB components of the color image. They evaluated the greenness index with the SPAD-502 readings and found a correlation between 0.60 to 0.95 for different sample sets. Agarwal et al. [72] computed different features of plant leaf images and evaluated their correlation with the SPAD readings. Their dark-green color index (DGCI) achieved a high correlation of 0.80 with the SPAD reported readings.
Table 4.
Performance comparison of the proposed method with existing vision-based approaches for n-content estimation in plants.
The study presented in [73] by Tafolla et al. used SPAD-502 and atLeaf meters to calculate the nitrogen content in romaine lettuce. The SPAD achieved a 0.90 correlation with the laboratory results, and atLeaf showed a correlation of 0.91 with laboratory results. Kawashima et al. [23] proposed an image-processing-based algorithm to assess the chlorophyll content in leaves using a video camera. Their method proposed a function of red and blue components of the leaf image as an N-nutrient indicator and showed a 0.81 correlation with the SPAD-502 readings. In [74], Noh et al. studied the correlation between reflectance from individual channels of the images captured with a multi-spectral sensor and the SPAD readings. They found that the ratio of near-infrared (NIR) band and green component (G) showed a stronger correlation, 0.86, with the SPAD readings. The vision-based method presented by Borhan et al. in [75] computes different image features to estimate the chlorophyll content in potato leaves. Their method showed a 0.88 correlation with the SPAD-502 readings. In [76], Graeff et al. proposed an image-processing-based method for nitrogen level estimation in broccoli plants. They converted the image into color space and proposed using the component as an n-nutrient estimate. Their method showed a correlation of 0.82 with the laboratory results. The results of the proposed and the compared methods presented in Table 4 show that the proposed vision-based method for N-nutrient estimation is reliable and achieves appreciable accuracy.
The leaf color-based assessment of nitrogen status in plants is very accurate and reliable. Numerous handheld devices and meters have been introduced in recent times to assess the nitrogen content in the plant by analyzing the leaf color. Some popular and widely used devices include SPAD-502, CCM-200, Dualex-4, atLeaf, and GreenSeeker. We compare the performance of the proposed method with these devices, the results are presented in Table 5. Although this comparison would not be equitable or well-earned, as the datasets used in these evaluations are different, it can provide a glance at the effectiveness of the proposed method. The study presented in [77] evaluated the performance SPAD-502, CCM-200, and Dualex-4 for measurement of leaf chlorophyll concentration in four different crops. They achieved 0.90, 0.81, and 0.69 coefficient of determination for corn crop, respectively. GreenSeeker and atLeaf are also popular devices to estimate the nitrogen in leaves. The studies in [73,78] evaluated the GreenSeeker and atLeaf devices, respectively. The GreenSeeker achieved a correlation of 0.73 and atLeaf showed a strong correlation of 0.91 with the laboratory results.
Table 5.
Performance comparison of handheld chlorophyll meters and the proposed vision-based method.
We observed that the superior performance of the proposed method over the existing similar techniques is due to many factors. First, in the proposed system, we use reference to green and yellow colors for healthy and nitrogen-deficient leaves, respectively, in a specially designed slate where the crop leaf image is placed for image acquisition. This helps in canceling the illumination changes that may occur due to different reasons such as the time the image is being captured, the weather conditions, the quality of the camera, etc. That means if there is any change in the leaf color due to lighting effects, the reference colors are equally affected in the image, thus canceling the effect. Second, the novel color distance formula used in the proposed method is able to accurately capture the color differences between the leaf and the reference colors. In particular, a large number of available color distance models are evaluated, and the results favored the CIEDE2000 model for the proposed algorithm. Third, the proposed reference color circle detection and the GMM-based leaf extraction produce accurate segmentation, which is momentous for true color analysis. All these factors enhance the system’s performance and make it a reliable tool for estimating the n-nutrient in plants.
6. Conclusions and Future Research Directions
This paper presents a vision-based fully automated system to estimate nitrogen content in crops and plants. The system can be used by a common person as no specific camera or controlled environment is required to capture the images. Leaf images can be captured using any type of camera, including smartphone cameras. The system takes a leaf image and uses the leaf color to calculate its nitrogen content. The proposed algorithm uses different feature detection and background removal techniques to accurately segment the leaf and the reference colors from the image. Moreover, numerous color distance models were evaluated to find the best model for the problem under investigation. The experimental evaluations were performed on the spinach crop leaves dataset, which comprises images captured with a normal smartphone camera. The performance was measured using different parameters, revealing that the proposed algorithm is highly correlated (0.9198 R and 95.9% PLCC) with the nitrogen amount calculated by Kjeldahl method in the laboratory, which proves its effectiveness. A software release of the proposed vision-based framework for N-nutrient estimation in crops is made publicly available on the project website: http://faculty.pucit.edu.pk/~farid/Research/GCV.html, accessed on 8 June 2021.
In the future, we plan to investigate the performance of the proposed system for other crops and plants. Studying the impact of color models for different crops is another interesting future research direction. In the dataset used in the performance evaluation of the proposed method, images were of different resolutions and the proposed leaf detection, and reference color circle extraction worked accurately. However, building a dataset consisting of leaf images captured with different cameras and under different illumination conditions with the varying resolution is important to truly assess the performance of the N-nutrient estimation algorithms.
Author Contributions
Conceptualization, T.H., M.S.F. and R.M.; methodology, T.H., M.S.F., M.H.K., A.I. and R.M.; software, T.H., M.S.F. and A.I.; validation, T.H., M.S.F. and M.H.C.; formal analysis, T.H., M.S.F., R.M., S.T.-A.H. and M.G.; investigation, T.H., M.S.F., S.T.-A.H. and M.G.; data curation, T.H., A.I., S.T.-A.H., R.M. and M.G.; writing—original draft preparation, T.H., M.S.F., R.M. and M.H.K.; supervision, M.H.K., M.S.F., M.H.C. and R.M. All authors have read and agreed to the published version of the manuscript.
Funding
This research was partially supported by the Higher Education Commission, Pakistan, under project ‘3DViCoQa’ grant number NRPU-7389.
Institutional Review Board Statement
Not applicable.
Informed Consent Statement
Not applicable.
Conflicts of Interest
The authors declare no conflict of interest.
References
- Buchaillot, M.; Gracia-Romero, A.; Vergara-Diaz, O.; Zaman-Allah, M.A.; Tarekegne, A.; Cairns, J.E.; Prasanna, B.M.; Araus, J.L.; Kefauver, S.C. Evaluating Maize Genotype Performance under Low Nitrogen Conditions Using RGB UAV Phenotyping Techniques. Sensors 2019, 19, 1815. [Google Scholar] [CrossRef] [Green Version]
- Hamid, F.; Ahmad, T.; Waheed, A.; Ahmad, N.; Aslam, S. Effect of different levels of nitrogen on the chemical composition of tea (C. Sinensis L.) grown at higher altitude. J. Mater. Environ. Sci. 2014, 5, 72–80. [Google Scholar]
- Leghari, S.J.; Wahocho, N.A.; Laghari, G.M.; HafeezLaghari, A.; MustafaBhabhan, G.; HussainTalpur, K.; Bhutto, T.A.; Wahocho, S.A.; Lashari, A.A. Role of nitrogen for plant growth and development: A review. Adv. Environ. Biol. 2016, 10, 209–219. [Google Scholar]
- Tewari, V.; Arudra, A.K.; Kumar, S.P.; Pandey, V.; Chandel, N.S. Estimation of plant nitrogen content using digital image processing. Agric. Eng. Int. CIGR J. 2013, 15, 78–86. [Google Scholar]
- Shi, P.; Wang, Y.; Xu, J.; Zhao, Y.; Yang, B.; Yuan, Z.; Sun, Q. Rice nitrogen nutrition estimation with RGB images and machine learning methods. Comput. Electron. Agric. 2021, 180, 105860. [Google Scholar] [CrossRef]
- Tavakoli, H.; Gebbers, R. Assessing Nitrogen and water status of winter wheat using a digital camera. Comput. Electron. Agric. 2019, 157, 558–567. [Google Scholar] [CrossRef]
- Nebiker, S.; Annen, A.; Scherrer, M.; Oesch, D. A light-weight multispectral sensor for micro UAV—Opportunities for very high resolution airborne remote sensing. Int. Arch. Photogramm. Remote Sens. Spat. Inf. Sci. 2008, 37, 1193–1199. [Google Scholar]
- Fageria, N.; Baligar, V. Enhancing nitrogen use efficiency in crop plants. Adv. Agron. 2005, 88, 97–185. [Google Scholar]
- Zulkifli, Z.; Khairunniza-Bejo, S. Paddy growth monitoring using terrestrial laser scanner. Aust. J. Basic Appl. Sci. 2015, 9, 90–96. [Google Scholar]
- López-Calderón, M.J.; Estrada-Ávalos, J.; Rodríguez-Moreno, V.M.; Mauricio-Ruvalcaba, J.E.; Martínez-Sifuentes, A.R.; Delgado-Ramírez, G.; Miguel-Valle, E. Estimation of Total Nitrogen Content in Forage Maize (Zea mays L.) Using Spectral Indices: Analysis by Random Forest. Agriculture 2020, 10, 451. [Google Scholar] [CrossRef]
- Coste, S.; Baraloto, C.; Leroy, C.; Marcon, É.; Renaud, A.; Richardson, A.D.; Roggy, J.C.; Schimann, H.; Uddling, J.; Hérault, B. Assessing foliar chlorophyll contents with the SPAD-502 chlorophyll meter: A calibration test with thirteen tree species of tropical rainforest in French Guiana. Ann. For. Sci. 2010, 67, 607. [Google Scholar] [CrossRef] [Green Version]
- Wu, B.; Huang, W.; Ye, H.; Luo, P.; Ren, Y.; Kong, W. Using Multi-Angular Hyperspectral Data to Estimate the Vertical Distribution of Leaf Chlorophyll Content in Wheat. Remote Sens. 2021, 13, 1501. [Google Scholar] [CrossRef]
- Colorado, J.D.; Cera-Bornacelli, N.; Caldas, J.S.; Petro, E.; Rebolledo, M.C.; Cuellar, D.; Calderon, F.; Mondragon, I.F.; Jaramillo-Botero, A. Estimation of Nitrogen in Rice Crops from UAV-Captured Images. Remote Sens. 2020, 12, 3396. [Google Scholar] [CrossRef]
- Campoe, O.C.; Iannelli, C.; Stape, J.L.; Cook, R.L.; Mendes, J.C.T.; Vivian, R. Atlantic forest tree species responses to silvicultural practices in a degraded pasture restoration plantation: From leaf physiology to survival and initial growth. For. Ecol. Manag. 2014, 313, 233–242. [Google Scholar] [CrossRef]
- Aranguren, M.; Castellón, A.; Aizpurua, A. Crop Sensor Based Non-destructive Estimation of Nitrogen Nutritional Status, Yield, and Grain Protein Content in Wheat. Agriculture 2020, 10, 148. [Google Scholar] [CrossRef]
- El-Shikha, D.M.; Barnes, E.M.; Clarke, T.R.; Hunsaker, D.J.; Haberland, J.A.; Pinter, P., Jr.; Waller, P.M.; Thompson, T.L. Remote sensing of cotton nitrogen status using the Canopy Chlorophyll Content Index (CCCI). Trans. ASABE 2008, 51, 73–82. [Google Scholar] [CrossRef]
- Yang, J.; Song, S.; Du, L.; Shi, S.; Gong, W.; Sun, J.; Chen, B. Analyzing the Effect of Fluorescence Characteristics on Leaf Nitrogen Concentration Estimation. Remote Sens. 2018, 10, 1402. [Google Scholar] [CrossRef] [Green Version]
- Uchida, R. Essential nutrients for plant growth: Nutrient functions and deficiency symptoms. Plant Nutr. Manag. Hawaii’s Soils 2000, 4, 31–55. [Google Scholar]
- Wankhede, A.; Waghmare, S.; Joshi, B. Embedded System Development for Estimation of Nitrogen Content of Plants for Healthy Crops. IJETT 2015, 2, 237–240. [Google Scholar]
- Fu, Y.; Yang, G.; Pu, R.; Li, Z.; Li, H.; Xu, X.; Song, X.; Yang, X.; Zhao, C. An overview of crop nitrogen status assessment using hyperspectral remote sensing: Current status and perspectives. Eur. J. Agron. 2021, 124, 126241. [Google Scholar] [CrossRef]
- Sunagar, V.B.; Kattimani, P.A.; Padasali, V.A.; Hiremath, N.V. Estimation of Nitrogen Content in Leaves Uisng Image Processing. In Proceedings of the International Conference on Advances in Engineering & Technology, Goa, India, 20 April 2014. [Google Scholar]
- Zheng, H.; Li, W.; Jiang, J.; Liu, Y.; Cheng, T.; Tian, Y.; Zhu, Y.; Cao, W.; Zhang, Y.; Yao, X. A Comparative Assessment of Different Modeling Algorithms for Estimating Leaf Nitrogen Content in Winter Wheat Using Multispectral Images from an Unmanned Aerial Vehicle. Remote Sens. 2018, 10, 2026. [Google Scholar] [CrossRef] [Green Version]
- Kawashima, S.; Nakatani, M. An Algorithm for Estimating Chlorophyll Content in Leaves Using a Video Camera. Ann. Bot. 1998, 81, 49–54. [Google Scholar] [CrossRef] [Green Version]
- Yuzhu, H.; Xiaomei, W.; Shuyao, S. Nitrogen determination in pepper (Capsicum frutescens L.) plants by color image analysis (RGB). Afr. J. Biotechnol. 2011, 10, 17737–17741. [Google Scholar]
- Li, Y.; Chen, D.; Walker, C.; Angus, J. Estimating the nitrogen status of crops using a digital camera. Field Crop. Res. 2010, 118, 221–227. [Google Scholar] [CrossRef]
- Vibhute, A.; Bodhe, S. Color image processing approach for nitrogen estimation of vineyard. Int. J. Agric. Sci. Res. 2013, 3, 189–196. [Google Scholar]
- Dey, A.K.; Sharma, M.; Meshram, M. An analysis of leaf chlorophyll measurement method using chlorophyll meter and image processing technique. Procedia Comput. Sci. 2016, 85, 286–292. [Google Scholar] [CrossRef] [Green Version]
- Wang, Y.; Wang, D.; Shi, P.; Omasa, K. Estimating rice chlorophyll content and leaf nitrogen concentration with a digital still color camera under natural light. Plant Methods 2014, 10, 36. [Google Scholar] [CrossRef] [Green Version]
- Rigon, J.; Capuani, S.; Fernandes, D.; Guimarães, T. A novel method for the estimation of soybean chlorophyll content using a smartphone and image analysis. Photosynthetica 2016, 54, 559–566. [Google Scholar] [CrossRef] [Green Version]
- Ali, M.M.; Al-Ani, A.; Eamus, D.; Tan, D.K. A new image processing based technique to determine chlorophyll in plants. Am.-Eurasian J. Agric. Environ. Sci. 2012, 12, 1323–1328. [Google Scholar]
- Riccardi, M.; Mele, G.; Pulvento, C.; Lavini, A.; d’Andria, R.; Jacobsen, S.E. Non-destructive evaluation of chlorophyll content in quinoa and amaranth leaves by simple and multiple regression analysis of RGB image components. Photosynth. Res. 2014, 120, 263–272. [Google Scholar] [CrossRef]
- Muñoz-Huerta, R.; Guevara-Gonzalez, R.; Contreras-Medina, L.; Torres-Pacheco, I.; Prado-Olivarez, J.; Ocampo-Velazquez, R. A review of methods for sensing the nitrogen status in plants: Advantages, disadvantages and recent advances. Sensors 2013, 13, 10823–10843. [Google Scholar] [CrossRef] [PubMed]
- Kjeldahl, J. Neue methode zur bestimmung des stickstoffs in organischen körpern. Fresenius’ J. Anal. Chem. 1883, 22, 366–382. [Google Scholar] [CrossRef] [Green Version]
- Michałowski, T.; Asuero, A.G.; Wybraniec, S. The titration in the Kjeldahl method of nitrogen determination: Base or acid as titrant? J. Chem. Educ. 2012, 90, 191–197. [Google Scholar] [CrossRef]
- Jaroenseng, S.; Wongmaneeroj, A.; Amkhab, S. Results of studies the possible correlations between SPAD value and total nitrogen contents in the leaves of sugarcane (Saccharum officinarum L.). J. Int. Soc. S. Asian Agric. Sci. 2010, 16, 136. [Google Scholar]
- Demotes-Mainard, S.; Boumaza, R.; Meyer, S.; Cerovic, Z.G. Indicators of nitrogen status for ornamental woody plants based on optical measurements of leaf epidermal polyphenol and chlorophyll contents. Sci. Hortic. 2008, 115, 377–385. [Google Scholar] [CrossRef]
- Sen, A.; Srivastava, V.K.; Singh, M.K.; Singh, R.K.; Kumar, S. Leaf colour chart vis-a-vis nitrogen management in different rice genotypes. Am. J. Plant Sci. 2011, 2, 223. [Google Scholar] [CrossRef] [Green Version]
- Gao, B.C. NDWI—A normalized difference water index for remote sensing of vegetation liquid water from space. Remote Sens. Environ. 1996, 58, 257–266. [Google Scholar] [CrossRef]
- Rorie, R.L.; Purcell, L.C.; Mozaffari, M.; Karcher, D.E.; King, C.A.; Marsh, M.C.; Longer, D.E. Association of “greenness” in corn with yield and leaf nitrogen concentration. Agron. J. 2011, 103, 529–535. [Google Scholar] [CrossRef] [Green Version]
- Sims, D.A.; Gamon, J.A. Relationships between leaf pigment content and spectral reflectance across a wide range of species, leaf structures and developmental stages. Remote Sens. Environ. 2002, 81, 337–354. [Google Scholar] [CrossRef]
- Zhao, B.; Zhang, Y.; Duan, A.; Liu, Z.; Xiao, J.; Liu, Z.; Qin, A.; Ning, D.; Li, S.; Ata-Ul-Karim, S.T. Estimating the Growth Indices and Nitrogen Status Based on Color Digital Image Analysis During Early Growth Period of Winter Wheat. Front. Plant Sci. 2021, 12, 502. [Google Scholar] [CrossRef] [PubMed]
- Adhikari, R.; Li, C.; Kalbaugh, K.; Nemali, K. A low-cost smartphone controlled sensor based on image analysis for estimating whole-plant tissue nitrogen (N) content in floriculture crops. Comput. Electron. Agric. 2020, 169, 105173. [Google Scholar] [CrossRef]
- Gu, D.D.; Wang, W.Z.; Hu, J.D.; Zhang, X.M.; Wang, J.B.; Wang, B.S. Nondestructive Determination of Total Chlorophyll Content in Maize Using Three-Wavelength Diffuse Reflectance. J. Appl. Spectrosc. 2016, 83, 541–547. [Google Scholar] [CrossRef]
- Wahono, W.; Indradewa, D.; Sunarminto, B.H.; Haryono, E.; Prajitno, D. CIE L* a* b* Color Space Based Vegetation Indices Derived from Unmanned Aerial Vehicle Captured Images for Chlorophyll and Nitrogen Content Estimation of Tea (Camellia sinensis L. Kuntze) Leaves. Ilmu Pertan. 2019, 4, 46–51. [Google Scholar] [CrossRef]
- Hunt, E.R., Jr.; Doraiswamy, P.C.; McMurtrey, J.E.; Daughtry, C.S.; Perry, E.M.; Akhmedov, B. A visible band index for remote sensing leaf chlorophyll content at the canopy scale. Int. J. Appl. Earth Obs. Geoinf. 2013, 21, 103–112. [Google Scholar] [CrossRef] [Green Version]
- Janwale, A.P.; Lomte, S.S. Automatic estimation of nitrogen content in cotton (Gossypium hirsutum L.) plant by using image processing techniques: A review. Int. J. Comput. Appl. 2015, 975, 8887. [Google Scholar]
- Sayeed, M.A.; Shashikala, G.; Pandey, S.; Jain, R.; Kumar, S.N. Estimation of Nitrogen in Rice Plant Using Image Processing and Artificial Neural Networks. Imp. J. Interdiscip. Res. 2016, 2, 1074–1079. [Google Scholar]
- Jia, B.; He, H.; Ma, F.; Diao, M.; Jiang, G.; Zheng, Z.; Cui, J.; Fan, H. Use of a digital camera to monitor the growth and nitrogen status of cotton. Sci. World J. 2014, 2014. [Google Scholar] [CrossRef] [PubMed]
- Fernandez-Jaramillo, A.A.; de Jesus Romero-Troncoso, R.; Duarte-Galvan, C.; Torres-Pacheco, I.; Guevara-Gonzalez, R.G.; Contreras-Medina, L.M.; Herrera-Ruiz, G.; Millan-Almaraz, J.R. FPGA-based chlorophyll fluorescence measurement system with arbitrary light stimulation waveform using direct digital synthesis. Measurement 2015, 75, 12–22. [Google Scholar] [CrossRef]
- Pérez-Patricio, M.; Camas-Anzueto, J.; Sanchez-Alegría, A.; Aguilar-González, A.; Gutiérrez-Miceli, F.; Escobar-Gómez, E.; Voisin, Y.; Rios-Rojas, C.; Grajales-Coutiño, R. Optical method for estimating the Chlorophyll Contents in Plant Leaves. Sensors 2018, 18, 650. [Google Scholar] [CrossRef] [Green Version]
- do Amaral, E.S.; Silva, D.V.; Dos Anjos, L.; Schilling, A.C.; Dalmolin, Â.C.; Mielke, M.S. Relationships between reflectance and absorbance chlorophyll indices with RGB (Red, Green, Blue) image components in seedlings of tropical tree species at nursery stage. New For. 2019, 50, 377–388. [Google Scholar] [CrossRef]
- Putra, B.T.W.; Soni, P. Enhanced broadband greenness in assessing Chlorophyll a and b, Carotenoid, and Nitrogen in Robusta coffee plantations using a digital camera. Precis. Agric. 2018, 19, 238–256. [Google Scholar] [CrossRef]
- Gong, A.; Yu, J.; He, Y.; Qiu, Z. Citrus yield estimation based on images processed by an Android mobile phone. Biosyst. Eng. 2013, 115, 162–170. [Google Scholar] [CrossRef]
- Murakami, P.F.; Turner, M.R.; van den Berg, A.K.; Schaberg, P.G. An Instructional Guide for Leaf Color Analysis Using Digital Imaging Software; Gen. Tech. Rep. NE-327; US Department of Agriculture, Forest Service, Northeastern Research Station: Newtown Square, PA, USA, 2005; Volume 327, 33p. [Google Scholar]
- Ye, X.; Abe, S.; Zhang, S. Estimation and mapping of nitrogen content in apple trees at leaf and canopy levels using hyperspectral imaging. Precis. Agric. 2019, 21, 198–225. [Google Scholar] [CrossRef]
- Nurhadiyatna, A.; Jatmiko, W.; Hardjono, B.; Wibisono, A.; Sina, I.; Mursanto, P. Background subtraction using gaussian mixture model enhanced by hole filling algorithm (GMMHF). In Proceedings of the 2013 IEEE International Conference on Systems, Man, and Cybernetics, Manchester, UK, 13–16 October 2013; pp. 4006–4011. [Google Scholar]
- Farid, M.S.; Lucenteforte, M.; Grangetto, M. DOST: A distributed object segmentation tool. Multimed. Tools Appl. 2017, 77, 20839–20862. [Google Scholar] [CrossRef] [Green Version]
- Kuehni, R.G. Industrial color difference: Progress and problems. Color Res. Appl. 1990, 15, 261–265. [Google Scholar] [CrossRef]
- International Commission on Illumination (CIE). Industrial Colour-Difference Evaluation; CIE Technical Reports; CIE Central Bureau: Vienna, Austria, 1995. [Google Scholar]
- Smith, T.; Guild, J. The C.I.E. colorimetric standards and their use. Trans. Opt. Soc. 1931, 33, 73–134. [Google Scholar] [CrossRef]
- Sharma, G.; Bala, R. Digital Color Imaging Handbook; CRC Press: Boca Raton, FL, USA, 2017. [Google Scholar]
- McDonald, R.; Smith, K. CIE94-a new colour-difference formula. J. Soc. Dye Colour. 1995, 111, 376–379. [Google Scholar] [CrossRef]
- Melgosa, M. CIE94, History, Use, and Performance. Encycl. Color Sci. Technol. 2014. [Google Scholar] [CrossRef]
- Luo, M.R.; Cui, G.; Rigg, B. The development of the CIE 2000 colour-difference formula: CIEDE2000. Color Res. Appl. 2001, 26, 340–350. [Google Scholar] [CrossRef]
- Cheung, V. Uniform Color Spaces. In Handbook of Visual Display Technology; Springer: Berlin/Heidelberg, Germany, 2012; pp. 161–169. [Google Scholar] [CrossRef]
- Baldevbhai, P.J.; Anand, R. Color image segmentation for medical images using L* a* b* color space. IOSR J. Electron. Commun. Eng. 2012, 1, 24–45. [Google Scholar] [CrossRef]
- Sheikh, H.; Sabir, M.; Bovik, A. A Statistical Evaluation of Recent Full Reference Image Quality Assessment Algorithms. IEEE Trans. Image Process. 2006, 15, 3440–3451. [Google Scholar] [CrossRef]
- Mercado-Luna, A.; Rico-García, E.; Lara-Herrera, A.; Soto-Zarazúa, G.; Ocampo-Velázquez, R.; Guevara-González, R.; Herrera-Ruiz, G.; Torres-Pacheco, I. Nitrogen determination on tomato (Lycopersicon esculentum Mill.) seedlings by color image analysis (RGB). Afr. J. Biotechnol. 2010, 9, 5326–5332. [Google Scholar]
- Liu, Y.J.; Tong, Y.P.; Zhu, Y.G.; Ding, H.; Smith, F.A. Leaf Chlorophyll Readings as an Indicator for Spinach Yield and Nutritional Quality with Different Nitrogen Fertilizer Applications. J. Plant Nutr. 2006, 29, 1207–1217. [Google Scholar] [CrossRef]
- Muchecheti, F.; Madakadze, C.; Soundy, P. Leaf chlorophyll readings as an indicator of nitrogen status and yield of spinach (Spinacia oleracea L.) grown in soils amended with Luecaena leucocephala prunings. J. Plant Nutr. 2016, 39, 539–561. [Google Scholar] [CrossRef]
- Pagola, M.; Ortiz, R.; Irigoyen, I.; Bustince, H.; Barrenechea, E.; Aparicio-Tejo, P.; Lamsfus, C.; Lasa, B. New method to assess barley nitrogen nutrition status based on image colour analysis: Comparison with SPAD-502. Comput. Electron. Agric. 2009, 65, 213–218. [Google Scholar] [CrossRef]
- Agarwal, A.; Dutta Gupta, S. Assessment of spinach seedling health status and chlorophyll content by multivariate data analysis and multiple linear regression of leaf image features. Comput. Electron. Agric. 2018, 152, 281–289. [Google Scholar] [CrossRef]
- Mendoza-Tafolla, R.O.; Juarez-Lopez, P.; Ontiveros-Capurata, R.E.; Sandoval-Villa, M.; Iran, A.T.; Alejo-Santiago, G. Estimating Nitrogen and Chlorophyll Status of Romaine Lettuce Using SPAD and at LEAF Readings. Not. Bot. Horti Agrobot. Cluj Napoca 2019, 47. [Google Scholar] [CrossRef] [Green Version]
- Noh, H.; Zhang, Q. Shadow effect on multi-spectral image for detection of nitrogen deficiency in corn. Comput. Electron. Agric. 2012, 83, 52–57. [Google Scholar] [CrossRef]
- Borhan, M.; Panigrahi, S.; Satter, M.; Gu, H. Evaluation of computer imaging technique for predicting the SPAD readings in potato leaves. Inf. Process. Agric. 2017, 4, 275–282. [Google Scholar] [CrossRef]
- Graeff, S.; Pfenning, J.; Claupein, W.; Liebig, H.P. Evaluation of Image Analysis to Determine the N-Fertilizer Demand of Broccoli Plants (Brassica oleracea convar. botrytis var. italica). Adv. Opt. Technol. 2008, 2008, 1–8. [Google Scholar] [CrossRef] [Green Version]
- Dong, T.; Shang, J.; Chen, J.M.; Liu, J.; Qian, B.; Ma, B.; Morrison, M.J.; Zhang, C.; Liu, Y.; Shi, Y.; et al. Assessment of Portable Chlorophyll Meters for Measuring Crop Leaf Chlorophyll Concentration. Remote Sens. 2019, 11, 2706. [Google Scholar] [CrossRef] [Green Version]
- Xia, T.; Miao, Y.; Mi, G.; Khosla, R.; Wu, D.; Shao, H.; Xu, X. In-season estimation of spring maize nitrogen status with GreenSeeker active canopy sensor. In Proceedings of the 2015 Fourth International Conference on Agro-Geoinformatics (Agro-Geoinformatics), Istanbul, Turkey, 20–24 July 2015; pp. 390–395. [Google Scholar] [CrossRef]
Publisher’s Note: MDPI stays neutral with regard to jurisdictional claims in published maps and institutional affiliations. |
© 2021 by the authors. Licensee MDPI, Basel, Switzerland. This article is an open access article distributed under the terms and conditions of the Creative Commons Attribution (CC BY) license (https://creativecommons.org/licenses/by/4.0/).