Abstract
The quality of grain products from organic agriculture is an important subject of research for food safety and consumer health. The aim of the study was to examine the grain of spring wheat from organic agriculture according to their infestation by Fusarium spp., mycotoxin content, and technological value for milling and baking processing. The material was grain of 13 spring wheat varieties cultivated in organic systems in 3 years. The results showed that the intensity of Fusarium head blight (FHB) was low and ranged from 0.0% to 5.5% of ears. Grain infestation by Fusarium spp. varied between varieties and years from 1.5% to 18.5%. The colonization of grains by Fusarium spp. did not reflect the intensity of FHB. The lowest grain infestation by Fusarium spp. was noted for the varieties: Waluta, Zadra, and Arabella. Mycotoxin contamination of the grain of tested varieties did not exceed accepted standards. The requirements of the milling and baking industries were generally met by grain and flour of all the tested varieties. On the basis of the 3 year study results related to food safety and processing properties, the varieties most useful for organic production are Arabella, followed by Brawura, Izera, Kandela, Katoda, KWS Torridon, Waluta, and Zadra.
1. Introduction
Spring wheat is a popular crop in both conventional and organic farms, as it is an important consumer cereal in Europe [1,2]. However, in organic agriculture, the choice of proper variety is of great importance because it influences the yield [3,4,5,6,7] and quality of grain [8,9]. Spring wheat varieties vary according to their agricultural traits (morphological features, yielding potential, resistance to disease and pests, weed suppression ability) and technological parameters [5,6,10,11,12,13]. The information about the suitability of different varieties for organic farming and food processing according to their susceptibility to Fusarium sp. disease and mycotoxin contamination, and the technological value of grain and flour, is desired by producers, advisors, and processors. The common wheat pathogens in organic farming are fungi of the genus Fusarium. Some of them, such as Fusarium rot pre- and post-emergence, Fusarium foot rot, and Fusarium leaf blight can lead to a significant drop in yields, while Fusarium head blight (FHB) and grain infestation by Fusarium spp. (Fusarium disease kernels—FDK) may contribute to a decrease in yields [14]. The infested ears either do not form grains at all or form fewer grains that are smaller and poorly filled that contain less starch and gluten proteins and, therefore, the flour obtained from them has a low baking value [15]. In addition, certain species of fungi of the genus Fusarium have the ability to synthesize mycotoxins that accumulate in grains, and these mycotoxins are also present in products derived from them, which can be dangerous to human health [16,17,18]. The significant contaminants in all cereal grains, including wheat, are deoxynivalenol (DON), zearalenone (ZEA), and fumonisins B1 and B2. Zearalenone is one of the strongest non-steroidal estrogenic substances, which can cause functional changes in the reproductive system similar to those of estrogens [19]. Deoxynivalenol and nivalenol are important toxins from the group of trichothecenes. Deoxynivalenol, similar to other trichothecenes, has a significant effect on biochemical processes. The most frequently observed DON toxicosis symptoms in animals include vomiting and body weight loss with successive numerous physiological changes in internal tissues [20]. Fumonisins, especially fumonisin B1, has caused field outbreaks of leucoencephalomacia in horses, porcine pulmonary oedema in swine, and were found to be hepatotoxic and hepatocancerogenic to rats [21]. Beauvericin and enniatins (EnnA, EnnA1, EnnB, EnnB1) are well-known toxic cyclic hexadepsipeptides with a specific cholesterol acyltransferase inhibitor activity [22]. Beauvericin and enniatins are early emerging mycotoxins, and they are being identified, with an increasing frequency, in cereal grains worldwide. Moniliformin is a potent inhibitor of mitochondrial pyruvate and ketoglutarate oxidation and has caused acute degenerative lesions in the myocardium [23]. EU countries have established and published guidelines for maximum levels of deoxynivalenol (DON), zearalenone (ZEA), and the sum of fumonisins B1 and B2 [24].
The technological value of wheat grains is determined not only by genetic factors but also by habitat conditions and the crop management treatments applied, which are limited in the organic production system [8,16]. Agrotechnical treatments have a significant impact on the quantity as well as the fractional composition of protein, which is commonly considered as one of the basic indicators of the suitability of wheat grains for processing [8,16,25]. The response of individual wheat varieties to the applied cultivation conditions is not the same. It is important to select wheat varieties with the lowest possible variability of grain quality traits for organic farming. In Poland, as in other EU countries, no separate quality requirements have been defined for wheat grain from organic farming, so it has to meet the general quality requirements for wheat grain [26], and the direction of its use should be selected taking into account the requirements of the processing industry [27].
The aim of the study was to examine 13 spring wheat varieties (Triticum aestivum L.) cultivated in organic farming due to their susceptibility to Fusarium spp. diseases and technological parameters of grain, flour, and bread. Moreover, mycotoxin content in the grain of two selected spring wheat varieties was analyzed.
The hypothesis was that it is possible to obtain wheat grains in organic farming that met processing criteria.
2. Materials and Methods
2.1. Sites Characteristics, Experimental Design and Agronomic Practices
The experiment with the varieties of spring wheat was carried out in the years 2014–2016 in the organic farm of the Institute of Soil Science and Plant Cultivation—State Research Institute (IUNG-PIB), located in Osiny, central-eastern part of Poland (Table 1).

Table 1.
The characteristics of habitat conditions of the experiment.
Spring wheat varieties were cultivated in a randomized complete block design, with four replications. The area of each plot of replication for sowing and harvesting was 30 m2. Thirteen spring wheat varieties (Triticum aestivum L.) included in the Common Catalogue of Varieties of Agricultural Plant Species [29]—Arabella, Brawura, Cytra, Ethos, Izera, KWS Torridon, Kandela, Katoda, Koksa, Korynta, Ostka Smolicka, Waluta, and Zadra—were cultivated in organic system. Sowing treatments were performed in accordance with good agricultural practice at the optimum time for each region. The sowing rates were the same for each variety—450 grains m−2. The row spacing was 12 cm and the planting depth 3.5 cm. According to organic agriculture rules, mineral fertilizers and chemical plant protection products were not used [30]. Harvests were undertaken in the first week of August.
The experimental site belongs to a moderately continental climate zone. The characteristics of the meteorological condition in the location of the experiment in the 3 years of the study are presented in Table 2. In 2014 and 2015, high precipitation occurred in May (more than twice the multi-annual average). The 2016 growing season was warm and dry. The temperatures from March to August exceeded the multi-annual average, and the amount of precipitation was below the average (except in August).
Table 2.
Total precipitation and average monthly temperatures in the experiment.
2.2. Fusarium sp. Occurrence
An assessment of Fusarium head blight was performed at the milk-dough stage of spring wheat (BBCH 77-83). From each experimental combination, 4 × 50 randomly selected ears were analyzed, and the percentage of their infestation was determined.
After the harvest, a mycological analysis of the grain was performed. From each combination, 4 × 100 grains were taken at random. After rinsing under running water, decontaminating for 2.5 min in 1% NaCl, and rinsing three times in sterile water, the grains were placed into PDA (Potato Dextrose Agar) (pH = 5.5) and incubated at 20 °C for 6 days. The growing colonies of fungi were grafted onto slants of PDA and identified according to mycological keys [31,32].
2.3. Analysis of Mycotoxins
In the first year of research (2014), five toxins synthesized by Fusarium species were analyzed—zearalenone (ZEA), deoxynivalenol (DON), nivalenol (NIV), beauvericin (BEA), and moniliformin (MON)—whereas, in the second and third year (2015–2016), twelve mycotoxins—zearalenone (ZEA), deoxynivalenol (DON), nivalenol (NIV), beauvericin (BEA), moniliformin (MON), enniatins (EnnA, EnnA1, EnnB, EnnB1) and fumonisins (FB1, FB2, FB3)—were measured in the wheat grains of two selected varieties—Kandela and Ostka Smolicka. These varieties were chosen because they showed greater infection of the grain by Fusarium spp. in the first year of research; the same varieties were tested for the next 2 years. Moreover, Ostka Smolicka was the only bristly variety among tested varieties, and we aimed to check its susceptibility to Fusarium infection.
In order to achieve effective extraction, the mycotoxins were divided into 3 groups with similar physico-chemical properties: I. ZEA, DON, NIV—extracted with an acetonitrile-water solution (8:2 v/v); II. Enns, FBs—extracted with a methanol-water solution (3:1 v/v); III. MON, BEA—extracted with an acetonitrile–methanol–water solution (16:3:1 v/v/v).
Grain material was extracted using 2.5 mL of solvent per 1 g of sample; then, it was homogenized in a Ultraturrax model T25 basic (IKA Werke, Freiburg, Germany) for 4 min at 13,500 rpm. The content of mycotoxins was determined using the chromatographic system with a Waters 2695 high performance liquid chromatograph, a Waters 2475 Multi λ Fluorescence Detector, and/or a Waters 2996 Photodiode Array Detector (Waters Corporation, Milford, PA, USA). The quantification limits (LOQ) were determined by multiplying the detection limits (LOD) by 3.3. The LOD of the methods were calculated by a signal-to-noise ratio of 3:1. Mycotoxin analyses were performed in triplicate. The presented concentration values are the average of the obtained results.
The extract of ZEA was purified on an immunoaffinity column according to the method described by Visconti and Pascale [33]. Zearalenone content was determined using the fluorescence detector. The excitation and emission wavelengths were 274 and 440 nm, respectively. The reserve-phase column was a C-18 Nova Pak column (3.9 × 150 mm), while the mobile phase was acetonitrile–water–methanol (46:46:8, v/v/v) at a flow rate of 0.5 mL·min−1. Quantification of ZEA was performed by measuring the peak areas at the ZEA retention time according to the relevant calibration curve (correlation coefficient R = 0.9998). The limit of zearalenone detection was 3 μg·kg−1. The recovery of zearalenone was measured in triplicate by extracting ZEA from blank samples spiked with 5–100 ng·g−1 of the compound. The results of the experiments confirmed the literature data on ZEA recovery in the range of 97% to 99%. The relative standard deviation (R.S.D.) was below 1%. In order to confirm the presence of zearalenone, the photodiode array detector was used. To analyze the trichothecenes (DON, NIV), extracts were purified by filtration on a column (Celite 545:charcoal, Darco G-60:neutral alumina, 3:9:5 w/w/w) according to the method described by Tomczak et al. [34]. Deoxynivalenol and nivalenol were quantified by HPLC using a C-18 Nova Pak column (3.9 × 300 mm) and a photodiode array detector (λmax = 224 nm for DON and NIV). DON and NIV were eluted from the column with a 25% water solution of methanol (flow rate 0.7 mL·min−1). The detection limit for DON and NIV was 10 µg·kg−1. Positive results (on the basis of retention times) will be confirmed by HPLC analysis and by comparison with the relevant calibration curve (correlation coefficients for NIV and DON are 0.9994 and 0.9997, respectively). The recovery rates for NIV and DON were 75% are 87%, respectively, estimated in triplicate by extracting mycotoxins from blank samples spiked with 10–100 ng·g−1 of the compounds. The relative standard deviation (R.S.D.) was below 5% for DON and NIV. Enniatins and beauvericin were identified and quantified as reported by Logrieco et al. [23]. Extracts were prepurified once on a C18 column (500 mg, 3 mL, 40 μm), concentrated to 1 mL, and filtered through an Acrodisk filter (pore size, 0.22 μm) before HPLC analysis. HPLC analyses were performed using a diode array detector and C18 column (250 × 4.6 mm, 5 μm). HPLC conditions included a constant flow at 1.5 mL·min−1 and acetonitrile–water (65:35, v/v) as the starting eluent system. The starting ratio was kept constant for 5 min and then linearly modified to 70% acetonitrile over 10 min. After 1 min at 70% acetonitrile, the mobile phase was returned to the starting conditions in 4 min. Beauvericin and enniatins were detected at 205 nm. Mycotoxins were identified by comparing retention times and UV spectra of samples with those of authentic standards. Mycotoxins were quantified by comparing peak areas from samples to a calibration curve of standards. The detection limits were 5.0 µg·kg−1 for EnnA, 1.8 µg·kg−1 for EnnA1, 1.0 µg·kg−1 for EnnB1, 0.5 µg·kg−1 for EnnB, and 1.0 µg·kg−1 for beauvericin determination. The calculated standard deviation was always less than 5%. The extract of MON was purified on a Florisil column according to the method described by Kostecki et al. [35]. Moniliformin was quantified by HPLC using a C-18 Nova Pak column (3.9 × 300 mm) and a photodiode array detector (λmax = 229 nm). MON was eluted from the column with the acetonitrile–water solvent (15:85, v/v) buffered with 10 mL of 0.1 M K2HPO4 in 40% t-butyl-ammonium hydroxide in 1 L of solvent (flow rate 0.6 mL·min−1). The detection limit for MON was 8 μg·kg−1. Positive results (on the basis of retention times) were confirmed by HPLC analysis and by comparison with the relevant calibration curve (correlation coefficients 0.9990). The recovery rate for MON is 90%, estimated in triplicate by extracting mycotoxin from blank samples spiked with 10–100 ng·g−1 of the compound. The relative standard deviation (R.S.D.) was below 7%. The detailed procedure of extraction and purification of FBs was reported by Waśkiewicz et al. [36]. The fumonisin B1, B2, and B3 standards (5 μL) or extracts (20 μL) were derivatized with 20 or 80 μL of the o-phosphoric acid (OPA) reagent. After 3 min, the reaction mixture (10 μL) was injected onto an HPLC column. Methanol sodium dihydrogen phosphate (0.1M in water) solution (77:23, v/v) adjusted to pH 3.35 with o-phosphoric acid, after filtration through a 0.45 μm Waters HV membrane was used as the mobile phase with a flow rate of 0.6 mL·min−1. A HPLC with a C-18 Nova Pak column (3.9 × 150 mm) and a fluorescence detector (λEX = 335 nm and λEM = 440 nm) were used in the metabolite quantitative determination. The detection limit of FB1, FB2, and FB3 determination was 10.0 µg·kg−1. Positive results (on the basis of retention times) were confirmed by HPLC analysis and compared with the relevant calibration curve (the correlation coefficients for FB1, FB2, and FB3 were 0.9967, 0.9983, and 0.9966, respectively). The recovery rates for FB1, FB2, and FB3 were 93, 96, and 87%, respectively. The relative standard deviation (R.S.D.) was below 5%.
2.4. Quality Traits of Grains, Flour, and Bakery Products
The evaluation of the quality traits of the grain of the tested spring wheat varieties, different laboratory tests were carried out according to the methods commonly used to evaluate cereal grain and cereal products [37]. As part of the physico-chemical evaluation of grains, grain selectness, uniformity, glassiness, and hardness were determined using a farinograph adapter (Brabender, Duisburg, Germany).
The laboratory milling of the grain was carried out in a two-passage laboratory mill Quadrumat Senior (Brabender, Duisburg, Germany). Before milling, the grains were cleaned on granules (Brabender, Duisburg, Germany) and conditioned to 14.5% humidity. Based on the milling balance, the total flour yield was calculated. As part of the evaluation of the physical and chemical characteristics of the flour, the following determinations were made: total ash content according to the AACC Method 08-01.01 [33]; total protein content using Kjeldahl’s method (N∙5,83) in a Kjeltec apparatus 8200 (Foss, Hillerød, Sweden) according to the AACC Method 46-11.02 [38]; wet gluten yield and gluten index (IG) in a Glutomatic 2200 apparatus (Perten Instruments, Hägersten, Stockholm, Sweden) according to the AACC Method 38-12.02 [38]; and the falling number, with the Hagberg–Perten method in a Falling Number 1400 apparatus (Perten Instruments, Hägersten, Stockholm, Sweden) according to the AACC Method 56-81.03 [38].
The suitability of flour for the production of bakery products was determined by conducting a laboratory test baking. Dough (160% yield) was prepared directly from 500 g of flour with a moisture content of 14.0%, 300 cm3 of water, 15 g of baker’s yeast, and 7.5 g of kitchen salt in an SP-800A mixer (SPAR Food Machinery, Taiwan). The time of dough kneading was 4 min. Fermentation was carried out in two stages, with piercing of the dough after 60 and 90 min. The final expansion of the dough was carried out in moulds. Baking took place in a Svena Dahlen DC-32E oven (Sveba Dahlen, Fristad, Sweden) at 230 °C for 30 min.
The evaluation of the baking process was carried out on the basis of calculations of bread yields. The analysis of bread quality was carried out 24 h after baking (the bread was stored in room conditions). It included an evaluation of bread volume, crumb porosity, and an organoleptic evaluation using the point method according to the standard [39]. The assessment team consisted of 20 people. The evaluation included the following quality characteristics of the bread: external appearance of the loaf, colour and thickness of the crust, elasticity, porosity and sliceability of the crumb, taste, and smell.
2.5. Statistical Analysis
For all tested features, analysis of variance (ANOVA) and the post-hoc Tukey’s test was done, where varieties and years of the research were the factors of the experiment. The research on Fusarium spp. on ears and grain infestation were conducted in 4 replications (n = 3 years × 4 replications = 12), whereas the study of baking quality traits was conducted in 3 replications (n = 3 years × 3 replications = 9). Due to the lack of significant years × cultivar interactions for the features related to the technological value of grain, flour, and bread, these results were presented in the form of means from 3 years of research for each variety. All tests were performed at the significance level of α = 0.05.
3. Results
3.1. Infestation of Spring Wheat Ears and Grain by Fusarium spp.
In the 3 years of the experiment, the intensity of Fusarium head blight (FHB) of spring wheat was low and ranged from 0.0% to 5.5% of ears (Table 3, Figure 1A). The low level of infestation of ears in all years of research was a result of the weather conditions (warm and dry in the phase of ears ripening) (Table 2). The analysis of variance showed significant differences among the wheat varieties only in 2015, when the infestation of Izera variety ears was lower than Katoda variety. No significant interaction year × variety for the occurrence of FHB on the ears was detected.
Table 3.
The occurrence of FHB on the ears of spring wheat varieties (% of ears infested by Fusarium spp.).
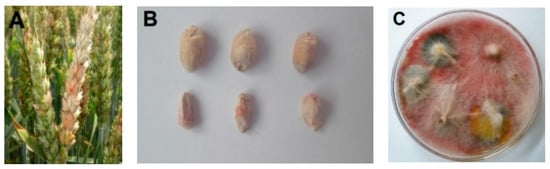
Figure 1.
(A) Fusarium head blight; (B) Fusarium disease on grains; (C) infestation of grains by Fusarium sp.
Grain infestation by Fusarium spp. varied between varieties and years from 1.5% to 18.5% (Table 4, Figure 1B,C). The significant interaction year × variety was found. The highest grain infestation was observed in 2014 (Table 4), when the precipitation was high in May, June, and August (Table 2). Waluta, Zadra, and Arabella varieties in each year of the study belonged to the group of varieties with the lowest percentage of infected grains. In the first year of research, the highest infestation of the grains was noted for Kandela and Ostka Smolicka varieties. On average, the largest amount of Fusarium spp. was isolated from grains of KWS Torridon and Cytra (Table 4).
Table 4.
The infestation of the grains (%) of spring wheat varieties.
The results of the research indicated that the lack of Fusarium disease symptoms on the ears does not mean that the grain is not infected by Fusarium spp. In all years, F. poae was the most frequently isolated species from grains, which does not cause the symptoms on ears (Table 5). The domination of F. poae explains the differences between the intensity of Fusarium spp. symptoms on ears and the colonization of grain. Other species—F. avenaceum, F. culmorum, F. equiseti, F. graminearum, F. langsethiae, F. sporotrichioides and F. tricinctum—were isolated occasionally, but to a lesser extent.
Table 5.
Species from Fusarium genus isolated from grains of spring wheat varieties (% of infested grains).
3.2. Mycotoxin Content in the Spring Wheat Grains
The content of mycotoxins in the tested samples of wheat grain varied depending on the year and variety (Table 6). In 2014, when five toxins were analyzed, the presence of DON was found only in one sample (Ostka Smolicka—181.5 µg·kg−1). The content of this toxin did not exceed the maximum contamination level of (1250 µg·kg−1) set by EU regulations [24]. The second of the tested trichothecenes—NIV—was found in the grain of a Kandela variety in the amount of 334.7 µg·kg−1. Both of these toxins were found in the tested grains only in the first year of the study (Table 6), which was the wettest year (Table 2).
Table 6.
Mycotoxin content in spring wheat grains.
The presence of ZEA was detected in two of the six tested samples; one from 2015 and one from 2016 (Table 6). Contamination of grains with this mycotoxin at levels of 24.1–62.9 µg·kg−1 did not exceed the accepted standard of 100 µg·kg−1 [24]. Due to the fact that F. poae was the dominant fungus isolated from the grain, accompanied by F. avenaceum and F. tricinctum, BEA and MON produced by these species were also examined. Mycotoxins BEA and MON were found in larger amounts in the examined grains. The concentration of BEA in the grains of both of the tested cultivars was over 6300 µg·kg−1, while the concentration of MON in the grains of both tested varieties was over 200 µg·kg−1 (Table 6).
In the second and third year of the study, 12 metabolites synthesized by Fusarium fungi were analyzed (Table 6). Additionally, enniatins (A1, A, B, and B1) and fumonisins (FB1, FB2, and FB3) were included in the study. In 2015 and 2016, very high BEA contents were found (respectively, over 13,000 µg·kg−1 in 2015 and over 89,000 µg·kg−1 in 2016). No correlation was observed between the number of synthesized toxins and the infestation of variety. No MON was found in 2015, but it was found in both wheat varieties in 2016. Of the analyzed enniatins, only enniatin A1 was present in all wheat samples from 2015 and 2016. In 2015, this toxin remained relatively stable, and its amount ranged from 23.430 to 25.380 µg·kg−1. In the last year of the study, its concentration increased significantly (97,426.8 µg·kg−1 for variety Ostka Smolicka and 81,635.9 µg·kg−1 for variety Kandela). In 2015 and 2016, the grains were also tested for concentrations of fumonisins. Only one sample from 2015 showed the presence of FB1 (Kandela 20.3 µg·kg−1), while none of them had the other fumonisins, FB2 and FB3. The correlation analysis showed no relationship between the infestation of grain by Fusarium spp. and the concentration of fumonisins.
3.3. Assessment of the Technological Value of Grains of Spring Wheat Varieties and Their Suitability for Processing
The grains of spring wheat cultivars from organic cultivation showed significant differences in terms of all of the assessed physico-chemical characteristics, i.e., selectness and uniformity, glassiness and hardness, and ash content (Table 7). During the three year study period, the average grain selectness ranged from 74.7% to 90.0%. The grain selectness of the majority of the examined wheat varieties (except for Izera and Koksa) coincided with grain uniformity, which proved their high plumpness. The most plump were wheat grains of the varieties Katoda, Waluta, Arabella, KWS Torridon, and Kandela, while the least plump were grains of the varieties Ethos and Koksa.
Table 7.
Results of the assessment of grain milling value (averages over 2014–2016).
Grain uniformity ranged from 74.7% to 90.0% on average (Table 7). During the three year research period, the greatest uniformity, as with selectness, was observed in the grains of wheat varieties Katoda, Waluta, Arabella, KWS Torridon, and Kandela.
The glassiness and hardness of grains indicate the structure of the endosperm. In the milling industry, glassy grains with a glassiness above 60% are classified as floury when the number of glassy grains is below 40%. In the 3 year testing period, the glassiness of grains was between 15% and 51% on average (Table 7). The highest percentage of grains with a glassy structure of the endosperm was observed in the following varieties: Ethos, Cytra, Koksa, and Korynta. The most floury grains were the Kandela, Katoda, and Waluta varieties.
During the 3 year testing period, the average grain hardness of the tested wheat varieties ranged from 563 BU to 670 BU (Table 7). Grains of Ethos, KWS Torridon, and Brawura wheat varieties had the hardest white, while grains of the Kandela and Zadra varieties had the softest.
The average content of mineral substances (total ash) in grains of the wheat varieties ranged from 1.75% d.m. to 1.93% d.m. (Table 7). The lowest ash content was found in grains of wheat varieties including Waluta, Brawura, Katoda, Arabella, Izera, and Korynta, while the highest total ash content was found in the grains of wheat varieties Koksa, Kandela, and Cytra.
During the three year research period, the average flour yields (extracts) ranged from 74.7% to 78.0% (Table 7). The obtained flour yields were high and comparable to those obtained in industrial mills. The largest flour extracts (above 77%) were obtained from milling grains of wheat varieties Zadra, Waluta, Kandela, Izera, Arabella, and Ethos.
During the three year testing period, the total protein content of the flours tested was, on average, from 9.5% d.m. to 11.2% d.m. (Table 8). The highest levels of this component were recorded from flours from the grain varieties Koksa, Korynta, Ethos, KWS Torridon, and Cytra.
Table 8.
Results of the evaluation of the baking value of flour (averages over 2014–2016).
During the 3 year study period, the average yields of wet gluten ranged from 21.2% to 29.9% (Table 8). The highest levels of gluten proteins were contained in flours from the grains of the following wheat varieties: Ethos, Cytra, KWS Torridon, Koksa, and Korynta, which were also characterized by the highest total protein content. As required by standards [40], the amount of gluten in low-extraction wheat flours should not be lower than 25%. The gluten yield meeting this requirement was recorded in flours obtained from the grains of varieties Cytra, Ethos, Koksa, Korynta, KWS Torridon, and Zadra.
The average values of the gluten index (GI) ranged from 40 to 98 (Table 8). Flours from most wheat varieties were distinguished by optimal gluten quality (GI values from 60 to 90). Regardless of the year of wheat harvest, exceptionally strong gluten was found in flours from the grains of the Arabella, Kandela, and Waluta varieties, while exceptionally weak gluten was found in the Cytra variety.
During the 3 year study period, the mean values of the falling number, which is the amylolytic enzyme activity index, ranged from 256 s to 314 s (Table 8). The optimal activity of amylolytic enzymes in flour intended for baking should be at an average level (a falling number in the range 220–280 s) [27]. This requirement was met by flours from the grain of Izera, Kandela, Koksa, and Zadra varieties. In wheat grain flours from the remaining varieties, the activity of amylolytic enzymes was lower. Before baking, it can be increased, e.g., by adding malt, which is a source of amylolytic enzymes.
The average bread yield (the amount of bread obtained from 100 parts of flour by weight) was not very diversified, ranging from 139.1% to 143.0% (Table 8). Bread with the highest yield was obtained from flour of the following varieties: Koksa, Ethos, Izera, and Ostka Smolicka.
Breads from the laboratory test baking had the correct taste and smell, typical of wheat bakery products. The shape of the loaves was correct, typical for bread baked in tins. The bread crust had the right thickness, the color ranging from light to dark brown. The growth of the loaves was varied. During the three year research period, the volume of the loaves was, on average, from 357 cm3∙100 g−1 to 420 cm3∙100 g−1 (Table 8). The largest volume of bread was obtained from flour of the wheat varieties Katoda, Arabella, Waluta, Izera, and Kandela, while the least risen bread loaves were obtained from Ostka Smolicka, Koksa, KWS Torridon, and Zadra.
Bread crumb was characterized by very good or good flexibility. It was varied in its porosity (Table 8, Figure 2). The crumb of bread from Arabella, Kandela, Katoda, and Waluta varieties was the most evenly distributed. The lowest rated in this aspect was the crumb of breads from flour from the varieties Ethos, Ostka Smolicka, and Zadra.
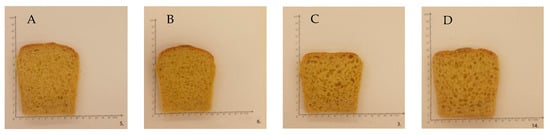
Figure 2.
Comparison of crumb porosity in 2016: (A) variety Izera, porosity coefficient 70; (B) variety Kandela, porosity coefficient 65; (C) variety Cytra, porosity coefficient 50; (D) variety Zadra, porosity coefficient 45.
During the organoleptic evaluation, the highest value was given to bread made from flour from the grains of the following varieties: Katoda, Arabella, Izera, and Korynta, while the lowest value was from Cytra, Zadra, and Ostka Smolicka (Table 8). Based on the total number of points awarded, breads made from flour from the grains of the Cytra, Zadra, and Ostka Smolicka varieties were graded to the second quality level. Bakery products made of flour from grains of the other wheat varieties were graded to the first quality group.
On the basis of the results of a 3 year study on spring wheat varieties from organic systems that are recommended for the production of bakery products, it was concluded that the requirements of the baking industry were met, to the greatest extent, by flours from the grains of varieties Arabella, Izera, Kandela, Katoda, and KWS Torridon.
4. Discussion
In organic agriculture, chemical products are forbidden; thus, other agrotechnical, mechanical, and biological methods, such as choice of a proper variety, are used to achieve a high yield of good quality [4,16,41]. One of the important features of wheat varieties that should be taken into account when evaluating their usefulness for cultivation in organic agriculture and food processing is their susceptibility to fungal diseases. Fusarium head blight (FHB) and grain infestation by Fusarium spp. (FDK—Fusarium disease kernels) may be caused by various species of Fusarium that have different climatic requirements and different toxin formations [17,18]. The most dangerous mold fungi for wheat ears include Fusarium culmorum, F. avenaceum, and F. graminearum. Factors that influence the occurrence of FHB and fungal infestation of the grain primarily include the weather (rainfall and temperature) during the stages from BBCH 55 to BBCH 73, as well as crop management treatments applied, crop rotation, nitrogen fertilisation, variety, plant protection products, and the quantity of inoculum of Fusarium spp. on a given field [17,42,43,44,45,46]. The severity of the disease symptoms in this experiment in the years 2014–2016 was low, which was probably influenced by the weather conditions, and especially by the low rainfall in the 2015 and 2016. Significant differences among the wheat varieties were observed in each year of the study according to infestation of grain and, in one year, due to the infestation of ears, as other agricultural factors were not differentiated in the experiment.
Mycotoxins most commonly accumulated in grains during wheat growth include deoxynivalenol, zearalenone, T-2 and HT toxins, and nivalenone. The risk is even more significant because certain amounts of mycotoxins have also been found in grains harvested from ears without symptoms of FHB [47]. The content of mycotoxins during the analyzed period was low and did not exceed the standards permitted by the European Union [24]. However, due to their high level of harmfulness, there is a need for constant monitoring of their content.
The profile of fungi inhabiting the territory of Poland has changed in the last years. Therefore, the toxins in cereals have also changed. Many of them were not standardized because they appeared sporadically. Therefore, it is necessary to update these standards allowing for the presence of individual compounds and to determine their toxicity to humans and animals. In Poland, such species as Fusarium subglutinans, Fusarium poae, and Fusarium verticilioides occur, which primarily produce fumonisins, beauvericin, group A and B trichothecenes, and enniatins [48]. The same shift in species was also found in other countries of central Europe [49].
According to Gromadzka et al. [50], the highest amount of BEA content was recorded in 2015, with a maximum concentration of 1,731,550.0 µg·kg−1. In China, 82.3% of the wheat samples were contaminated by BEA, in the range from 0.04 μg·kg−1 to 1006.56 μg·kg−1, followed by EnnA, with the levels ranging from 0.06 μg·kg−1 to 16.61 μg·kg−1, and EnnB1, with the levels ranging from 0.07 μg·kg−1 to 3.33 μg·kg−1 [51]. According to Chelkowski et al. [52], F. poae contributed to an accumulation of a high number of mycotoxins; namely, toxic hexadepsipeptides—both BEA (up to 46,000 μg·kg−1) and enniatins EnnA (up to 37,000 μg·kg−1), EnnB (up to 46,000 μg·kg−1) and EnnB1 (up to 75,000 μg·kg−1). On the other hand, MON was found in 25,32, and 76% of the Norway samples of barley, oats, and wheat, respectively. The maximum MON concentrations in barley, oats, and wheat were 380, 210, and 950 μg·kg−1, respectively [53].
In the research of Orlando et al. [54], conducted in France, F. tricinctum or F. poae affected enniatin content. F. tricinctum was the leading enniatin producer in spring barley (23% to 37%). F. avenaceum produced large amounts of enniatins in wheat (1% to 18%). F. poae made a minor contribution, never accounting for more than 2% of total enniatin content. According to these authors, enniatins were highly prevalent in French small grain cereals and were mostly produced by F. avenaceum and F. tricinctum.
The presence and concentration of mycotoxins in grains can be influenced by many factors. One of the most important factors is the potential ability of fungi to form mycotoxins, as only a part of the isolates of a given species has the capacity to form secondary metabolites. Moreover, other grain-infesting fungi and weather conditions may affect the number of mycotoxins produced [55]. In plant protection, the breeding of varieties with increased resistance to Fusarium fungi has great importance. In our research, the varieties with the smallest colonization of the grain by Fusarium spp. were Waluta, Zadra, and Arabella. The grains of the following cultivars were the most infested: Cytra, Kandela, and KWS Torridon.
It could be assumed that crops in organic farming are more vulnerable to diseases as they lack chemical protection. However, there are reports in the literature that, under this cropping system, the intensity of Fusarium spp. is not higher and is often even lower than with conventional system [56,57,58,59,60]. According to a review of the literature, Fusarium diseases are found less often in cereals grown in the organic system than in the conventional one (this also applies to mycotoxin content) [61,62].
Bernhoft et al. [63,64] report that using crop rotation, as in the organic system, reduced both the occurrence of Fusarium spp. in grains, and the mycotoxin content, while the lack of mineral fertilization and herbicides reduced the occurrence of F. graminearum. They also found increased levels of Fusarium spp. and mycotoxins in the case of plant lodging, which often occurs in conventional cultivation as a result of high mineral fertilization. Other factors determining the lower pressure of Fusarium sp. in the organic system, as compared to the conventional one, were: higher overall biodiversity, lower compactness of the canopy for better aeration, and ear structure of individual varieties.
However, it should be taken into account that our research included as many as 12 metabolites of Fusarium sp. fungi. Additionally, compounds that were naturally synthesized in significant quantities were analyzed. Therefore, the results obtained constitute an important supplement to the world literature and are the basis for further detailed research.
The basic direction of the use of wheat grains is the production of various types of flour, which are primarily raw materials for the production of bread, but also pastries, pasta, noodles, dumplings, pancakes, etc. [27]. Wheat grains that are commercially marketed, irrespective of the farming system, must be healthy, clean, ripe, and free from foreign odors or pests [26]. The moisture content of the grains must not exceed 15.0%, while the bulk density must not be lower than 72.0 kg/hl. The maximum total content of impurities should not exceed 15% at the grain buying, including harmful and/or toxic seeds 0.5%, and ergot 0.05%. The activity of amylolytic enzymes, determined on the basis of the falling number, should not be lower than 160 s [16,27]. The grains from all the tested organic spring wheat varieties, regardless of the year of harvest, met the general quality requirements, which indicates that they could be marketed.
Depending on the type of intended processing, specific quality requirements for wheat grains are determined. The requirements of the milling industry mainly concern grain size and grain uniformity, the structure of the endosperm (glassiness, hardness), and the maximum ash content [27,65]. The larger (more plump) the grains are, the higher the share of the endosperm and the smaller the share of the peripheral layers. From such raw material, higher flour yields with a low ash content can potentially be obtained [65]. In addition to being more mature, grains should also have a degree of sizing uniformity of not less than 75%. This high level of uniformity facilitates the cleaning (removal of impurities) and conditioning of grains [27]. It could be assumed that grains from organic farming, where the use of mineral fertilizers is forbidden, will be smaller than grain from conventional farming. Data from the literature indicates, however, that organic farming produces wheat grain of comparable size to that of conventional farming [16,25,66,67,68,69,70]. The possibility of obtaining grains of organic wheat of high maturity and uniformity is also indicated by the results obtained in this work, in which the average values of grain selectness and uniformity ranged from 74.0% to 90.0%. As in previous studies [16,25,66], both grain selectness and uniformity were significantly dependent on varietal traits. In terms of these parameters, in this study, the highest ratings were given to the grains of the varieties Katoda, Waluta, and Arabella.
Hardness and glassiness (flouriness) are considered to be the basic indicators for assessing the structural and mechanical properties of grains, especially their basic anatomical part—endosperm. The greater the hardness and glassiness of the grains, the greater the resistance to grinding, which translates into higher energy consumption [69]. The glassiness and flouriness are related to the chemical composition of grains, especially the protein–starch ratio. Glassy grains have a higher protein content than floury grains and a more compact structure, which makes them more resistant to mechanical stress. From glassy grains, large quantities of flour from grinding passages are produced. Flours from these passages exhibit low ashiness and light color [65]. The grains of the tested organic wheat cultivars were characterized by a floury structure of the endosperm; the percentage of glassy grains ranged from 15% to 51% and depended significantly on varietal traits. According to Marzec et al. [25], grains of wheat from organic farming exhibit lower glassiness and hardness of the endosperm than grains from intensive farming due to a lower content of protein substances that form the matrix surrounding the starch grains.
Ash content is one of the basic parameters characterizing wheat grain in terms of milling. The ash content of the grains determines, to a large extent, the ashiness of the flour obtained from it. A good raw material for the milling industry is wheat grain with a low ash content (maximum 1.75–1.80% dry matter), especially with a low ash content of the endosperm [65]. The ash content in the grain of the examined wheat varieties was relatively high, ranging from 1.75% to 1.93% d.m. An ash content not exceeding 1.80% d.m. was found in the grains of four wheat varieties: Brawura, Izera, Katoda, and Waluta. According to the literature data [8,16,25,66], ash content in the grains of wheat from organic farming may be slightly higher than in the grains from intensive farming. Spring wheat grains generally contain more ash than winter wheat [65].
The yields of flours obtained from milling the grains of the tested wheat varieties from organic farming were high (over 74%). According to many authors [16,66,70], the yields of flour obtained from grains of organic wheat are comparable to those of grains from intensive cultivation, which indicates that it is a suitable raw material for milling into low-extraction flours.
Flours obtained from the milling of grains should have the appropriate utility traits that are desirable for further processing. In the case of wheat flour intended for the production of bread, the quantity and quality of protein substances are particularly important [27,71,72]. The protein content of wheat grain, which is the raw material for flour production, is favorably influenced by mineral nitrogen fertilizers, which, however, cannot be used in an organic production system [6]. As a result, the protein content in the flour of organic wheat grains is lower than that of intensive cultivation, as indicated by many authors [16,70,71,73,74]. The flours tested in this study had a relatively low protein content, ranging from 9.5% to 11.2% d.m. Significant differences in the content of this component indicate that some varieties (Koksa, Korynta, Ethos, Cytra, KWS Torridon) better used the nitrogen available in the soil for protein synthesis than other varieties (Ostka Smolicka, Kandela, Brawura).
Among the proteins present in wheat flour, gluten proteins are of particular importance. They have a structuring function in bread due to their ability to form a branched structure, which, when the dough is mixed, envelops the swollen starch grains and enables the retention of gases produced during dough fermentation [72]. The results of many studies [16,68,70,71,73,74] indicate that organic wheat grain flours have a lower gluten protein content, as well as total protein content, than intensive grain flours. In this study, depending on the variety, the amount of wet gluten isolated from the tested flours ranged from 21.2% to even 29.9%. The gluten washed out of most flours, except for grain flour of Cytra variety (GI 40), was of good quality (GI 71 to 98).
An important parameter in assessing the baking value of wheat is also the falling number, which is an indicator of α-amylase activity. Flours for baking purposes should have the average activity of this enzyme (falling number of 220–280 s) [27]. The organic flours tested in this study showed medium or low amylolytic activity, none of them having an increased value of this parameter. According to some authors [70,72], the activity of amylolytic enzymes in organic wheat grain flour may be higher than in intensive wheat grain flour, and, according to others [16,68], it is at a similar level.
The best method of evaluating the value of baked flour is to carry out laboratory baking combined with an evaluation of the quality of the baked goods obtained, including a sensory evaluation. Breads obtained from the tested organic flours were highly rated in terms of sensory quality. They exhibited an intensive smell and taste typical of wheat bread; there were no major objections to the external appearance of the loaf and crumb. The loaves were generally well-risen; the volume per 100 g of bread was in the range of 363–420 cm3, which met the requirement set out in Polish standard (no less than 260 cm3·100 g−1) [75]. Data from the literature [16,66,67,71] indicate that flours from organic wheat grains can be used to make bread of a similar volume to that made of flour from intensively farmed wheat. However, there are also reports [73,74] that indicate that bread made from organic grains has a smaller volume. In addition to the volume of the loaf, the porosity of the crumb is an important quality feature. Wheat bread should have an even, finely porous crumb with thin walls, which adheres well to the crust. The porosity of the crumb of bread obtained from the tested organic flours varied. The crumb with the best porosity was noted for breads made of flour from grains of the following wheat varieties: Arabella, Kandela, Katoda, and Waluta.
An evaluation of the technological value of the grains showed that the grains of the tested spring wheat varieties generally met the quality requirements for the milling and baking industries. In the presented ranking of spring wheat varieties, the Arabella variety, a quality bread variety, was ranked the highest. Arabella has been noted since 2009 in the Polish Varieties Register carried out by Research Centre for Cultivar Testing (COBORU) [76]. This variety is also useful for late autumn sowing. It tolerates slight soil acidification, which makes it suitable for cultivation on poorer, sandy soils. This variety was also ranked high according to the agricultural traits and yield in our previous research [10] so it can be especially recommended for organic production.
5. Conclusions
The presented study is in line with the current trends in the greening of agriculture and the organic agriculture development according to the recent European Union strategies, such as the European Green Deal, the Farm to Fork strategy, and the European Biodiversity Strategy for 2030, which aim to increase the share of organic farming to 25% area of agricultural land in Europe by 2030. Our results give information about the traits of spring wheat varieties that are suitable for an organic system and food processing. The most resistant varieties to the threat of infection by Fusarium spp. were Waluta, Zadra, and Arabella. Mycotoxin contamination of the grain of two examined wheat varieties did not exceed maximum accepted levels. However, we observed that the colonization of grains by Fusarium spp. did not reflect the intensity of FHB; thus, the lack of symptoms of disease on ears does not mean the lack of grain infestation by mycotoxins. Therefore, there is a need for constant monitoring of phytosanitary condition of the canopy and wheat grain in organic farming. On the basis of the results of a 3 year study, the varieties most useful for organic production and processing were found to be Arabella, followed by Brawura, Izera, Kandela, Katoda, KWS Torridon, Waluta, and Zadra. The research results could be applied by farmers, advisors, and food processors that carry out crop production and processing in organic agriculture sector. Future research will focus on the suitability of other wheat varieties, in particular winter varieties, for organic farming and food processing.
Author Contributions
Conceptualization, B.F.-S., G.C.-P., L.L., K.G.; methodology, B.F.-S., G.C.-P., L.L., K.G., D.D.; validation, B.F.-S., G.C.-P., D.D.; investigation, B.F.-S., G.C.-P., L.L., K.G.; data curation, B.F.-S., G.C.-P., L.L.; writing—original draft preparation, B.F.-S.; G.C.-P., L.L., K.G.; writing—review and editing, B.F.-S., G.C.-P., L.L., D.D.; visualization, B.F.-S., G.C.-P., L.L.; supervision, B.F.-S., G.C.-P., D.D.; project administration, B.F.-S.; funding acquisition, B.F.-S., D.D. All authors have read and agreed to the published version of the manuscript.
Funding
The study was supported by the Polish Ministry of Agriculture and Rural Development under the grant for the research on organic crop production No HORre-msz-078-23/16(243).
Institutional Review Board Statement
Not applicable.
Informed Consent Statement
Not applicable.
Data Availability Statement
The data presented in this study are available upon request from the first author.
Conflicts of Interest
The authors declare no conflict of interest. The funders had no role in the design of the study; in the collection, analyses, or interpretation of data; in the writing of the manuscript, or in the decision to publish the results.
References
- Łączyński, A. Land Use and Sown Area in 2018; Central Statistical Office: Warsaw, Poland, 2019; p. 74. Available online: http://www.stat.gov.pl (accessed on 20 May 2020).
- Food and Agriculture Organization of the United Nations. Crops. Available online: http://www.fao.org/faostat/en/#data/QC (accessed on 20 May 2020).
- Hoad, S.; Topp, C.; Davies, K. Selection of cereals for weed suppression in organic agriculture: A method based on cultivar sensitivity to weed growth. Euphytica 2008, 163, 355–366. [Google Scholar] [CrossRef]
- Lammerts van Bueren, E.T.; Jones, S.S.; Tamm, L.; Murphy, K.M.; Myers, J.R.; Leifert, C.; Messmer, M.M. The need to breed crop varieties suitable for organic farming, using wheat, tomato and broccoli as examples: A review. NJAS Wagening. J. Life Sci. 2011, 58, 193–205. [Google Scholar] [CrossRef]
- Liatukas, Ž.; Leistrumite, A. Selection of winter wheat for organic growing. Agron. Res. 2009, 7, 381–386. [Google Scholar]
- Przystalski, M.; Osman, A.; Thiemt, E.M.; Rolland, B.; Ericsson, L.; Østergård, H.; Levy, L.; Wolfe, M.; Büschse, A.; Piepho, H.P.; et al. Comparing the performance of cereal varieties in organic and non-organic cropping systems in different European countries. Euphytica 2008, 163, 417–433. [Google Scholar] [CrossRef]
- Wolfe, M.S.; Baresel, J.P.; Desclaux, D.; Goldringer, I.; Hoad, S.; Kovacs, G.; Löschenberger, F.; Miedaner, T.; Østergård, H.; Lamberts van Bueren, E.T. Developments in breeding cereals for organic agriculture. Euphytica 2008, 163, 323–346. [Google Scholar] [CrossRef] [Green Version]
- Dziki, D.; Cacak-Pietrzak, G.; Gawlik-Dziki, U.; Świeca, M.; Miś, A.; Różyło, R.; Jończyk, K. Physicochemical Properties and Milling Characteristics of Spring Wheat from Different Farming Systems. J. Agr. Sci. Tech. 2017, 19, 1253–1266. Available online: http://jast.modares.ac.ir/article-23-7491-en.html (accessed on 22 April 2021).
- Cacak-Pietrzak, C.; Ceglińska, A.; Jończyk, K. Value of baking flour wheat variety with grain grown the organic system of production. Zesz. Probl. Postępów Nauk. Rol. 2014, 576, 23–32. (In Polish) [Google Scholar]
- Feledyn-Szewczyk, B.; Cacak-Pietrzak, G.; Lenc, L.; Stalenga, J. Rating of Spring Wheat Varieties (Triticum aestivum L.). According to Their Suitability for Organic Agriculture. Agronomy 2020, 10, 1900. [Google Scholar] [CrossRef]
- Feledyn-Szewczyk, B.; Nakielska, M.; Jończyk, K.; Berbeć, A.K.; Kopiński, J. Assessment of the Suitability of 10 Winter Triticale Cultivars (x Triticosecale Wittm. ex A. Camus) for Organic Agriculture: Polish Case Study. Agronomy 2020, 10, 1144. [Google Scholar] [CrossRef]
- Tamm, I.; Tamm, Ü.; Ingver, A. Spring cereals performance in organic and conventional cultivation. Agronomy Res. 2009, 7, 522–527. [Google Scholar]
- Kronberga, A. Selection criteria in triticale breeding for organic farming. Agron. Vestis 2008, 11, 89–94. [Google Scholar]
- Lenc, L. Fusarium head blight and Fusarium spp. occuring on grain of spring wheat in an organic farming system. Pytopathologia 2011, 62, 31–39. [Google Scholar]
- Siuda, R.; Grabowski, A.; Lenc, L.; Ralcewicz, M.; Spychaj-Fabisiak, E. Influence of the degree of fusariosis on technological traits of wheat grain. Int. J. Food Sci. Tech. 2010, 45, 2596–2604. [Google Scholar] [CrossRef]
- Cacak-Pietrzak, G. Studies on the effect of organic and conventional system of plant production on the technological value of selected varieties of winter wheat. In Treatises and Monographs; Publications of Warsaw University of Life Sciences: Warsaw, Poland, 2011; pp. 1–83. [Google Scholar]
- Parry, D.W.; Jenkinson, P.; Mc Leod, L. Fusarium ear blight (scab) in small grain cereals—A review. Plant Pathol. 1995, 44, 207–238. [Google Scholar] [CrossRef]
- Wiśniewska, H.; Stępień, Ł.; Waśkiewicz, I.; Beszterda, M.; Góral, T.; Belter, J. Toxicenic Fusarium species infecting wheat heads in Poland. Cent. Eur. J. Biol. 2014, 9, 163–172. [Google Scholar]
- Gromadzka, K.; Waśkiewicz, A.; Chełkowski, J.; Goliński, P. Zearalenone and its metabolites—Occurrence, detection, toxicity and guidelines. World Mycotoxin J. 2008, 1, 209–220. [Google Scholar] [CrossRef]
- Wiśniewska, H.; Perkowski, J.; Kaczmarek, Z. Scab response and deoxynivalenol accumulation in spring wheat kernels of different geographical origins following inoculation with Fusarium culmorum. J. Phytopathol. 2004, 152, 613–621. [Google Scholar] [CrossRef]
- Desjardins, A.E. Fusarium Mycotoxins, Chemistry, Genetics and Biology; The American Phytopathological Society: St. Paul, MN, USA, 2006; p. 220. [Google Scholar]
- Tomoda, H.X.; Huang, H.; Nishida, H.; Nagao, R.; Okuda, S.; Tanaka, H.; Omura, S.; Arai, H.; Inoe, K. Inhibition of acyl-coA: Cholesterol acyltransferase activity by cyclodepsipeptide antibiotics. J. Antibiot. 1992, 45, 1626–1632. [Google Scholar] [CrossRef] [Green Version]
- Logrieco, A.; Rizzo, A.; Ferracane, R.; Ritieni, A. Occurrence of Beauvericin and Enniatins in Wheat Affected by Fusarium avenaceum Head Blight. Appl. Environ. Microbiol. 2002, 68, 82–85. [Google Scholar] [CrossRef] [PubMed] [Green Version]
- Commissions Regulations (EC) No 1881/2006 of 19 December 2006 Setting Maximum Levels for Certain Contaminants in Foodstuffs. Available online: https://eur-lex.europa.eu/legal-content/EN/TXT/PDF/?uri=CELEX:02006R1881-20140901&rid=9 (accessed on 28 May 2020).
- Marzec, A.; Cacak-Pietrzak, G.; Gondek, E. Mechanical and acoustic properties of spring wheat versus its technological quality factors. J. Texture Stud. 2011, 42, 319–329. [Google Scholar] [CrossRef]
- The Polish Committee for Standardization. PN-R-74103: 1996. Cereal Grains. Common Wheat; The Polish Committee for Standardization: Warsaw, Poland, 1996.
- Cacak-Pietrzak, G. The use of wheat in various branches of the food industry—Technological requirements. Przegląd Zboż. Młyn. 2008, 52, 11–13. (In Polish) [Google Scholar]
- IUSS Working Group WRB. International soil classification system for naming soils and creating legends for soil maps. In World Reference Base for Soil Resources; World Soil Resources Reports, No. 106; Food and Agriculture Organization of the United Nations: Rome, Italy, 2014; pp. 1–191. [Google Scholar]
- EU Common Catalogue of Varieties of Agricultural Plant Species. Consolidated Version, 20.09.2019. 2019. Available online: https://ec.europa.eu/food/sites/food/files/plant/docs/plant_variety_catalogues_agricultural-plant-species.pdf (accessed on 28 May 2020).
- Council Regulation (EC) No 834/2007 of 28 June 2007 on Organic Production and Labelling of Organic Products and Repealing Regulation (EEC) No 2092/91. Available online: http://eur-lex.europa.eu/legal-content/EN/TXT/PDF/?uri=CELEX:32007R0834&from=EN> (accessed on 28 May 2020).
- Booth, C. The Genus Fusarium; Commonwealth Mycological Institute: Surrey, UK, 1971; p. 237.
- Kwaśna, H.; Chełkowski, J.; Zajkowski, P. Fungi, XII; Polish Academy of Sciences: Warsaw-Cracow, Poland, 1991; p. 136.
- Visconti, A.; Pascale, M. Determination of zearalenone in corn by means of immunoaffinity clean-up and high-performance liquid chromatography with fluorescence detector. J. Chromatogr. A 1998, 815, 133–140. [Google Scholar] [CrossRef]
- Tomczak, M.; Wiśniewska, H.; Stepień, Ł.; Kostecki, M.; Chełkowski, J.; Goliński, P. Deoxynivalenol, nivalenol and moniliformin in wheat samples with head blight (scab) symptoms in Poland (1998-2000). Eur. J. Plant Pathol. 2002, 108, 625–630. [Google Scholar] [CrossRef]
- Kostecki, M.; Wiśniewska, H.; Perrone, G.; Ritieni, A.; Goliński, P.; Chełkowski, J.; Logrieco, A. The effects of cereal substrate and temperature on production of beauvericin, moniliformin and fusaproliferin by Fusarium subglutinans ITEM-1434. Food Addit. Contam. 1999, 16, 361–365. [Google Scholar] [CrossRef]
- Waśkiewicz, A.; Goliński, P.; Karolewski, Z.; Irzykowska, L.; Bocianowski, J.; Kostecki, M.; Weber, Z. Formation of fumonisins and other secondary metabolites by Fusarium oxysporum and F. proliferatum a comparative study. Food Addit. Contam. 2010, 27, 608–615. [Google Scholar] [CrossRef] [PubMed] [Green Version]
- Cacak-Pietrzak, G. Cereal grains. In Selected Issues from Plant-Based Food Technology; Mitek, M., Leszczyński, K., Eds.; SGGW Publication: Warsaw, Poland, 2014; pp. 261–273. (In Polish) [Google Scholar]
- AACC. AACC Method 08-01.01: Total ash. Method 38-12.02: Wet gluten, Dry Gluten, Water—Binding Capacity, and Gluten Index. Method 46-11.02: Crude Protein—Improved Kjeldahl Method, Copper Catalyst Modyfication. Method 5681.03: Determination of Falling Number, 11th ed. In Official Methods of the American Association of Cereal Chemists; AACC: St. Paul, MN, USA, 2010. [Google Scholar]
- The Polish Committee for Standardization. PN-A-74108: 1996. Bread. Methods of Research; The Polish Committee for Standardization: Warsaw, Poland, 1996.
- The Polish Committee for Standardization. PN-91/A-74022:1992. Cereal Preparations. Wheat Flour; The Polish Committee for Standardization: Warsaw, Poland, 1992.
- Finney, D.M.; Creamer, N.G. Weed Management on Organic Farms; The Organic Production Publication Series; Center for Environmental Farming Systems (CEFS), North Carolina Cooperative Extension Service: Raleigh, NC, USA, 2008; pp. 1–34. [Google Scholar]
- Jennings, P.; Turner, J.A. Towards the Prediction of Fusarium Ear Blight Epidemics in the UK—The Role of Humidity in Disease Development. In Brighton Crop Protection Conference: Pest & Diseases 1996; 3D-12; British Crop Protection Council: Farnham, UK, 1996; pp. 233–238. [Google Scholar]
- Lemmens, M.; Buerstmayr, H.; Krska, R.; Schuhmacher, R. The effect of inoculation treatment and long-term application of moisture on Fusarium head blight symptoms and deoxynivalenol contamination in wheat grains. Eur. J. Plant Pathol. 2004, 110, 299–308. [Google Scholar] [CrossRef]
- De Wolf, E.D.; Madden, L.V.; Lipps, P.E. Risk assessment models for wheat Fusarium head blight epidemics based on within-season weather data. Phytopathology 2003, 93, 428–435. [Google Scholar] [CrossRef] [Green Version]
- Xu, X.M.; Nicholson, P.; Thomsett, M.A.; Simpson, D.; Cooke, B.M.; Doohan, F.M.; Brennan, J.; Monaghan, S.; Moretti, A.; Mule, G.; et al. Relationship between the fungal complex causing Fusarium head blight of wheat and environmental conditions. Phytopathology 2008, 98, 69–78. [Google Scholar] [CrossRef] [Green Version]
- Cowger, C.; Patton-Özkurts, J.; Brown-Guedira, G.; Perugini, L. Postanthesis moisture increased Fusarium head blight and deoxynivalenol levels in North Carolina winter wheat. Phytopathology 2009, 99, 320–327. [Google Scholar] [CrossRef] [PubMed] [Green Version]
- Lacey, J.; Bateman, G.L.; Mirocha, C.J. Effects of infection time and moisture on development of ear blight and deoxynivalenol production by Fusarium spp. in wheat. Ann. Appl. Biol. 1999, 134, 277–283. [Google Scholar] [CrossRef]
- Gromadzka, K.; Górna, K.; Chełkowski, J.; Waśkiewicz, A. Mycotoxins and related Fusarium species in preharvest maize ear rot in Poland. Plant Soil Environ. 2016, 62, 348–354. [Google Scholar] [CrossRef] [Green Version]
- Adler, A.; Lew, H.; Brunner, S.; Oberforster, M.; Hinterholzer, J.; Kulling-Gradinger, C.M.; Mach, R.L.; Kubicek, C.P. Fusaria in Austrian cereals—Change in species and toxins spectrum. J. Appl. Genet. 2002, 43A, 11–16. [Google Scholar]
- Gromadzka, K.; Błaszczyk, L.; Chełkowski, J.; Waśkiewicz, A. Occurrence of Mycotoxigenic Fusarium Species and Competitive Fungi on Preharvest Maize Ear Rot in Poland. Toxins 2019, 11, 224. [Google Scholar] [CrossRef] [Green Version]
- Han, X.; Xu, W.; Zhang, J.; Xu, J.; Li, F. Natural occurrence of beauvericin and enniatins in corn- and wheat-based samples harvested in 2017 collected from Shandong Province, China. Toxins 2019, 11, 9. [Google Scholar] [CrossRef] [PubMed] [Green Version]
- Chełkowski, J.; Ritieni, A.; Wiśniewska, H.; Mule, G.; Logrieco, A. Occurrence of toxic hexadepsipeptides in preharvest maize ear rot infected by Fusariun poae in Poland. J. Phytopathol. 2007, 155, 8–12. [Google Scholar] [CrossRef]
- Uhlig, S.; Torp, M.; Jarp, J.; Parich, A.; Gutleb, A.C.; Krska, R. Moniliformin in Norwegian grain. Food Addit. Contam. 2004, 21, 598–606. [Google Scholar] [CrossRef]
- Orlando, B.; Grignon, G.; Vitry, C.; Kashefifard, K.; Valade, R. Fusarium species and enniatin mycotoxins in wheat, durum wheat, triticale and barley harvested in France. Mycotoxin Res. 2019, 35, 369–380. [Google Scholar] [CrossRef] [PubMed]
- Stępień, Ł.; Chełkowski, J. Fusarium head blight of wheat: Pathogenic species and their mycotoxins. World Mycotoxin J. 2010, 3, 107–119. [Google Scholar] [CrossRef]
- Dexter, J.E.; Nowicki, T.W. Safety assurance and quality assurance issues associated with Fusarium head blight in wheat. In Fusarium Head Blight of Wheat and Barley; Leonard, K.J., Bushnell, W.R., Eds.; APS Press: St. Paul, MN, USA, 2003; pp. 420–460. [Google Scholar]
- Champeil, A.; Fourbet, J.F.; Dore, T.; Rossignol, L. Influence od cropping system of Fusarium head blight and mycotoxin levels in winter wheat. Crop Prot. 2004, 23, 6, 531–537. [Google Scholar] [CrossRef]
- Lenc, L. Fusarium head blight (FHB) and Fusarium populations in grain of winter wheat grown in different cultivation systems. J. Plant Prot. Res. 2015, 55, 94–109. [Google Scholar] [CrossRef] [Green Version]
- Stein, J.M.; Osborne, L.E.; Bondalapati, K.D.; Glover, K.D.; Nelson, C.A. Fusarium head blight and deoxynivalenol concentration in wheat response to Gibberella zeae inoculum concentration. Phytopathology 2009, 99, 759–764. [Google Scholar] [CrossRef] [PubMed] [Green Version]
- Schneweis, I.; Meyer, K.; Ritzmann, M.; Hoffmann, P.; Dempfle, L.; Bauer, J. Influence of organically or conventionally produced wheat on health, performance and mycotoxin residues in tissues and bile of growing pigs. Arch. Anim. Nutr. 2005, 59, 155–163. [Google Scholar] [CrossRef]
- Sadowski, C.; Lenc, L.; Kuś, J. Fusarium head blight and Fusarium spp. on grain of winter wheat, a mixture of cultivars and spelt grown in organic system. J. Res. Appl. Agric. Eng. 2010, 55, 79–84. [Google Scholar]
- Benbrook, C.M. Breaking the mold—Impacts of organic and conventional farming systems on mycotoxins in food and livestock feed. In An Organic Center State of Center Review; The Organic Center: Washington, DC, USA, 2005; pp. 1–58. [Google Scholar]
- Bernhoft, A.; Clasen, P.E.; Kristoffersen, A.B.; Torp, M. Less Fusarium infestation and mycotoxin contamination in organic than in conventional cereals. Food Addit. Contam. Part A Chem. Anal. Control Expo. Risk Assess. 2010, 27, 842–852. [Google Scholar] [CrossRef] [PubMed]
- Bernhoft, A.; Torp, M.; Clasen, P.E.; Løes, A.K.; Kristoffersen, A.B. Influence of agronomic and climatic factors on Fusarium infestation and mycotoxin contamination of cereals in Norway. Food Addit. Contam. Part A Chem. Anal. Control Expo. Risk Assess. 2012, 29, 1129–1140. [Google Scholar] [CrossRef] [PubMed] [Green Version]
- Cacak-Pietrzak, G.; Ceglińska, A.; Torba, J. The milling value of some wheat cultivars from Breeding “Nasiona Kobierzyc”. Pam. Puławski. 2005, 139, 27–38. (In Polish) [Google Scholar]
- Cacak-Pietrzak, G.; Ceglińska, A.; Jończyk, K. Technological value of selected winter wheat varieties cultivated in different crop production systems. Pam. Puławski. 2003, 133, 17–25. (In Polish) [Google Scholar]
- Mäder, P.; Hahn, D.; Dubois, D.; Gunst, L.; Alföldi, T.; Bergmann, H.; Oehme, M.; Amadò, R.; Schneider, H.; Graf, U.; et al. Wheat quality in organic and conventional farming: Results of 21 year field experiment. J. Sci. Food Agric. 2007, 87, 1826–1835. [Google Scholar] [CrossRef]
- Lacko-Bartošovà, M.; Korczyk-Szabó, J. Winter wheat productivity and quality in sustainable farming systems. In Scientific Papers Agriculture; Agroprint: Timisoara, Romania, 2008; Volume 40, pp. 9–14. [Google Scholar]
- Dziki, D.; Cacak-Pietrzak, G.; Miś, A.; Jończyk, K.; Gawlik-Dziki, U. Influence of wheat kernel physical properties on the pulverizing process. J. Food Sci. Technol. 2014, 51, 2648–2655. [Google Scholar] [CrossRef] [PubMed] [Green Version]
- Mazurkiewicz, J. Comparison of the technological quality of wheat and rye cultivated in conventional and ecological farm conditions. Acta Agroph. 2005, 6, 729–741. (In Polish) [Google Scholar]
- Cacak-Pietrzak, G.; Ceglińska, A.; Jończyk, K.; Kuś, J. Utilization on chosen winter wheat cultivars from ecological cropping system to the bread production. Fragm. Agron. 2008, 1, 67–75. (In Polish) [Google Scholar]
- Wieser, H. Chemistry of gluten proteins. Food Microbiol. 2007, 24, 115–119. [Google Scholar] [CrossRef]
- Kihlberg, I.; Öström, A.; Johansson, L.; Rosvik, E. Sensory qualities of plain white pan bread: Influence of farming system, milling and baking technique. J. Cer. Sci. 2006, 43, 15–30. [Google Scholar] [CrossRef]
- Krejčiřová, L.; Capouchová, I.; Petr, J.; Bicanová, E.; Famera, O. The effect of organic and conventional growing systems on quality and storage protein composition of winter wheat. Plant. Soil Environ. 2007, 53, 499–505. [Google Scholar] [CrossRef] [Green Version]
- The Polish Committee for Standardization. PN-92/A-74105: 1993. Plain and Choice Wheat Bread; The Polish Committee for Standardization: Warsaw, Poland, 1993.
- Research Centre for Cultivar Testing (COBORU). National List of Varieties. Available online: https://coboru.gov.pl/English/Rejestr_eng/gat_w_rej_eng.aspx (accessed on 20 March 2021).
Publisher’s Note: MDPI stays neutral with regard to jurisdictional claims in published maps and institutional affiliations. |
© 2021 by the authors. Licensee MDPI, Basel, Switzerland. This article is an open access article distributed under the terms and conditions of the Creative Commons Attribution (CC BY) license (https://creativecommons.org/licenses/by/4.0/).