Article

Microbiome Analysis of the Rhizosphere from Wilt Infected Pomegranate Reveals Complex Adaptations in Fusarium—A Preliminary Study

by
Anupam J. Das
1,2,
Renuka Ravinath
1,
Talambedu Usha
2,
Biligi Sampgod Rohith
3,
Hemavathy Ekambaram
4,
Mothukapalli Krishnareddy Prasannakumar
5,
Nijalingappa Ramesh
1 and
Sushil Kumar Middha
4,*
1
School of Applied Sciences, Reva University, Rukmini Knowledge Park, Bangalore 562149, Karnataka, India
2
Department of Biochemistry, Maharani Lakshmi Ammanni College for Women, Bangalore 560012, Karnataka, India
3
Molsys Pvt. Ltd., Yelahanka, Bangalore 561249, Karnataka, India
4
DBT-BIF Facility, Department of Biotechnology, Maharani Lakshmi Ammanni College for Women, Bangalore 560012, Karnataka, India
5
Department of Plant Pathology, University of Agricultural Sciences, Bangalore 560065, Karnataka, India
*
Author to whom correspondence should be addressed.
Agriculture 2021, 11(9), 831; https://doi.org/10.3390/agriculture11090831
Submission received: 19 June 2021 / Revised: 3 August 2021 / Accepted: 18 August 2021 / Published: 30 August 2021
(This article belongs to the Special Issue New Traits of Agriculture/Food Quality Interface)

Abstract

:
Wilt disease affecting pomegranate crops results in rapid soil-nutrient depletion, reduced or complete loss in yield, and crop destruction. There are limited studies on the phytopathogen Fusarium oxysporum prevalence and associated genomic information with respect to Fusarium wilt in pomegranate. In this study, soil samples from the rhizosphere of different pomegranate plants showing early stage symptoms of wilt infection to an advanced stage were collected from an orchard situated in Karnataka, India. A whole metagenome sequencing approach was employed to gain insights into the adaptations of the causative pathogen F. oxysporum. Physicochemical results showed a drop in the pH levels, N, Fe, and Mn, and increase in electrical conductivity, B, Zn, Cl, Cu was observed in the early and intermediate stage samples. Comparative abundance analysis of the experimental samples ESI and ISI revealed an abundance of Proteobacteria phyla Achromobacter sp. 2789STDY5608625, Achromobacter sp. K91, and Achromobacter aegrifaciens and Eukaryota namely Aspergillus arachidicola, Aspergillus candidus, and Aspergillus campestris. Functional pathway predictions implied carbohydrate binding to be significant (p < 0.05) among the three experimental samples. Microbiological examination and whole microbiome analysis confirmed the prevalence of F. oxysporum in the soil samples. Variant analysis of F. oxysporum revealed multiple mutations in the 3IPD gene with high impact effects. 3-Isopropylmalate dehydratase and carbohydrate-active enzymes could be good targets for the development of antifungals that could aid in biocontrol of F. oxysporum. The present study demonstrates the capabilities of the whole metagenome sequencing approach for rapid identification of potential key players of wilt disease pathogenesis wherein the symptomatology is complex.

1. Introduction

Pomegranate is a widely cultivated fruit crop with its origins traced to Turkey and Iran. The crop is extensively cultivated in various parts of India and India has emerged as the leading producer of pomegranate globally [1,2,3]. There are extensive reports on the medicinal properties of the pomegranate viz it’s antimicrobial [4], antihyperglycemic [5], anticancerous [6,7], its nutraceutical [8], pharmaceutical [9], and cosmeceutical [10] applications due to the presence of a wide range of nutrients, secondary metabolites such as alkaloids and flavonoids [2]. There are also reports of anti-inflammatory properties and the potential of the pomegranate juice and peel against various disorders [2,3,11,12,13] and protection from UV photodamage [14]. However, cultivating the crop has been challenging due to its susceptibility to diseases and pest infestations which results in a drastic reduction in the yield and quality of the fruit. Major diseases are caused as a result of bacterial and fungal infections. Some of the fungal pathogens reported are Colletotrichum acutatum [15] Trichoderma spp., Botrytis cinerea, Aspergillus niger, Penicillium spp., Alternaria spp., Colletotrichum gloeosporioides, Pestalotia brevista, and Pilidiella granati [16,17,18,19] anthracnose disease of the flower. The infection results in the abortion of the flower leading to a reduction in the yield [15]. The manifestations of infection caused by Pilidiella granati are crown rot, twig blight, and dieback with common symptoms of necrosis in fruits and twigs respectively during the early stage of infection [15,19]. Among the bacterial diseases, blight disease is one of the serious challenges faced by farmers in India. The causative organism has been identified as Xanthomonas campestris. pv. punicae. Yield loss of up to 80% has been reported in Bangalore, Karnataka as a result of an epidemic outbreak. The pathogen infects the entire plant. Epidemic outbreaks are also reported in Andhra Pradesh, Maharashtra, and Delhi [20]. The detection of the fungal and bacterial pathogens is generally done through the isolation of the organism followed by culturing them. The identification is done based on the morphological characters and physiological and biochemical tests. These methods are highly labor-intensive, time-consuming, need expertise [21] and only the cultivable organisms can be identified. These limitations were later overcome by PCR based diagnostic method. The identification and detection of P. granati were carried out through the nested PCR method. Species-specific primers were designed and the method could effectively detect the pathogen in the fruits of pomegranate [22]. In another study, the phytopathogen Xanthomonas campestris pv. punicae, causing blight disease in pomegranate was detected using ERIC-PCR-Generated genomic fingerprints. A relationship was established between the fingerprints and virulence pattern of the blight-causing pathogen [20]. These methods have limitations with respect to specificity as they are not based on DNA sequencing.
16S rRNA gene sequencing is an excellent approach to reveal the identity of the pathogen as they are signature specific sequences in bacterial species with higher accuracy. Bacterial wilt disease in Cucurbita maxima in China caused by Ralstonia solanacearum was identified by 16S rRNA gene sequencing of the isolates obtained from the plants infected with wilt. Pathogenicity analysis revealed that all the isolates belonged to Ralstonia solanacearum [23]. Investigations on determining the microbiota associated with symptomatic and non-symptomatic bacterial wilt-diseased banana plants were also done using 16S rRNA metagenome sequencing. Illumina MiSeq platform was used for sequencing. The results revealed the predominance of Ralstonia in the pseudostem of the symptomatic diseased plant compared to non-symptomatic [24]. The findings could also throw light on the role of endophytic microbes revealed through sequencing studies in conferring tolerance to the disease. Many successful studies have been carried out in fruit crops and vegetables, where 16S rRNA gene sequencing has emerged as an excellent tool for the detection of the associated plant pathogens. Another newly reported disease in pomegranate is the Bacterial root-bark necrosis disease and wilt in pomegranate, which was found to affect the plant entirely. A recent study by Ajaysree and Borkar, 2018, shed light on the symptomatology of the disease that includes symptoms of wilt disease on the leaves and stem such as yellowing of leaves, followed by leaf fall and wilting of branches. The study reports complete death of the plant with no recovery in a period of 2–3 months. On the other hand, reports suggest that the roots of plants show symptoms of root-bark necrosis. 16S rRNA sequencing facilitated the identification of the pathogenic bacterium Klebsiella pneumoniae [25].
To explore the correlation between monocropping followed in banana and the Fusarium wilt incidence, the soil samples from such fields were subjected to sequencing of 16S rRNA genes for bacteria and internal transcribed spacer using the MiSeq platform for fungal identification. The findings led to the conclusion that monocropping significantly increased the incidence of Fusarium wilt [26], with the help of 16S metagenomics the role of the cropping system in disease management.
16S rRNA sequencing using the 454 platforms could accurately reveal the bacteria associated with the nematodes infesting pine trees. This association is responsible for the wilt disease of pine. 25 Operational Taxonomic Units could be analyzed based on 97% of similarity in the sequences of the library. The microbial diversity revealed Alphaproteobacteria, Betaproteobacteria, Gammaproteobacteria, and Bacteroidetes [27]. These findings are vital for adopting the proper control measures for wilt disease as it is influenced by the nematodes as well as the associated microbiota establishing a unique ecosystem.
However, despite all the benefits of employing the 16S metagenomics approach, there are certain limitations to consider prior to planning a soil metagenomics study. Firstly, soil microbial diversity is vast, and exploring the soil communities with a targeted approach that considers quantifying relative abundances of taxa may remain incomplete in terms of its functional potential. Secondly, the resolution is dependent on the databases employed. There are large scale efforts put towards developing database and tools to improve classification of bacterial communities and their diversity [28,29,30] The emergence of long read platforms have offered potential solutions to help sequence the entire 16S rRNA using the Nanopore or PacBio platforms. Some studies have reported higher microbial identification and taxonomic resolution as compared to the short amplicon sequencing despite the higher depth from platforms such as Illumina [31]. To specifically identify fungi, the gene cluster within the 18S ribosomal RNA is considered and the repetitive internal transcribed spacer (ITS) sequences are used. Furthermore, 18S rRNA sequencing comes with its limitations particularly with extraction methods showing biased results [32], primer-biases in PCR resulting in amplification of certain taxa preferentially [33], the copy numbers of the small subunit (SSU) rRNA genes [34], sequencing errors [35,36] and remnant DNA amplification [37].
The whole metagenome sequencing approach has helped address some of these limitations pertaining to targeted metagenome approaches. Microbe-pest-host associations are complex and their adaptations remain elusive. The whole metagenome approach is a powerful method to not only screen microbes but also facilitate understanding of plant-microbe-soil interactions and the disease pathogenesis in plants. The advanced Illumina Novaseq 6000 (Illumina) offers a unique possibility to perform soil microbial characterization [38,39]. Despite the large data outputs from these platforms, bioinformatics analysis of the data employing server and cloud-based analytics services have enhanced the speed and efficiency of analysis [40]. There are limited studies on the phytopathogen Fusarium oxysporum prevalence and associated genomic information with respect to Fusarium wilt in pomegranate. In the present study, we demonstrate the implementation of shotgun sequencing using the whole metagenome approach to study the pathogenomics of wilt disease in Punica granatum caused by Fusarium, wherein the symptomatology is complex.

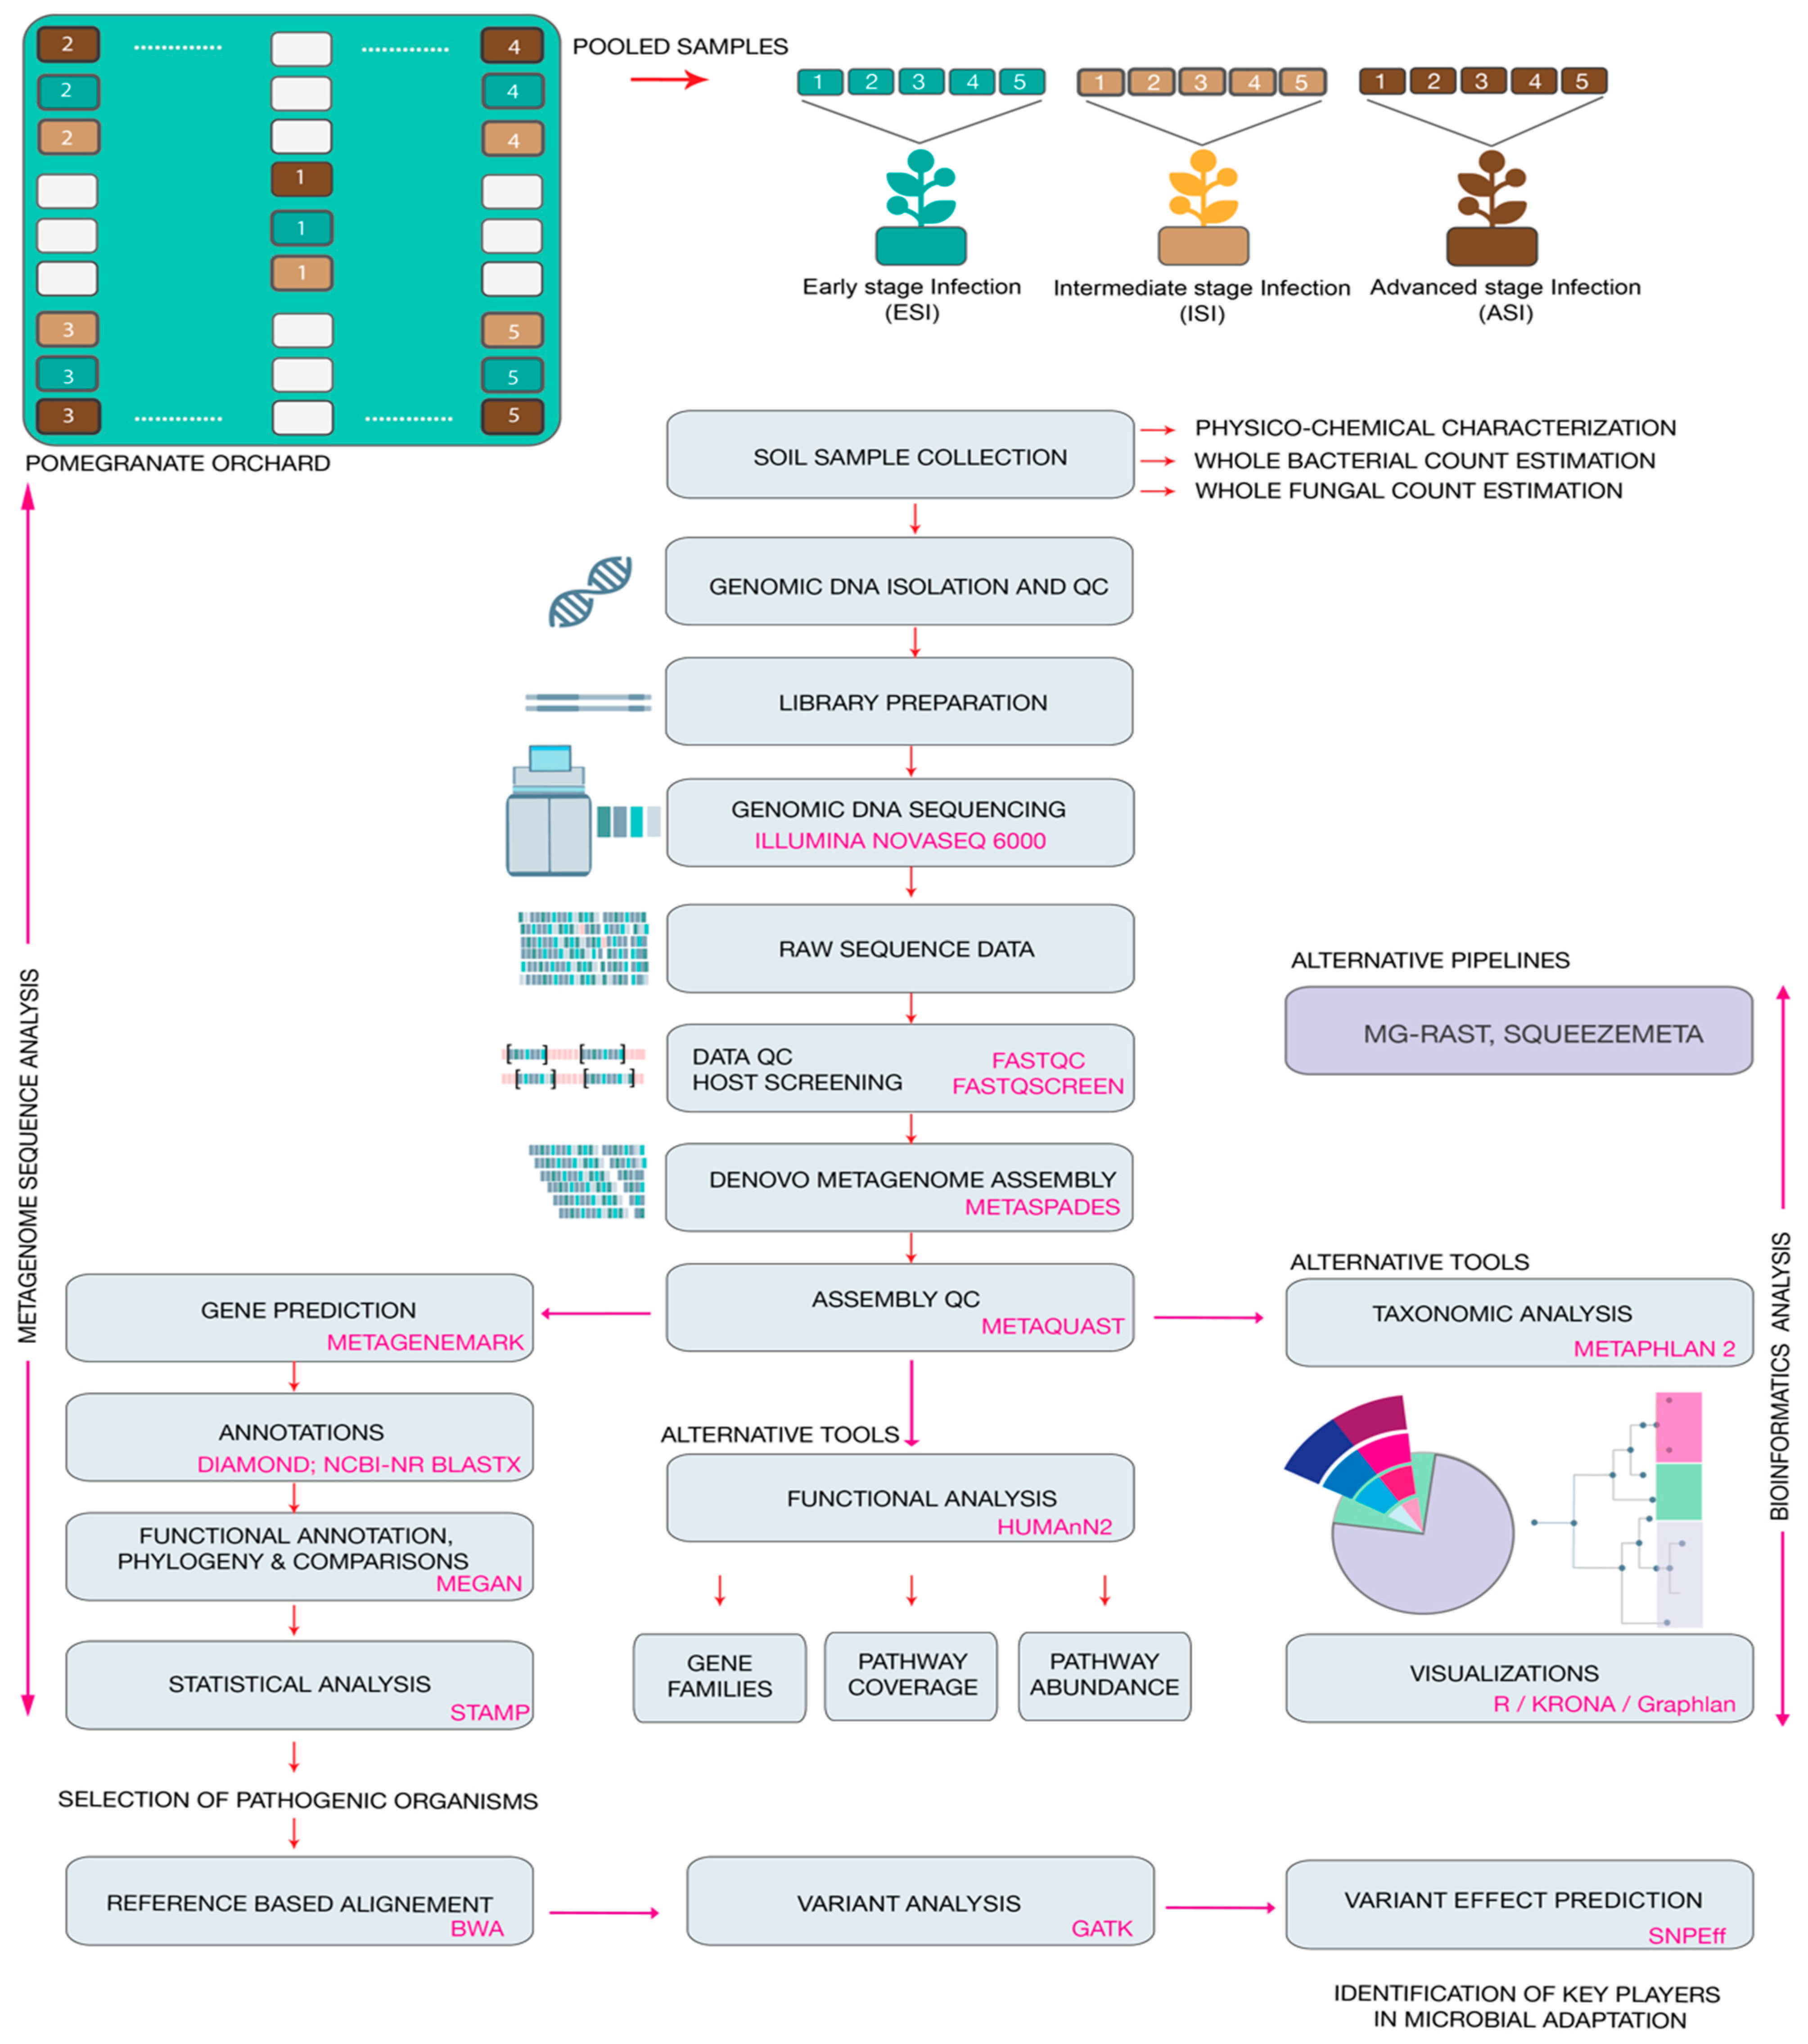
2. Materials and Methods

The present study involved screening the physiochemical parameters of the soil samples from the rhizosphere of the infected plants. The total microbial counts were estimated. Employing conventional microbiological methods the soil samples were plated on specialized media to confirm the presence of the pathogen Fusarium oxysporum and Aspergillus niger. Following which genomic DNA was isolated from soil samples and the quality control of the samples was performed. Whole metagenome shotgun sequencing was carried out. Thereafter, the data was subject to bioinformatics analysis to estimate the relative abundances of the microbes, and the functional predictions were performed. Finally, variant analysis was carried out to screening for possible targets that could provide key leads to understand the adaptations of the pathogen. An overview of the methodology adapted in the study is provided in Figure 1.

2.1. Site Description and Sampling

Soil samples were collected from a pomegranate orchard close to Chikkaballapur (13.3907° N, 77.6880° E) from Karnataka, India. The orchard has been used for cultivating the crop over a span of 5 years and the farmer suffered huge losses due to the reducing fruit yield attributed to severe pest infestations. In the past year alone, the farmer suffered a loss in fruit yield by over 36%. The land was surveyed and post-harvest, without the application of any pesticides or antibacterial or antifungal agents, samples were collected in December 2019 from the rhizosphere of 5 plants from each category showing similar symptoms. The symptoms were categorized as early signs of infection, moderate signs of infection, on and severe infections, in triplicates and pooled (Figure 1). The plants were identified as early-stage infection (ESI) with early symptoms of wilt, intermediate stage of infection (ISI), and advanced stage of infection (ASI) on the basis of physical examination of the leaves, stem, fruits, and roots (Figure 2).

2.2. Physicochemical Characterization and Total Microbial Count Estimation

All the physical and chemical characterizations were carried out based on the procedures provided by [41]. pH values, electrical conductivity, were estimated by the electrometric method [41]. The total microbial counts were estimated using the protocols provided in IS 5402 and IS 5403 for the total bacterial and total fungal count respectively [42,43]. Each reading was collected in duplicates.

2.3. Isolation of Fusarium oxysporum, Aspergillus niger from Soil Samples

39 g of potato dextrose agar powder (catalog no. M096, HiMedia) was added in 1 L sterile water and it was thoroughly mixed. The media was autoclaved at 15 psi pressure at 121 °C for 15 min. Test Samples (1 mL) were 10-fold diluted in 9 mL of water (10−1). From that sample was serially diluted up to (10−2) and (10−3). All three dilutions were plated on Selective media by spread plate technique. The plates were incubated in both aerobic chambers at 37 °C for 24–48 h for bacteria and 27 °C for 48–72 h. After 24–48 h incubation colonies were observed and recorded [42] (Tables S1 and S2).

2.4. DNA Extraction and Quality Control

DNA extraction was carried out based on the protocol by Amorim et al. [44]. Nanodrop was used initially to test the purity of DNA (OD260/OD280) (NanoDrop, Wilmington, DE, USA). Agarose Gel Electrophoresis was performed to assess DNA degradation and potential contaminations (Figure S1) and finally, Qubit 2.0 was used to quantify the DNA concentration precisely.

2.5. Library Construction and Quality Control

Qualified DNA was cut into fragments by the restriction enzyme. The construction of the DNA libraries is through the processes of end repairing, adding A to tails, purification, PCR amplification, and Libraries were sequenced by Illumina high-throughput sequencer with paired-end sequencing strategy. The libraries, that passed the QC, were then fed into sequencers after pooling according to their effective concentration and expected data volume.

2.6. Whole Meta-Genome Sequencing

The qualified libraries are fed into sequencer Illumina Novaseq 6000 (sequencing facility of Novogene Co. Ltd., Beijing, China) after pooling according to its effective concentration and expected data volume. The detailed protocol is provided in the supplementary data, Table S3.

2.7. Data Analysis

Raw Data QC of individual samples was conducted using FastQC (parameters: default) (https://www.bioinformatics.babraham.ac.uk/projects/fastqc/; accessed on 10 January 2020, Table S4). FastQ Screen v0.14.0 (https://www.bioinformatics.babraham.ac.uk/projects/fastq_screen/; accessed on 11 January 2020) was employed to screen the host genome sequences (References: GCF_007655135.1, GCA_002837095.1, GCA_002864125.1, GCA_002201585.1) from the raw data (parameters: --tag --filter ‘00000’; configured with bowtie2-2.3.5.1 and default Adapters). Host screened data was further validated using fastq-pair v1.0 and then assembled using metaSPAdes v3.13.0 (parameters: default) [45], metagenomic classification and visualizations using Kraken2 (parameters: --use-names --paired --gzip-compressed; database: built on 12 November 2020) [46] and pavian (https://github.com/fbreitwieser/pavian/; accessed on 10 January 2020) respectively. SPAdes assembled genome was subjected to gene prediction using MetaGeneMark (parameters: -f 3 -a -d -k -v -m MetaGeneMark_v1.mod) [47]. The predicted nucleotides were searched against NCBI NR database (Downloaded in March 2020) using Diamond v0.9.30 (parameters: -k 1) BlastX. Annotations were further meganized (parameters: default) using MEGAN v6 (relevant database were Downloaded in March 2020) [48].
Genome resolved metagenomics of Individual samples was performed using the SqueezeMeta pipeline v1.3.0 in sequential mode with MegaHIT assembler (default parameters). Short contigs (<200 bps) were removed and contig statistics were estimated using prinseq. RNAs were predicted using Barrnap. 16S rRNA sequences were taxonomically classified using the RDP classifier. tRNA/tmRNA sequences were predicted using Aragorn [49]. ORFs were predicted using Prodigal. Similarity searches for GenBank, eggNOG, KEGG, were done using Diamond HMM homology searches were done by HMMER3 [50] for the Pfam database. Read mapping against contigs was performed using Bowtie2. Binning was done using MaxBin2 [51] and Metabat2 [52]. A combination of binning results was performed using the DAS Tool [53]. Bin statistics were computed using CheckM. Bins with at least 50% completeness and <20% contamination were selected and subjected to annotation using enrichM’s annotation module (https://github.com/geronimp/enrichM, accessed on 20 May 2021) against KO, PFAM, EC, and CAZY databases. The generated annotation matrices were subjected to enrichment using enrichM’s enrich module. Alternatively, functional analysis of the metagenomic samples was also done using MG-RAST online server (https://www.mg-rast.org/; accessed on 22 January 2020) with default parameters.

2.8. Prediction of Protein Functions

Processed FASTQ reads of individual samples were used to search most popular databases that include protein databases, protein databases with functional hierarchy information, and ribosomal RNA databases namely RefSeq, IMG, TrEMBL, Subsystems, KEGG, GenBank, SwissProt, PATRIC, eggNOC, KO, GO, COG, RDP, LSU, SSU and NOG as a part of the MG-RAST analysis.

2.9. Variant Analysis

Based on the analysis of the processed reads and the resultant assemblies obtained from metaspades, the organisms Fusarium oxysporum and Aspergillus niger were used from the samples ESI and ISI respectively. BWA [53] was utilized for indexing (parameters: index) and mapping (parameters: mem) the pre-processed reads to A. niger CBS 513.88 (NCBI Accession: GCF_000002855.3), and F. oxysporum f. sp. lycopersici 4287 (NCBI Accession: GCF_000149955.1) reference genomes. Then the aligned reads were converted to bam and sorted using Samtools v.1.6 [54] (parameters: sort -l 9) and duplicate reads were marked using GATK MarkDuplicates v.4.1.9.0 [55], followed by adding and replacing the read groups using GATK AddOrReplaceReadGroups. The reference dictionary was created for the genome using Samtools (parameters: dict) and the reference genome was also indexed using Samtools (parameters: faidx) to aid the variant calling process. GATK HaplotypeCaller (parameters: -ERC GVCF -GQB 50) and GATK GenotypeVCFs to generate known variants for base quality score recalibration using GATK BaseRecalibrator, followed by GATK ApplyBQSR. Furthermore, the recalibrated alignments were again run through GATK HaplotypeCaller (parameters: -ERC GVCF -GQB 50) and GATK GenotypeVCFs to identify the variants, followed by selecting identified SNPs and INDELs separately using GATK SelectVariants (parameters: --select-type-to-include SNP) (Parameters: --select-type-to-include INDEL) and extracted SNPs were further masked using GATK VariantFiltration (parameters: -mask -mask-extension 5 --mask-nameINDEL”) to tag the SNPs identified in and around INDELs. Finally, the masked SNPs and filtered INDELs were merged using GATK MergeVcfs [56]. In order to predict the variant effects, reference genomes were prepared using snpEff v.5.0d [57] (parameters: build-genbank) and variant summary and effect predictions were obtained.

2.10. Statistical Analysis

Output from MEGAN in. SPF format was used for statistical analysis and was performed using STAMP 2.1.3 (http://kiwi.cs.dal.ca/Software/STAMP; accessed on 10 January 2020, [58]). The one-sided G-test (w/Yates’ + Fisher’s) with asymptomatic confidence intervals (0.95) using the Benjamini–Hochberg FDR method was implemented [59].

3. Results

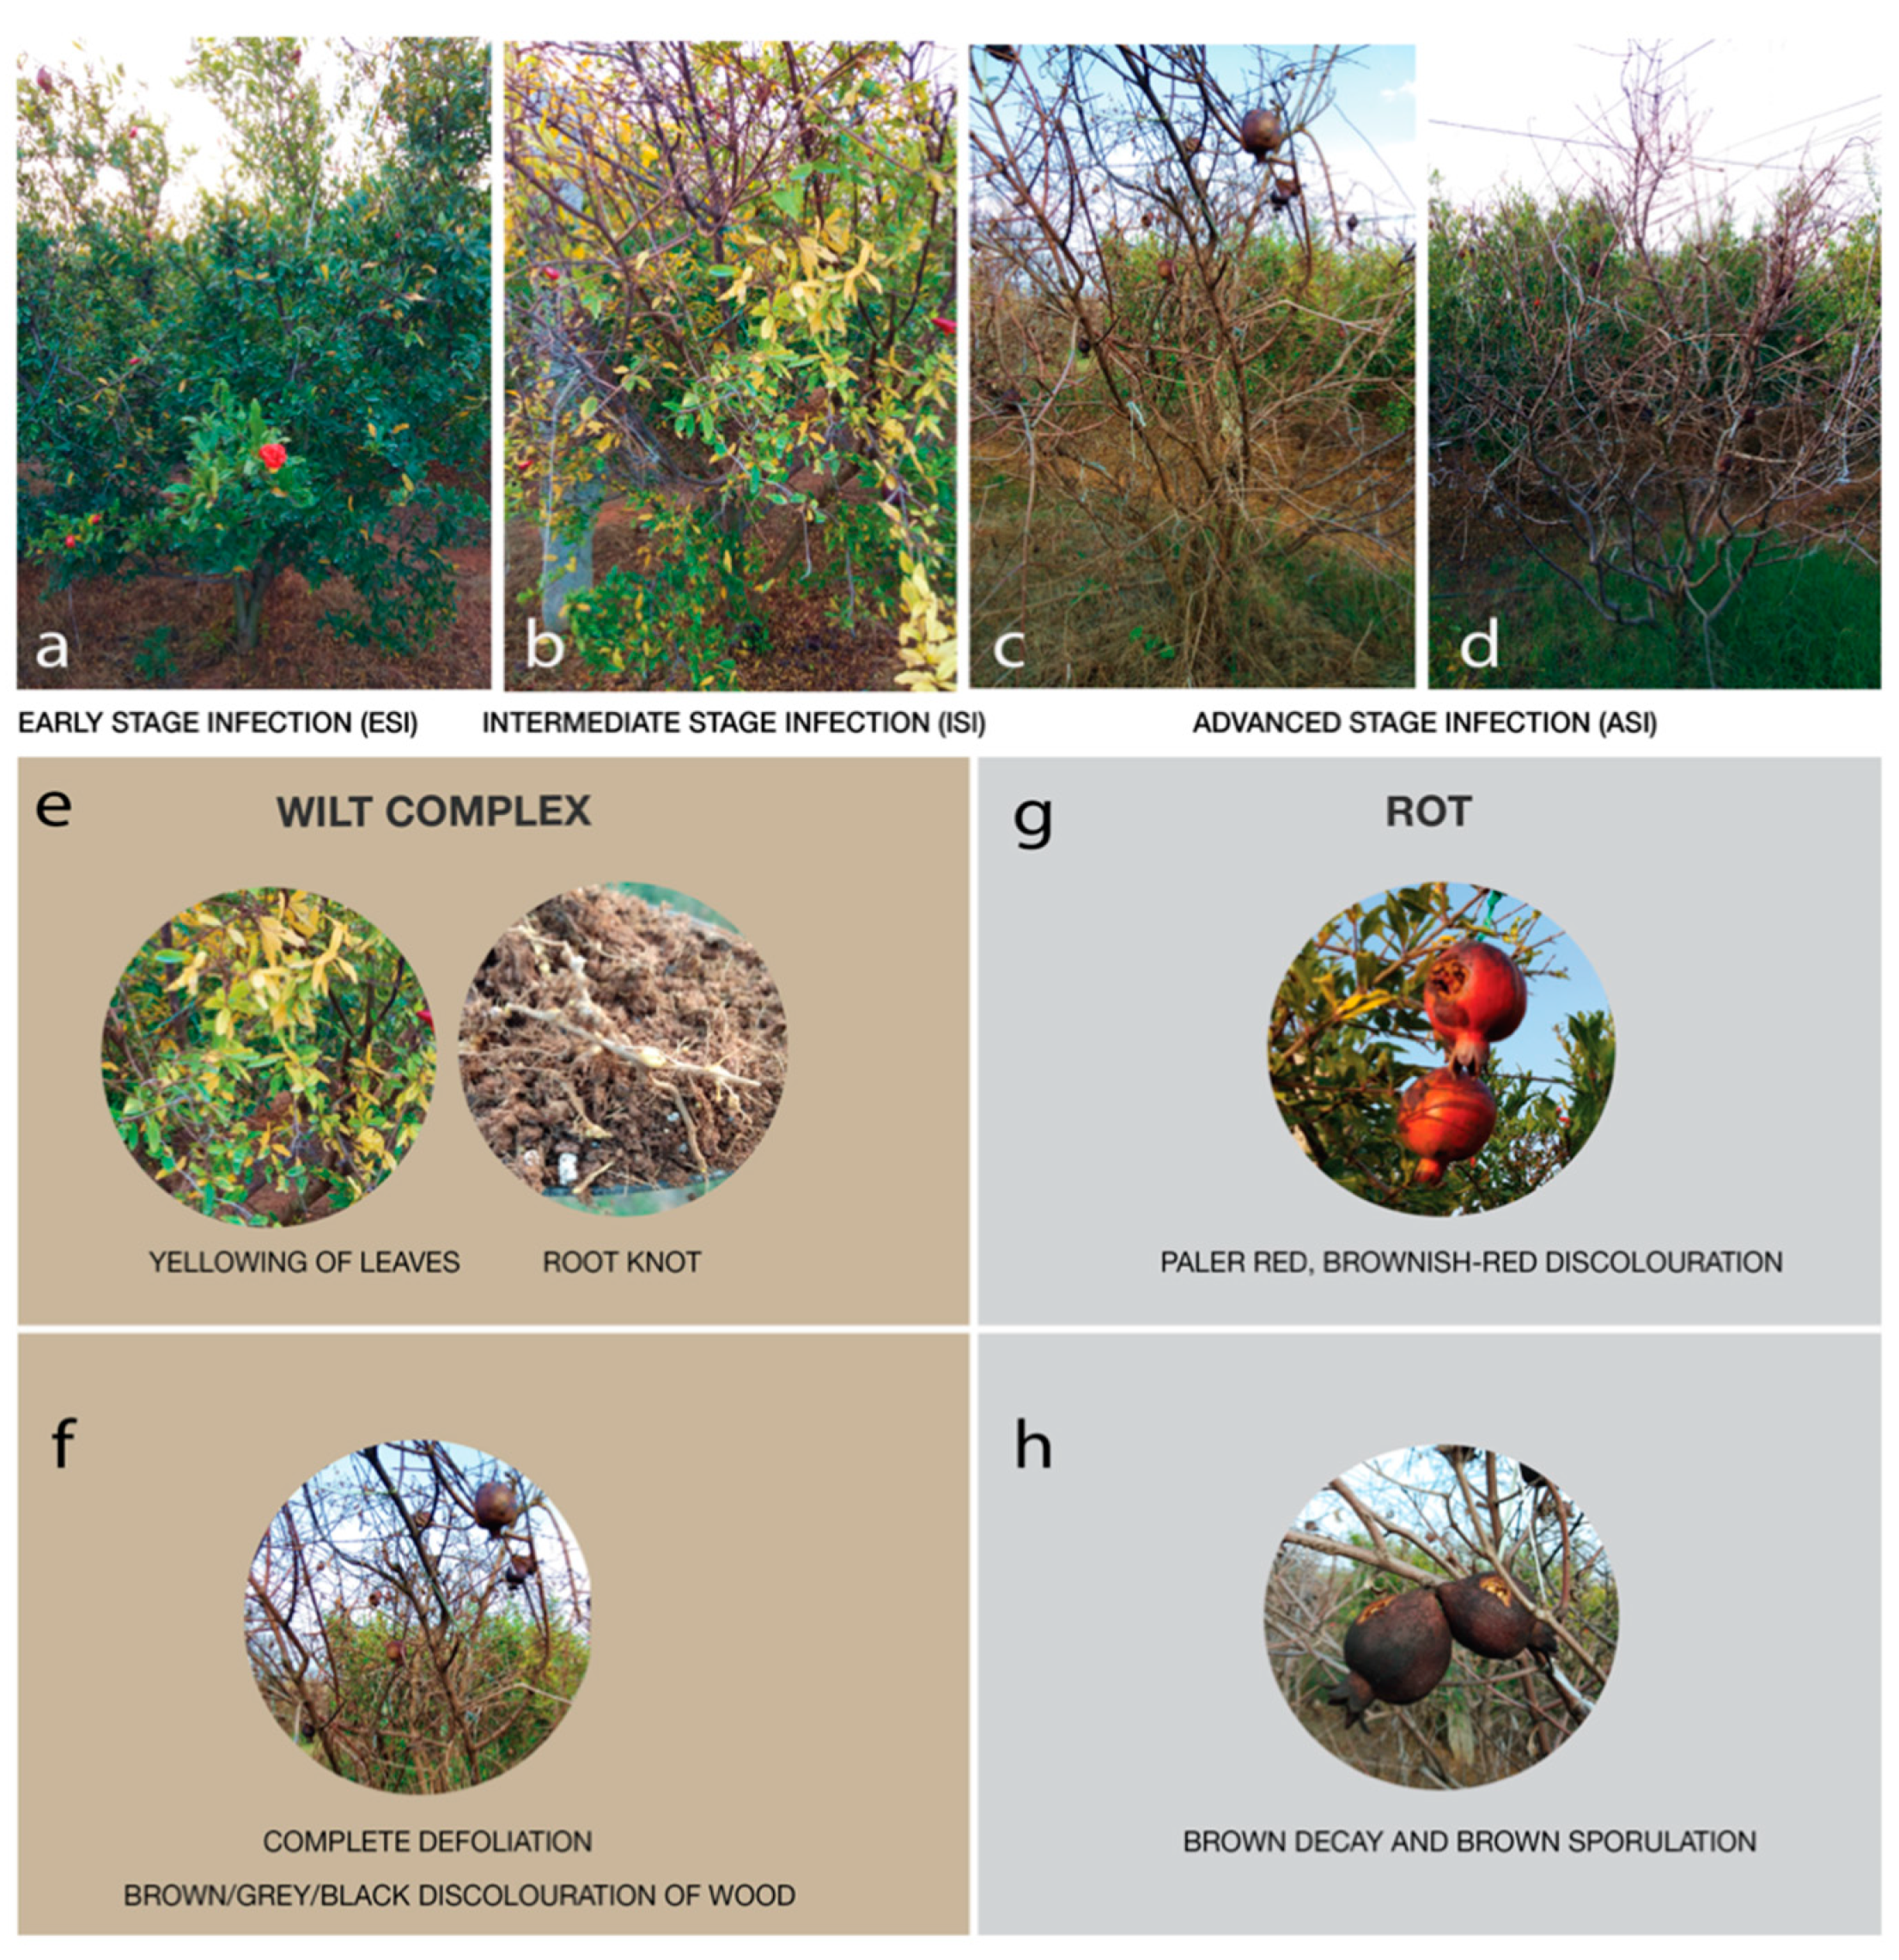
3.1. Physical Examination

Physical examination of the pomegranate plants, with respect to their, roots, leaves, stems, and fruits showed symptoms of wilt were considered for the study. Examination of the fruits showed the presence of rot disease was deemed for study.
Considering the ESI plant sample, few leaves showed mild yellowing (Figure 2b,e) and on examination of the roots, root knots were observed (Figure 2e). A few of the fruits showed black spots with mild discoloration. In the ISI, the dark brown coloration of the stem was observed, the fruits were darkly colored irregular spots with cracking (Figure 2f) and leaves showed yellowing, presence of moist, dark-colored irregular spots (Figure 2b). The ASI sample showed complete defoliation (Figure 2c) fruits that had completely turned dry with dark-brown pigmentation (Figure 2h), the root systems were dry and reduced with elongated galls, and dark brown coloration of the stem which has turned completely dry was observed (Figure 2f). ASI sample had complete yield reduction with no recovery (Figure 2).

3.2. Physiochemical Properties

The pH of the ESI sample was found to be 7.73 and electrical conductivity was estimated to be 135 µs/cm. Macronutrient and micronutrient analysis of ESI revealed 0.20% of total nitrogen (N), 0.0084% Phosphorous (P), 0.011% Potassium (K), 0.92% organic Carbon (C), 15 ppm Chloride(Cl), 0.98% Iron (Fe), 9.5 ppm Manganese (Mn), 26.9 ppm Copper (Cu), 24.8 ppm Zinc (Zn), and 3.4 ppm Boron (B). The pH and electrical conductivity of the ISI sample were estimated to be 6.35 and 139 µs/cm, respectively. In ISI samples the total N was calculated to be 0.19%, followed by P (0.010%), K (0.011%), C (0.93%), Cl (18 ppm), Fe (0.93%), Mn (9.1 ppm), Cu (29.4 ppm), Zn (30.9 ppm), B (4.1 ppm). The pH of the ASI sample was found to be 6.63 and electrical conductivity was estimated to be 180 µs/cm, followed by total N (0.20%), P (0.011%), K (0.014%), C (0.97%), Cl (21 ppm), Fe (0.98%), Mn (9.6 ppm), Cu (31.4 ppm), Zn (33.2 ppm), B (4.3 ppm). The pH was found to be altered in the ISI sample (6.35) and ASI sample (6.63) as compared to that of the ESI sample (7.73). Furthermore, reduced levels of N, Fe, and Mn micronutrients were reported in the ISI sample as compared to the ESI sample. Whereas, the micronutrients B, Zn, Cl, Cu, were found to be higher in the ISI sample when compared to the ESI sample (Table 1 and Table S5).

3.3. Total Microbial Counts

The total bacterial counts and total fungal were estimated to be 1968 g/cfu, 2240 g/cfu and 2126 g/cfu for the ESI, ISI, and ASI, respectively. The total bacterial counts in the ISI sample showed a significant increase as compared to ESI and ASI. Similarly, the total fungal counts showed a significant increase in the ISI sample, which was estimated to be 170 g/cfu, as compared to ESI (154 g/cfu) and ASI (154 g/cfu) (Table 1 and Table S5).

3.4. Sequence Information

13 GB of high-quality raw data per sample for ESI, ISI, and ASI was generated using the Illumina Novaseq 6000 sequencer. The complete protocol information and sequencing results are tabulated in Table 2 and Table S4. The BioProject Id is PRJNA701747. The BioSample Ids for the samples ESI, ISI, and ASI are SAMN17910186, SAMN17910187, and SAMN17910188, respectively. The rarefaction curve of the experimental data sets ESI, ISI and ASI are provided in Figure S2.

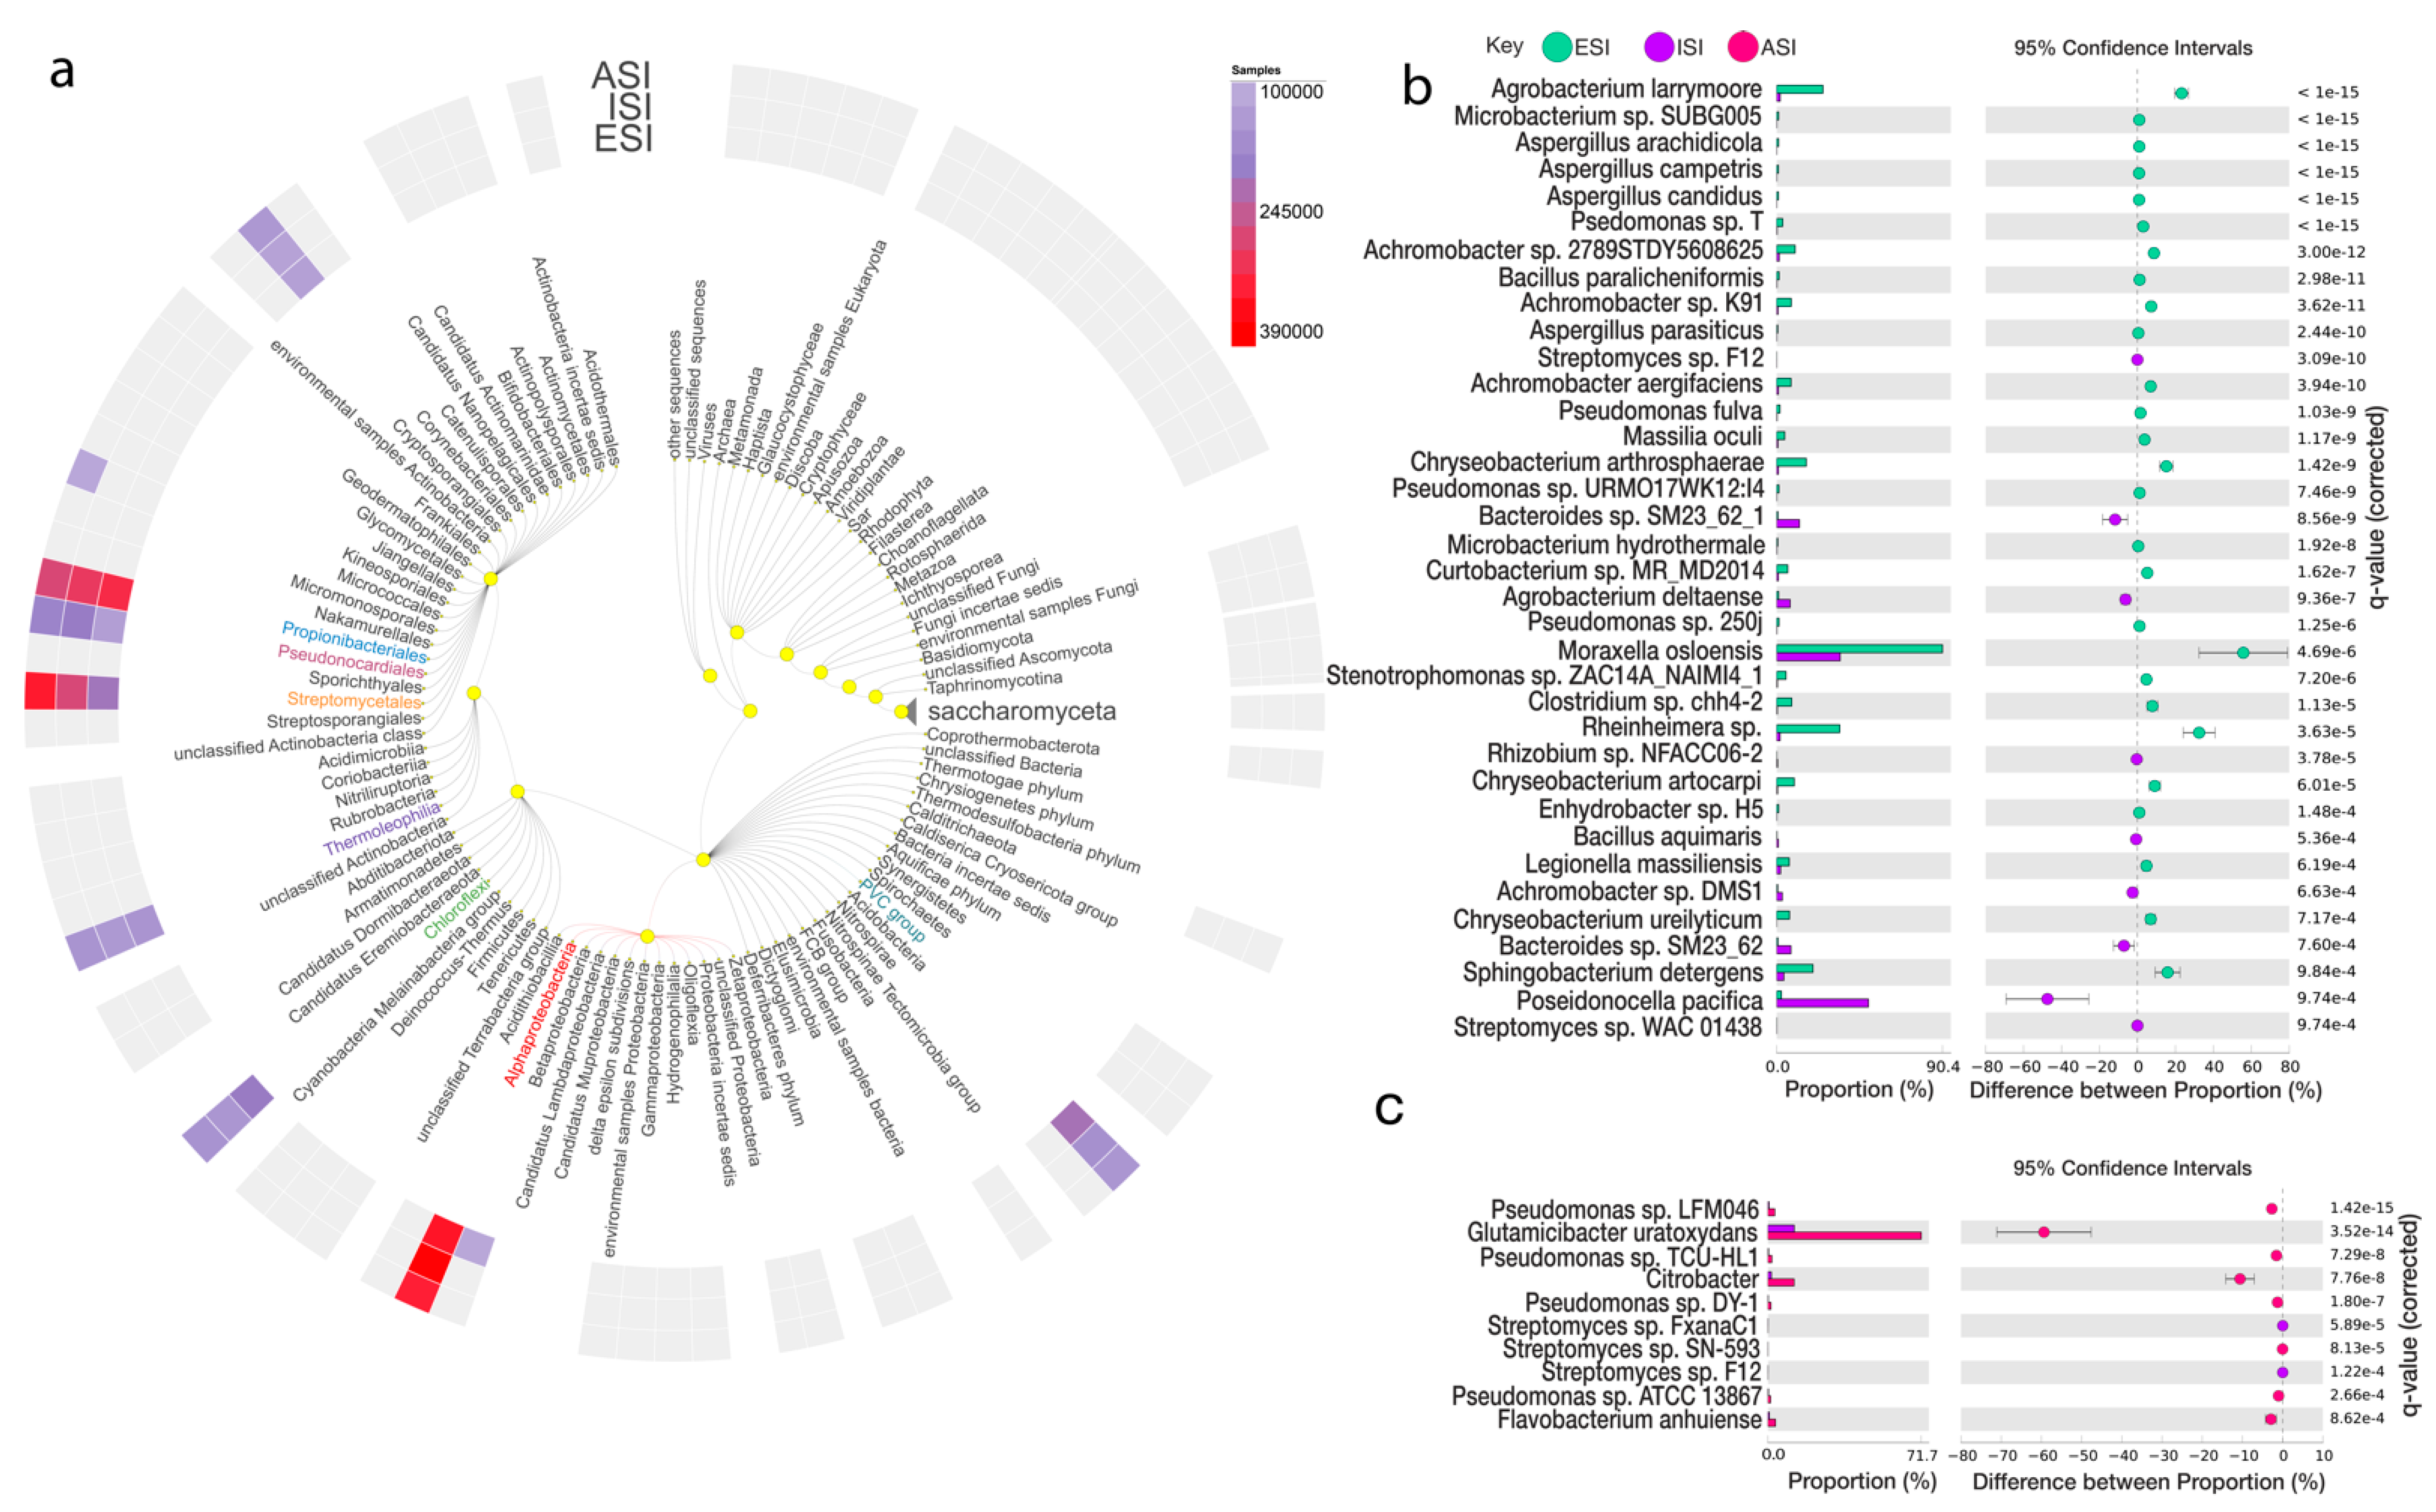
3.5. Microbial Abundance Analysis

Table 3 shows an overview of the taxonomic hits distribution in all three samples of ESI, ISI, and ASI. The ESI sample showed early symptoms of wilt disease. Employing the MG-Rast server, authors obtained maximum reads that mapped to Bacteria—2,076,360 (96.54%), followed by Eukaryota—63,248 (2.94%), Archaea—8979 (0.42%), unclassified sequences 1311 (0.06%), and Viruses 935 (0.04%) at the kingdom level. Actinobacteria 1,026,641 (57.52%), Proteobacteria 450,739 (25.25%), Planctomycetes 55,347 (3.10%), Ascomycota 52,339 (2.93%), Chloroflexi 37,935 (2.13%), Bacteroidetes 33,727 (1.89%), Firmicutes 29,671 (1.66%), Verrucomicrobia 21,659 (1.21%), Acidobacteria 20,072 (1.12%), Cyanobacteria 11,919 (0.67%), unclassified (derived from Bacteria) 7962 (0.45%), Gemmatimonadetes 7030 (0.39%), Deinococcus-Thermus 4694 (0.26%) and Euryarchaeota 4231 (0.24%) were mapped at the phylum level.
The ISI sample showed further symptoms of wilt disease and maximum reads from this sample also mapped to Bacteria—2,192,380 (96.08%), followed by Eukaryota—79,978 (3.50%), Archaea—7089 (0.31%), unclassified sequences—1496 (0.07%) and Viruses—939 (0.04%) at the kingdom level. At the phylum level the mapped reads revealed Actinobacteria—995,904 (52.92%), Proteobacteria—517,416 (27.49%), Planctomycetes—72,331 (3.84%), Ascomycota—69,904 (3.71%), Chloroflexi—39,681 (2.11%), Bacteroidetes—38,024 (2.02%), Firmicutes—33,232 (1.77%), Verrucomicrobia—28,599 (1.52%), Acidobacteria—25,715 (1.37%), Cyanobacteria—13,685 (0.73%), Gemmatimonadetes—9358 (0.50%), unclassified (derived from Bacteria)—9248 (0.49%), Deinococcus-Thermus—4978 (0.26%), and Euryarchaeota—4290 (0.23%). The all major symptoms of wilt disease were seen in ASI sample. Our analysis revealed that the most reads were mapped to Bacteria 2,348,985 (97.61%), followed by Eukaryota 43,462 (1.81%), Archaea 10,928 (0.45%), unclassified sequences 2003 (0.08%) and Viruses 1001 (0.04%) at the kingdom level. Furthermore, at the phylum level, Actinobacteria 955,903 (49.62%), Proteobacteria 562,154 (29.18%), Planctomycetes 102,778 (5.34%), Chloroflexi 54,360 (2.82%), Firmicutes 37,538 (1.95%), Bacteroidetes 36,944 (1.92%), Ascomycota 34,814 (1.81%), Acidobacteria 33,599 (1.74%), Verrucomicrobia 33,042 (1.72%), Cyanobacteria 18,085 (0.94%), unclassified (derived from Bacteria) 11,289 (0.59%), Gemmatimonadetes 8945 (0.46%), Deinococcus-Thermus 6399 (0.33%), and Euryarchaeota 5509 (0.29%) were identified. The alpha diversity for ESI was 351, ISI was 367 and ASI was 401 species.
Comparative statistical analysis of the samples ESI and ISI revealed 35,554 features in all after filtering out unclassified reads, of which 29,747 mapped to Bacteria, 4582 to Eukaryota, 1214 to Archaea, 1 to none. From the total number of features, 79 were found to be significant with corrected q-value =< 0.05 (Figure 3b). Considering which of the microbes were more abundant in the ESI sample, the top differentially abundant microbes belonged to Proteobacteria phyla Achromobacter sp. 2789STDY5608625 with a count of 299 in ESI and 8 in ISI samples. Achromobacter sp. K91 from the phyla Proteobacteria followed by the Achromobacter sp. 2789STDY5608625 with 236 (ESI) and 4 (ISI). Achromobacter aegrifaciens followed the two Proteobacteria phyla members with 23. The parent sequence count 2975 (ESI) and 588 (ISI). Microbacterium sp. SUBG005 from phyla Actinobacteria and Agrobacterium larrymoorei from the Proteobacteria phyla were the subsequently most abundant bacteria (Table 4). Furthermore, comparing the ISI and ASI samples, Streptomyces sp. FxanaC1, Streptomyces sp. F12 and Rhizobium sp. NFACC06-2 was estimated as being the top three differentially abundant species. Amongst the Eukaryota, the Aspergillus arachidicola was found to be differentially abundant, followed by Aspergillus candidus and Aspergillus campestris all from the phyla Ascomycota. With the ISI and ASI comparison, Aspergillus nomius and Aspergillus ochraceoroseus were found to be species that were prevalent in the ISI sample and significantly lower in the ASI sample (Table 4 and Table S6).
The Figure 3 depicts an overview of the kingdoms and corresponding microbes. The heatmap in the outer circle represents the prevalence among the three experimental samples as per the scale provided (a). The top-ranked microbes at the phylum level are depicted along with a comparison between ESI (blue) and ISI (purple) (b) and, ISI and ASI (pink) (c) depict the top-ranked microbes and the proportions and difference between the proportions with 95% confidence intervals along with the q-value (corrected) (q value < 0.001).

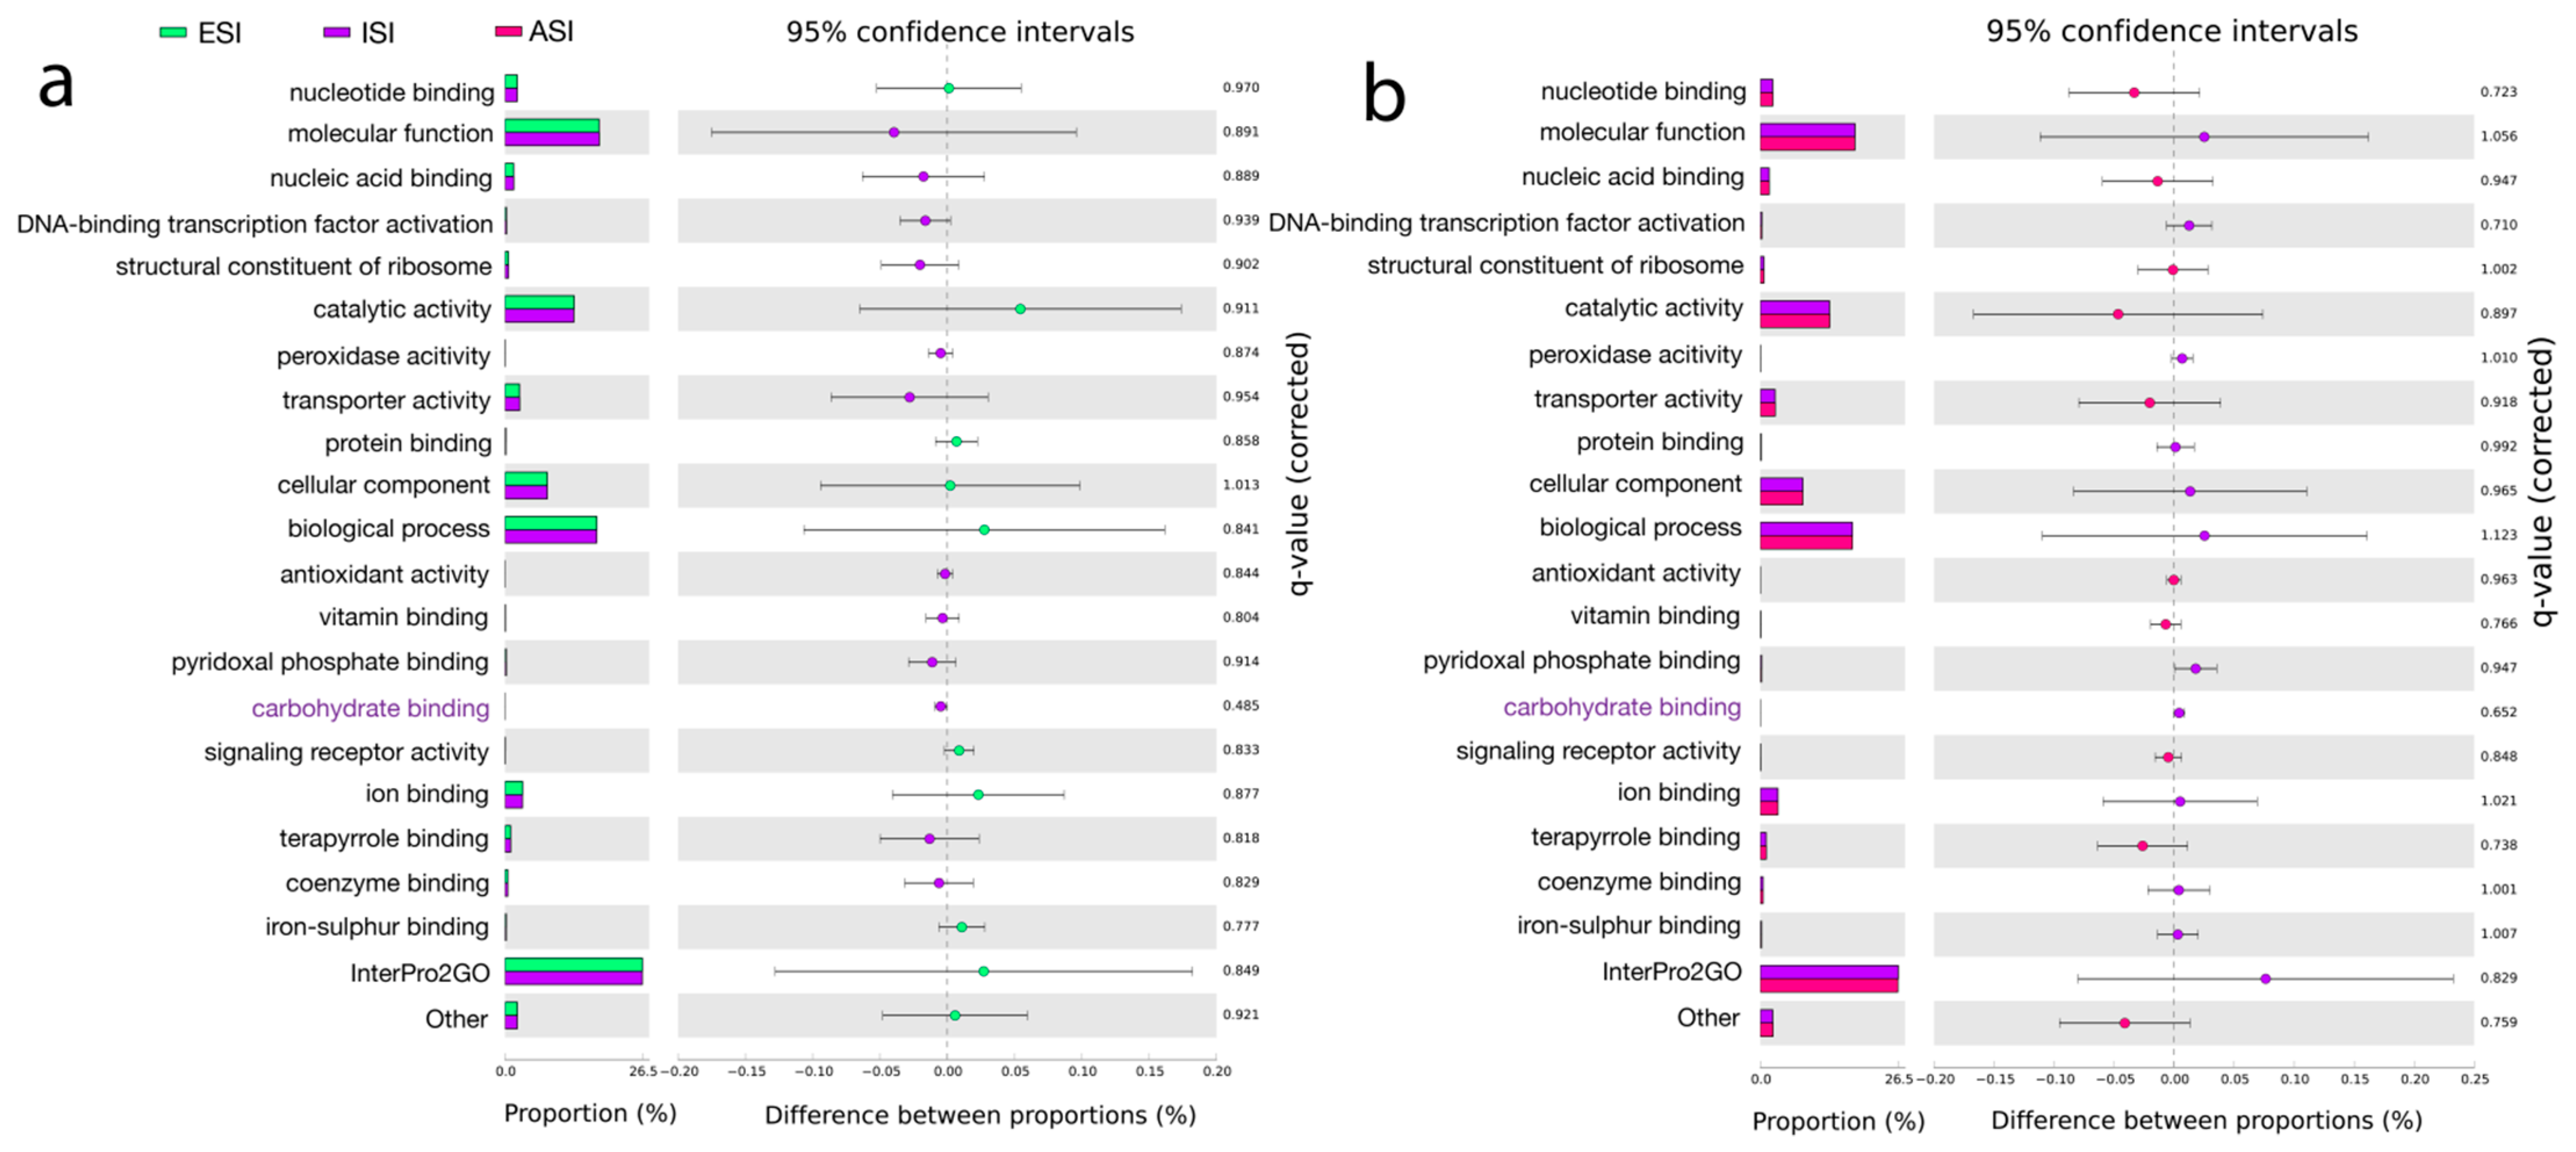
3.6. Pathway Predictions

The output files from MEGAN were used to search the InterPro2GO, a resource of protein information [60], under the Molecular functions category. The top hits included catalytic activity—oxidoreductase activity, transferase activity, and hydrolase activity. The other major functions were transporter activity, ion binding, and nucleotide binding. Under biological process, the top hits were mapped to Metabolic processes, transport, DNA, and RNA metabolic processes. Under cellular component, the intrinsic component of membrane and membrane functions were highlighted (Figure 4). eggNOC, a database for functional annotations, orthology, and gene evolution [61] revealed the major pathways related to metabolism, information storage, and processing, cellular processing, and signaling. The major pathways in metabolism included amino acid metabolism and transport, energy production and conversion, and carbohydrate metabolism and transport, inorganic ion and transport, lipid transport and metabolism, secondary metabolites biosynthesis, transport and catabolism, coenzyme transport and metabolism, and nucleotide transport and metabolism. In information storage and processing, the major pathways were transcription, replication, recombination and repair, and translation, ribosomal structure, and biogenesis. Under the cellular processes and signaling category, the pathways were signal transduction and mechanisms, cell wall/membrane/envelope biogenesis, Post-translational modifications, protein turnover, chaperones, and defense mechanisms. SEED functional annotation using SEED [62] highlighted Metabolism and stress response, defense, and virulence. Under metabolism, the predictions showed fatty acids, lipids, and isoprenoids mainly indicating acyl carrier protein (Figure S3). Statistical analysis of the predicted pathways revealed significant hits obtained from the InterPro2GO database. Carbohydrate binding was found to be significant (p < 0.05) between ESI and ISI. Kyoto Encyclopedia of Genes and Genomes (KEGG) [63] hits included K03088; RNA polymerase sigma-70 factor ECF sub-family, K12132; Eukaryotic-like serine/threonine protein kinase and K01990; ABC-2 type transport system ATP-binding protein (Table 5, Tables S7 and S8).

3.7. Genome Resolved Metagenomics

Following confirmation with microbiological methods, normalized read counts obtained for F. oxysporum in the ESI were found to be 209, in ISI it was 120 and 94 in ASI. Using the SqueezMeta pipeline, a total of 13, 8, and 5 genome bins were recovered from samples ISI, ASI, and ESI respectively. Based on CheckM analysis, 4, 4, 2 bins from samples ISI, ASI, and ESI were found to be at least 50% complete and with less than 15%. Significantly enriched terms (Mann–Whitney U test; p value < 0.05) of these bins against KO, PFAM, and other databases are shown in Table 5 and complete enrichment results are provided as Supplementary Figures S4–S6; Tables S7 and S8.

3.8. Variant Analysis

F. oxysporum genome in the sample ESI was analyzed to screening for variants using the GCF_000149955.1 as reference (Tables S9 and S10). The variant analysis showed 81 SNPs out of which multiple mutations were observed in the 3-Isopropylmalate dehydratase (IPMD) predicted as high impact effects, which is required for fungal pathogenicity [66]. IPMD is encoded by LEU2 and involved in the leucine biosynthetic pathway.
Variant Analysis of A. niger genome from the ISI sample with reference (GCF_000002855.3) showed three genes mutated with high impact names histidine kinase J7, MFS transporter, and NADH-ubiquinone oxidoreductase subunit. While two of the genes, histidine kinase and the MFS transporter gene, showed multiple mutations with high impact variations namely frameshift mutations, NADH-ubiquinone oxidoreductase subunit gene showed one variation leading to a frameshift mutation.
ANI_1_1000064|histidine kinase J7 showed an insertion at position 1764099 of A/ACGAGT. The other high-impact variant was a deletion at 1764101 GTCCTT/G. Predictions revealed three high-impact variants in the ANI_1_2008144|MFS transporter gene. The first one was an insertion at 1799089 position A/ACGCGCTTC, the second one was again an insertion at position 1799092 G/GTGCGT and the third one was an insertion at position 1799094 C/CG. In the ANI_1_742164|NADH-ubiquinone oxidoreductase subunit a large insertion was found at the position 1286777 T/TCGAGAACTCGAAGTTCGGACCCTCGACGATGGCATCGACC.

4. Discussion

Pomegranate has been used for a wide range of health benefits making it a commercially important crop. India is the leading producer of pomegranate with Maharashtra, Karnataka, Odisha, Tamil Nadu, Gujarat, Rajasthan, Chattisgarh, Telangana, and Nagaland states contributing to India’s major producer of the fruit crop. Karnataka, which is the second-largest contributor of fruit produce to India, faces a number of challenges in crop management due to wilt, anthracnose, bacterial blight, and heart rot. In the present study, we explored the soil samples from an Orchard in the Chikkaballapur district of Karnataka. Wilt infection in the orchard resulted in a 36% yield loss to the farmer. A shotgun metagenomics approach was employed and the microbial communities in soil samples were screened.
Comparative analysis of the samples ESI and ISI revealed 35,554 features in all after filtering out unclassified reads, of which the majority of the features mapped to Bacteria (29, 747), followed by Eukaryota (4582) and Archaea (1214). In our analysis, we reported 79 features to be significant (corrected q-value =< 0.05). The top differentially abundant microbes prevalent in the ESI sample to Proteobacteria phyla Achromobacter sp. 2789STDY5608625, ESI (299), and ISI (8) samples. Achromobacter sp. 2789STDY5608625 was followed member of the sample phyla, Achromobacter sp. K91, ESI (236), and ISI (4). Achromobacter aegrifaciens followed the two Proteobacteria phyla members with 23. Microbacterium sp. SUBG005 from phyla Actinobacteria and Agrobacterium larrymoorei from the Proteobacteria phyla were the subsequently most abundant bacteria. There have been reports of members of the genus Achromobacter employed as biocontrol agents against Fusarium oxysporum causing wilt in other plants [67,68]. The role of the microbes from this genus could be explored for their biocontrol potential against F. oxysporum. Furthermore, comparing the ISI and ASI samples, Streptomyces sp. FxanaC1, Streptomyces sp. F12 and Rhizobium sp. NFACC06-2 was estimated as being the top three differentially abundant species. Amongst the Eukaryota, the Aspergillus arachidicola was found to be differentially abundant, followed by Aspergillus candidus and Aspergillus campestris all from the phyla Ascomycota. With the ISI and ASI comparison, Aspergillus nomius and Aspergillus ochraceoroseus were found to be species that were prevalent in the ISI sample and significantly lower in the ASI sample.
We particularly screened F. oxysporum as a causative pathogen for Wilt disease in pomegranate after assessing the physical symptoms of the plant. The presence of F. oxysporum was confirmed both with microbial isolation and metagenomics validation. The presence of early symptoms of Wilt was reported in the ESI sample in our study. Furthermore, the fruits showed early symptoms of rot disease. The sample was screened for A. niger the causative pathogen for rot disease. The plant with more noticeable symptoms of the disease in our study was the ISI sample. In the rhizospheric samples of the ISI sample, we reported an abundance of A. niger with a decrease in F. oxysporum. A decline in Fusarium species with an increase in Aspergillus species was observed in the plants from ESI and ISI samples respectively. Variant analysis of F. oxysporum showed multiple high-impact mutations on the IPMD gene. IPMD has been reported in other studies for its role in fungal pathogenesis. IPMD is encoded by LEU2 and involved in the catalysis of leucine biosynthesis particularly in the conversion of 3-isopropylmalate (3-IPPM) to 2-ketoisocaproate (2-KIC). Intriguingly, another important finding from this study is with respect to the carbohydrate binding pathway which is one of the significant hits. Phytopathogens are known to synthesize carbohydrate-active enzymes (CAZymes) also known as plant cell wall degrading enzymes (PCWDE) [69], which can also function as Carbohydrate binding modules (CBM). CAZymes are required for pathogenesis as well as growth [70,71]. It may be reasonable to assume that targeting IPMD and CAZymes could be a good strategy for the development of antifungals which could aid in biocontrol of F. oxysporum.
The present study took advantage of the current state-of-the-art sequencing platform, the Illumina Novaseq 6000 platform that provides higher resolution in screening and identification microbial communities. The approach aided in the identification of certain key targets that are linked to the pathogenicity of Fusarium. However, further research is being carried out to particularly validate the key findings of this study. In this study, we demonstrate the capabilities of the whole metagenome sequencing approach in identifying potential key players of wilt disease affecting the pomegranate plant, wherein the symptomatology is complex.

Supplementary Materials

The following are available online at www.mdpi.com/2077-0472/11/9/831/s1, Figure S1: DNA Extraction, Figure S2: Rarefaction curves from experimental data sets ESI, ISI and ASI, Figure S3: Pathway predictions, Figure S4: KEGG Annotations, Figure S5: COG Annotations, Figure S6: PFAM Annotations. Table S1: Isolation of Fusarium oxysporum, Table S2: Isolation of Aspergillus niger, Table S3: DNA Sequencing Information, Table S4: Data Quality Summary (R2-ESI, NP-ISI and NC-ASI), Table S5: Physicochemical and Microbial Analysis of the soil samples, Table S6: Relative Abundance of Microbial species, Table S7: Pathway predictions, Table S8: PFAM Abundance Overview, Table S9: Variant Analysis, Table S10: Number variants by type.

Author Contributions

The idea and Funding, S.K.M.; Writing, original draft preparation, experimental work, A.J.D.; review, R.R.; analytics support, B.S.R.; supervision, N.R. and S.K.M.; funding acquisition, M.K.P. review, T.U.; wet laboratory methods support, H.E.; This work is a part of the Ph.D. work of A.J.D. All authors have read and agreed to the published version of the manuscript.

Funding

This research received no external funding.

Institutional Review Board Statement

Not applicable.

Informed Consent Statement

Not applicable.

Data Availability Statement

The sequence information is available publically for this project at https://www.ncbi.nlm.nih.gov/bioproject/?term=PRJNA701747/, accessed on 10 January 2020 (Bioproject number PRJNA701747).

Acknowledgments

We thank the DST-FIST program level O under Govt of India and BISEP program under Govt of Karnataka at Maharani Lakshmi Ammanni College for Women for extending their generous support for this study. This manuscript was funded by University of Agricultural Sciences, Bangalore.

Conflicts of Interest

The authors declare no conflict of interest.

References

  1. Teksur, P.K. Alternative technologies to control postharvest diseases of pomegranate. Stewart Postharvest Rev. 2015, 11, 1–7. [Google Scholar] [CrossRef]
  2. Middha, S.K.; Usha, T.; Pande, V. A Review on Antihyperglycemic and Antihepatoprotective Activity of eco-friendly Punica granatum peel waste. Evid. Based Complement. Alt Med. 2013, 2013, 1–10. [Google Scholar] [CrossRef] [PubMed] [Green Version]
  3. da Silva, J.A.T.; Rana, T.S.; Narzary, D.; Verma, N.; Meshram, D.T.; Ranade, S.A. Scientia Horticulturae Pomegranate biology and biotechnology: A review. Sci. Hortic. 2013, 160, 85–107. [Google Scholar] [CrossRef]
  4. Chen, J.; Liao, C.; Ouyang, X.; Kahramanoğlu, I.; Gan, Y.; Li, M. Antimicrobial Activity of Pomegranate Peel and Its Applications on Food Preservation. J. Food Qual. 2020, 2020, 1–8. [Google Scholar] [CrossRef]
  5. Alexandre, E.; Silva, S.; Santos, S.; Silvestre, A.J.; Duarte, M.F.; Saraiva, J.A.; Pintado, M. Antimicrobial activity of pomegranate peel extracts performed by high pressure and enzymatic assisted extraction. Food Res. Int. 2018, 115, 167–176. [Google Scholar] [CrossRef] [Green Version]
  6. Usha, T.; Middha, S.K.; Sidhalinghamurthy, K.R. Pomegranate peel and its anticancer activity: A mechanism-based review. In Plant-derived Bioactives: Chemistry and Mode of Action; Springer: Berlin/Heidelberg, Germany, 2020; ISBN 9789811523618. [Google Scholar]
  7. Sharma, P.; McClees, S.F.; Afaq, F. Pomegranate for Prevention and Treatment of Cancer: An Update. Molecules 2017, 22, 177. [Google Scholar] [CrossRef] [PubMed] [Green Version]
  8. Caruso, A.; Barbarossa, A.; Tassone, A.; Ceramella, J.; Carocci, A.; Catalano, A.; Basile, G.; Fazio, A.; Iacopetta, D.; Franchini, C.; et al. Pomegranate: Nutraceutical with Promising Benefits on Human Health. Appl. Sci. 2020, 10, 6915. [Google Scholar] [CrossRef]
  9. Elshafie, H.; Caputo, L.; de Martino, L.; Sakr, S.; de Feo, V.; Camele, I. Study of Bio-Pharmaceutical and Antimicrobial Properties of Pomegranate (Punica granatum L.) Leathery Exocarp Extract. Plants 2021, 10, 153. [Google Scholar] [CrossRef]
  10. Aslam, M.N.; Lansky, E.P.; Varani, J. Pomegranate as a cosmeceutical source: Pomegranate fractions promote proliferation and procollagen synthesis and inhibit matrix metalloproteinase-1 production in human skin cells. J. Ethnopharmacol. 2006, 103, 311–318. [Google Scholar] [CrossRef]
  11. Al-Zoreky, N. Antimicrobial activity of pomegranate (Punica granatum L.) fruit peels. Int. J. Food Microbiol. 2009, 134, 244–248. [Google Scholar] [CrossRef]
  12. Usha, T.; Goyal, A.K.; Lubna, S.; Prashanth, H.P.; Mohan, T.M.; Pande, V.; Middha, S.K. Identification of anti-cancer targets of eco-friendly waste Punica granatum peel by dual reverse virtual screening and binding analysis. Asian Pac. J. Cancer Prev. 2015, 15, 10345–10350. [Google Scholar] [CrossRef] [PubMed] [Green Version]
  13. Salgado, J.; Ferreira, T.R.B.; Biazotto, F.D.O.; Dias, C. Increased Antioxidant Content in Juice Enriched with Dried Extract of Pomegranate (Punica granatum) Peel. Plant Foods Hum. Nutr. 2012, 67, 39–43. [Google Scholar] [CrossRef] [PubMed]
  14. Henning, S.M.; Yang, J.; Lee, R.-P.; Huang, J.; Hsu, M.; Thames, G.; Gilbuena, I.; Long, J.; Xu, Y.; Park, E.H.; et al. Pomegranate Juice and Extract Consumption Increases the Resistance to UVB-induced Erythema and Changes the Skin Microbiome in Healthy Women: A Randomized Controlled Trial. Sci. Rep. 2019, 9, 14528. [Google Scholar] [CrossRef] [PubMed]
  15. Bellé, C.; Moccellin, R.; Souza-Júnior, I.T.; Maich, S.L.P.; Neves, C.G.; Nascimento, M.B.; Barros, D.R. First Report of Colletotrichum acutatum Causing Flower Anthracnose on Pomegranate (Punica granatum) in Southern Brazil. Plant Dis. 2018, 102, 2373. [Google Scholar] [CrossRef]
  16. Kanetis, L.; Testempasis, S.; Goulas, V.; Samuel, S.; Myresiotis, C.; Karaoglanidis, G.S. Identification and mycotoxigenic capacity of fungi associated with pre- and postharvest fruit rots of pomegranates in Greece and Cyprus. Int. J. Food Microbiol. 2015, 208, 84–92. [Google Scholar] [CrossRef] [PubMed]
  17. Cintora-Martínez, E.A.; Leyva-Mir, S.G.; Ayala-Escobar, V.; Quezada, G.D.A.; Camacho-Tapia, M.; Tovar-Pedraza, J.M. Pomegranate fruit rot caused by Pilidiella granati in Mexico. Australas. Plant Dis. Notes 2017, 12, 4. [Google Scholar] [CrossRef]
  18. Palou, L.; Crisosto, C.H.; Garner, D. Combination of postharvest antifungal chemical treatments and controlled atmosphere storage to control gray mold and improve storability of ‘Wonderful’ pomegranates. Postharvest Biol. Technol. 2007, 43, 133–142. [Google Scholar] [CrossRef]
  19. Thomidis, T. Pathogenicity and characterization of Pilidiella granati causing pomegranate diseases in Greece. Eur. J. Plant Pathol. 2014, 141, 45–50. [Google Scholar] [CrossRef]
  20. Mondal, K.K.; Mani, C. ERIC-PCR-Generated Genomic Fingerprints and Their Relationship with Pathogenic Variability of Xanthomonas campestris pv. punicae, the Incitant of Bacterial Blight of Pomegranate. Curr. Microbiol. 2009, 59, 616–620. [Google Scholar] [CrossRef]
  21. Grote, D.; Olmos, A.; Kofoet, A.; Tuset, J.; Bertolini, E.; Cambra, M. Specific and Sensitive Detection of Phytophthora nicotianae By Simple and Nested-PCR. Eur. J. Plant Pathol. 2002, 108, 197–207. [Google Scholar] [CrossRef]
  22. Yang, X.; Hameed, U.; Zhang, A.-F.; Zang, H.-Y.; Gu, C.-Y.; Chen, Y.; Xu, Y.-L. Development of a nested-PCR assay for the rapid detection of Pilidiella granati in pomegranate fruit. Sci. Rep. 2017, 7, 40954. [Google Scholar] [CrossRef] [Green Version]
  23. She, X.; Yu, L.; Lan, G.; Tang, Y.; He, Z. Identification and Genetic Characterization of Ralstonia solanacearum Species Complex Isolates from Cucurbita maxima in China. Front. Plant Sci. 2017, 8, 1794. [Google Scholar] [CrossRef] [Green Version]
  24. Suhaimi, N.S.M.; Goh, S.-Y.; Ajam, N.; Othman, R.Y.; Chan, K.-G.; Thong, K.L. Diversity of microbiota associated with symptomatic and non-symptomatic bacterial wilt-diseased banana plants determined using 16S rRNA metagenome sequencing. World J. Microbiol. Biotechnol. 2017, 33, 168. [Google Scholar] [CrossRef] [PubMed]
  25. Ts, A.; Sg, B. Bacterial root bark necrosis and wilt of pomegranate, hereto a new disease. J. Appl. Biotechnol. Bioeng. 2018, 5, 329–332. [Google Scholar] [CrossRef]
  26. Shen, Z.; Penton, C.R.; Lv, N.; Xue, C.; Yuan, X.; Ruan, Y.; Li, R.; Shen, Q. Banana Fusarium Wilt Disease Incidence Is Influenced by Shifts of Soil Microbial Communities Under Different Monoculture Spans. Microb. Ecol. 2017, 75, 739–750. [Google Scholar] [CrossRef]
  27. Tian, X.; Zhang, Q.; Chen, G.; Mao, Z.; Yang, J.; Xie, B. Diversity of bacteria associated with pine wood nematode revealed by metagenome. Acta Microbiol. Sin. 2010, 50, 909–916. [Google Scholar]
  28. Reddy, T.; Thomas, A.D.; Stamatis, D.; Bertsch, J.; Isbandi, M.; Jansson, J.; Mallajosyula, J.; Pagani, I.; Lobos, E.A.; Kyrpides, N.C. The Genomes OnLine Database (GOLD) v.5: A metadata management system based on a four level (meta)genome project classification. Nucleic Acids Res. 2014, 43, D1099–D1106. [Google Scholar] [CrossRef] [PubMed] [Green Version]
  29. Pruitt, K.D.; Tatusova, T.; Brown, G.R.; Maglott, D.R. NCBI Reference Sequences (RefSeq): Current status, new features and genome annotation policy. Nucleic Acids Res. 2011, 40, D130–D135. [Google Scholar] [CrossRef] [PubMed] [Green Version]
  30. Yarza, P.; Yilmaz, P.; Pruesse, E.; Glöckner, F.O.; Ludwig, W.; Schleifer, K.-H.; Whitman, W.; Euzéby, J.; Amann, R.; Rossello-Mora, R. Uniting the classification of cultured and uncultured bacteria and archaea using 16S rRNA gene sequences. Nat. Rev. Genet. 2014, 12, 635–645. [Google Scholar] [CrossRef]
  31. Singer, E.; Bushnell, B.; Coleman-Derr, D.; Bowman, B.; Bowers, R.M.; Levy, A.; Gies, E.A.; Cheng, J.-F.; Copeland, A.; Klenk, H.-P.; et al. High-resolution phylogenetic microbial community profiling. ISME J. 2016, 10, 2020–2032. [Google Scholar] [CrossRef]
  32. Santos, S.S.; Nielsen, T.; Hansen, L.H.; Winding, A. Comparison of three DNA extraction methods for recovery of soil protist DNA. J. Microbiol. Methods 2015, 115, 13–19. [Google Scholar] [CrossRef] [PubMed]
  33. Medinger, R.; Nolte, V.; Pandey, R.V.; Jost, S.; Ottenwälder, B.; Schlötterer, C.; Boenigk, J. Diversity in a hidden world: Potential and limitation of next-generation sequencing for surveys of molecular diversity of eukaryotic microorganisms. Mol. Ecol. 2010, 19, 32–40. [Google Scholar] [CrossRef] [PubMed] [Green Version]
  34. Gong, J.; Dong, J.; Liu, X.; Massana, R. Extremely High Copy Numbers and Polymorphisms of the rDNA Operon Estimated from Single Cell Analysis of Oligotrich and Peritrich Ciliates. Protist 2013, 164, 369–379. [Google Scholar] [CrossRef] [PubMed]
  35. Kunin, V.; Engelbrektson, A.; Ochman, H.; Hugenholtz, P. Wrinkles in the rare biosphere: Pyrosequencing errors can lead to artificial inflation of diversity estimates. Environ. Microbiol. 2010, 12, 118–123. [Google Scholar] [CrossRef] [Green Version]
  36. Lee, C.; Herbold, C.; Polson, S.; Wommack, K.E.; Williamson, S.J.; McDonald, I.; Cary, S. Groundtruthing Next-Gen Sequencing for Microbial Ecology–Biases and Errors in Community Structure Estimates from PCR Amplicon Pyrosequencing. PLoS ONE 2012, 7, e44224. [Google Scholar] [CrossRef] [Green Version]
  37. Pawlowski, J.W.; Christen, R.; Lecroq, B.; Bachar, D.; Shahbazkia, H.R.; Amaral-Zettler, L.; Guillou, L. Eukaryotic Richness in the Abyss: Insights from Pyrotag Sequencing. PLoS ONE 2011, 6, e18169. [Google Scholar] [CrossRef]
  38. Abraham, B.S.; Caglayan, D.; Carrillo, N.V.; Chapman, M.C.; Hagan, C.T.; Hansen, S.T.; Jeanty, R.O.; Klimczak, A.A.; Klingler, M.J.; Kutcher, T.P.; et al. Shotgun metagenomic analysis of microbial communities from the Loxahatchee nature preserve in the Florida Everglades. Environ. Microbiome 2020, 15, 1–10. [Google Scholar] [CrossRef] [PubMed] [Green Version]
  39. Babalola, O.O.; Fadiji, A.E.; Ayangbenro, A.S. Shotgun metagenomic data of root endophytic microbiome of maize (Zea mays L.). Data Brief 2020, 31, 105893. [Google Scholar] [CrossRef]
  40. Das, A.J.; Ravinath, R.; Shilpa, B.R.; Rohith, B.S.; Goyal, A.K.; Ramesh, N.; Ekambaram, H.; Prasannakumar, M.K.; Usha, T.; Middha, S.K. Microbiomics and cloud-based analytics advance sustainable soil management. Front. Biosci. 2021, 26, 478–495. [Google Scholar] [CrossRef] [PubMed]
  41. Weston, W.H. Soil and Plant Analysis. A Laboratory Manual of Methods for the Examination of Soils and the Determination of the Inorganic Constituents of Plants. C. S. Piper. Q. Rev. Biol. 1945, 20, 272–273. [Google Scholar] [CrossRef]
  42. Bureau of Indian Standards Microbiology. General Guidance for the Enumeration of Micro-organisms Colony Count Technique at 30 °C; Bureau of Indian Standards Microbiology: New Delhi, Indian, 2002. [Google Scholar]
  43. Bureau of Indian Standards Microbiology. Method for Yeast and Mould Count of Foodstuffs and Animal Feeds; Bureau of Indian Standards Microbiology: New Delhi, Indian, 1999. [Google Scholar]
  44. Amorim, J.H.; Macena, T.; Lacerda-Junior, G.; Rezende, R.; Dias, J.; Brendel, M.; Cascardo, J. An improved extraction protocol for metagenomic DNA from a soil of the Brazilian Atlantic Rainforest. Genet. Mol. Res. 2008, 7, 1226–1232. [Google Scholar] [CrossRef]
  45. Nurk, S.; Meleshko, D.; Korobeynikov, A.; Pevzner, P.A. MetaSPAdes: A new versatile metagenomic assembler. Genome Res. 2017, 27, 824–834. [Google Scholar] [CrossRef] [Green Version]
  46. Wood, D.E.; Lu, J.; Langmead, B. Improved metagenomic analysis with Kraken 2. Genome Biol. 2019, 20, 1–13. [Google Scholar] [CrossRef] [Green Version]
  47. Zhu, W.; Lomsadze, A.; Borodovsky, M. Ab initio gene identification in metagenomic sequences. Nucleic Acids Res. 2010, 38, e132. [Google Scholar] [CrossRef] [Green Version]
  48. Huson, D.H.; Beier, S.; Flade, I.; Górska, A.; El-Hadidi, M.; Mitra, S.; Ruscheweyh, H.-J.; Tappu, R. MEGAN Community Edition—Interactive Exploration and Analysis of Large-Scale Microbiome Sequencing Data. PLoS Comput. Biol. 2016, 12, e1004957. [Google Scholar] [CrossRef] [PubMed] [Green Version]
  49. Laslett, D. ARAGORN, a program to detect tRNA genes and tmRNA genes in nucleotide sequences. Nucleic Acids Res. 2004, 32, 11–16. [Google Scholar] [CrossRef] [PubMed]
  50. Eddy, S.R.; Wheeler, T. HMMER-biosequence analysis using profile hidden Markov models. Howard Hughes Medical Institute 2015. [Google Scholar]
  51. Wu, Y.-W.; Simmons, B.; Singer, S.W. MaxBin 2.0: An automated binning algorithm to recover genomes from multiple metagenomic datasets. Bioinformatics 2015, 32, 605–607. [Google Scholar] [CrossRef] [PubMed]
  52. Kang, D.D.; Li, F.; Kirton, E.; Thomas, A.; Egan, R.; An, H.; Wang, Z. MetaBAT 2: An adaptive binning algorithm for robust and efficient genome reconstruction from metagenome assemblies. PeerJ 2019, 7, e7359. [Google Scholar] [CrossRef]
  53. Sieber, C.; Probst, A.; Sharrar, A.; Thomas, B.C.; Hess, M.; Tringe, S.G.; Banfield, J.F. Recovery of genomes from metagenomes via a dereplication, aggregation and scoring strategy. Nat. Microbiol. 2018, 3, 836–843. [Google Scholar] [CrossRef] [PubMed] [Green Version]
  54. Li, H.; Durbin, R. Fast and accurate short read alignment with Burrows-Wheeler transform. Bioinformatics 2009, 25, 1754–1760. [Google Scholar] [CrossRef] [Green Version]
  55. Li, H.; Handsaker, R.; Wysoker, A.; Fennell, T.; Ruan, J.; Homer, N.; Marth, G.; Abecasis, G.; Durbin, R. The Sequence Alignment/Map format and SAMtools. Bioinformatics 2009, 25, 2078–2079. [Google Scholar] [CrossRef] [Green Version]
  56. McKenna, A.; Hanna, M.; Banks, E.; Sivachenko, A.; Cibulskis, K.; Kernytsky, A.; Garimella, K.; Altshuler, D.; Gabriel, S.B.; Daly, M.J.; et al. The Genome Analysis Toolkit: A MapReduce framework for analyzing next-generation DNA sequencing data. Genome Res. 2010, 20, 1297–1303. [Google Scholar] [CrossRef] [Green Version]
  57. Cingolani, P.; Platts, A.; Wang, L.L.; Coon, M.; Nguyen, T.; Wang, L.; Land, S.J.; Lu, X.; Ruden, D.M. A program for annotating and predicting the effects of single nucleotide polymorphisms, SnpEff. Fly 2012, 6, 80–92. [Google Scholar] [CrossRef] [Green Version]
  58. Parks, D.H.; Tyson, G.; Hugenholtz, P.; Beiko, R.G. STAMP: Statistical analysis of taxonomic and functional profiles. Bioinformatics 2014, 30, 3123–3124. [Google Scholar] [CrossRef] [Green Version]
  59. Parks, D.H.; Beiko, R.G. Identifying biologically relevant differences between metagenomic communities. Bioinformatics 2010, 26, 715–721. [Google Scholar] [CrossRef] [PubMed] [Green Version]
  60. Camon, E.B.; Barrell, D.G.; Dimmer, E.C.; Lee, V.; Magrane, M.; Maslen, J.; Binns, D.; Apweiler, R. An evaluation of GO annotation retrieval for BioCreAtIvE and GOA. BMC Bioinform. 2005, 6, 1–11. [Google Scholar] [CrossRef] [Green Version]
  61. Huerta-Cepas, J.; Szklarczyk, D.; Heller, D.; Hernández-Plaza, A.; Forslund, S.K.; Cook, H.V.; Mende, D.R.; Letunic, I.; Rattei, T.; Jensen, L.J.; et al. eggNOG 5.0: A hierarchical, functionally and phylogenetically annotated orthology resource based on 5090 organisms and 2502 viruses. Nucleic Acids Res. 2018, 47, D309–D314. [Google Scholar] [CrossRef] [PubMed] [Green Version]
  62. Overbeek, R.A.; Olson, R.; Pusch, G.D.; Olsen, G.J.; Davis, J.J.; Disz, T.; Edwards, R.; Gerdes, S.; Parrello, B.D.; Shukla, M.; et al. The SEED and the Rapid Annotation of microbial genomes using Subsystems Technology (RAST). Nucleic Acids Res. 2013, 42, D206–D214. [Google Scholar] [CrossRef] [PubMed]
  63. Ogata, H.; Goto, S.; Sato, K.; Fujibuchi, W.; Bono, H.; Kanehisa, M. KEGG: Kyoto Encyclopedia of Genes and Genomes. Nucleic Acids Res. 1999, 27, 29–34. [Google Scholar] [CrossRef] [PubMed] [Green Version]
  64. Tatusov, R.L.; Natale, D.A.; Garkavtsev, I.V.; Tatusova, T.A.; Shankavaram, U.T.; Rao, B.S.; Kiryutin, B.; Galperin, M.Y.; Fedorova, N.D.; Koonin, E.V. The COG database. Nucleic Acids Res. 2000, 28, 33–36. [Google Scholar] [CrossRef] [Green Version]
  65. Finn, R.D.; Bateman, A.; Clements, J.; Coggill, P.; Eberhardt, R.Y.; Eddy, S.R.; Heger, A.; Hetherington, K.; Holm, L.; Mistry, J.; et al. Pfam: The protein families database. Nucleic Acids Res. 2013, 42, D222–D230. [Google Scholar] [CrossRef] [Green Version]
  66. Que, Y.; Yue, X.; Yang, N.; Xu, Z.; Tang, S.; Wang, C.; Lv, W.; Xu, L.; Talbot, N.J.; Wang, Z. Leucine biosynthesis is required for infection-related morphogenesis and pathogenicity in the rice blast fungus Magnaporthe oryzae. Curr. Genet. 2019, 66, 155–171. [Google Scholar] [CrossRef]
  67. Sun, R.-L.; Jing, Y.-L.; de Boer, W.; Guo, R.-J.; Li, S.-D. Dominant hyphae-associated bacteria of Fusarium oxysporum f. sp. cucumerinum in different cropping systems and insight into their functions. Appl. Soil Ecol. 2021, 165, 103977. [Google Scholar] [CrossRef]
  68. Vijay, K.; Devi, T.S.; Sree, K.K.; Elgorban, A.; Kumar, P.; Govarthanan, M.; Kavitha, T. In vitro screening and in silico prediction of antifungal metabolites from rhizobacterium Achromobacter kerstersii JKP9. Arch. Microbiol. 2020, 202, 1–10. [Google Scholar] [CrossRef] [PubMed]
  69. Blackman, L.M.; Cullerne, D.P.; Hardham, A.R. Bioinformatic characterisation of genes encoding cell wall degrading enzymes in the Phytophthora parasitica genome. BMC Genom. 2014, 15, 785. [Google Scholar] [CrossRef] [PubMed] [Green Version]
  70. Gibson, D.M.; King, B.; Hayes, M.L.; Bergstrom, G. Plant pathogens as a source of diverse enzymes for lignocellulose digestion. Curr. Opin. Microbiol. 2011, 14, 264–270. [Google Scholar] [CrossRef] [PubMed]
  71. Jorge, I.; Navas-Cortes, J.; Jimenezdiaz, R.M.J.M.; Tena, M. Cell wall degrading enzymes in fusarium wilt of chickpea: Correlation between pectinase and xylanase activities and disease development in plants infected with two pathogenic races of Fusarium oxysporum f. sp. ciceris. Can. J. Bot. 2006, 84, 1395–1404. [Google Scholar] [CrossRef]
Figure 1. Overview of the experimental workflow from sample collection to identifying key players in microbial adaptation. The figure depicts the wet laboratory and dry laboratory methods employed in the present study.
Agriculture 11 00831 g001
Figure 2. Physical symptoms of the plants, figures depict the physical symptoms of the infected plants—ESI; Early-stage infection, ISI; Intermediate stage infection, and ASI; Advanced stage infection (ad). Other wilt-associated symptoms such as yellowing of leaves and root knots observed (e), rotting of fruit (g), complete defoliation (f), brown decay, and sporulation (h) observed are depicted.
Agriculture 11 00831 g002
Figure 3. Microbial diversity and abundance. (a) The top-ranked microbes at the phylum level are depicted along with a comparison between ESI (blue) and ISI (purple); (b) and, ISI and ASI (pink); (c) depict the top-ranked microbes and the proportions and difference between the proportions with 95% confidence intervals along with the q-value (corrected) (q value < 0.001).
Agriculture 11 00831 g003
Figure 4. Pathway hits from InterPro2GO, databases. The top-ranked pathways are represented as per the color scheme—three samples ESI (blue), ISI (purple), and ASI (pink) (a). The top-ranked pathways are represented (a). A comparison between ESI (blue) and ISI (purple) (b) and, Significant hits represented show the top-ranked pathways along with the proportions and difference between the proportions with 95% confidence intervals considering a q-value (corrected) (p < 0.05).
Agriculture 11 00831 g004
Table 1. Physicochemical Characteristics and total microbial count of the soil samples.
SamplepHECNPKOCClFeCuMnZnBMicrobial Count/g
(μs/cm)%ppmBacterial
(cfu)
Fungal
(cfu)
ESI7.731350.200.00840.0110.92150.9826.99.524.83.41968154
ISI6.351390.1910.0100.0110.93180.9329.49.130.94.12240170
ASI6.631800.200.0110.0140.97210.9831.49.633.24.32126154
EC—Electrical conductivity.
Table 2. Sequence Information.
SampleRaw ReadsRaw Data (Gb)Sequence CountBioProjectBioSampleSRA
ESI4486932113.55,924,482PRJNA701747SAMN17910186SRR13705840
ISI4477333613.45,165,924SAMN17910187SRR13705839
ASI4406375213.25,379,446SAMN17910188SRR13705838
Table 3. Taxonomic hits distribution.
Taxonomic Hits Distribution
Domain Level Microbial Abundance
ESI
Percent of Reads
ISI
Percent of Reads
ASI
Percent of Reads
Bacteria2,076,360 (96.54%)2,192,380 (96.08%)2,348,985 (97.61%)
Eukaryota63,248 (2.94%)79,978 (3.50%)43,462 (1.81%)
Archaea8979 (0.42%)7089 (0.31%)10,928 (0.45%)
Unclassified sequences1311 (0.06%)1496 (0.07%)2003 (0.08%)
Viruses935 (0.04%)939 (0.04%)1001 (0.04%)
Phylum level Microbial Abundance
Actinobacteria1,026,641 (57.52%)995,904 (52.92%)955,903 (49.62%)
Proteobacteria450,739 (25.25%)517,416 (27.49%)562,154 (29.18%)
Plantomycetes55,347 (3.10%)72,331 (3.84%)102,778 (5.34%)
Ascomycota52,339 (2.93%)69,904 (3.71%)34,814 (1.81%)
Chloroflexi37,935 (2.13%)39,681 (2.11%)54,360 (2.82%)
Bacteroidetes33,727 (1.89%)38,024 (2.02%)36,944 (1.92%)
Firmicutes29,671 (1.66%),33,232 (1.77%)37,538 (1.95%)
Verrucomicrobia21,659 (1.21%)28,599 (1.52%)33,042 (1.72%)
Acidobacteria20,072 (1.12%)25,715 (1.37%)33,599 (1.74%)
Cyanobacteria11,919 (0.67%)13,685 (0.73%)18,085 (0.94%)
Unclassified (from Bacteria)7962 (0.45%)9248 (0.49%)11,289 (0.59%)
Gemmatimonadetes7030 (0.39%),9358 (0.50%)8945 (0.46%)
Deinococcus-Thermus4694 (0.26%)4978 (0.26%)6399 (0.33%)
Euryarchaeota4231 (0.24%).4290 (0.23%)5509 (0.29%)
Table 4. Relative Abundance of Microbial species.
Species Parent Sequence CountRelative Frequency %p-ValuesEffect Size
ESIISIESIISIESIISIPValcorrected
Achromobacter sp. 2789STDY56086252998297558810.051.365.90 × 10−163.00 × 10−128.69
Achromobacter sp. K91236429755887.930.689.17 × 10−153.62 × 10−117.25
Achromobacter aegrifaciens233529755887.830.851.33 × 10−133.94 × 10−106.98
Microbacterium sp. SUBG005196619,46313,7191.010.041.22 × 10−372.17 × 10−330.96
Agrobacterium larrymoorei1741469174125.181.896.24 × 10−442.22 × 10−3923.29
Curtobacterium sp. MR_MD2014153625346956.040.868.66 × 10−111.62 × 10−75.17
Pseudomonas sp. T1407431833743.240.212.75 × 10−271.63 × 10−233.03
Moraxella osloensis13291462690.4134.622.90 × 10−94.69 × 10−655.80
Table 5. Pathway predictions. The top hits from the most popular databases have been furnished in the table below.
Pathway Predictions
InterPro2GO [60]KEGG [63]SEED [62]COG [64]Pfam [65]eggNOC [61]
GO: 0030246; Carbohydrate binding.
GO: 0046906; Tetrapyrrole binding.
GO: 0030170; Pyridoxal phosphate binding.
K03088; RNA polymerase sigma-70 factor ECF sub-family.
K12132; Eukaryotic-like serine/threonine Protein kinase.
K01990; ABC-2 type transport system ATP-binding protein.
Acyl carrier protein.
Stress response, defense virulence.
ENOG410XNMH; Histidine kinase.
COG1012; NAD-dependent aldehyde dehydrogenases.
COG1960; Acyl-CoA Dehydrogenases.
COG0515; Serine/threonine Protein kinase.
PF00005; ABC transporter.
PF07690; Major Facilitator superfamily.
PF00528; Binding protein-dependent Transport system Inner membrane component.
ISP *: Transcription. Replication, recombination, and repair.
CSP +: Cell wall/Membrane/Envelope biogenesis, signal transduction mechanisms.
Metabolism: Amino acid transport and metabolism, carbohydrate transport and metabolism, energy production and conversion.
* Information storage and processing; +Cellular processes and signaling.
Publisher’s Note: MDPI stays neutral with regard to jurisdictional claims in published maps and institutional affiliations.

