Article

The Nexus between Rural Household Livelihoods and Agricultural Functions: Evidence from China

1
School of Geographical Sciences of Northeast Normal University, Changchun 130000, China
2
Key Laboratory of Geographical Processes and Ecological Security in Changbai Mountains, Ministry of Education, Northeast Normal University, Changchun 130000, China
3
Institute for Northeast China Research, Northeast Normal University, Changchun 130000, China
*
Author to whom correspondence should be addressed.
Agriculture 2021, 11(3), 241; https://doi.org/10.3390/agriculture11030241
Submission received: 20 February 2021 / Revised: 9 March 2021 / Accepted: 9 March 2021 / Published: 12 March 2021

Abstract

:
Understanding the relationship between households’ livelihoods and agricultural functions is important for regulating and balancing households’ and macrosocieties’ agricultural functional needs and formulating better agricultural policies and rural revitalization strategies. This paper uses peasant household survey data obtained from the China Family Panel Studies (CFPS) and statistical analysis methods, to analyze the differences in livelihood assets and agricultural functions of households with different livelihood strategies and the relationship between livelihood assets and agricultural functions. Households are categorized based on their livelihood strategies as full-time farming households, part-time farming I households, part-time farming II households, and non-farming households. The agricultural product supply and negative effects of the ecological service function of full-time farming households are higher than those of part-time farming and non-farming households. Part-time farming I households have the strongest social security function, while non-farming households have the weakest social security function. Non-farming households have the strongest leisure and cultural function, while part-time farming I households have the weakest leisure and cultural function. Households’ demand for agricultural functions is affected by livelihood assets. Effective measures should be taken to address contradictions in the agricultural functional demands of households and macrosocieties.

Graphical Abstract

1. Introduction

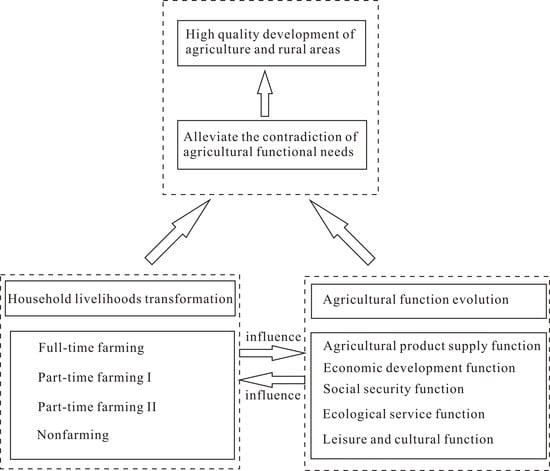
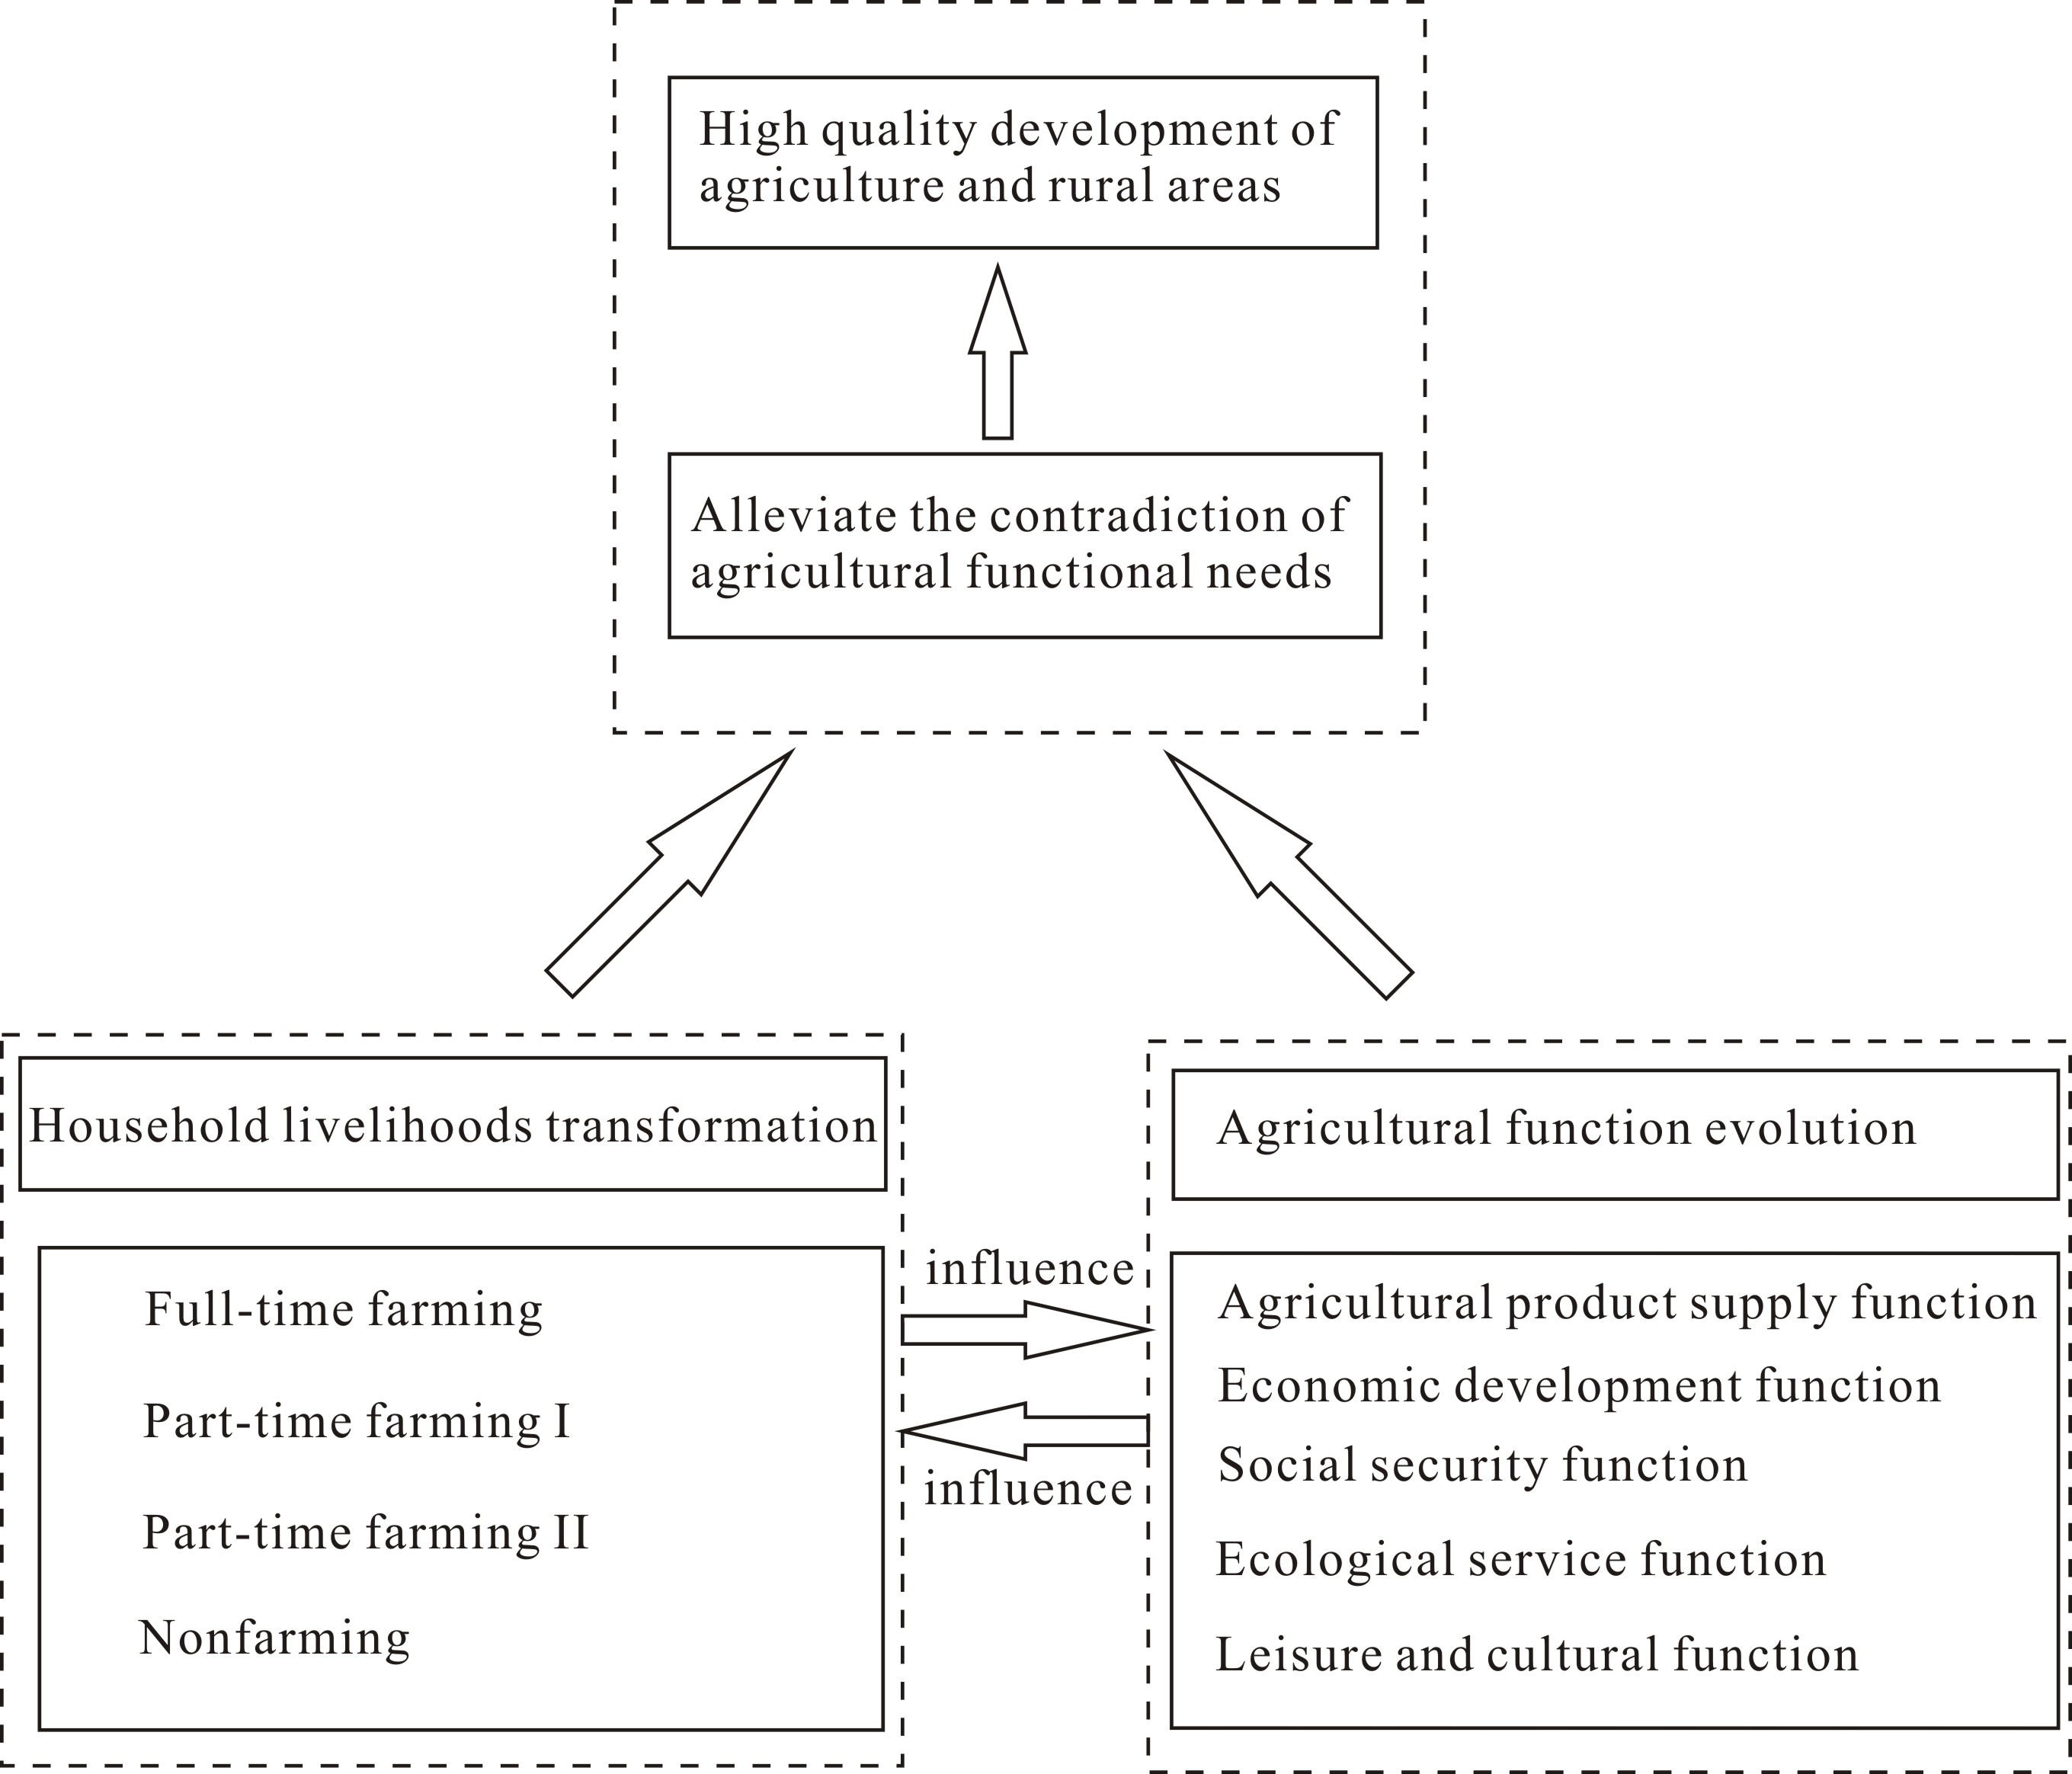
Households are microagents engaged in agricultural economic activities. Due to China’s unique farmland system and its stage of economic and social development, there is a contradiction between households’ demands for agricultural functions and macrosocieties’ demands for agricultural functions. The country needs to stabilize and enhance its agricultural product supply, but households may be more willing to engage in non-agricultural industries [1] and either abandon land or use land less often [2,3]. The country needs to control the use of chemical fertilizers and pesticides, to improve the quality of agricultural products and protect the ecological environment, but smallholders prefer to use more chemical fertilizers and pesticides, to ensure stable and high yields [4]. The state hopes to improve the level of food security through moderate-scale management, but most smallholders are unwilling to transfer their land rights for long periods of time. Neither the contradiction between the agricultural functional needs of households and macrosocieties nor the interactive laws between the transformation of household livelihoods and the evolution of agricultural functions have received adequate attention [4,5]. To fill this gap, therefore, we construct a theoretical analysis framework of household livelihood-agricultural functions and reveal changes in agricultural functions that occur due to livelihood changes, which is of great significance for the formulation of better agricultural policies and rural revitalization strategies.
Under the impacts of global climate change [6,7,8], natural disasters, agricultural pollution, economic and trade frictions, public health events, rapid urbanization, and other issues, smallholder farming is facing major challenges [
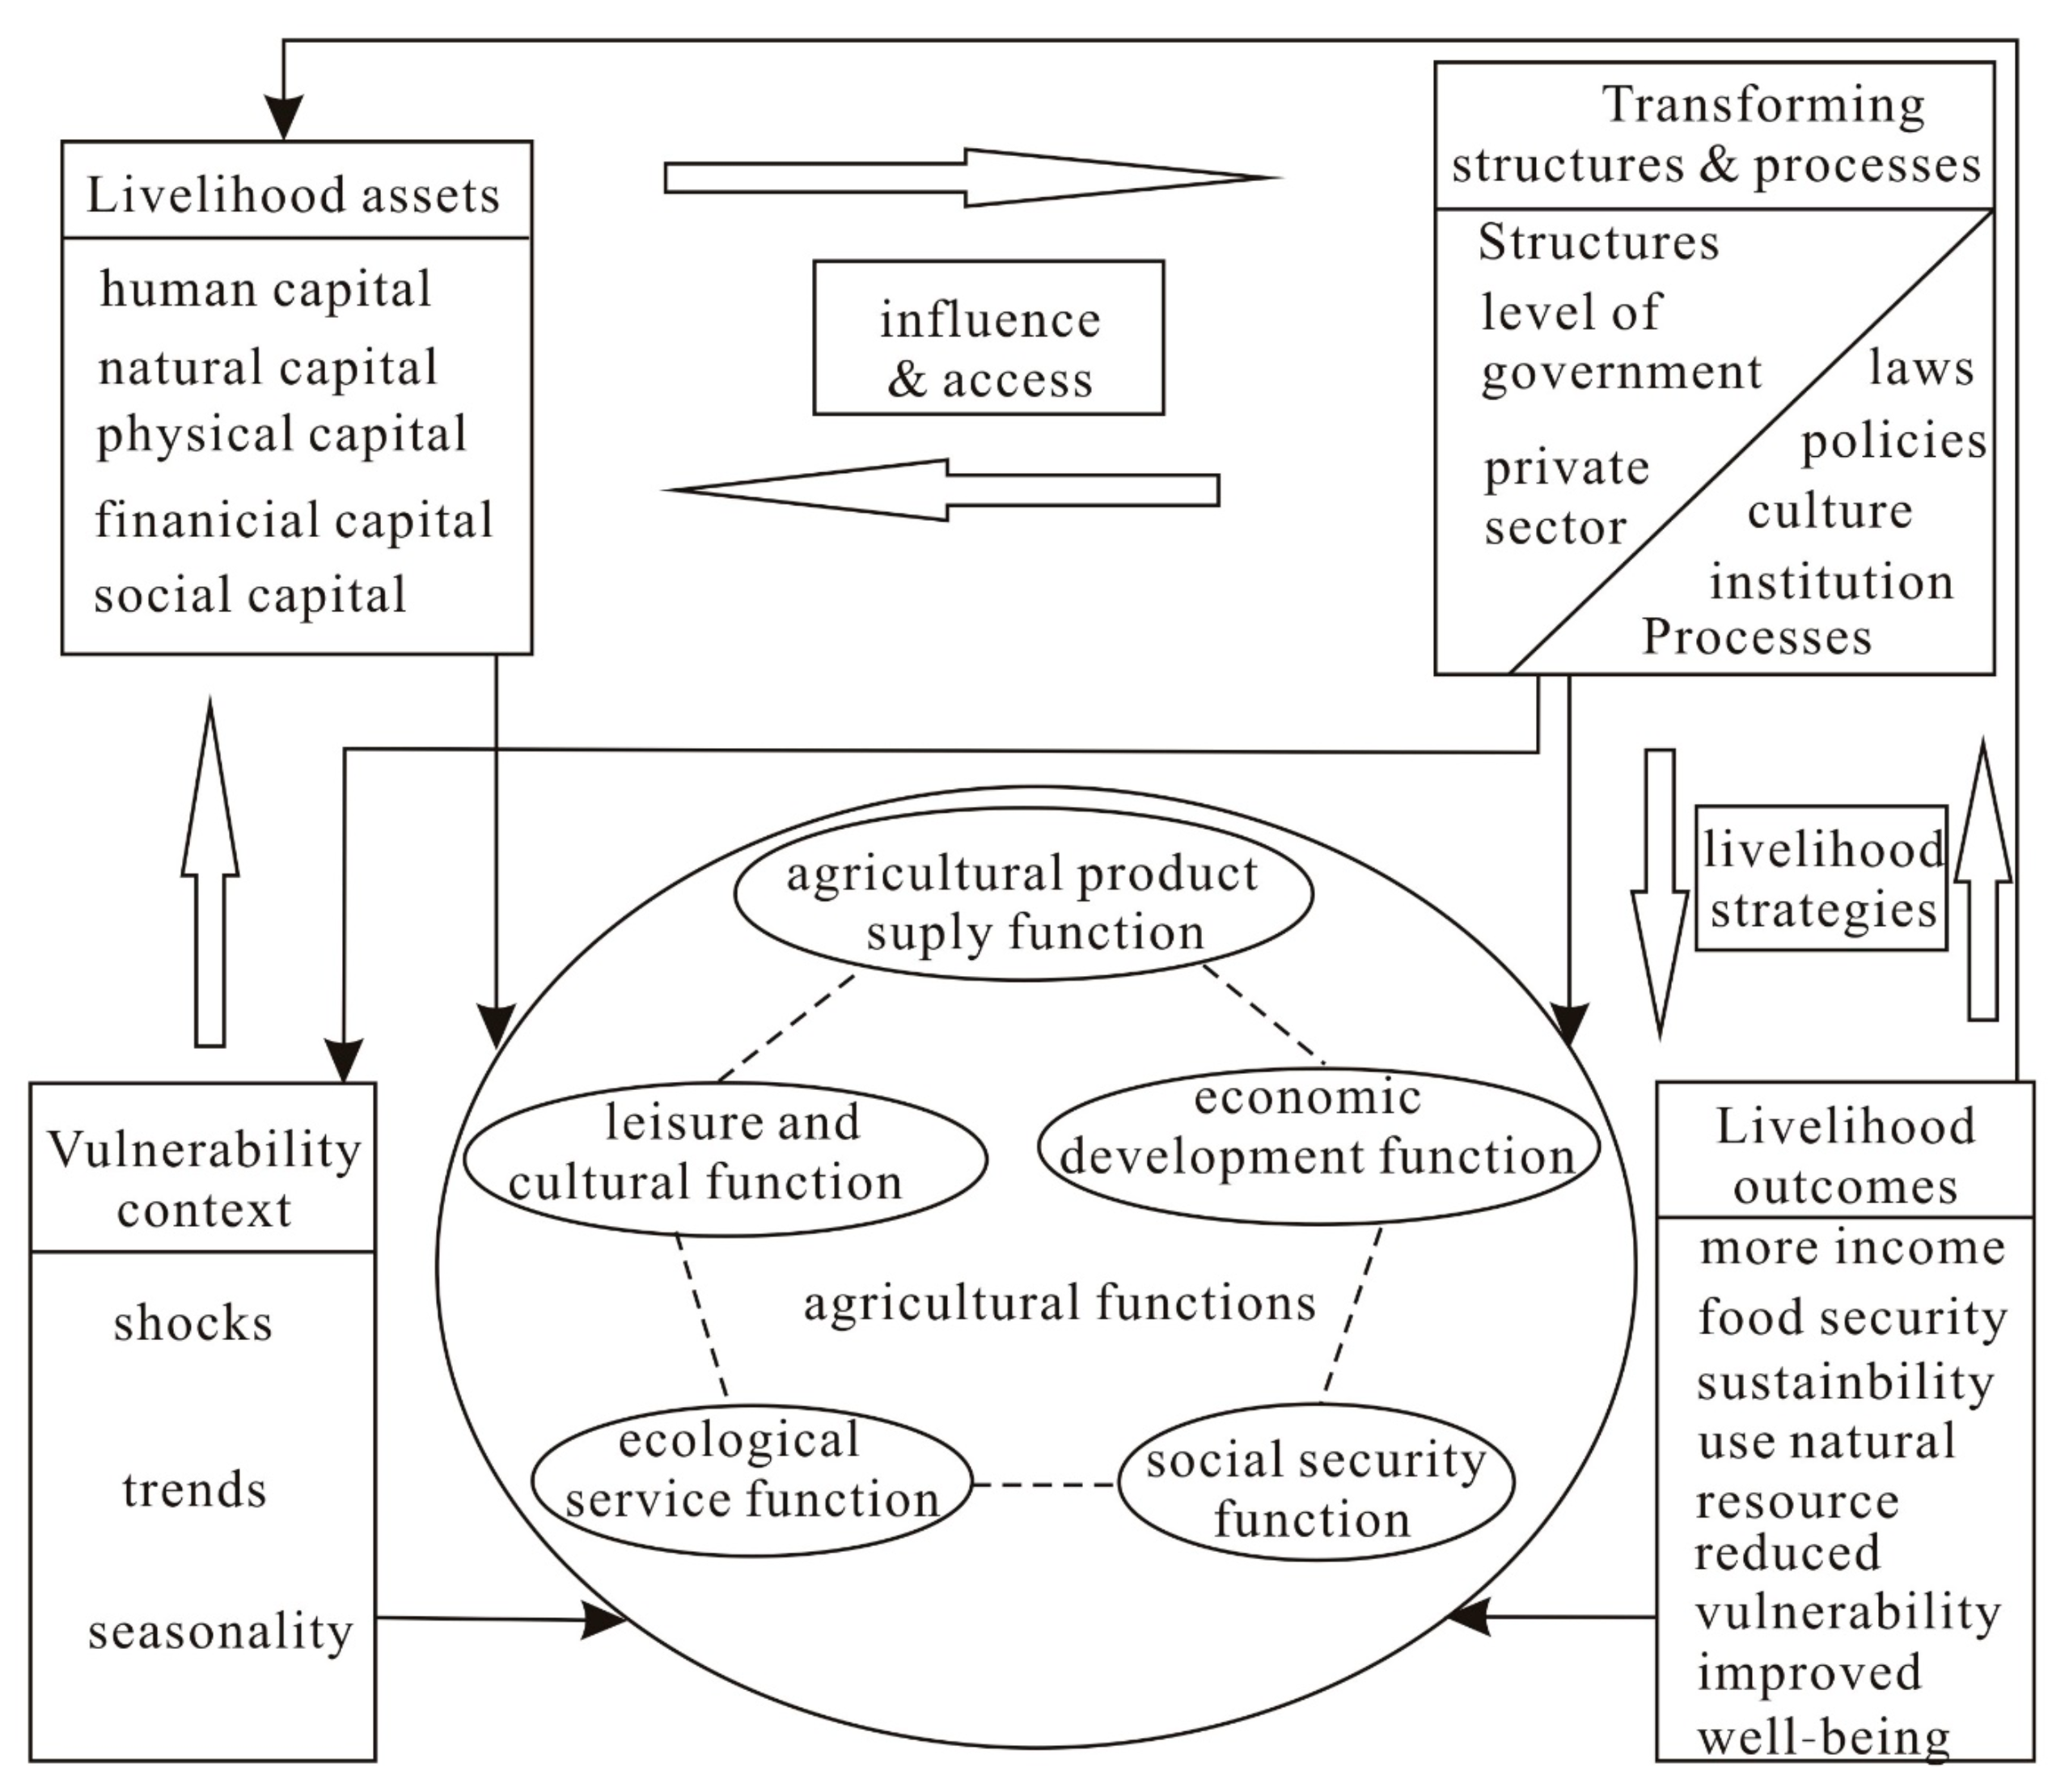
9]. Household livelihoods are ways of making a living based on their assets, capacity, and economic activities, which affect the development and trend of the regional human–earth relationship. Under the influence of the external environment, the combination and use of households’ human capital, natural capital, physical capital, financial capital, and social capital affect the choice of livelihood strategies and, ultimately, the output of livelihood outcomes [10,11]. Livelihood research has covered many fields, with a strong focus on livelihood vulnerability [12,13], livelihood resilience [14,15,16], livelihood sustainability [17], livelihood diversification [18,19], livelihood security [20,21], livelihood capital and livelihood strategy analysis [22,23,24,25,26], household livelihood and the environment [27,28], and livelihood transitions [29,30,31]. Forest restoration, climate anomalies, and transport infrastructure and investment can influence household livelihoods. Afforestation can reduce poverty, increase the social and ecological resilience of local smallholders, and promote local social equity [32]. Both drought and high temperatures reduce agricultural productivity and reduce opportunities for diversification [33]. Establishing linkages to markets alone is not sufficient to improve households’ livelihoods [34]. Large-scale investment in agriculture can improve the health status of households and alleviate food and water-security problems but may exacerbate local inequalities [35].
The livelihoods of China’s rural residents have shifted from traditional agriculture to part-time farming and non-agricultural activities, and their sources of income have shifted from farming income alone to employment in the service industry, with non-farming income becoming a major source of income for farmers. The transformation of rural livelihoods in China is affected by two challenges: food security and environmental sustainability [36]. Differences in households’ livelihood endowments and livelihood strategies impact the effectiveness of agricultural conservation policies, such as ecological compensation [37]. Households improve their livelihood security and living standards by engaging in various activities [5], and there is a clear trend toward livelihood diversification. Eliminating restrictions on diversification and expanding opportunities for diversification are conducive to realizing the goal of livelihood diversification [38,39,40]. Increasing the diversification of agricultural production and improving market access for smallholders can promote dietary diversification and reduce hunger, malnutrition, and poverty among households [41].
In the context of globalization, industrialization and urbanization, the rural population is decreasing, the instability and vulnerability of rural development are increasing, and the decline of the countryside is obvious. Promoting rural development and revitalization is the basis for narrowing the urban–rural gap and addressing rural decline [42]. The development of rural tourism, special breeding, and other special economy according to local conditions is an important initiative to promote rural development. Marnasidis et al. identified optimal areas for beekeeping development with the help of GIS analysis software. Local and regional authorities should take measures to optimize land use and sound pollination, in order to promote beekeeping on a local scale [43]. Roman et al. analyzed the tourism competitiveness of rural regions in Poland. The quality of natural beauty is an indispensable factor of tourism competitiveness, and the increase of rural tourism competitiveness is closely related to the development of agritourism [44].
Agriculture is the basis for the survival and development of households and is an important foundation for obtaining sources of food, raising the economic level of their families, and improving their quality of life. In addition to food production and fiber provision, agriculture also has economic, social, ecological, recreational, and cultural functions, and its multifunctionality should be viewed objectively [45,46,47]. Research on the multifunctionality of agriculture has involved issues of agricultural functional transitions at the farm level [48]. Wilson analyzed the strength of agricultural multifunctionality and differences in transformation pathways at the farm level [49]. A particular form of agriculture, a particular farm or household, or a particular region may engage in a mix of agricultural activities with various functional intensities. Multifunctional research considering a landscape perspective focuses on the biophysical characteristics and ecological functions of the land [50]. The notion of multifunctional quality can be used to explain and better understand the rural pathways of transformation and may become a normative concept that is ideal for rural development [51]. Gómez-Limón et al. analyzed the effects of demographic factors, such as income, occupation, place of residence, and age, on preferences for rural multifunctionality [52]. Agricultural development in China is facing the challenges of sustainable development, changing consumer demands, and globalization. The multiple functions and values of agriculture are becoming increasingly prominent. From 1978 to 2019, the number of employed persons in China’s primary industry decreased from 283.18 million to 194.45 million, the corresponding share of employment in the primary industry decreased from 70.53% to 25.10%, the share of output value of China’s primary industry decreased from 27.69% to 7.11%, and the total per capita grain and meat production increased from 316.61 kg and 9.80 kg to 474.16 kg and 55.42 kg, respectively. In 2016, there were 207.43 million farming households in China, including 3.98 million large-scale farming households. The number of state-owned farms in 2019 was 1834, with 2.147 million workers and 6480.8 thousand hectares of arable land; thus, the agricultural employment function, economic function, and food-supply function changed significantly. Research on agricultural functions is undergoing a shift from the qualitative description of functions to the quantitative evaluation of spatial patterns and the analysis of influencing factors and mechanisms. Certain studies of agricultural functions evaluate the level of agricultural functions and its influence factors [47,53,54,55,56], while paying insufficient attention to the relationship with households’ livelihood. Within the context of the diversification of households’ livelihoods [57,58,59], the micro-mechanisms and macro-outcomes of agricultural functions are undergoing profound change. Issues of household livelihoods and agricultural functions affect the quality of agricultural and rural development, and the human–earth relationship is increasingly complex. The changes in the economic structure and lifestyles of rural households have been accompanied by shifts in the functional needs of households for agriculture. Clarifying the relationship between households’ livelihoods and agricultural functions is an important grasp to resolve the contradiction of agricultural functional demands and promote sustainable agricultural and rural development.
To reconcile and balance the needs of agricultural functions of households and macrosocieties, and to reveal the interactive laws between the transformation of household livelihoods and the evolution of agricultural functions, this paper focuses on the following questions. First, what are the differences in the livelihood assets of households with different livelihood strategies? Second, what are the differences in the agricultural functions of households with different livelihood strategies? Third, what is the relationship between household livelihood assets and agricultural functions? The rest of the paper is organized as follows: Section 2 analyzes the relationship between agricultural functions and households’ livelihoods, and introduces the data sources of this study and the methods employed to evaluate households’ livelihoods and agricultural functions. Section 3 presents the differences in livelihood assets and agricultural functions among households with different livelihood strategies, and the impact of households’ livelihoods on agricultural functions. A discussion and policy implications are presented in Section 4, followed by conclusions in Section 5.

2. Theoretical Framework and Methodology

2.1. Theoretical Framework of the Analysis

Sustainable livelihoods refer to the combination of livelihood, capital, and activities that households use to cope with and recover from pressure and shocks, and maintain or enhance their livelihood and capital at a specific point in time and in the future. Sustainable livelihoods are based on a people-centered approach to development [60]. The sustainable livelihoods framework (SLF) was introduced by the UK Department for International Development (DFID) in 1999. It describes the main factors affecting farm household livelihoods and the relationships between them and is widely used in research [61,62,63,64]. The SLF consists of five components: the vulnerability context, livelihood assets, transforming structures and processes, livelihood strategies, and livelihood outcomes. The SLF is used to explain the complex interactions between the components, with arrows representing the different types of dynamic relationships between the components. Vulnerable households can use a certain amount of their livelihood assets to capture value through the prevailing social, institutional, and organizational environment. This environment can influence the livelihood strategies of households, which use different combinations of capital to pursue their livelihood objectives and achieve livelihood outcomes. Based on this framework, we constructed a framework for analyzing the interaction mechanism between household livelihoods and agricultural functions (Figure 1).
The context of vulnerability includes external shocks, trends, and seasonality factors, with households facing not only external shocks due to human health, nature, the economy, conflict, crops, and livestock health but also trends in demographics, resources, economics, regulation, technology, seasonal changes in prices, employment opportunities, and the food supply. The latter are contextual factors that lead to changes in agricultural functions. Livelihood assets include human capital, natural capital, physical capital, financial capital, and social capital. Due to structural and process factors, households’ different combinations of livelihood capitals lead to differences in their livelihood strategies, which are further reflected in differences in the agricultural product supply function, economic development function, social security function, ecological service function, and leisure and cultural function. Full-time farming households are primarily engaged in agricultural-production activities; that is, agriculture is their main livelihood, and these households should theoretically have a high agricultural product supply function. Part-time farming households are engaged in both agricultural and non-agricultural activities and are unable to break away from their subsistence dependence on agriculture; these households should theoretically have a high social security function. Non-farming households have higher financial capital and higher aspirations for high-quality rural life, and therefore have a greater demand for agriculture’s ecological services function and leisure and cultural function.

2.2. Data Sources

Data were obtained from the China Family Panel Studies (CFPS) questionnaire conducted by the Chinese Social Science Survey Center of Peking University. Specifically, household economic data and personal data from the national survey conducted in 2018 were used. The CFPS are national and comprehensive social survey projects, and the data are widely used [65,66,67]. Based on the household sample code in 2018, the household economic questionnaires and personal questionnaires were combined in Stata version 15.1 statistical software; the urban household sample was excluded. The samples of telephone interview questionnaires and any surveys with refusals to answer questions, blanks, unknown information, inapplicable information, and respondents less than 16 years of age were excluded from the research. Ultimately 3779 samples were obtained for this study.
The characteristics of the sample are shown in Table 1. Most of the respondents were older than 46 years of age, accounting for 66.84% of the total sample, and there were slightly more women than men. The majority (79.36%) of the respondents were married, and the majority (88.73%) had junior middle school education or below. Approximately 22.68% of the households were unhealthy, and the type of housing was mainly bungalows (68.67%). Only 15.38% of the households rented out their land, and 72.96% of the households were engaged in agriculture, forestry, animal husbandry, and fisheries, with 57.77% working outside the home. Overall, 37.66% of the households had a per capita household net income of less than 1208 USD, and 48.72% had family agricultural and sideline products valued at less than 227 USD.

2.3. Measurements of Rural Household Livelihoods and Agricultural Functions

2.3.1. Indicators Used to Evaluate Household Livelihood Assets

By employing the SLF created by the DFID [60], referring to relevant studies [28,30,68,69] and combining the availability of CFPS microdata, we established a livelihood asset evaluation index, as shown in Table 2. Human capital refers to the knowledge, skills, labor capacity, and health status that influence the livelihood strategies chosen by households, and this study selected three indicators to reflect the human capital of households. The larger the total household size, the better the health status, and the higher the level of education, the richer the human capital of the household. Natural capital is the resource flows and services that households obtain from natural resources that are useful for their livelihoods. Land resources are the most basic element of agricultural production and an important aspect of the natural assets of households. Two indicators were selected to evaluate natural capital. Physical capital includes the infrastructure and productive goods needed to sustain livelihoods. Four indicators were used to measure physical capital. Financial capital refers to the financial sources used to achieve livelihood objectives and was measured by three indicators. Social capital refers to the social resources such as neighbors, relatives, and friends that households rely on when pursuing their livelihood goals. In this study, three indicators were used to measure social capital.

2.3.2. Indicators Used to Evaluate Agricultural Functions

Agricultural functions include the agricultural product supply function, economic development function, social security function, ecological service function, and leisure and cultural function (Table 3) [47,53,54,70,71]. The meaning of agricultural functions at the household level is quite different from the functional meaning of agricultural services at the macrosociety level. The agricultural product supply function refers to the basic function of agriculture. This function is manifested in the provision of agricultural and sideline products, such as grain, cotton, oil crops, vegetables, fruits, meat, fish, eggs, and milk for the daily needs of households. The microlevel economic development function refers to the economic benefits households obtain from their agricultural production activities that increase the economic strength of the family. The social security function of agriculture refers to the employment and subsistence security agriculture provides to households through their occupation and utilization of the land. The ecological service function refers to the positive role of agriculture in maintaining water and soil and providing a clean environment and the negative effect of households’ agricultural production activities on the agricultural ecosystem. The leisure and cultural function refers to the role of agriculture as a platform for households to exercise, have fun, commune with nature, and realize their values. Agriculture becomes a free choice rather than a helpless way to earn a living, and the improvement in the living standards of households increases the potential demand for this function. Proportion of cultural and recreational expenditure and tourism expenditure in total household expenditure reflects the potential of households’ demand for agricultural leisure and cultural functions.

2.4. Data Analysis

In this paper, we selected indicators to evaluate households’ livelihood assets and agricultural functions and standardized original indicators, using the maximum difference normalization method. The agricultural functions evaluation method is shown in Appendix A. We determined the weight of each indicator by employing the entropy weight method. A multiple linear regression model was used to analyze the relationship between household livelihoods and agricultural functions and was calculated as formula (1):
Y i = α i + j = 1 j β j X j + k = 15 k β k X k + ε i ( j = 1 , 2 , , 14 ; k = 15 , 16 , , 20 )
where Y i is the agricultural function i , β j is the regression coefficient for the independent variable, X j is the independent variable, β k is the regression coefficient for the control variable, X k is the control variable, α i is the constant, and ε i is the random error term.

3. Results

3.1. Description of Rural Household Livelihoods

The sample households were divided into four groups based on their livelihood strategies: full-time farming households, part-time farming I households, part-time farming II households, and non-farming households. The strategies were determined based on the share of the total value of agricultural and sideline products in total household net income (Table 4). The households for which the total value of agricultural and sideline products as a proportion of total household net income is greater than 50% are categorized as full-time farming households. The households for which this value is between 10% and 50% are categorized as part-time farming I households. The households for which this value is between 0% and 10% are categorized as part-time farming II households. The households for which this value is 0% are categorized as non-farming households. The number of full-time farming households is the lowest, at 510, or 13.50% of all households, and the number of part-time farming I households is 1008, accounting for 26.67% of all households. The number of part-time farming II households is 737, accounting for 19.50% of all households, and the number of non-farming households is highest at 1524 households, accounting for 40.33%.
There are differences in the livelihood assets of households with different livelihood strategies (Table 5). Part-time farming households have more human capital than non-farming and full-time farming households. The human capital scores are strongly influenced by education level and household size, with higher education levels and larger household sizes, leading to more livelihood options and higher levels of part-time farming. Full-time farming households have more natural capital than part-time farming and non-farming households. Full-time farming households, which are allocated more types of collective land and rarely experience land expropriation, tend to have more natural capital than other households. Non-farming households share collective land, but most of them have transferred their land, so their natural capital score is not zero when calculated. Physical capital is influenced by the presence or absence of a car and the type of house, as shown by the fact that part-time farming and non-farming households have more physical capital than full-time farming households. The higher the physical capital score, the higher the non-agriculturalization level of the household. Financial capital is mainly affected by total household net income; part-time farming and non-farming households have more financial capital than full-time farming households. Due to the increase in part-time farming, financial capital has increased. Social capital is influenced by membership in a social organization and the quality of interpersonal relationships. Full-time farming households have less social capital than part-time farming households and non-farming households.

3.2. Differences in the Agricultural Functions of Households with Different Livelihood Strategies

As shown in Table 6, there are significant differences in the agricultural functions of households with different livelihood strategies. The value of the agricultural product supply function is higher for full-time farming households than for part-time farming and non-farming households. The higher the level of part-time farming is, the weaker the agricultural product supply function. Part-time farming I and full-time farming households have higher scores for the social security function than part-time farming II and non-farming households. Agriculture still has some value in the survival security of part-time farming I and full-time farming households. Non-farming households have the lowest value for the social security function and are more dependent on non-agricultural industries for this function. The ecological service function is negatively affected by the intensity of agricultural development. Full-time farming and part-time farming households invest more in seeds, pesticides, and fertilizers, and the negative effect of the agricultural ecological service function is stronger for these households. The leisure and cultural function scores of part-time farming II and non-farming households are higher than those of full-time farming and part-time farming I households. Part-time farming II and non-farming households have more leisure and recreation time, capital investment, and a stronger demand for leisure and cultural functions. Full-time farming and part-time farming households are more concerned with agricultural production and activities related to maintaining their livelihoods, have less leisure and recreation, and have less demand for leisure and cultural functions.

3.3. The Impact of Rural Household Livelihood Strategies on Agricultural Functions

We examined the relationship between household livelihood assets and agricultural functions through regression analysis of human capital, natural capital, physical capital, financial capital, and social capital with each agricultural function. Household characteristic variables, such as household economic strength, household living standards, household agricultural input level, and household non-agriculturalization level, were selected as control variables. Household economic strength, one of the control variables, was expressed as total income in the past 12 months and wage income. Household living standards were measured as the proportion of total household expenditure devoted to food expenditure. Household agricultural input levels were expressed as machine rental costs and irrigation costs. Household non-agriculturalization levels were expressed by the proportion of total household net income derived from working. All variables passed the variance inflation factor (VIF) test. The regression results are shown in Table 7.

3.3.1. Impact of Household Livelihood Assets on the Agricultural Product Supply Function

In terms of human capital, household size is significantly negatively related to the agricultural product supply function at the 0.01 level of significance. This may be because, the larger the size of the household, the more likely it is to be engaged in non-agricultural industries with higher comparative returns [72], and the weaker the agricultural product supply function. In terms of natural capital, land expropriation is significantly and negatively related to the agricultural product supply function at the 0.01 level of significance. This indicates that land expropriation affects the amount of natural capital households have and is detrimental to the agricultural product supply function. In terms of physical capital, the type of house and the total value of consumer durables are significantly negatively correlated with the agricultural product supply function at the 0.05 and 0.01 levels of significance, respectively. This may be because, the better the type of house and the higher the total value of consumer durables, the high the degree of non-agriculturalization, the less they are engaged in agricultural by-product production activities, and the weaker the agricultural product supply function. In terms of financial capital, total household cash and savings and per capita household net income are significantly negatively and significantly positively correlated with the agricultural product supply function at the 0.01 level of significance, respectively. This may be because households with better overall financial status are mostly engaged in non-agricultural industries, and the agricultural product supply function is insufficient. An increase in the level of per capita household net income can strengthen the demand for agricultural and sideline products, and this, in turn, is conducive to improving the agricultural product supply function. In terms of social capital, expenditure for favors is significantly and positively related to the agricultural product supply function at the 0.05 level of significance. This is because households with more human contacts have deeper roots in the countryside, have more means of production and production information, and have a higher possibility and degree of participation in agricultural production.

3.3.2. Impact of Household Livelihood Assets on the Economic Development Function

In terms of human capital, household size is significantly negatively correlated with the economic development function at the 0.05 significance level. This means that, the larger the household size, the more human capital the household invests in non-agricultural industries [72], and the less prominent the economic development function of agriculture. There are no significant relationships of natural capital and physical capital with the economic development function. For financial capital, net per capita household income is significantly and negatively related to the economic development function at the 0.05 level of significance. This shows that households with higher economic levels have more non-agricultural income and a weaker economic development function. From the perspective of social capital, there is a significant positive correlation between expenditure for favors and the economic development function at the 0.05 level of significance. This is because households with better social networks in the countryside can more easily expand the scale of their operations and develop high-value industries, such as specialized farming and breeding, to increase economic returns, which enhances the economic development function.

3.3.3. Impact of Household Livelihood Assets on the Social Security Function

For human capital, household size and family medical expenditure in the past 12 months are significantly positively and significantly negatively correlated with the social security function at the 0.01 level of significance, respectively. This means that, the larger the household is, the greater the demand for the subsistence security function. The poorer the health status of the household members, the less prominent the social security function. In terms of natural capital, the number of types of collective land allocated to households is significantly and positively correlated with the social security function at the 0.01 level of significance. This means that households can promote the social security function by contracting land. For physical capital, the current market price of the house and the type of house are significantly negatively correlated with the social security function at the 0.05 and 0.01 significance levels, respectively. It may be that, the higher the current market price of the house and the better the type of the house, the more likely it is that farmers are engaged in non-agricultural activities with higher economic returns; thus, they have less demand for the social security function of agriculture. Financial capital and social capital have no significant relationships with the social security function of agriculture.

3.3.4. Impact of Household Livelihood Assets on the Ecological Service Function

In terms of human capital, household size is significantly positively related to the negative effect of the ecological service function at the 0.01 level of significance. This may be because the larger the household size is, the greater the intensity of agricultural exploitation, the greater the use of pesticides and fertilizers, and the greater the negative effect of the ecological service function. For natural capital, the number of types of household collective land is significantly and positively associated with the negative effects of the ecological service function at the 0.01 level of significance. It may be that, the more types of collective land there are, the more likely it is that households will diversify their land, an act that has negative environmental effects. In terms of physical capital, the type of house and the presence or absence of cars are significantly negatively and significantly positively correlated with the negative effects of the ecological service function of agriculture at the 0.05 significance level, respectively. It may be that, the better the type of housing, the greater the degree of household non-agriculturalization and the fewer negative environmental effects of agricultural activities. Households that own cars are mostly part-time farming households engaged in non-agricultural industries, and although agricultural work hours are short, many inputs, such as fertilizers and pesticides, are required to ensure stable and high yields, leading to obvious negative environmental effects. For financial capital, total household cash and savings and per capita household net income are significantly negatively and significantly positively correlated with the ecological-services function at the 0.05 significance level, respectively. It may be that, the larger the total household cash and savings, the more the household will engage in non-agricultural production activities, and the smaller the negative effect of the agricultural ecological service function. As per capita household net income increases, households have an economic basis to increase the input of agricultural production factors, and the effect of the agricultural ecological service function is more negative. For social capital, expenditure for favors is positively correlated with the negative effect of the ecological service function at the 0.01 level of significance. It may be because households with stable social ties and richer social capital in the countryside have a higher the possibility and degree of participation in agriculture production, and thus they have a greater negative effect on the environment [73].

3.3.5. Impact of Household Livelihood Assets on Leisure and Cultural Functions

Human capital, natural capital, and social capital are not significantly related to the leisure and cultural function of agriculture. In terms of physical capital, the type of house and the total value of consumer durables are significantly and positively correlated with the leisure and cultural function at the 0.05 level of significance. This result indicates that households with more physical capital have more potential demand for leisure and cultural functions. For financial capital, per capita household net income is significantly and positively correlated with leisure and cultural functions at the 0.01 level of significance. It may be that households with more financial capital have more financial strength and more potential demand for leisure and cultural functions.

4. Discussion and Policy Implications

4.1. Discussion

The combinations of and changes in the different livelihood assets of households lead to their selection of different livelihood strategies and corresponding changes in their agricultural functions. Gaining a better understanding of the differences in livelihood assets and agricultural functions of households with different livelihood strategies and exploring the interaction between households’ livelihoods and agricultural functions theoretically enriches the research results on households’ livelihoods and provides a reference for agricultural policy formulation in practice. Non-farming households are not necessarily superior to part-time farming households in terms of human capital and financial capital. Part-time farming II households are larger than non-farming households. It is not necessary to blindly promote non-agriculturalization. Although part-time farming households have a high level of physical capital and financial capital, their social security function is still very strong and does not allow for a complete agricultural scale-up [74]. Due to the increase in part-time farming and non-agriculturalization, households’ demand for the product supply function, economic development function, and social security function has been decreasing, while their demand for the leisure and cultural function has been increasing. Ensuring food security and the effective supply of important agricultural products requires respect for the main role of the product supply function. Households’ increasing demand for leisure and cultural functions should continue to be met.
Households with more human capital are more likely to be engaged in non-agricultural production activities with high comparative returns, and the agricultural product supply function is weakened. Larger households are more dependent on agriculture and the intensity of exploitation, which promotes the social security function and the negative effects of the ecological service function. A decrease in the natural capital of households will weaken the agricultural product supply function, and an increase in the number of collective land types contracted by households enhances the social security function, but there is a risk of negative effects on the ecological service function. Households with abundant physical capital have a high level of non-agriculturalization, low participation in agricultural production activities, and insufficient levels of the agricultural product supply function and social security function but high potential demand for the leisure and cultural function. The impact of financial capital on agricultural functions is heterogeneous. Large amounts of total household cash and savings and high levels of non-agriculturalization are not conducive to enhancing the agricultural product supply function but are conducive to reducing agricultural environmental pollution. An increase in per capita household net income is conducive to increasing the input of agricultural production factors, promoting the enhancement of the agricultural product supply function, and increasing households’ potential demand for leisure and cultural functions. However, the ecological service function has weakened due to an increase in inputs of production factors, such as chemical fertilizers and pesticides. An increase in social capital can enhance the agricultural product supply function but may enhance the negative effect of the ecological service function.
Smallholder production is characterized by small-scale production, fragmented operations, low labor productivity, and environmental vulnerability [75]. Smallholder production is vital in China, and smallholders are an important force in Chinese agricultural operations [4]. As the stage of socioeconomic development changes, households are faced with more off-farm employment opportunities. The comparative efficiency of agriculture is declining, and agricultural labor continues to shift to non-agricultural industries [76]. The number of smallholders is declining overall, but a large number of smallholders still make their living as part-time farmers. Part-time farming can, to a certain extent, promote the concentration of farmland management and increase agricultural productivity. The degree of part-time farming affects the rental status of farmland; households with a high degree of part-time farming are less concerned about the income generated by their land and are more willing to rent it out. Households with a low degree of part-time farming are less likely to quit farming because of their lack of proximity to other forms of employment and the policy of protecting agricultural subsidies. Due to the lack of new agricultural technologies, new tools, and market information, smallholders are still using traditional agricultural production and business models, making it difficult to generate scale benefits to drive socioeconomic development and thus cannot meet the social demand for high-quality agricultural products and high-quality agricultural development. Households’ agricultural functional needs conflict with the agricultural functional needs of macrosociety. Promoting the connection between smallholders and modern agricultural development is an effective measure to alleviate the contradiction between smallholder production and macrosocieties’ demand for agricultural functions.

4.2. Policy Implications

In the context of socioeconomic transformation and the diversification of households’ livelihoods, households’ demand for agricultural functions contradicts the demand of macrosocieties for agricultural functions. Although the Chinese government has adopted many policies to transform and upgrade smallholder production that have played a positive role in realizing the organic connection between smallholders and modern agricultural development, the policy system for optimizing the contradictory demands for agricultural functions based on the perspective of households’ livelihood capital requires further strengthening. We make the following policy recommendations to address the contradictions between the functional requirements of household and macrosocieties:
(1) To improve the health and human capital of households and strengthen the social security function, the government should improve the new rural cooperative medical care system and perfect the rural health service system [77]. Severe illness aids are tilted to more ordinary farmers to prevent farmers from becoming poor and returning to poverty due to illness.
(2) To ensure the stability of households’ natural capital and enhance the agricultural product supply function and social security functions, policymakers should deepen reform of the rural land use system, improve the legal system for the protection of agricultural land, and increase support for landless farmers [78]. Each region should be based on its own resource endowment, to carry out special agricultural operations and improve the level of agricultural security for households’ livelihood.
(3) The government needs to improve the living environment of rural residents and the production environment of agriculture, and also build new agricultural infrastructure, in order to increase the physical capital of households, increase the potential demands of households for leisure and cultural functions, and reduce the negative effects of the agricultural environment [79,80].
(4) Improving the diversified rural financial service system and innovating rural financial business and product services will help households increase their financial capital and increase their potential demand for the leisure and cultural functions [81]. In addition, the authorities should encourage private capital to actively participate in the development of rural specialty industries.
(5) The government needs to improve the level of organization of households through the development of agricultural professional cooperatives [82], strengthen connections between the interests of professional agricultural cooperatives and households, improve the agricultural socialized service system, cultivate households’ social capital and enhance households’ agricultural product supply and economic development functions.

5. Conclusions

The sample households can be divided into four groups, based on their livelihood strategies: full-time farming households, part-time farming I households, part-time farming II households, and non-farming households. The livelihood assets and agricultural functions of households with different livelihood strategies differ. In terms of livelihood assets, part-time farming households have more human capital than non-farming and full-time farming households. Full-time farming households have the highest level of natural capital, followed by part-time farming and non-farming households. Non-farming households have the highest level of physical capital, followed by part-time farming and full-time farming households. Part-time farming II households have the highest level of financial capital, followed by non-farming households; however, part-time farming and full-time farming households have the lowest level. Part-time farming and non-farming households have similar social capital, whereas full-time farming households have slightly lower levels of social capital. In terms of the agricultural functions, the agricultural product supply function of full-time farming households is significantly higher than those of part-time farming and non-farming households. Part-time farming I households have the highest value for the social security function, followed by full-time farming and part-time farming II households; however, non-farming households have the lowest value for this function. Full-time farming households suffer most from negative effects of the ecological service function, followed by part-time farming households and non-farming households. There is little difference in the potential demand for leisure and cultural functions among the four livelihood strategies, and non-farming households have slightly greater demand for this function.
The impact of human capital on agricultural functions is reflected in the inhibition of the agricultural product supply function, economic development function, and ecological services function by household size, which promotes social security. The influence of natural capital on agricultural functions is mainly manifested in the inhibition of the agricultural product supply function by land expropriation and the ecological service function by the number of types of collective land, which promotes the social security function. The influence of physical capital on agricultural functions is mainly manifested in the negative effects of the type of house and the total value of consumer durables on the supply function of agricultural products. The current market price of the house and the type of house do not promote the social security function. The type of house helps to reduce the negative effect of the ecological service function. The presence or absence of cars does not promote the ecological service function, and the type of house and total value of consumer durables promote the leisure and cultural function of agriculture. The impact of financial capital on agricultural functions is mainly demonstrated by the fact that total household cash and savings adversely affect the agricultural product supply function and promote the ecological service function. Per capita household net income has a positive effect on the agricultural product supply function and leisure and cultural function but does not promote economic development and ecological service functions. The influence of social capital on agricultural functions is mainly manifested in the expenditure for favors, which promotes the agricultural product supply function and economic development functions and inhibits the ecological service function.
Households with different livelihood strategies show significant differences in their livelihood assets and agricultural functions. Based on their livelihood capital endowments and the strength of their demand for agricultural functions, we should objectively recognize the important role of part-time farming in smallholder production and avoid blindly promoting non-farming and large-scale investment. Households’ different livelihood assets affect the direction and intensity of the various agricultural functions. For example, physical capital can enhance the potential demand for leisure and cultural functions, while weakening the agricultural product supply function. Social capital can enhance the agricultural product supply and economic development functions and inhibit the ecological service function. Smallholder production is still the main form of agricultural production in China, and the needs of households in terms of agricultural function contradict those of macrosociety. From the perspective of households’ livelihood assets, we propose several policy implications to promote the organic connection between smallholders and modern agriculture and optimize the contradiction between the agricultural functional needs of households and macrosocieties.
The research gaps are interactive laws between the transformation of household livelihoods and the evolution of agricultural functions. We fill the gap by studying the relationship between households’ livelihoods and agricultural functions, which is important for regulating and balancing the demand for agricultural functions and promoting the sustainable development of agriculture and rural areas. Due to the limitations of the questionnaire data, indirect indicators are used in this paper to evaluate households’ livelihoods and agricultural functions. Selecting a typical village to analyze the interaction patterns between agricultural functions and livelihoods of households with different livelihood strategies is more conducive to elucidating the interaction between smallholders and modern agriculture, which will be the direction of further research.

Author Contributions

Conceptualization, B.L.; methodology, B.L.; writing—original draft preparation, B.L.; writing—review and editing, Y.F. and B.L.; funding acquisition, Y.F. All authors have read and agreed to the published version of the manuscript.

Funding

This work was supported by the National Natural Science Foundation of China, under Grant No. 42071223.

Institutional Review Board Statement

Not applicable.

Informed Consent Statement

Not applicable.

Data Availability Statement

Data sharing not applicable.

Acknowledgments

Thanks to the Institute of Social Science Survey Center of Peking University for providing the data of China Family Panel Studies.

Conflicts of Interest

The authors declare no conflict of interest.

Appendix A

The evaluation methods for agricultural functions are as follows.
First, the raw data were normalized, using extreme difference normalization. Second, we determined the weight of each indicator by employing the entropy weight method. Finally, the scores of each function were calculated, using Equation (A1).
A P F = W j X j
where A P F is the score of agricultural product supply function, X j is the normalized value of indicator j , and W j is the weight of indicator j . The other four functional evaluation values are calculated in the same way as Equation (A1). In addition, the principle of calculating livelihood assets is the same as in Equation (A1).

References

  1. Giannakis, E.; Efstratoglou, S.; Antoniades, A. Off-Farm Employment and Economic Crisis: Evidence from Cyprus. Agriculture 2018, 8, 41. [Google Scholar] [CrossRef] [Green Version]
  2. Macdonald, D.; Crabtree, J.R.; Wiesinger, G.; Dax, T.; Stamou, N.; Fleury, P.; Gibon, A. Agricultural abandonment in mountain areas of Europe: Environmental consequences and policy response. J. Environ. Manag. 2000, 59, 47–69. [Google Scholar] [CrossRef]
  3. He, Y.; Xie, H.; Peng, C. Analyzing the behavioural mechanism of farmland abandonment in the hilly mountainous areas in China from the perspective of farming household diversity. Land Use Policy 2020, 99. [Google Scholar] [CrossRef]
  4. Zinda, J.A.; Kapoor, S. Metabolic fractures: How household livelihood practices differentiate agricultural input use in southwest China. J. Rural Stud. 2019, 71, 1–12. [Google Scholar] [CrossRef]
  5. Zeweld, W.; Van Huylenbroeck, G.; Tesfay, G.; Azadi, H.; Speelman, S. Sustainable agricultural practices, environmental risk mitigation and livelihood improvements: Empirical evidence from Northern Ethiopia. Land Use Policy 2020, 95. [Google Scholar] [CrossRef]
  6. Chandra, A.; Mcnamara, K.E.; Dargusch, P.; Caspe, A.M.; Dalabajan, D. Gendered vulnerabilities of smallholder farmers to climate change in conflict-prone areas: A case study from Mindanao, Philippines. J. Rural Stud. 2017, 50, 45–59. [Google Scholar] [CrossRef]
  7. Jamshidi, O.; Asadi, A.; Kalantari, K.; Azadi, H.; Scheffran, J. Vulnerability to climate change of smallholder farmers in the Hamadan province, Iran. Clim. Risk Manag. 2019, 23, 146–159. [Google Scholar] [CrossRef]
  8. Wang, W.; Zhao, X.; Cao, J.; Li, H.; Zhang, Q. Barriers and requirements to climate change adaptation of mountainous rural communities in developing countries: The case of the eastern Qinghai-Tibetan Plateau of China. Land Use Policy 2020, 95. [Google Scholar] [CrossRef]
  9. Guido, Z.; Knudson, C.; Finan, T.; Madajewicz, M.; Rhiney, K. Shocks and cherries: The production of vulnerability among smallholder coffee farmers in Jamaica. World Dev. 2020, 132. [Google Scholar] [CrossRef]
  10. Babulo, B.; Muys, B.; Nega, F.; Tollens, E.; Nyssen, J.; Deckers, J.; Mathijs, E. The economic contribution of forest resource use to rural livelihoods in Tigray, northern Ethiopia. For. Policy Econ. 2009, 11, 109–117. [Google Scholar] [CrossRef]
  11. Soltani, A.; Angelsen, A.; Eid, T.; Naieni, M.S.N.; Shamekhi, T. Poverty, sustainability, and household livelihood strategies in Zagros, Iran. Ecol. Econ. 2012, 79, 60–70. [Google Scholar] [CrossRef]
  12. Tian, Q.; Lemos, M.C. Household Livelihood Differentiation and Vulnerability to Climate Hazards in Rural China. World Dev. 2017, 108, 321–331. [Google Scholar] [CrossRef]
  13. Li, C.; Wang, M.; Song, Y. Vulnerability and livelihood restoration of landless households after land acquisition: Evidence from peri-urban China. Habitat Int. 2018, 79, 109–115. [Google Scholar] [CrossRef]
  14. Quandt, A. Measuring livelihood resilience: The Household Livelihood Resilience Approach (HLRA). World Dev. 2018, 107, 253–263. [Google Scholar] [CrossRef]
  15. Sina, D.; Chang-Richards, A.; Wilkinson, S.; Potangaroa, R. A conceptual framework for measuring livelihood resilience: Relocation experience from Aceh, Indonesia. World Dev. 2019, 117, 253–265. [Google Scholar] [CrossRef]
  16. Li, E.; Deng, Q.; Zhou, Y. Livelihood resilience and the generative mechanism of rural households out of poverty: An empirical analysis from Lankao County, Henan Province, China. J. Rural Stud. 2019. [Google Scholar] [CrossRef]
  17. Donkor, E.; Onakuse, S.; Bogue, J.; Rios-Carmenado, I.D.L. Fertiliser Adoption and Sustainable Rural Livelihood Improvement in Nigeria. Land Use Policy 2019, 88. [Google Scholar] [CrossRef]
  18. Baird, T.D.; Hartter, J.N. Livelihood diversification, mobile phones and information diversity in Northern Tanzania. Land Use Policy 2017, 67, 460–471. [Google Scholar] [CrossRef]
  19. Avilafoucat, V.S.; Rodriguezrobayo, K.J. Determinants of livelihood diversification: The case wildlife tourism in four coastal communities in Oaxaca, Mexico. Tour. Manag. 2018, 69, 223–231. [Google Scholar] [CrossRef]
  20. Mabe, F.N.; Nashiru, S.; Mummuni, E.; Boateng, V.F. The nexus between land acquisition and household livelihoods in the Northern region of Ghana. Land Use Policy 2019, 85, 357–367. [Google Scholar] [CrossRef]
  21. Garai, S.; Ghosh, M.K.; Maiti, S.; Garai, S.; Meena, B.S.; Dutta, T.K. Development and application of dairy-based sustainable livelihood security index in the districts of West Bengal, India: A tool for dairy development planning. J. Rural Stud. 2019. [Google Scholar] [CrossRef]
  22. Bhandari, P. Rural livelihood change? Household capital, community resources and livelihood transition. J. Rural Stud. 2013, 32, 126–136. [Google Scholar] [CrossRef] [Green Version]
  23. Wu, Z.; Li, B.; Hou, Y. Adaptive choice of livelihood patterns in rural households in a farm-pastoral zone: A case study in Jungar, Inner Mongolia. Land Use Policy 2017, 62, 361–375. [Google Scholar] [CrossRef]
  24. Hua, X.; Yan, J.; Zhang, Y. Evaluating the role of livelihood assets in suitable livelihood strategies: Protocol for anti-poverty policy in the Eastern Tibetan Plateau, China. Ecol. Indic. 2017, 78, 62–74. [Google Scholar] [CrossRef]
  25. Hussain, J.; Zhou, K.; Akbar, M.; Khan, M.Z.; Raza, G.; Ali, S.; Ghulam, A. Dependence of rural livelihoods on forest resources in Naltar Valley, a dry temperate mountainous region, Pakistan. Glob. Ecol. Conserv. 2019, 20. [Google Scholar] [CrossRef]
  26. Kuang, F.; Jin, J.; He, R.; Wan, X.; Ning, J. Influence of livelihood capital on adaptation strategies: Evidence from rural households in Wushen Banner, China. Land Use Policy 2019, 89. [Google Scholar] [CrossRef]
  27. Fang, Y.; Zhang, R.; Zhang, C.; Rasul, G.; Neupane, N. Cascading Adaptation of Rural Livelihood to Changing Environment: Conceptual Framework and Experiment from the Koshi River Basin. Adv. Clim. Chang. Res. 2020, 11, 141–157. [Google Scholar] [CrossRef]
  28. Dang, X.; Gao, S.; Tao, R.; Liu, G.; Xia, Z.; Fan, L.; Bi, W. Do environmental conservation programs contribute to sustainable livelihoods? Evidence from China’s grain-for-green program in northern Shaanxi province. Sci. Total Environ. 2020, 719. [Google Scholar] [CrossRef] [PubMed]
  29. Liu, Z.; Liu, L. Characteristics and driving factors of rural livelihood transition in the east coastal region of China: A case study of suburban Shanghai. J. Rural Stud. 2016, 43, 145–158. [Google Scholar] [CrossRef]
  30. Dai, X.; Li, B.; Wu, Z.; Nan, B.; Zhang, X. Pastoral livelihood transition via divergent pathways: A case study in northern Xinjiang, China. J. Arid. Environ. 2020, 174. [Google Scholar] [CrossRef]
  31. Escarcha, J.F.; Lassa, J.A.; Palacpac, E.P.; Zander, K.K. Livelihoods transformation and climate change adaptation: The case of smallholder water buffalo farmers in the Philippines. Environ. Dev. 2020, 33. [Google Scholar] [CrossRef]
  32. Ota, L.; Herbohn, J.; Gregorio, N.; Harrison, S. Reforestation and smallholder livelihoods in the humid tropics. Land Use Policy 2020, 92. [Google Scholar] [CrossRef]
  33. Call, M.; Gray, C.; Jagger, P. Smallholder responses to climate anomalies in rural Uganda. World Dev. 2019, 115, 132–144. [Google Scholar] [CrossRef]
  34. Oliveira, A.S.; Soaresfilho, B.; Costa, M.A.; Lima, L.; Rajão, R.; Carvalho-Ribeiro, S.M. Bringing economic development for whom? An exploratory study of the impact of the Interoceanic Highway on the livelihood of smallholders in the Amazon. Landsc. Urban Plan. 2019, 188, 171–179. [Google Scholar] [CrossRef]
  35. Bottazzi, P.; Crespo, D.; Bangura, L.O.; Rist, S. Evaluating the livelihood impacts of a large-scale agricultural investment: Lessons from the case of a biofuel production company in northern Sierra Leone. Land Use Policy 2018, 73, 128–137. [Google Scholar] [CrossRef]
  36. Qi, X.; Dang, H. Addressing the dual challenges of food security and environmental sustainability during rural livelihood transitions in China. Land Use Policy 2018, 77, 199–208. [Google Scholar] [CrossRef]
  37. Liu, M.; Yang, L.; Bai, Y.; Min, Q. The impacts of farmers’ livelihood endowments on their participation in eco-compensation policies: Globally important agricultural heritage systems case studies from China. Land Use Policy 2018, 77, 231–239. [Google Scholar] [CrossRef]
  38. Ellis, F. Household strategies and rural livelihood diversification. J. Dev. Stud. 1998, 35, 1–38. [Google Scholar] [CrossRef]
  39. Barrett, C.B.; Reardon, T.; Webb, P. Nonfarm Income Diversification and Household Livelihood Strategies in Rural Africa: Concepts, Dynamics and Policy Implications. Food Policy 2001, 26, 315–331. [Google Scholar] [CrossRef]
  40. Gautam, Y.; Andersen, P. Rural livelihood diversification and household well-being: Insights from Humla, Nepal. J. Rural Stud. 2016, 44, 239–249. [Google Scholar] [CrossRef] [Green Version]
  41. Sibhatu, K.T.; Krishna, V.V.; Qaim, M. Production diversity and dietary diversity in smallholder farm households. Proc. Natl. Acad. Sci. USA 2015, 112, 10657–10662. [Google Scholar] [CrossRef] [Green Version]
  42. Liu, Y.; Li, Y. Revitalize the world’s countryside. Nat. News 2017, 548, 275–277. [Google Scholar] [CrossRef] [PubMed]
  43. Marnasidis, S.; Kantartzis, A.; Malesios, C.; Hatjina, F.; Arabatzis, G.; Verikouki, E. Mapping Priority Areas for Apiculture Development with the Use of Geographical Information Systems. Agriculture 2021, 11, 182. [Google Scholar] [CrossRef]
  44. Roman, M.; Roman, M.; Prus, P.; Szczepanek, M. Tourism Competitiveness of Rural Areas: Evidence from a Region in Poland. Agriculture 2020, 10, 569. [Google Scholar] [CrossRef]
  45. Wilson, G.A. Multifunctional Agriculture: A Transition Theory Perspective; Cromwell Press: Trowbridge, UK, 2007. [Google Scholar] [CrossRef]
  46. Marsden, T.; Sonnino, R. Rural development and the regional state: Denying multifunctional agriculture in the UK. J. Rural Stud. 2008, 24, 422–431. [Google Scholar] [CrossRef]
  47. Fang, Y.; Liu, B.; Liu, J. Territorial types and optimization strategies of agriculture multifunctions: A case study of Jilin Province. Prog. Geogr. 2019, 38, 1349–1360. (In Chinese) [Google Scholar] [CrossRef]
  48. Andersen, P.S.; Vejre, H.; Dalgaard, T.; Brandt, J. An indicator-based method for quantifying farm multifunctionality. Ecol. Indic. 2013, 25, 166–179. [Google Scholar] [CrossRef]
  49. Wilson, G.A. From ‘weak’ to ‘strong’ multifunctionality: Conceptualising farm-level multifunctional transitional pathways. J. Rural Stud. 2008, 24, 367–383. [Google Scholar] [CrossRef]
  50. Willemen, L.; Hein, L.; van Mensvoort, M.E.F.; Verburg, P.H. Space for people, plants, and livestock? Quantifying interactions among multiple landscape functions in a Dutch rural region. Ecol. Indic. 2010, 10, 62–73. [Google Scholar] [CrossRef]
  51. Wilson, G.A. Multifunctional ‘quality’ and rural community resilience. Trans. Inst. Br. Geogr. 2010, 35, 364–381. [Google Scholar] [CrossRef]
  52. Gómez-Limón, J.A.; Vera-Toscano, E.; Rico-González, M. Measuring individual preferences for rural multifunctionality: The importance of demographic and residential heterogeneity. J. Agric. Econ. 2012, 63, 1–24. [Google Scholar] [CrossRef]
  53. Tan, X.; An, Y.; Su, Y.; Zhou, G.; He, Y. Spatio-temporal dynamics of agricultural function in Changsha-Zhuzhou-Xiangtan urban agglomerations. Sci. Geog. Sin. 2018, 38, 708–716. (In Chinese) [Google Scholar]
  54. Lu, S.; Liu, Y.; Qin, F. Spatio-temporal differentiation of agricultural regional function and its impact factors in the Bohai Rim region of China. Acta Geogr. Sin. 2019, 74, 2011–2026. (In Chinese) [Google Scholar]
  55. Liu, Z.; Zhuang, J. Determinants of technical efficiency in post-collective Chinese agriculture: Evidence from farm-level data. J. Comp. Econ. 2000, 28, 545–564. [Google Scholar] [CrossRef]
  56. Werf, H.; Petit, J. Evaluation of the environmental impact of agriculture at the farm level: A comparison and analysis of 12 indicator-based methods. Agric. Ecosyst. Environ. 2002, 93, 131–145. [Google Scholar] [CrossRef]
  57. Loison, S.A. Household Livelihood Diversification and Gender: Panel Evidence from Rural Kenya. J. Rural Stud. 2019, 69, 156–172. [Google Scholar] [CrossRef]
  58. Bellon, M.R.; Kotu, B.H.; Azzarri, C.; Caracciolo, F. To diversify or not to diversify, that is the question. Pursuing agricultural development for smallholder farmers in marginal areas of Ghana. World Dev. 2020, 125. [Google Scholar] [CrossRef]
  59. Birthal, P.S.; Hazrana, J.; Negi, D.S. Diversification in Indian agriculture towards high value crops: Multilevel determinants and policy implications. Land Use Policy 2020, 91. [Google Scholar] [CrossRef]
  60. Department for International Development (DFID). Sustainable Livelihoods Guidance Sheets; DFID: London, UK, 2000. [Google Scholar]
  61. Tang, Q.; Bennett, S.J.; Xu, Y.; Li, Y. Agricultural practices and sustainable livelihoods: Rural transformation within the Loess Plateau, China. Appl. Geogr. 2013, 41, 15–23. [Google Scholar] [CrossRef]
  62. Liu, Y.; Xu, Y. A geographic identification of multidimensional poverty in rural China under the framework of sustainable livelihoods analysis. Appl. Geogr. 2016, 73, 62–76. [Google Scholar] [CrossRef]
  63. Colombo, E.; Romeo, F.; Mattarolo, L.; Barbieri, J.; Morazzo, M. An impact evaluation framework based on sustainable livelihoods for energy development projects: An application to Ethiopia. Energy Res. Soc. Sci. 2018, 39, 78–92. [Google Scholar] [CrossRef]
  64. Su, M.M.; Wall, G.; Wang, Y.; Jin, M. Livelihood sustainability in a rural tourism destination—Hetu Town, Anhui Province, China. Tour. Manag. 2019, 71, 272–281. [Google Scholar] [CrossRef]
  65. Xie, Y.; Hu, J. An Introduction to the China Family Panel Studies (CFPS). Chin. Sociol. Rev. 2014, 47, 3–29. [Google Scholar] [CrossRef]
  66. Jordan, L.P.; Ren, Q.; Falkingham, J. Youth Education and Learning in Twenty-First Century China. Chin. Sociol Rev. 2014, 47, 57–83. [Google Scholar]
  67. Chen, Y.; Shen, H.; Zhong, Q.; Chen, H.; Huang, T.; Liu, J.; Cheng, H.; Zeng, E.Y.; Smith, K.R.; Tao, S. Transition of household cookfuels in China from 2010 to 2012. Appl. Energy 2016, 184, 800–809. [Google Scholar] [CrossRef]
  68. Chen, H.; Zhu, T.; Krott, M.; Calvo, J.F.; Ganesh, S.P.; Makoto, I. Measurement and evaluation of livelihood assets in sustainable forest commons governance. Land Use Policy 2013, 30, 908–914. [Google Scholar] [CrossRef]
  69. Paul, S.; Das, T.K.; Pharung, R.; Ray, S.; Mridha, N.; Kalita, N.; Singh, A.K. Development of an indicator based composite measure to assess livelihood sustainability of shifting cultivation dependent ethnic minorities in the disadvantageous Northeastern region of India. Ecol. Indic. 2020, 110. [Google Scholar] [CrossRef]
  70. Peng, J.; Liu, Z.; Liu, Y.; Hu, X.; Wang, A. Multifunctionality assessment of urban agriculture in Beijing City, China. Sci. Total Environ. 2015, 537, 343–351. [Google Scholar] [CrossRef] [PubMed]
  71. Yu, M.; Yang, Y.; Chen, F.; Zhu, F.; Qu, J.; Zhang, S. Response of agricultural multifunctionality to farmland loss under rapidly urbanizing processes in Yangtze River Delta, China. Sci. Total Environ. 2019, 666, 1–11. [Google Scholar] [CrossRef] [PubMed]
  72. Zhang, J.; Mishra, A.K.; Zhu, P. Identifying livelihood strategies and transitions in rural China: Is land holding an obstacle? Land Use Policy 2019, 80, 107–117. [Google Scholar] [CrossRef]
  73. Baffoe, G.; Matsuda, H. A perception based estimation of the ecological impacts of livelihood activities: The case of rural Ghana. Ecol. Indic. 2018, 93, 424–433. [Google Scholar] [CrossRef]
  74. Gyapong, A.Y. How and why large scale agricultural land investments do not create long-term employment benefits: A critique of the ‘state’ of labour regulations in Ghana. Land Use Policy 2020, 95. [Google Scholar] [CrossRef]
  75. Morton, J. The impact of climate change on smallholder and subsistence agriculture. Proc. Natl. Acad. Sci. USA 2007, 104, 19680–19685. [Google Scholar] [CrossRef] [PubMed] [Green Version]
  76. Wang, X.; Huang, J.; Rozelle, S. Off-farm employment and agricultural specialization in China. China Econ. Rev. 2017, 42, 155–165. [Google Scholar] [CrossRef]
  77. Huang, X.; Wu, B. Impact of urban-rural health insurance integration on health care: Evidence from rural China. China Econ. Rev. 2020, 64, 101543. [Google Scholar] [CrossRef]
  78. Huang, X.; Huang, X.; He, Y.; Yang, X. Assessment of livelihood vulnerability of land-lost farmers in urban fringes: A case study of Xi’an, China. Habitat Int. 2017, 59, 1–9. [Google Scholar] [CrossRef]
  79. Meng, X.; Liang, W.; Ding, P.; Wang, S.; Li, Y.; Long, E. Survey research on living environment and energy consumption in the west rural areas of China. Procedia Eng. 2015, 121, 1044–1050. [Google Scholar] [CrossRef] [Green Version]
  80. Jiang, Y.; Chen, S.; Hu, B.; Zhou, Y.; Liang, Z.; Jia, X.; Huang, M.; Wei, J.; Shi, Z. A comprehensive framework for assessing the impact of potential agricultural pollution on grain security and human health in economically developed areas. Environ. Pollut. 2020, 263, 114653. [Google Scholar] [CrossRef]
  81. Kochar, A. Branchless banking: Evaluating the doorstep delivery of financial services in rural India. J. Dev. Econ. 2018, 135, 160–175. [Google Scholar] [CrossRef]
  82. Gava, O.; Ardakani, Z.; Delalic, A.; Azzi, N.; Bartolini, F. Agricultural cooperatives contributing to the alleviation of rural poverty. The case of Konjic (Bosnia and Herzegovina). J. Rural Stud. 2021, 82, 328–339. [Google Scholar] [CrossRef]
Figure 1. Framework of the interaction mechanism between household livelihoods and agricultural functions. Adapted from the UK Department for International Development (DFID) [60].
Agriculture 11 00241 g001
Table 1. Basic characteristics of the sample.
TypesItemsNumberPercentage (%)TypesItemsNumberPercentage (%)
GenderMale182148.19Age (year)<3054614.45
Female195851.8131–4570718.71
MarriageMarried299979.3646–60137636.41
Unmarried3729.84>61115030.43
Divorced721.91EducationIlliterate128534.00
Widowed3368.89Primary school98225.99
Health conditionUnhealthy85722.68Junior middle school108628.74
General47912.68Senior high school or above42611.27
Relatively healthy134535.59Type of housingBungalow259568.67
Very healthy54714.47Small building87223.07
Extreme healthy55114.58Courtyards and unit house2867.57
Land leasingLease58115.38Villas and townhouses260.69
Unleased286275.73Per capita household net income (USD per person)<1208142337.66
Own no land3368.891208–2417125633.24
Work outsideYes218357.772417–423070318.60
No159642.23>423039710.50
Agricultural and sideline value (USD)<227184148.72Work in agricultureYes275772.96
227–4533469.16No102227.04
453–105748512.83
>1057110729.29
Note: Respondents are often the family members who are most knowledgeable about the production and living conditions of the household. The average exchange rate of RMB to USD in 2018 is 6.62, 1 USD = 6.62 RMB.
Table 2. Livelihood asset evaluation index.
Livelihood AssetsIndicatorMeasurement/Value AssignmentWeight
Human CapitalHousehold sizeTotal number of family members0.329
Household health statusFamily medical expenditure in the past 12 months0.322
Education levelHighest level of education completed by the respondents: illiterate/semiliterate = 1, primary school = 2, junior middle school = 3, senior high school/secondary school/technical school/vocational high school = 4, junior college = 5, bachelor’s = 6, master’s = 70.349
Natural CapitalStatus of household collective landNumber of types of collective land allocated to households, including arable land, forestland, pasture, ponds0.494
Status of land expropriationPresence or absence of land expropriation: absence = 0, presence = 10.506
Physical CapitalValue of housingCurrent market price of house0.215
Type of housingType of house: Bungalow = 1, courtyard house = 2, unit house = 3, small building = 4, villa and townhouse = 50.269
Total value of consumer durablesConsumer durables refer to products with a unit price of more than 1000 yuan and a natural service life of more than 2 years0.218
Car ownershipPresence or absence of cars: presence = 1, absence = 00.298
Financial CapitalHousehold cash and savingsTotal household cash and savings0.333
Household incomeTotal household net income0.334
Household income per capitaPer capita household net income0.333
Social CapitalRelationship between the familyExpenditure for favors refers to the favor gifts, including in-kind and cash, spent by households in the past 12 months0.311
How well connected one isRespondents themselves assessed their own interpersonal relationships according to the numbers 0–10; higher numbers indicate higher quality0.324
Participation in social organizationsWhether they are members of trade unions or a privately owned business associations: yes = 1, no = 00.365
Note: Negative indicators include family medical expenditure in the past 12 months, and presence or absence of land expropriation. The weights are calculated by the entropy weight method.
Table 3. Agricultural function evaluation index system.
Agricultural FunctionsIndicatorMeasurement/Value AssignmentWeight
Agricultural product supply functionPer capita value of agricultural and sideline products in the householdThe total value of household agricultural and sideline products divided by household size1
Economic development functionProportion of the total value of agricultural and sideline products in the net income of the entire householdThe total value of agricultural and sideline products divided by the net income of the entire household1
Social security functionEngaged in agricultural activitiesWhether the household engages in farm work: yes = 1, no = 00.371
Ownership of agricultural machineryThe total value of farm machinery0.296
Land leasingWhether or not the household leases the land to others: no = 0, yes = 1, Own no land = 20.333
Ecological service functionUse of seeds, fertilizers, and pesticidesThe cost of seeds, fertilizers, and pesticides1
Leisure and cultural functionProportion of cultural and recreational expenditure and tourism expenditure in total household expenditureCultural and recreational expenditure and tourism expenditure divided by total household expenditure1
Note: Negative indicators include whether or not the household leases the land to others, the cost of seeds, fertilizers, and pesticides. The weights are calculated by the entropy weight method.
Table 4. Classification of household livelihood strategies.
Livelihood StrategyThe Proportion of the Total Value of Agricultural and Sideline Products in Total Household Net Income (%)Sample NumberPercentage (%)
Full-time farming>5051013.50
Part-time farming I10–50100826.67
Part-time farming II0–1073719.50
Non-farming0152440.33
Table 5. Differences in the livelihood assets of households with different livelihood strategies.
Livelihood StrategyHuman CapitalNatural CapitalPhysical CapitalFinancial CapitalSocial Capital
Full-time farming0.4230.6390.0890.0240.266
Part-time farming I0.4390.6250.1230.0280.274
Part-time farming II0.4540.6150.1420.0400.276
Non-farming0.4290.6060.1470.0350.278
Note: Values are the averages for households in each livelihood strategy.
Table 6. Differences in the agricultural functions of households with different livelihood strategies.
Livelihood StrategyAgricultural Product Supply FunctionEconomic Development FunctionSocial Security FunctionEcological Service FunctionLeisure and Cultural Function
Full-time farming0.086-0.3750.0880.016
Part-time farming I0.031-0.3800.0470.014
Part-time farming II0.007-0.3580.0240.017
Non-farming0-0.2470.0080.018
Note: Values are averages for households in each livelihood strategy. The symbol “-“ means empty. Since the economic development function and the livelihood strategy are measured by the same variable, we do not discuss the economic development function in Section 3.2.
Table 7. Regression analysis of household livelihoods and agricultural functions.
VariablesAPFEDFSSFESFLCF
Total number of family population members−0.072 **−0.069 *0.088 **0.072 **0.079
Family medical expenditure in the past 12 months−0.002−0.012−0.048 **0.0080.046
Highest level of education completed by the respondents0.002−0.01−0.0050.0040.032
Number of types of collective land allocated to households0.01−0.0420.363 **0.061 **−0.001
Presence or absence of land expropriation−0.069 **−0.0320.0260.0080.015
Current market price of the house0.0230.025−0.037 *−0.012−0.03
Type of house−0.034 *−0.015−0.048 **−0.029 *0.094 *
Total value of consumer durables−0.096 **0.0050.001−0.030.123 *
Presence or absence of cars0.0190.017−0.0020.043 *0.013
Total household cash and savings−0.059 **−0.0290.006−0.037 *−0.032
Per capita household net income0.490 **−0.067 *0.0070.052 *0.592 **
Expenditure for favors0.037 *0.056 *−0.0010.055 *−0.025
Quality of the interviewee’s interpersonal relationships−0.006−0.008−0.009−0.013−0.014
Membership in trade unions or privately owned business associations−0.006−0.017−0.014−0.004−0.004
Total income in the past 12 months0.276 **−0.034−0.0340.148 **−0.171
Wage income−0.334 **−0.247 **0.040 *−0.123 **−0.025
Proportion of total household expenditure devoted to food expenditure0.004−0.017−0.069 **−0.0030.061
Machine rental costs0.155 **0.205 **0106 **0.321 **−0.122 **
Irrigation costs0.039 *0.100 **0.070 **0.257 **0.011
Proportion of total household net income derived from working−0.071 **−0.146 **0.050 **−0.059−0.018
R20.4880.2020.1940.320.216
a-R20.4840.1930.1890.3160.184
DW1.3251.0741.7121.4931.891
F106.00621.88445.14588.2536.72
Note: Test of statistical significance (* for p < 0.05, ** for p < 0.01); a-R2 refers to adjusted R2. DW refers to the Durbin-Watson statistic, which can be used to detect the presence of autocorrelation in the residual terms in the regression analysis. F refers to the F statistic, which is used to test the overall significance of all explanatory variables in the multiple linear regression analysis. APF refers to Agricultural Product Supply Function. EDF refers to Economic Development Function. SSF refers to Social Security Function. ESF refers to Ecological Service Function. LCF refers to Leisure and Cultural Function.
Publisher’s Note: MDPI stays neutral with regard to jurisdictional claims in published maps and institutional affiliations.

