1. Introduction
Supply of metabolizable energy (ME) from herbage has been identified as a major factor limiting performance of cows in pasture-based dairy farms [
1,
2]. In most pasture-based dairy farms, allocation of herbage and other feeds is calculated on a dry-matter basis, where assumptions are made about the ME content of the diet and the total ME required of the herd in order to achieve performance targets while maintaining low cost [
3]. In contrast, more intensive indoor dairy farms using total mixed ration (TMR) feeding, require accurate measurement of dietary ME to feed cows diets that are more balanced to their actual energy requirements and dilute cost by improving productivity and feed conversion efficiency [
4,
5].
The use of recent advances in precision technology to measure herbage mass (HM) and herbage nutritive value (NV) has been proposed as a means of improving the efficiency of grazing and the use of feeds on extensive pasture-based dairy farm systems [
6,
7]. It is believed that efficiency gains would arise from shifting from a dry-matter basis to a nutrition centred allocation basis. This shift in focus would suggest a change in the management approach towards the likes of the TMR system. However, for such an approach to be operational in practice, precise knowledge on the nutritional demand of cows in the milking herd is required.
Climate, diet and animal factors are responsible for changes in the feed demand of a milking herd [
8]. Within a milking herd, daily demand for nutrition, and in particular energy, of individual lactating cows depends on the level of milk produced, live weight, mobilisation of body tissue, and stage of gestation, all of which are characterised by typical lactation curve patterns that are a function of the day since a cow started producing milk [
9]. Lactation curve models can be mechanistic or empirical. Mechanistic models are theoretical representations and underlying assumptions of the processes driving lactation while empirical models correspond to statistical representations of the reality being modelled [
9]. When herd test data is available, fitting Legendre orthogonal polynomials using random regression is a flexible option to obtain a good characterisation of individual lactation curves and allow variation of curves among cows [
9].
In addition to lactation curve modelling, the choice of the energy feeding system is important to define the energy requirements of individual cows. Different energy feeding systems are currently adopted in Europe [
10,
11] and North America [
12], while the AFRC [
11] is widely used to estimate energy requirements of grazing dairy cows in New Zealand. Yan et al. [
13] assessed the performance of the AFRC [
11], NRC [
12] and INRA [
11] feeding systems using data from long-term feeding studies and found no major differences in the estimation of energy requirements among systems except for the energy required for live weight change; where the NRC outperformed the INRA and AFRC systems. More recently, a review by Tedeschi et al. [
14] has concluded that simpler feeding systems, such as the AFRC [
11], are more resilient to variation in conditions among studies and robust enough to characterise milk production around the world.
Although several researchers [
15,
16,
17] have determined the relationships between the ME content of diets and their influence on the performance of milking cows, these studies have been carried out under controlled conditions or involved few animals, making conclusions from such studies unscalable to the actual farm situation. Moreover, given the intrinsic dynamics of seasonal farming, it is unclear the extent to which requirements for ME of individual cows in a milking herd would vary given the variation of the energy content supplied daily in the diet. Knowing the extent to which requirements for ME of individual cows in a pasture-based dairy farm vary will contribute to the discussion of how such variation could potentially be used to improve efficiency in pasture-based dairy farm systems.
The objective of this study was to determine the extent to which the deviation of total metabolizable energy requirements of individual cows (MEt) from the ME supplied per cow in the herd (DME) varies throughout the production season in a pasture-based dairy farm using proximal hyperspectral sensing (PHS) of canopies.
2. Materials and Methods
2.1. Study Farm
This study was conducted at Dairy 1 farm at Massey University, Palmerston North, New Zealand (latitude = −40°22′35.1″, longitude = 175°36′51.1″) during the 2016–2017 (from 29 July 2016 to 26 May 2017) and 2017–2018 (from 1 August 2017 to 29 May 2018) production seasons. The farm is characterised for being a low input pasture-based system with spring calving in which all cows are milked once daily throughout the production season. The main source of feed available on the farm throughout this study was grazed perennial ryegrass (
Lolium perenne L.) and white clover (
Trifolium repens L.) herbage mix. In addition to the use of herbage silage, mixed herb crops comprising chicory (
Cichorium intybus), red clover (
Trifolium pratense) and plantain (
Plantago lanceolata), and monocultures of turnip (
Brassica campestris ssp. rapifera), were grazed strategically to fill deficits in seasonal dry matter supply. In 2016–2017, lucerne (
Medicago sativa) was grazed directly from paddocks while in 2017–2018, rape (
Brassica napus), maize silage (
Zea mays), tapioca (
Manihot esculenta) and dried distillers grains pellets were introduced to the diet of cows. During the 2016–2017 and 2017–2018 production seasons, the dairy herd consisted of 260 and 255 cows, respectively, which were allocated an effective area of 119.7 ha. The herd breed composition was 25% Holstein-Friesian (F), 14% Holstein-Friesian crossbred (FX), 26% Holstein-Friesian-Jersey crossbred (FJ), 12% Jersey crossbred (JX) and 22% Jersey (J) based on the breed grouping criteria proposed by Handcock et al. [
18].
2.2. Data Collection
Daily yields of milk (MY), fat (FY) and protein (PY) from cows in the herd were obtained from herd tests for fat and protein percentages and somatic cell counts performed monthly during the two production seasons. Live weights (LW) of individual cows identified with a radio frequency electronic identification system (Allflex New Zealand Ltd., Palmerston North, New Zealand) were automatically measured every morning after milking using a race walkover scale (WoW xR-3000, Tru-Test Ltd., Auckland, New Zealand). Calving dates, dry-off dates and dates of withholding periods for milk due to medicinal treatment were also documented. Volume of milk and kilograms of milk solids, fat and protein produced daily by the herd were monitored using the dairy company actual milk vat return records. Milk vat refers to the tank that is used to store raw milk produced at the farm until its collection by the dairy company the following day.
Herbage mass (HM) and metabolizable energy content (ME) of herbage from paddocks pre-grazing were measured every two to three weeks. At each measurement period, between four to six paddocks in the farm manager’s weekly grazing plan were measured. Herbage mass was estimated using a C-Dax pasture meter with auto lift (Pasture Meter+ model 5008, C-Dax Agricultural Solutions, Turitea, NZ) towed behind an all-terrain vehicle following a “W” shaped pattern across the length of the paddock. C-Dax herbage height data collected within each paddock were averaged and converted to kilograms of dry matter (DM) per hectare with equation 1 developed and validated by Dairy 1 technical staff.
where H is height (mm).
Metabolizable energy was predicted from canopy reflectance measurements acquired with an ASD FieldSpec 4 High-Res proximal hyperspectral sensor (Analytical Spectral Devices Inc., Boulder, CO, USA) coupled with a canopy pasture probe system [
19]. Metabolizable energy was determined using farm specific calibration models [
20]. At each paddock, hyperspectral measurements were acquired from within twelve 50 × 50 cm sampling plots distributed along the path of the C-Dax pasture meter. The number of plots was defined following recommendation of Cosgrove et al. [
21] who suggested that twelve samples are required to determine the mean herbage ME of a paddock with an accuracy of ± 0.5 MJ/kg DM. At each grazing event, the area of herbage allocated to the cows was recorded. Post-grazing HM was measured using the same method as the one used to quantify HM at pre-grazing.
Daily allocation of supplementary feeds was obtained from farm records. The ME and gross energy (GE) content of the various feeds supplied to the cows was assumed (
Table 1).
Table 1.
Metabolizable energy (ME) and gross energy (GE) of feeds other than fresh herbage offered to cows during the 2016–2017 and 2017–2018 production seasons at Dairy 1, Massey University, Palmerston North.
Table 1.
Metabolizable energy (ME) and gross energy (GE) of feeds other than fresh herbage offered to cows during the 2016–2017 and 2017–2018 production seasons at Dairy 1, Massey University, Palmerston North.
| Feed Source | ME (MJ/kg DM) | GE 1 (MJ/kg DM) | Reference |
|---|
| Herbage silage | 9.5 | 19.0 | [22] |
| Herbage baleage | 10.2 | 19.0 | [22] |
| Chicory | 12.5 | 18.4 | [22] |
| Rape | 12.9 | 18.4 | [23] |
| Turnips | 12.0 | 18.4 | [22] |
| Lucerne | 11.0 | 18.4 | [22] |
| Maize silage | 10.3 | 19.0 | [22] |
| Tapioca | 12.8 | 18.8 | [22] |
| Dried distillers grains | 12.5 | 18.8 | [22] |
2.3. Data Editting
In order to obtain a complete description of the feed offered daily at the farm during the two production seasons, days with missing data for HM, area of herbage offered to cows, post-grazing HM, herbage ME were imputed using linear extrapolation.
The amount of herbage DM consumed by the herd at any paddock in any day was calculated as:
where HC is the herbage consumed by the herd (kg DM), HM
preg is pre-grazing herbage mass (kg DM/ha), HM
postg is post-grazing herbage mass (kg DM/ha) and AH is the area of herbage allocated to cows (ha).
2.4. Modelling of Cow Lactation Curves and Validation of Milk Production at Herd Level
Orthogonal polynomials of third order were used to model lactation curves for MY, FY, PY and LW for each individual milking cow in each production season. Regression models for each trait were defined as a polynomial function of a cow’s days in milk after calving as:
where Y
t(c:y) is the trait measured at day t after calving of cow c within production season y, β
0 to β
3 are fixed regression coefficients representing the lactation curve of the population, α
0(c:y) to α
3(c:y) are random regression coefficients for cow c within production season y, P
0 to P
3 are Legendre polynomial functions of order 0 to 3 as defined below, and e
t(c:y) is the random residual error. Coefficients of the orthogonal polynomial were calculated as:
where x is the number of days after calving standardised to a maximum lactation length of 270 days and calculated as:
where t is the number of days after calving.
Estimates of the fixed and random regression coefficients were obtained by solving the mixed model equations using the restricted maximum likelihood procedure as implemented in the R software package ”lme4“ (lme4, Version 2.74, R Package) [
24].
The models developed here were used to predict MY, FY, PY and LW for each cow in the herd for every calendar day of the 2016–2018 and 2017–2018 production seasons. At any given day, a cow was assumed to be in the milking herd if the day was one week after their calving date or before their drying-off date and there were no records of the cow being withheld from milking. Modelled yields of milk, fat and protein of individual cows were added by calendar day and daily totals were validated against actual milk production obtained in the milk vat. Modelled lactation curves were then used to estimate requirements for ME of each of the cows in the milking herd at every calendar day along production seasons as described in
Section 2.5.
2.5. Metabolizable Energy Requirements of Cows and Energy Balance at Herd Level
The ME content in the diet supplied daily to the herd was calculated as the weighted average of the ME content of the feed source in relation to the quantity of feed supplied in dry matter (DM). Likewise, metabolicity of the diet (qm), calculated as the quotient ME/GE, was also based on the weighted average of the energy contents of feeds, where the value for GE of fresh herbage was assumed at 18.4 MJ/kg DM and values for ME and GE of the remaining feeds were also assumed and presented in
Table 1.
Efficiency of ME use for the various animal functions were calculated or assumed constant following AFRC [
11] Equations (6) to (11):
The ME requirement for maintaining (ME
m; in MJ/day) a cow at any given calendar day was calculated as the addition of the energetic requirements for their fasting metabolism (Fm) and an activity allowance (Ac) that assumed a constant walking distance of 3 km as:
where LW
d is the modelled live weight of a cow at calendar day d.
Cow ME requirement for lactation (ME
l; in MJ/day) was calculated as:
where EV
l is the energy value of a kilogram of milk calculated as:
where F and P are percentages of fat and protein in milk, respectively.
Metabolizable energy requirement for live weight change (ME
g; in MJ/day) was calculated with Equation (16) if the cow was gaining weight or with Equation (17) if the cow was losing weight.
where EV
g is the energy value of a kilogram of live body tissue assumed constant at 19 MJ/kg [
11] and LWC is the daily live weight change of a cow as determined by the first derivative of modelled daily live weights.
Metabolizable energy requirement to sustain the growth of the conceptus (ME
c; in MJ/day) was calculated as:
where EV
c is the energy retained by the fetus at any given day after conception and calculated as:
where E
t is the total energy retained by the fetus in MJ at day t after conception derived from:
and W
c is the calf weight at birth in kg calculated as:
where LW
m is the cow’s averaged live weight between days 100 and 200 after calving. Conception date of each cow was calculated by subtracting 283 days to the date of calving at the subsequent production season. It was assumed that cows not present in the herd in the subsequent production season were empty with an EV
c equal to zero.
The total cow requirements for ME (ME
t; in MJ/day) were adjusted for feeding level as:
where FL is the feeding level calculated by dividing the sum of ME
m, ME
l, ME
g and ME
c over ME
m.
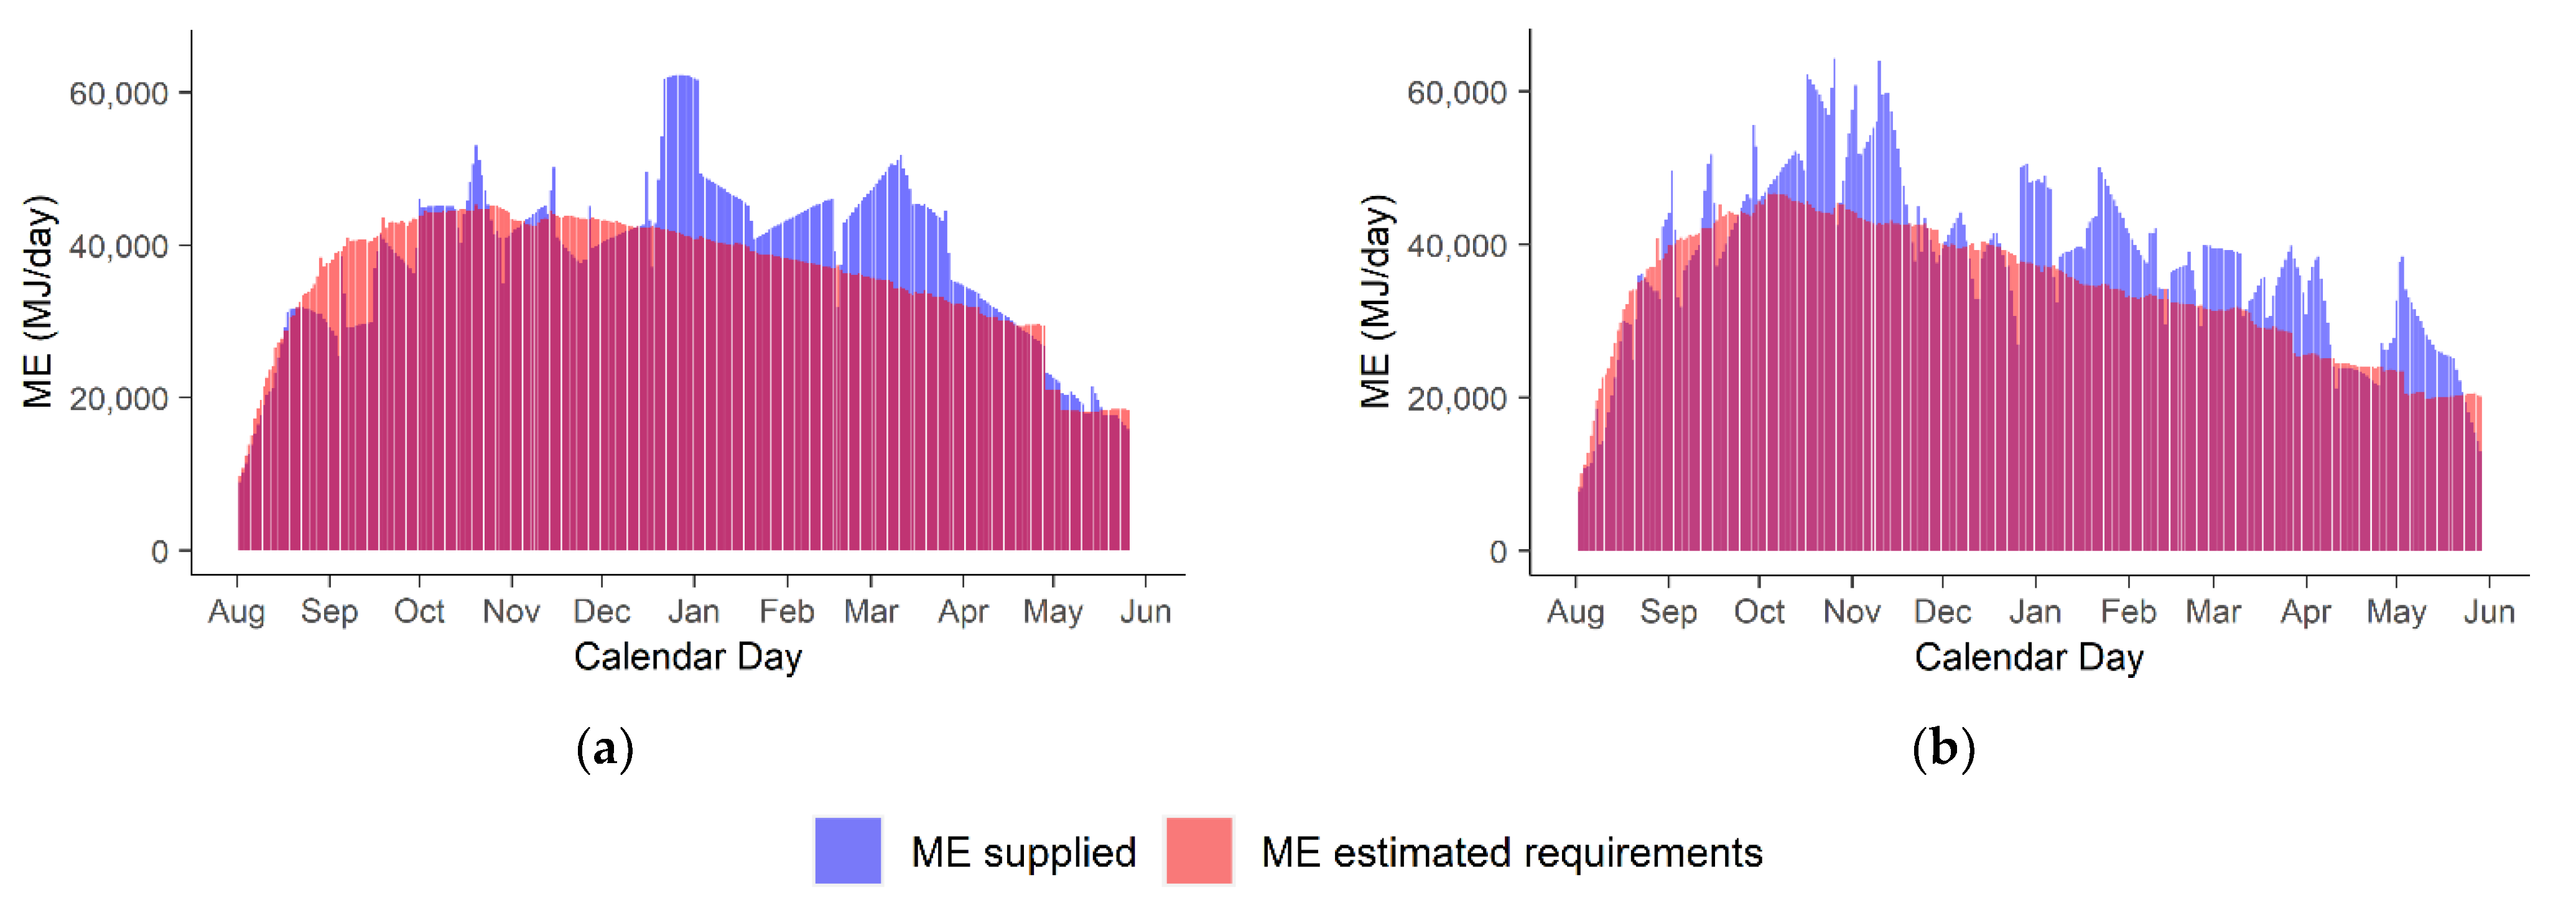
Estimated requirements for MEt of individual cows were added by calendar day to determine the daily MEt estimated requirements of the herd. Then, herd MEt requirements were contrasted with daily ME supplied at the farm. The herd was considered sub or over fed if their MEt estimated requirements was above or below 5 MJ/kg DM of the mean ME value of the diet supplied daily. The ±5 MJ/kg DM tolerance was based on the error associated with the herbage ME sampling method.
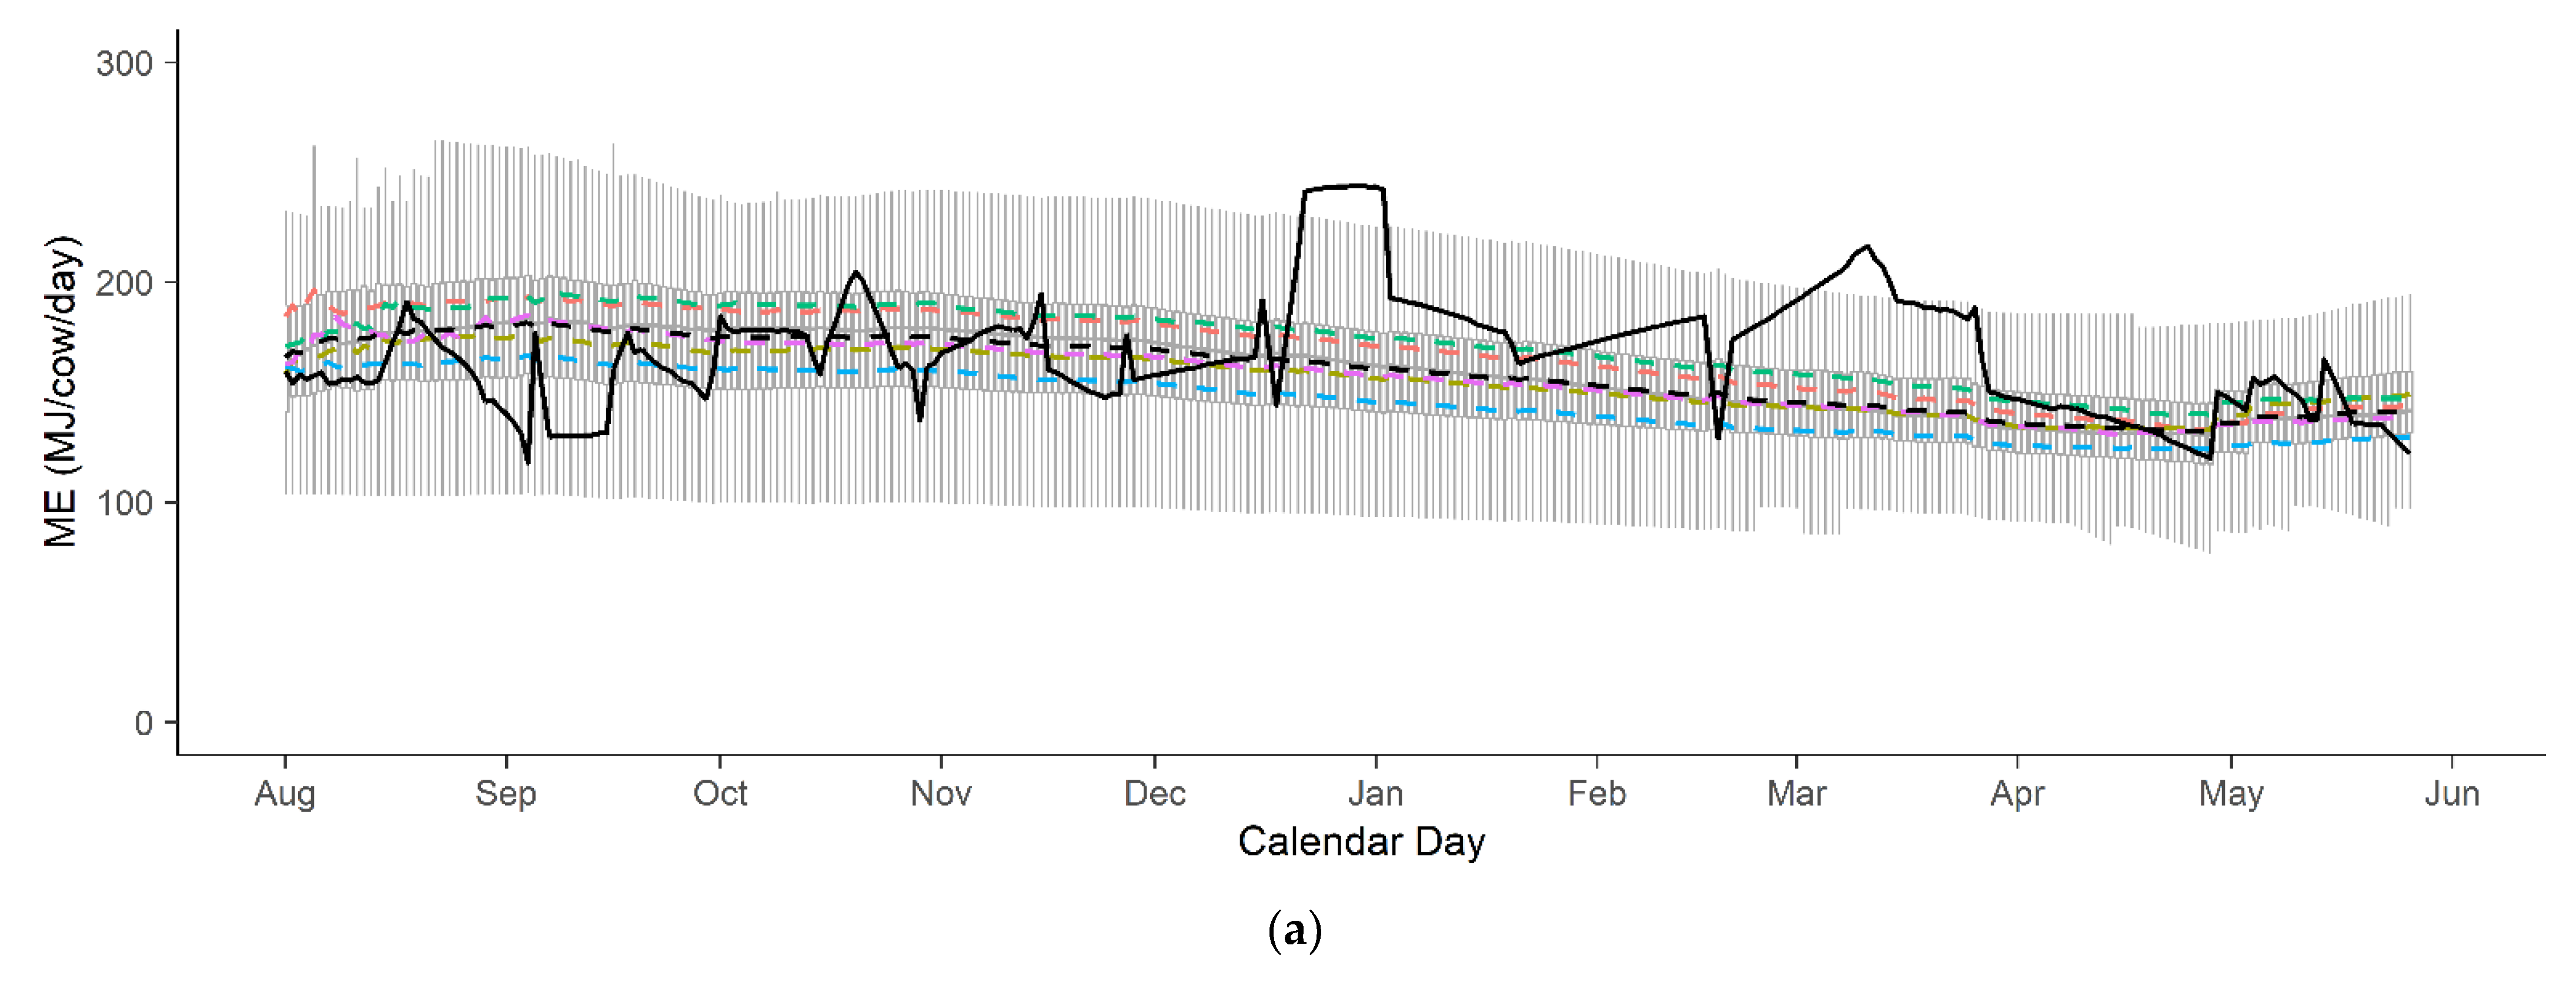
Descriptive statistics were used to visualise variation of estimated requirements for MEt of individual cows along with the actual ME supplied per cow in the herd (MEs; MJ/cow/day). Variation of daily MEt estimated requirements of cows within calendar days was represented by boxplots, while averaged daily MEt estimated requirements grouped by breed were used to represent daily energy required by each of the five breeds in the herd.
The difference between a cow’s daily MEt estimated requirements and MEs was defined and calculated as the deviation of the daily MEt estimated requirements of a cow from the actual ME supplied per cow in the herd (DME; in MJ/day).
2.6. Statistical Analysis
A repeated measures analysis of variance for DME was performed using the “lme4” package for R software (lme4, Version 2.74, R Package) to obtain estimates of the variance reflected by the levels of the factors in the following linear model:
where DME
ij is the deviation of the daily ME
t estimated requirements of cow i of breed j from the ME supplied per cow in the herd, µ is the mean value of DME, C
i is the random effect of the i-th cow in the herd (318 different identification classes), B
j is the random effect of the j-th breed (either F, FX, FJ, JX or J) and e
ij is the random residual error associated with each observation.
Estimates of variance components for cow (σ2c), breed (σ2b) and residual error (σ2e) were used to calculate total variance (σ2T) as σ2T = σ2c + σ2b + σ2e. The contribution of breed, cow and residual error were also expressed as the percentage of the total variance.
4. Discussion
Mean values of daily yields per cow of milk, fat and protein obtained from herd tests were slightly higher than yields calculated from milk vat records. Moreover, mean yields reported here were about 46%, 50% and 51% higher than the yields of milk, fat and protein, respectively reported in other comparable studies involving once a day milking but higher stocking rates (>3 cows/ha) [
25,
26,
27]. Despite the differences in yields, mean live weights used here were within the ranges of live weights reported in the studies mentioned before (from 375 to 511 kg). Mean and standard deviation values of herbage ME predicted from canopy reflectance were within the normal values commonly found in the literature [
1,
22,
28]. Likewise, herbage mass measures at pre-grazing were within normal ranges observed for ryegrass dominant herbage swards (from 2200 to 3700 kg DM/ha) [
1,
29] while herbage mass measures obtained at post-grazing were slightly higher than the most frequent measures observed by McCarthy et al. [
30], which ranged from 1480 to 1760 kg DM/ha. Higher than normal post-grazing residuals might help explain the higher yields measured in this study compared to those reported in other comparable studies [
25,
26,
27].
Modelling of lactation curves of individual cows for the two production seasons was able to capture the production of milk in the vat. However, the negative offsets and slopes greater than one in the linear regression equations (
Figure 2) indicate that modelling tended to overestimate production as measured in the milk vat at days with high levels of production and to underestimate production at lower levels of milk production, but that although significant (
p < 0.001), the magnitude of these effects was minimal. It is important to highlight however that milk vat records might not be an accurate representation of the actual milk produced daily at the farm, since milk produced at the farm was used to rear calves and was not available and therefore not included in the milk vat records, also the milk from any cow on medication was not included in the vat. Because demand for milk by calves is high when milk production levels are high, the differences between herd tests and milk vat records can explain the differences between yields measured at herd tests and yields calculated from milk present in the vat (
Table 2), and therefore, the slight overestimation by the modelling approach. The underestimation of milk produced at lower levels of production by modelling might be the consequence of underestimating the number of cows being milked at the beginning of the production seasons when production is low, as this number was set by a fixed milk withholding period of seven days, which might have been lower than the actual number of cows milked at that stage. Moreover, the use of orthogonal polynomial functions, which were found to introduce errors at both ends of modelled lactation curves [
31,
32] can also help explain the differences between modelled and actual milk produced at the vat, particularly at both ends of the production seasons.
Accuracy and bias metrics describing the relationship between the daily ME supplied and estimated requirements of the herd (
Figure 3) indicated that there were opportunities in the farm to further improve the balance between supply and demand of energy. An RPE value of 18.9% means that the daily ME estimated requirements of the herd were, on average, nearly a fifth above or below the daily mean ME supplied. Moreover, there was a slight systematic tendency to under supply ME as denoted by the slope greater than one in the equation regression (
Figure 3). The profile of the ME supplied against herd daily estimated requirements shows that most of the undersupplied days were at early stages in the production seasons. This is consistent with theoretical representations of dry matter supply and demand in seasonal pasture-based dairy farm systems [
1]. The relative undersupply of dietary ME at early stages in the production seasons is well known and is explained by cows entering a stage of negative energy balance postpartum that is characterised by physical constrain of intake and weight loss to support metabolic functioning [
33]. Although feeding strategies can be developed to overcome the effects of the negative energy balance at early lactation, allowing for the physiological capability of cows to rapidly mobilise energy from fat tissue instead of incorporating sources of energy in the diet is perhaps the most profitable strategy for managing feed at this stage. Oversupply of energy during most days from October onwards signifies that supplements could have been saved if allocation of feeds were made based on rapid measurements of herbage ME. However, this would have not only required rapid ME measurement tools but also precise forecasting tools that were able to accurately assist with tactical planning and budgeting for the season.
Greater dispersion of individual cow daily ME
t estimated requirements at early stages of the production seasons can be explained by greater variation of peak yields than in persistency of lactations of individual cows in the herd. This can be supported by the high levels of ME supplied per cow that occurred after January in both production seasons (
Figure 5) that are most likely to have contributed to sustain persistency of lactation after peak yields. If daily variation of estimated requirements for ME
t is grouped by breed and compared against the mean dietary ME supplied per cow in the herd, then results show that the energy required by F cows was below the mean energy supplied per cow on 49% of the days studied, while this metric was only 17% for J cows. F cows must have a different grazing behaviour (i.e., bite rate, bite mass and/or grazing time) compared to J cows in order to achieve greater intakes to satisfy their energy demands.
The contribution of within cow variation on explaining variance of DME can be partially explained by the fact that daily estimated requirements for MEt of individual cows throughout lactations varied more than the variation of the supply of ME per cow at the herd level throughout the production seasons. Because of this, the differences of DME within individual cows were greater than the differences of DME between cows or breeds. This finding stresses on the importance of performing regular monitoring of a cow’s MEt requirements to inform daily allocation of ME to cows to minimize DME. Most pasture-based dairy herds are managed as a single mob, where all cows have access to the same feed resources and thus a precise fit between ME demand and supply of each individual cow is unlikely to be easily implemented. However, having accurate estimates of the MEt requirements of individual cows and the ME content of the diet on any given day can potentially help management to achieve a more precise balance between demand and supply of energy though improved decision-making without having to bring significant changes to the production system or management.
Measurement error can potentially affect decision making around DME management. In this study, the estimation of daily ME demand was based on modelling of lactation curves which is likely to be subject to error if compared to actual daily measurements. Moreover, there is a level of error associated with herbage ME measurement due to accuracy of the PHS tool [
20] and the sampling strategy chosen [
21]. Moreover, estimation of DME variation is also likely to be subject to measurement error of MY, FY, PY and LW of individual cows as this error is embedded in the within cow factor used in random regression. In addition to measurement error, another source of error in the estimation of the ME supplied by the diet is associated with the use of assumed, instead of actual, ME values for supplementary feeds assessment. Measurement and assumptions induced errors limit the scope of this study to DME management, but to our understanding, no study has been published to date with the level of detail of the data presented here.
Several technologies are available, or are currently under development, to control cow feeding in pasture-based dairy farms. Hills et al. [
34] identified virtual fencing and individualized feeding as suitable technologies to implement precise feeding of grazing cows in pasture-based systems. The main idea behind these technologies is to provide cows with restricted access to resources based on their energy and nutritional needs to maximize the marginal response of cows to feed, so that the farm system is more efficient. In a virtual fencing system, cows with low ME
t requirements can be grouped and given access to herbage of lower ME, while cows requiring higher energy levels can be allocated to herbage of higher energy content. Under individualized feeding, cows with higher MEt estimated requirements could potentially be fed more ME than lower MEt estimated requirements cows, leading to a more efficient use of ME. Such approach could be further enhanced if data on the genetic merit for milk production of individual cows were used to inform individual feeding. Cows of high genetic merit partition more energy towards milk and less towards body tissue than low genetic merit cows [
35], and thus, their milk production response to supplements is relatively low [
36]. Savings of feed should be expected if the genetic merit of cows is considered for the decision of allocating feed individually, as less feed could be potentially allocated to high genetic merit cows without altering milk production. Moreover, recent research by Fischer et al. [
37] proved that restricting dry matter intake of cows that are less efficient compared to cows that are more efficient in converting feed and milk energy can significantly narrow the differences between cows, suggesting that overconsumption could be a driver of inefficiency and that controlling it could be a suitable strategy for reducing methane emissions without altering productivity of dairy farms.


 ,
, 


