Article

Definition of Reference Models for Power, Mass, Working Width, and Price for Tillage Implements

1
Department of Land, Environment, Agriculture and Forestry, University of Padova, Via dell’Università 16, 35020 Legnaro, Italy
2
Edizioni L’Informatore Agrario srl, Via Bencivenga-Biondani 16, 37133 Verona, Italy
*
Author to whom correspondence should be addressed.
Agriculture 2021, 11(3), 197; https://doi.org/10.3390/agriculture11030197
Submission received: 1 February 2021 / Revised: 21 February 2021 / Accepted: 24 February 2021 / Published: 27 February 2021
(This article belongs to the Special Issue Selected Papers from Engineering for Rural Development)

Abstract

:
Farm machinery selection, operation and management directly impact crop cultivation processes and outputs. A priori quantification of technical and financial needs allows definition of proportionate distribution and management of available resources and simplification of selection process. Appropriate planning, association and adjustment of the power unit and implement are required for soil cultivation. Consideration of functional parameters of the implement, their proper estimation and operation directly impact the soil structure, productivity and return on investment. Thus, a modelling approach was implemented for the definition of possible parameter-price relations for tillage equipment. The performed analysis allowed us to investigate the main relevant parameters, quantify their impact, and elaborate forecasting models for price, power, mass and working width. The significant relevance of the technical parameters and adjustment issues were outlined for each tillage implement group. For harrows and cultivators, the dependencies between studied parameters expressed better predictive qualities, especially for price-mass relation (R² > 0.8). While for ploughs power and mass relation had a primary output (R² = 0.7). The prediction features of the models provided reliable results for the estimation of the indicative values of the price and parameters of the implements.

Graphical Abstract

1. Introduction

Farmers face a complicated task managing resources and performing sustainable agricultural production [1]. Decisions regarding planning, purchasing and the application of mechanical units comprise a major part of farm management. The choice of machinery unit often does not correspond to the farm’s needs, thus leading to various adverse impacts [2]. Farm machinery parameters are mainly overestimated with the purpose of arriving at greater efficiencies and increased productivity. Dimensional and functional excess of different parameters can significantly impact the farm economic output and expected results. Overestimated consideration of the main parameters, such as mass and power, can promote an increase in soil compaction and CO2 emissions [3,4,5,6]. Additionally, a considerable rise in parameters requires more massive investments and more significant farm costs [7,8,9]. Rational distribution of resources and optimization of costs is needed to ensure farm productivity, yield, farm income and environmental protection (CAP 2020) [10,11]. To support management and planning of balanced decisions, regulatory mechanisms and measures for appropriate and proportionate agricultural machinery selection are needed [10,12,13,14]. Prediction models, farm management software and optimization tools replace the traditional drivers of the selection procedure, leading to a better fleet organization and planning methodology [13,14,15,16]. Forecasting models for optimization of machinery unit’s selection provide an economically viable and environmentally sustainable solution and lead to the simplification of the decision-making process [17,18,19]. Following the latter concept, a large study was carried out (5000 models of machinery included) on the development and implementation of reference models for main agricultural machinery groups [20,21,22]. Reference models predicting main functional parameters and price were developed for sowing, spraying and harvesting operations. The current study focuses on soil cultivation implements, completing the main groups of agricultural operations for crop cultivation, allowing prediction analyses to be performed and fleet planning and farm management to be undertaken.
Operating parameters and performance of tillage implements have a primary impact on the economic output of the soil cultivation. Cost of tillage operations largely depends on the tillage method (conventional, reduced, minimum tillage), cropping program (continuous cropping and crop fallow) and is influenced by farm size and operation time. According to Bauer and McEvoy (1990), differences between tillage methods has greater economic impact than agronomic, and there is a need of a consideration of the fact of cost differences between tillage systems during the planning stage [23]. Indeed, literature provides comparison studies related to the tillage method’s economic benefits [1,23,24]. However, despite the degree of applied mechanical intervention, investment costs for the soil cultivation machinery are still considerable.
The effectiveness of the operation largely depends on the association between tractor and implement and operational adjustment (traction-assist system, hitching, uniform and adequate penetration of the tools and depth of operation). Power source requirements for the operation change depending on the depth of operation, degree of pulverization, forward speed, shape of the working element, soil structure, etc. The type of the power supply varies as well based on the tillage equipment (power take-off, drawbar). A balanced adjustment of parameters and their correct application play a critical role in the use of available power (working width, speed) [25].
The selection of machinery and implement requires consideration and understanding of soil conditions as well. Soil conditions guarantee the plant growth and profitable yield. Heavy machines and wheels’ load can create soil stress and lead to soil compaction. Moreover, during conventional tillage operation, the wheel load is increased by approximately 25% due to the mass redistribution and draft force of the implement [3]. The impact of historical increase of the weight of the machinery on the soil qualities has been studied by Keller et al. (2019). The study showed that vehicle weights’ historical expansion increased subsoil compaction levels and led to higher costs [3,26]: in the last 50 years, the load of tractors has increased by 3 tonnes [3]. The increase of the agricultural machinery load (during the last century) led to the rise of pressure at the soil surface by approximately 10 times (at 0.5 m depth) [5]. The issue was addressed by Lassen et al. (2013) with the development of the soil stress distribution, compaction evaluation and simulation model Terranimo [26]. The model allows soil stress to be calculated for a specific machine and implement, and therefore the possible overload during operation to be avoided. Therefore, consideration of dimensions and prevention of the possible consequences of chosen parameters are needed during tractor/implement selection and operation [27,28]. Thanks to the machinery unit’s proper operation, justification of the higher investment on larger equipment can be compensated by an increase of efficiency and reduction of fixed costs [29]. However, poor mechanical skills and insufficient resources make it difficult to achieve or practice effective soil cultivation, leading to the notable economic side effects and impacting return of investment.
Solutions such as controlled traffic farming allow having a better understanding of the field work, the performance of the machinery and better plan the cultivation. However, there are still visible limitations to the proper selection of units and, afterwards, the management of existing mechanical and financial resources and definition of reference price boundaries. Decisions regarding fleet renewal and selection of machinery unit are linked to the preliminary estimation of the parameters based on the actual farm needs and, therefore, the corresponding definition of the related investments. Farmers lack the basic information related to the parameter’s relation, their selection and association importance, investment planning tools and supportive methods. The relation of the functional parameters to the price of the machinery is almost not even discussed. It is clear that a farmer cannot impact the machinery unit’s cost, but to avoid this overestimation of the investment can be performed. The relevant studies regarding the functional and operational parameters have narrow spectrum of application: mainly they refer to a specific crop cultivation, consider a unique implement or even the working element of the implement, what makes it complicated to widen the results of the experiments and methods for general application [30,31,32,33,34,35,36,37]. The other biggest limitation is the complexity of the proposed solutions, they are too sophisticated for the farmer to use. In particular, regarding farm machinery selection and cost prediction, most of the models are considering only economic aspects of the operation and corresponding involvement of a machine or have very complex algorithms that require special knowledge/software/skills for their application. Available agricultural machinery management standards, models and cost calculators (e.g., ASAE, AMACA, etc.) mainly refer to the machinery cost determination and calculation/prediction of variable and fixed costs [38,39,40], and operation expenses in general, thus bypassing the machinery price definition, which indeed has fundamental importance for farmers, for the investment planning and farm management. Moreover, for such calculations the price of the machinery unit is considered as input data [40].
In the current study, the main technical parameters of tillage implements were analyzed with the purpose to investigate their possible intercorrelations and impact on the price, to develop reference models for the prediction of machine price, power, mass, and working width, thus facilitating the simplification of the machinery selection process and optimizing the decision-making process.

2. Materials and Methods

The study relies on a statistical analysis of functional parameters and price of implements for soil cultivation, seedbed preparation and weed control. For that reason, a large database was created based on the collection and processing of machinery specifications and performance-related technical characteristics of tillage implements available in the European market. Data were based on the models provided from 27 leading agricultural machinery constructors (Amazone, KUHN, Kverneland, Pottinger, Nardi, Sfoggia, etc.) representing 8 countries including Austria, United Kingdom, Italy, Norway, Denmark, etc. Data were collected from available agricultural machinery producers, agricultural machinery associations, open-source databases and continuously updated in collaboration with Informatore Agrario srl. (Verona, Italy).
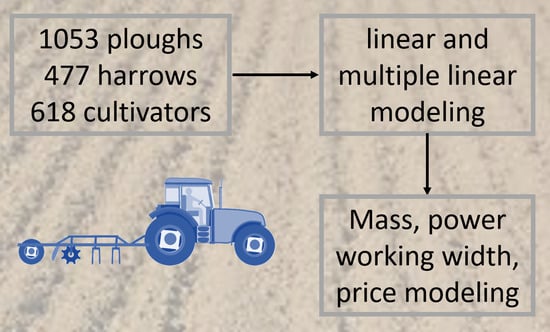
The database populated by 2148 models includes large variability in commercial-scale cultivation equipment for a complete performance of tillage practices mainly following the conventional treatment. The database has been subsequently split into sub-datasets adapted to cultivation approach. Three groups of tillage implements were created based on the adopted mechanical interventions of soil: primary tillage (plough, 1053 models), secondary tillage and seedbed preparation (harrow, 477 models), after mechanical cultivation treatment and weed control (cultivators, 618 models). The relevant technical, dimensional and performance parameters and general implement information have been merged, properly filtered and sorted (Table 1).
The collected complete information related to each model underwent relevance assessment and parameters impacting price formation. Thus, power, mass, working width and list price of tillage implements are the main parameters included in the analysis. The studied samples represent the basic design and structure provided by the manufacturing companies.
Broad inclusion of the models in the dataset, presented by various constructors from different countries, provides a complete overview of the available market of the implements and can be considered reliable for prediction analysis and modelling parameters and price. The range of maximum and minimum values of relevant parameters is summarized in Table 2.
Implements for primary tillage include 1053 models of mounted, semi-mounted and trailed ploughs with the depth of the cultivation from 0.25 to 0.7 m and up to 4 m of working width. The dataset involves a variation of the different types and design of working elements (up to 9 elements) requiring up to 270 kW power availability. The second dataset involves 477 models of harrows for secondary tillage and seedbed preparation. Data collected cover harrows with disc, tooth, knife, vertical rotor, anchor type functional elements providing up to 9 m working width. The last group of implements include a combination of cultivators, row crop cultivators, rotary tillers and strip-tillers mainly for weed control, cut of surface residuals, soil pulverization, etc.
As previously mentioned, the analyses of tillage implements presented in this work are a part of a larger investigation that involve multiple agricultural machinery groups [20,21,
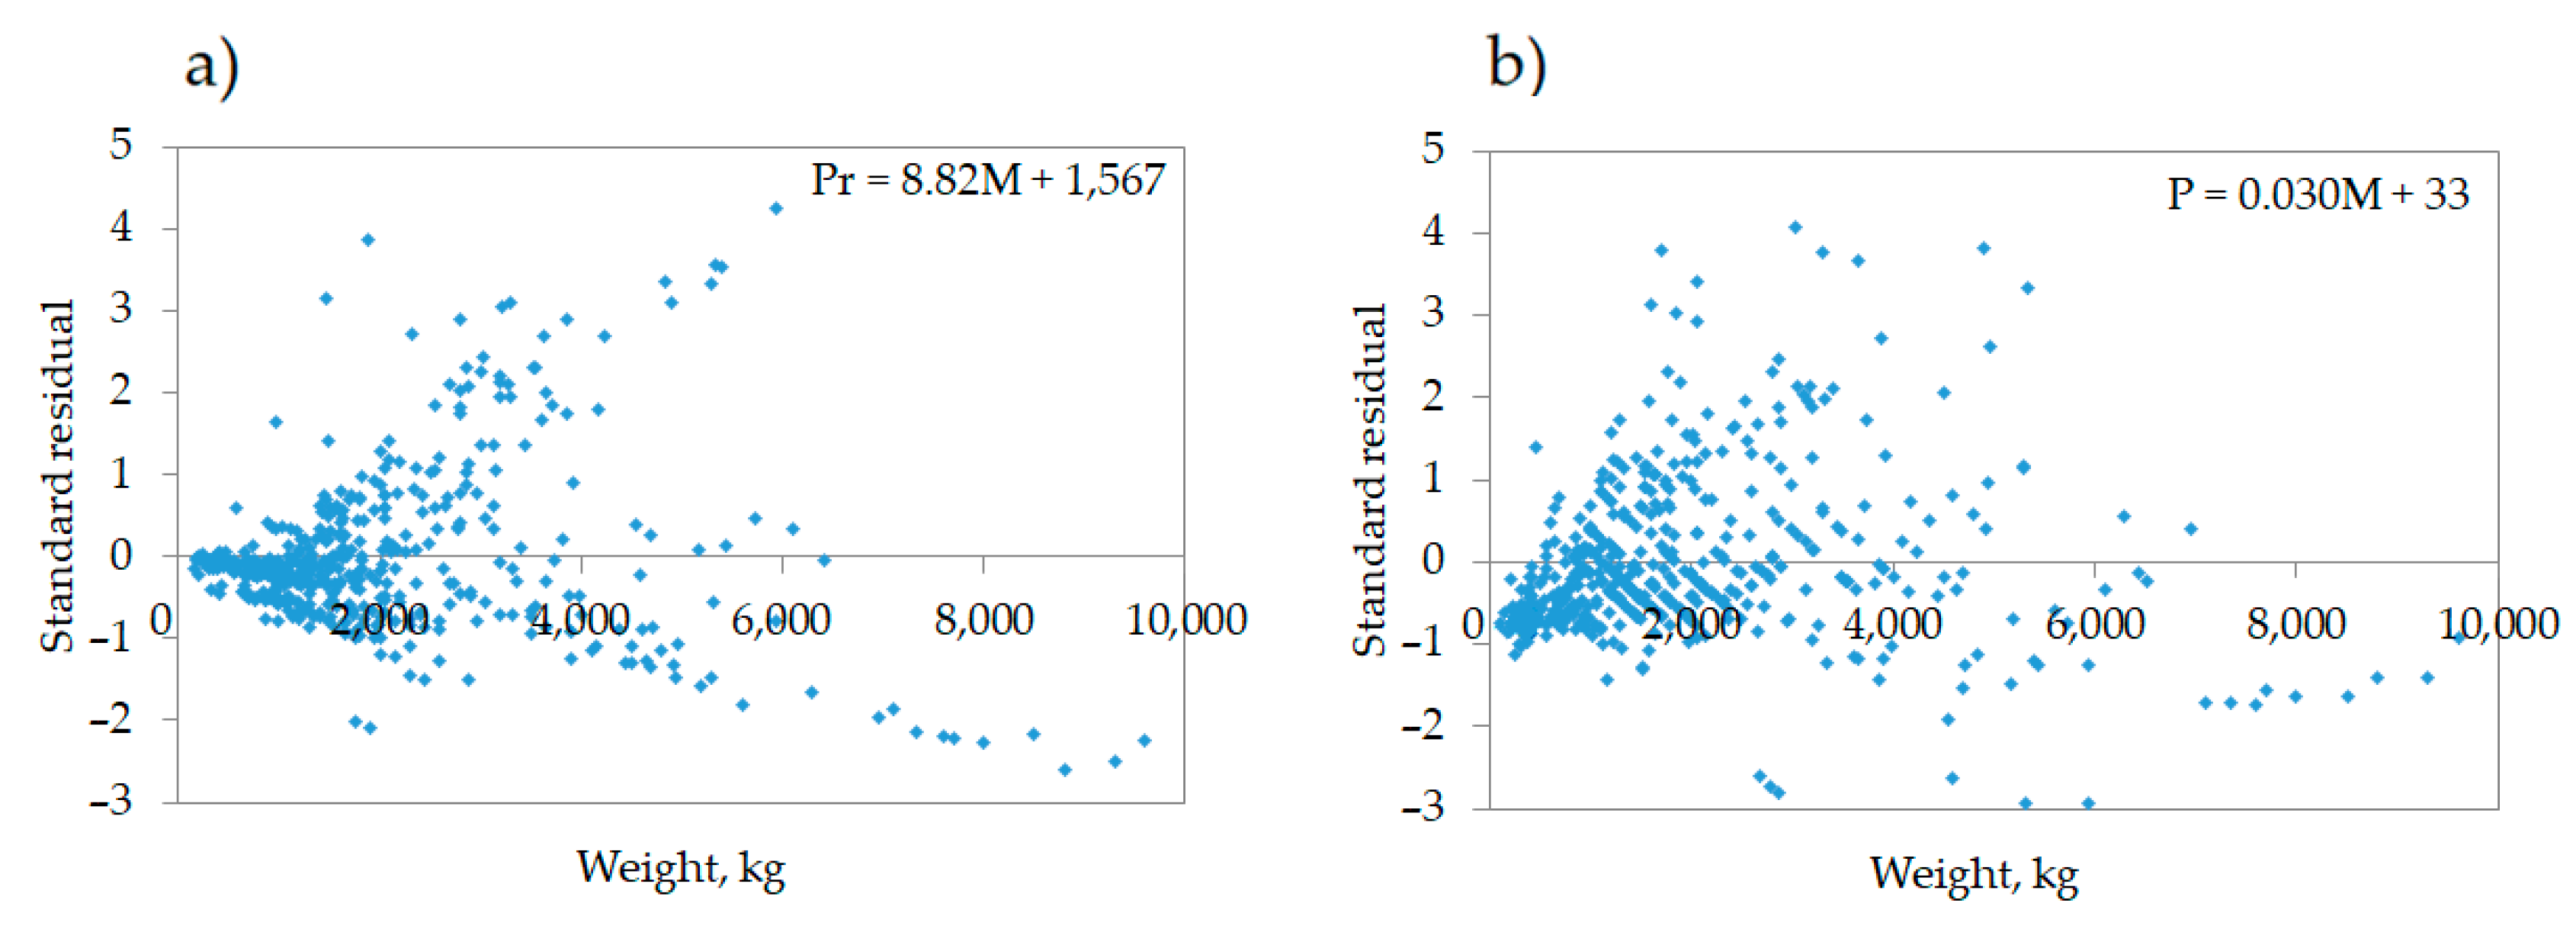
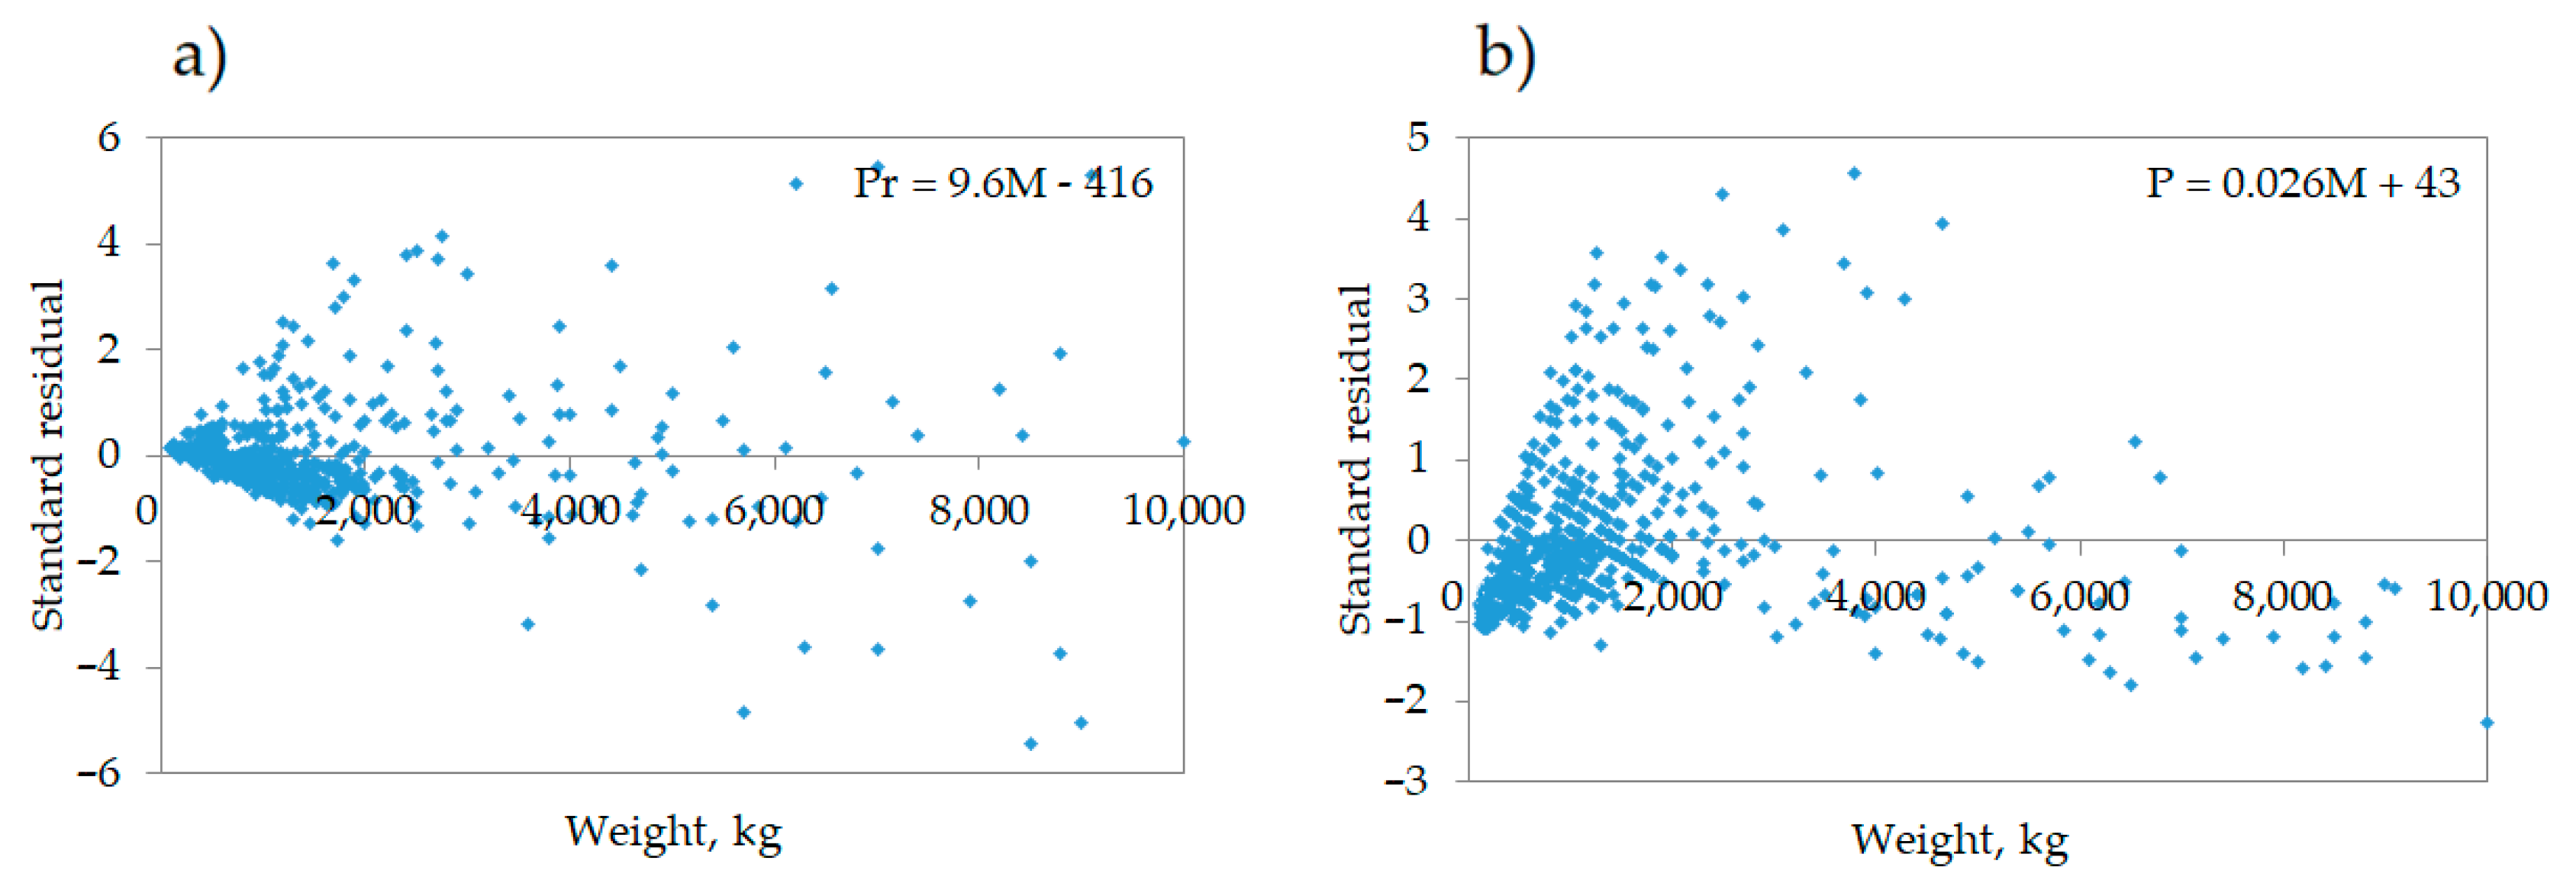
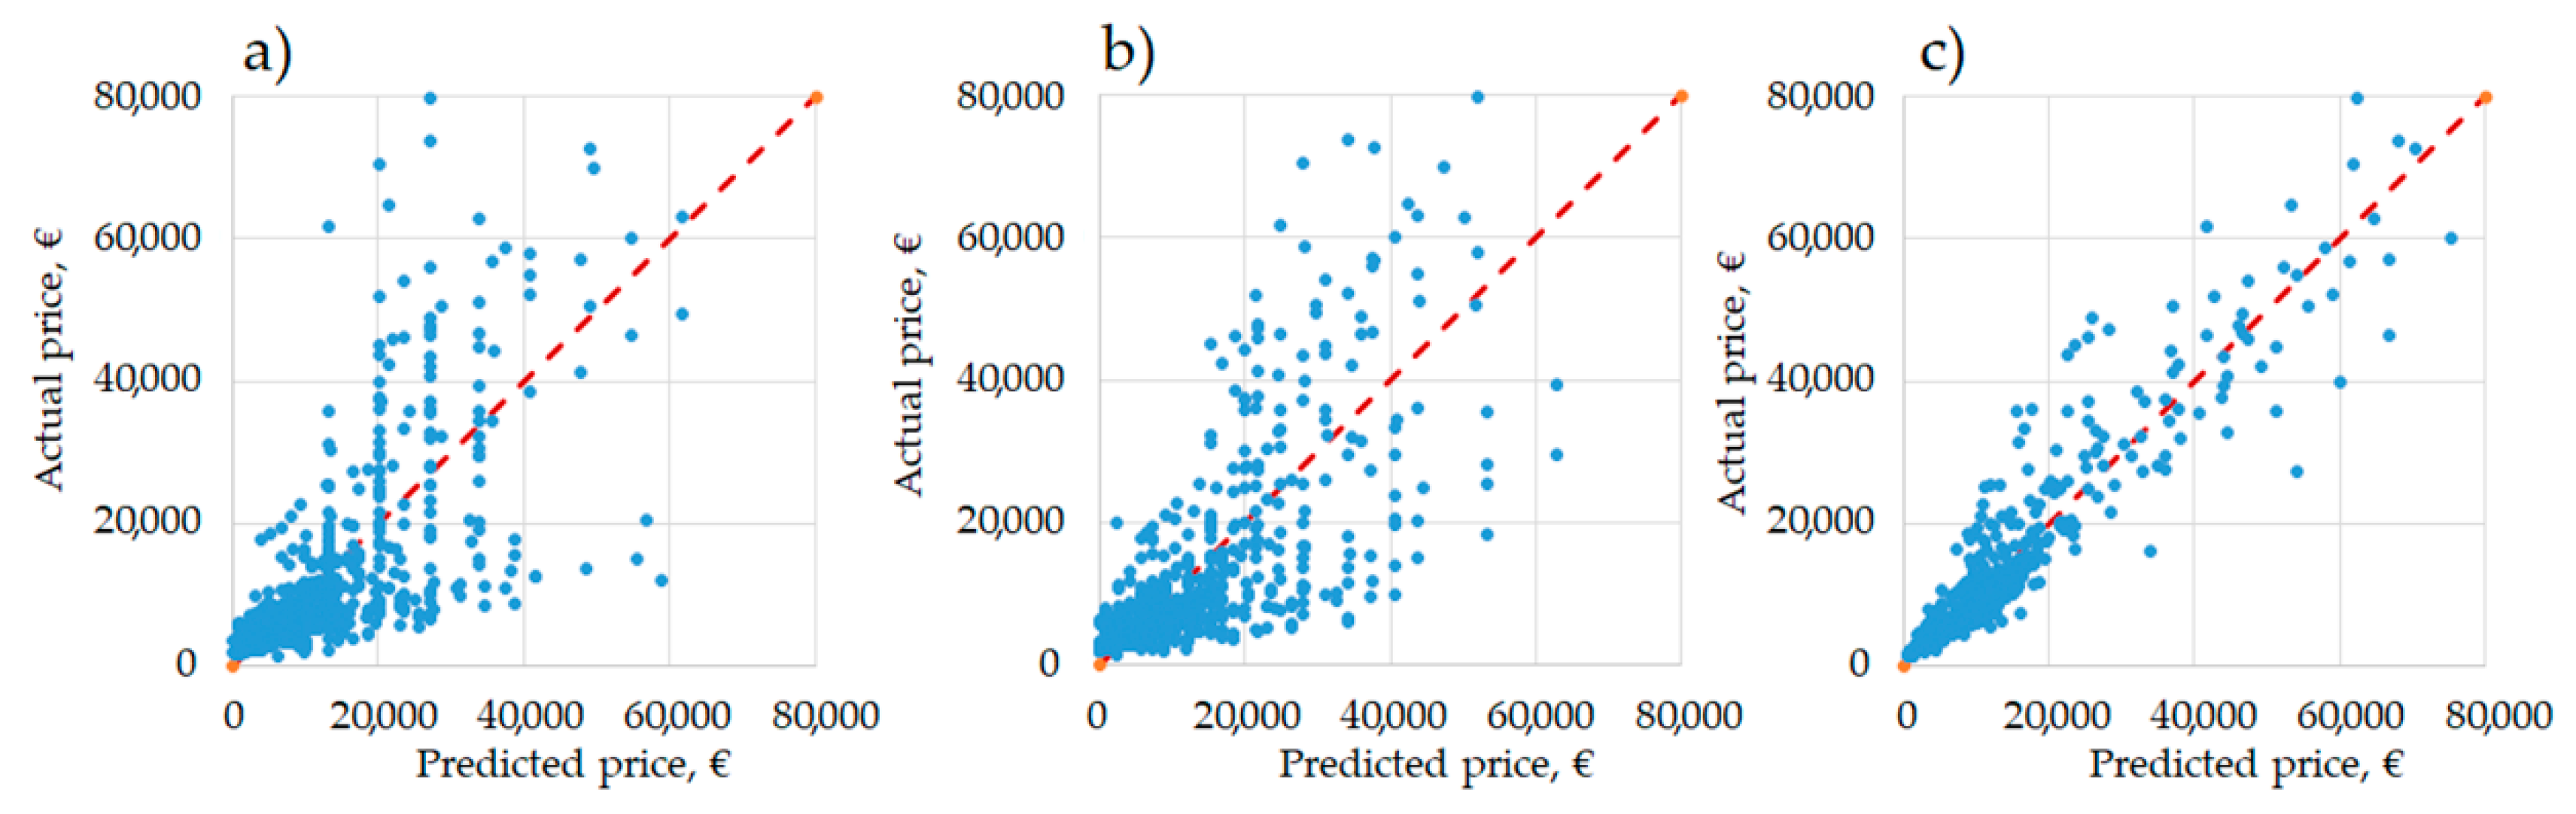
22]. The approach that has been used in analyzing the datasets of these studies involves the use of linear, multiple linear and second degree regression analyses to model the relation between variables and to evaluate the relevance of the model parameters. The choice of using linear, multi-linear and second degree modeling is explained by the need to obtain simplified models between the predictors and the price. Despite linear models having lower predicting capabilities compared to, e.g., stepwise regression analyses, their ease of use is a key factor for practical decision-making applications, especially if the aim is to simply obtain rough preliminary estimates. Instead, to obtain more accurate models and prediction of the parameters and price, stepwise regression analyses are used. Applied backward elimination method allows to evaluate the statistical significance of each independent variable included in the model analysis (power, mass, working width) and their relation to the response variable (e.g., price) providing more accurate and robust values. Therefore, multiple linear models have more complex structure and take into consideration more than one parameter, which guarantees higher predictive qualities. Also second degree regressions are reported, which however show only marginal increment of the prediction ability.
The statistical analyses were done with Microsoft Excel (Microsoft Corporation, Redmond, WA, USA).

3. Results and Discussion

3.1. Linear Modeling

The significant relevance of the technical parameters and adjustment issues are outlined below for each group of implements. Results of linear analyses are summarized in the form of equations. Detailed recommendations are stated for each tillage method and parameters to be considered. Linear analysis results are reported regarding the coefficient of determination R², standard error and p-values. It can be noticed that corresponding inverted models (e.g., price as a function of power and power as a function of price) present the same correlations (i.e., the same R²) but on the other hand converge to non-inverted equations. Such a phenomenon is due to the non-symmetrical behavior of linear regressions (see e.g., [41]): for this reason the full collection of models are reported here.

3.1.1. Plough

Results of linear analysis highlighted the general trends and the main correlations valid for the largest group of tillage implements. A high correlation was found between the power of the machine and the mass (R² = 0.67). The mass of the implement is highly related to the price of the implement as well (R² = 0.63). Power demand is linked to the working width, the expansion of the working width of the ploughs leads to the increase of the mass and, therefore, to the higher power demand and investment. Power value also depends on the depth of the cultivation. The tractor-implement hitching type and adjustment issues during work can lead to imbalance of the cultivation depth by increasing the penetration rate and impact the load of the tractor. Significant importance needs to be given to the combination of the power-working width association of the implement and operation speed because a small-size plough operating at double speed requires more power than a full-size one working with a lower rate [15]. Moreover, the maximum exploitation of the capacity is not always the most economic decision. Thus, before building the investment plan and priorities regarding any size of an implement and selecting the combination of the tractor-implement, the economic side of the needed capacity should be counted considering the cost of power. Relations of the parameters and linear models for their calculation are summarized in Table 3.
Figure 1 illustrates the relation of the most correlated parameters for ploughs. The analysis exhibited reliable results and forecasting features for dimensioning of the indicative values. The large variability of the considered models led to the slightly highlighted presence of two trends for the price definition. However, the main cluster of the values has pretty symmetric distribution. Residuals get larger as the prediction moves from small to large implements, meaning that in the case of the larger implements models have lower accuracy of the prediction for both power and price estimation based on the weight of the implements. Such heteroscedasticity features can be caused by the presence and impact of additional parameters that were not included in the study.
Regarding the indicative values of the parameters to be counted during planning and selection of the ploughs, at least 50 kW of power supply is required to operate one meter of working width with one tonne of mass. Concerning needed investment, 13,000 euro of investment has to be considered for each tonne of the tillage implement (Table 3).
A qualitative representation of price prediction based on working width, power and mass-based linear models is reported in Figure 2. A linearity can be clearly recognized but especially in the case of larger machinery, the deviations tend to increase. Therefore, in case a higher accuracy is needed, more detailed models should be applied, as will be discussed in the case of multiple linear and second-degree models.

3.1.2. Harrow

The correlation matrix for harrows has more robust appearance of dependencies compared to ploughs. Studied parameters expressed a strong relation with the implements’ price, allowing more reliable estimation of the financial needs to be performed in reference to a specific parameter. A strong correlation was found between the price and mass of the implements (R² = 0.83), and power and mass (R² = 0.75).
It is essential to take into account the implementation method of harrows as secondary or primary tillage tools. Due to that fact, the importance of the parameters changes and significant role in using the power is falling on the penetration and depth of the cultivation. Power requirements change for the operation of the same working width caused by cultivation depth. In the case of the harrows, applied for secondary tillage treatment, the depth of the cultivation is not crucial, as the main objective is the reduction of soil particles size, and the power requirements can have lower values. At the same time, it has high impact for primary tillage equipment. Linear models related to the main technical parameters of harrows are outlined in Table 4.
As in the case of ploughs, for harrows also larger models have a weaker prediction for the price according to the elaborated linear models based on the mass (Figure 3). The same trend was also observed for power requirements. Concerning the power–mass correlation, 30 kW of power supply is needed for the operation of one tonne of the mass, and an increase of 21 kW is suggested for each additional meter of working width. Regarding the price, the rate is shown to increase by 8000 € per meter of working width.
A qualitative representation of price prediction based on working width, power and mass based linear models is reported in Figure 4. A linearity can be clearly recognized to some extent also in the case of larger machinery. However, in case a higher accuracy is needed, also for harrows more detailed models should be applied, as will be discussed in the case of multiple linear and second-degree models.

3.1.3. Cultivator

Linear analysis of cultivators has expressed fairly similar correlations between studied variables as in the case of the harrows. The parallel behaviour can be explained by the relatively similar operation requirements and depth of the cultivation. A significant correlation between mass and price (R² = 0.89) has been observed, and relatively equal values for the remaining parameters (R² ≥ 0.6), as reported in Table 5.
Overestimated values of power and underestimated prices were observed after linear model evaluation for cultivators. As in the previous cases of implements large models of implements have less predictive qualities (Figure 5).
A qualitative representation of price prediction based on working width, power and mass based linear models is reported in Figure 6. A linearity can be again recognized, especially in the case of the linear model based on mass, while especially in the case of larger machinery, the deviations tend to increase for models based on working width and power. Also for cultivators, in case a higher accuracy is needed, more detailed models should be applied, as will be discussed in the case of multiple linear and second-degree models.

3.2. Multiple Linear Modeling

Tillage is a complex operation and requires a synchronized interplay of technical and performance parameters based on the soil requirements. At the same time, the operation performance has a direct impact on the further return of investment and quality of the yield. Linear models stated in the previous chapter might be applied for definition of the indicative values of the parameters and the corresponding price of the implement. However, for more accurate prediction and study of the multiple variable relations and their impact on the price, stepwise regression analyses were used. The method helps to investigate the most significant parameters from several involved independent variables and elaborates the final model. Thus, this provides higher accuracy of calculation, allowing better planning and association of the parameters. Models were evaluated in terms of adjusted multiple coefficients of determination (adjusted R²), p-values of all coefficients are lower than 0.01 (Table 6).
From the qualitative evaluation of the multi-linear models, shown in the following graphs (Figure 7), it can be seen that starting from a specific price of implements the prediction features of developed models express lower performance (as in the case of linear predictions). The difference between prediction and actual value increases the variance of error for a higher price and the magnitude of residuals appears to be increasing. A possible explanation for this behaviour might be that the simple model is omitting some explanatory variables that have a higher impact on higher prices.

3.3. Second-Degree Modeling

In order to verify the presence of a second-order function describing the predicting dependencies, a further analysis was carried out, and main results are here reported. Second-degree regression was then applied, producing models for ploughs (see Table 7), harrows (Table 8) and cultivators (Table 9). In the case of ploughs, the improvement was recognizable in particular in the case of power prediction as a function of price, where the coefficient of determination increased from R² = 0.36 to R² = 0.48 and in the case of mass prediction as a function of price, where the coefficient of determination increased from R² = 0.63 to R² = 0.70. Second-order regression applied to harrow parameters did not improve in a significant way the extraction of prediction model, as shown recognizably from the coefficient of determination which on average increased by less than 0.015. Conversely, better results have been highlighted in the case of cultivators. In particular, for working width second degree models, a higher improvement was recognized: in the first case the coefficient of determination increased on average by 0.06, while in the second case by 0.04 on average.

3.4. Application of Models

Provided models allow to predict prices starting from power, working width and mass, by means of linear or non-linear models. Similar equations allow power or working width or mass to be predicted, taking advantage of one or more than one of the remaining parameters. The application of price prediction models is important not only whenever the return on investment of machinery has to be estimated, but also when a farmer or a researcher want to characterize the added value of a given agricultural operation in a field management process. Power prediction models are typically implemented in order to verify the suitability of new machinery with available tractor power, and thus verify the appropriateness of a new implement with an existing farm fleet. On the other hand, working width plays an important role in the overall performances of agricultural implements, mainly in terms of working capacity and maneuverability. For this reason working width prediction models are needed in order to foresee working time and appropriateness with respect to fields dimensions. Both power and working width equations can be usefully implemented into DSS which might support farmers in the definition of the optimal farm fleet, on the basis of farm size and available machinery. Finally, mass equations are relevant for two reason. Firstly the total weight (tractor and implement) along with tires or tracks dimensions, gives a measure of the vertical pressure: therefore, such information can be used in order to optimize soil stress, on the basis of its bearing resistance to vertical loads and moments. Secondly, mass along with power is used to measure energy and equivalent CO2 impact of agricultural operations (see e.g., [42]): therefore such models can be implemented in order to quantify the environmental impact of agricultural machinery when operated for given agricultural operations.

4. Conclusions

Tillage operation management requires precise planning and adjustment of the power unit, implement, and operation performance. Consideration of soil structure and corresponding tractor-implement association are required for effective operation management, productivity and return of investment. To this end, a systematic approach and consideration of the operation should be considered as an interrelated chain of the parameters and factors that impact quality and costs. In the present paper, a modelling approach was implemented for definition of parameter-price relation, simplification of the machinery unit selection process and decision making. Performed analyses allowed us to investigate the main relevant technical parameters of tillage implements, quantifying their impact, and elaborating prediction models for price, power, mass and working width. Linear and multiple linear models were provided for each group of studied implements. The dependencies between studied parameters expressed high values for harrows and cultivators and provided better predictive qualities, especially for price-mass relation (R2 > 0.8). For ploughs, power and mass relation has a primary output (R2 = 0.7). Therefore, approximately 1000 euro of investment has to be counted for each 0.1t of the tillage implement. On average, for all groups of implements power of 40 kW is needed for operation of an implement with one meter of working width. Both linear and multiple linear models showed a comparatively high error of prediction for all groups of implements regarding larger equipment models.
Besides the simplicity of the application, proposed prediction models allow a valid assessment of price on the base of technical parameters. Proposed models are subject to obsolescence: however, based on the response of provided model, it is in the intention of the authors to provide regular updates of the models for all of the published implements, with a five-year frequency. Such a frequency seems to be acceptable, based on market and model evolution in the last 20 years. Such models or updated models might be applied to manage existing fleets, to program and optimize appropriate combinations and adjustment of a tractor and implement, or in the replacement phase to calculate the required investments. Models can be applied for economic and environmental assessment of agricultural production, for planning and quantification of the costs (operation, farm, production), design of the farm fleet and evaluation and reduction of machinery-associated emissions. Practical application of the models can be useful for comparison analysis of crop cultivation methods (conventional, conservation, precision), technologies, strategies and their economic feasibility from machinery unit acquisition and management point of view. The latter will allow investments to be correctly managed based on real farm needs and the selection of the right machinery management approach. Knowing and managing available resources will allow better management of the farm and production to be performed, simplifying the decisions regarding selection, cultivation and application.

Author Contributions

Conceptualization, T.Y. and F.M.; methodology, T.Y. and F.M.; software, T.Y., M.B. and S.T.; validation, F.M., T.Y. and S.T.; formal analysis, T.Y. and F.M.; investigation, T.Y. and F.M.; resources, G.A., T.Y. and M.B.; data curation, T.Y.; writing—original draft preparation, T.Y.; writing—review and editing, F.M., S.T. and T.Y.; visualization, T.Y.; supervision, F.M., S.T. and L.S.; project administration, L.S.; funding acquisition, L.S. and F.M. All authors have read and agreed to the published version of the manuscript.

Funding

This research was partially funded by project Total Trac, funded by the EU under the POR-FESR 2014–2020 Veneto Region Program, grant number 10226929.

Institutional Review Board Statement

Not applicable.

Informed Consent Statement

Not applicable.

Data Availability Statement

Data presented in this study are available on request from the corresponding author.

Acknowledgments

Research activity of T.Y. is supported by a PhD grant issued by Fondazione Cassa di Risparmio di Padova e Rovigo (CARIPARO).

Conflicts of Interest

The authors declare no conflict of interest.

References

  1. Agriculture Canada. An Economic Evaluation of Soil Tillage Technologies. Report; Agriculture Canada: Guelph, ON, Canada, 1992. [Google Scholar]
  2. Cavallo, E.; Ferrari, E.; Bollani, L.; Coccia, M. Attitudes and behaviour of adopters of technological innovations in agricultural tractors: A case study in Italian agricultural system. Agric. Syst. 2014, 130, 44–54. [Google Scholar] [CrossRef]
  3. Keller, T.; Sandin, M.; Colombi, T.; Horn, R.; Or, D. Historical increase in agricultural machinery weights enhanced soil stress levels and adversely affected soil functioning. Soil Tillage Res. 2019, 194, 104293. [Google Scholar] [CrossRef]
  4. Aguilera, E.; Guzmán, G.I.; Infante-Amate, J.; David Soto, D.; Roberto García-Ruiz, R.; Herrera, A.; Villa, I.; Torremocha, E.; Carranza, G.; de González Molina, M. Embodied Energy in Agricultural Inputs. Incorporating a Historical Perspective. DT-SEHA 1507. 2015. Available online: https://ideas.repec.org/p/seh/wpaper/1507.html (accessed on 27 February 2021).
  5. Chamen, T. Controlled Traffic Farming—From Worldwide Research to Adoption in Europe and its Future Prospects. Acta Technol. Agric. 2015, 18, 64–73. [Google Scholar] [CrossRef] [Green Version]
  6. Cillis, D.; Maestrini, B.; Pezzuolo, A.; Marinello, F.; Sartori, L. Modeling soil organic carbon and carbon dioxide emissions in different tillage systems supported by precision agriculture technologies under current climatic conditions. Soil Tillage Res. 2018, 183, 51–59. [Google Scholar] [CrossRef]
  7. Chen, G. Advances in Agricultural Machinery and Technologies; Taylor & Francis Group: Boca Raton, FL, USA, 2018. [Google Scholar]
  8. Jörgensen, C.; Persson, M. The Market for Tractors in the EU Price Differences and Convergence; No. 35; FACTOR MARKETS Coordination: Centre for European Policy Studies, CEPS: Brussels, Belgium, 2013. [Google Scholar]
  9. Fuchs, C.; Kasten, J.; Urbanek, M. Trends and potential of the market for combine harvesters in Germany. Machines 2015, 3, 364–378. [Google Scholar] [CrossRef] [Green Version]
  10. Basch, G.; Kassam, A.; González-Sánchez, E.J.; Streit, B. Making Sustainable Agriculture Real in CAP 2020. The Role of Conservation Agriculture 2011|2012; The European Conservation Agriculture Federation (ECAF): Brussels, Belgium, 2012. [Google Scholar]
  11. González-Sánchez, E.J.; Kassam, A.; Basch, G.; Streit, B.; Holgado-Cabrera, A.; Paula Triviño-Tarradas, P. Conservation Agriculture and its contribution to the achievement of agri-environmental and economic challenges in Europe. Aims Agric. Food 2016, 1, 387–408. [Google Scholar] [CrossRef]
  12. European Agricultural Machinery Industry. Advancing Agricultural Machinery and Solutions for Sustainable Farming. Report; European Agricultural Machinery Industry Association (CEMA): Brussels, Belgium, 2019; Available online: https://www.cema-agri.org (accessed on 18 June 2020).
  13. Paraforos, D.S.; Vangelis Vassiliadis, V.; Kortenbruck, D.; Stamkopoulos, K.; Ziogas, V.; Sapounas, A.A.; Griepentrog, H.W. A Farm Management Information System Using Future Internet Technologies. IFAC-PapersOnLine 2016, 49, 324–329. [Google Scholar] [CrossRef]
  14. Fountas, S.; Wulfsohn, D.; Blackmore, B.S.; Jacobsen, H.L.; Pedersen, S.M. A model of decision-making and information flows for information-intensive agriculture. Agric. Syst. 2006, 87, 192–210. [Google Scholar] [CrossRef]
  15. Bochtis, D.D.; Sørensen, C.G.C.; Busato, P. Advances in agricultural machinery management: A review. Biosyst. Eng. 2014, 126, 69–81. [Google Scholar] [CrossRef]
  16. Sørensen, C.G.; Pesonen, L.; Bochtis, D.D.; Vougioukas, S.G.; Suomi, P. Functional requirements for a future farm management information system. Comput. Electron. Agric. 2011, 76, 266–276. [Google Scholar] [CrossRef]
  17. Søgaard, H.T.; Sørensen, C.G. A model for optimal selection of machinery sizes within the farm machinery system. Biosyst. Eng. 2004, 89, 13–28. [Google Scholar] [CrossRef]
  18. Sørensen, C.G.; Bochtis, D.D. Conceptual model of fleet management in agriculture. Biosyst. Eng. 2010, 105, 41–50. [Google Scholar] [CrossRef]
  19. Cavallo, E.; Ferrari, E.; Bollani, L.; Coccia, M. Strategic management implications for the adoption of technological innovations in agricultural tractor: The role of scale factors and environmental attitude. Technol. Anal. Strateg. Manag. 2014, 26, 765–779. [Google Scholar] [CrossRef]
  20. Yezekyan, T.; Marinello, F.; Armentano, G.; Trestini, S.; Sartori, L. Definition of Reference Models for Power, Weight, Working Width, and Price for Seeding Machines. Agriculture 2018, 8, 186. [Google Scholar] [CrossRef] [Green Version]
  21. Yezekyan, T.; Marinello, F.; Armentano, G.; Sartori, L. Analysis of cost and performances of agricultural machinery: Reference model for sprayers. Agron. Res. 2018, 16, 604–614. [Google Scholar]
  22. Yezekyan, T.; Marinello, F.; Armentano, G.; Trestini, S.; Sartori, L. Modelling of Harvesting Machines’ Technical Parameters and Prices. Agriculture 2020, 10, 194. [Google Scholar] [CrossRef]
  23. Bauer, L.; McEvoy, M.J. An Economic Evaluation of Tillage Systems on Dark Brown Soils in Alberta; Farming for the Future Report Nos. 84-0360 and 87-0093; University of Alberta: Edmonton, AB, Canada, 1990. [Google Scholar]
  24. Fletcher, J.J.; Featherstone, A.M. An Economic Analysis of Tillage and Timeliness Interactions in Corn-Soybean Production. North Cent. J. Agric. Econ. 1987, 9, 207–215. [Google Scholar] [CrossRef]
  25. Hunt, D. Farm Power and Machinery Management, 8th ed.; Waveland Press: Long Grove, IL, USA, 1983. [Google Scholar]
  26. Lassen, P.; Lamandé, M.M.; Stettler, M.; Keller, T.T.; Jørgensen, M.S.; Lilja, H.; Alakukku, L.; Pedersen, J.; Schjønning, P. Terranimo®—A Soil Compaction Model with internationally compatible input options. In Proceedings of the EFITA-WCCA-CIGR Conference “Sustainable Agriculture through ICT Innovation”, Turin, Italy, 24–27 June 2013. [Google Scholar]
  27. Renius, K.T. Fundamentals of Tractor Design; Springer Nature Switzerland AG: Cham, Switzerland, 2020. [Google Scholar]
  28. Alcock, R. Tractor-Implement Systems; AVI Publishing CO., INC.: Westport, CT, USA, 1986. [Google Scholar]
  29. Scoyille, O.J. Relationship between Size of Farm and Utilization of Machinery, Equipment and Labor on Nebraska Corn-Livestock Farms; Technical Bulletin No. 1037; Bureau of Agricultural Economics, USDA: Washington, DC, USA, 1951. [Google Scholar]
  30. Borsato, E.; Galindo, A.; Tarolli, P.; Sartori, L.; Marinello, F. Evaluation of the grey water footprint comparing the indirect effects of different agricultural practices. Sustainability 2018, 10, 3992. [Google Scholar] [CrossRef] [Green Version]
  31. Cogato, A.; Pezzuolo, A.; Sørensen, C.G.; De Bei, R.; Sozzi, M.; Marinello, F. A GIS-Based Multicriteria Index to Evaluate the Mechanisability Potential of Italian Vineyard Area. Land 2020, 9, 469. [Google Scholar] [CrossRef]
  32. Sørensen, C.G.; Nielsen, V. Operational Analyses and Model Comparison of Machinery Systems for Reduced Tillage. Biosyst. Eng. 2005, 92, 143–155. [Google Scholar] [CrossRef]
  33. Mudarisova, S.G.; Gabitova, I.I.; Lobachevsky, Y.P.; Mazitov, N.K.; Rakhimov, R.S.; Khamaletdinova, R.R.; Rakhimova, I.R.; Farkhutdinova, I.M.; Mukhametdinova, A.M.; Gareeva, R.T. Modeling the technological process of tillage. Soil Tillage Res. 2019, 190, 70–77. [Google Scholar] [CrossRef]
  34. Damanauskas, V.; Velykis, A.; Satkus, A. Efficiency of disc harrow adjustment for stubble tillage quality and fuel consumption. Soil Tillage Res. 2019, 194, 104311. [Google Scholar] [CrossRef]
  35. Alele, J.O.; Ngunjiri, G.; Njue, M.R. Effects of Depth and Speed on Power Requirements for Disc and Mouldboard Ploughs in Silt Loam Soils. Int. J. Sci. Technol. Res. 2018, 7, 167–174. [Google Scholar]
  36. Serrano, J.M.; Peca, J.O.; Marques da Silva, J.; Pinheiro, A.; Carvalho, M. Tractor energy requirements in disc harrow systems. Biosyst. Eng. 2007, 98, 286–296. [Google Scholar] [CrossRef]
  37. Moitzi, G.; Haas, M.; Wagentristl, H.; Boxberger, A.; Gronauer, A. Energy consumption in cultivating and ploughing with traction improvement system and consideration of the rear furrow wheel-load in ploughing. Soil Tillage Res. 2013, 134, 56–60. [Google Scholar] [CrossRef]
  38. ASAE. D497.4: Agricultural Machinery Management Data. In ASABE Standards; American Society of Agricultural Engineers (ASAE): St. Joseph, MI, USA, 2003. [Google Scholar]
  39. Edwards, W. Estimating Farm Machinery Repair Costs. Extension and Outreach, Ag Decision Maker; Iowa State University: Ames, IA, USA, 2015; Volume A3-29. [Google Scholar]
  40. Sopegno, A.; Calvo, A.; Berruto, R.; Busato, P.; Bocthis, D. A web mobile application for agricultural machinery cost analysis. Comput. Electron. Agric. 2016, 130, 158–168. [Google Scholar] [CrossRef]
  41. Draper, N.R.; Smith, H. Applied Regression Analysis, 3rd ed.; John Wiley and Sons: New York, NY, USA, 1998; p. 19. ISBN 0-471-17082-8. [Google Scholar]
  42. Boscaro, D.; Pezzuolo, A.; Grigolato, S.; Cavalli, R.; Marinello, F.; Sartori, L. Preliminary analysis on mowing and harvesting grass along riverbanks for the supply of anaerobic digestion plants in north-eastern Italy. J. Agric. Eng. 2015, 46, 100–104. [Google Scholar] [CrossRef] [Green Version]
Figure 1. Plots of standard residuals based on the linear prediction models for power (a) and price (b) for ploughs.
Agriculture 11 00197 g001
Figure 2. Qualitative evaluation for plough price prediction after application of linear models based on (a) working width, (b) power and (c) mass.
Agriculture 11 00197 g002
Figure 3. Plots of standard residuals based on the linear prediction models for price (a) and power (b) for harrows.
Agriculture 11 00197 g003
Figure 4. Qualitative evaluation for harrow price prediction after application of linear models based on (a) working width, (b) power and (c) mass.
Agriculture 11 00197 g004
Figure 5. Plots of standard residuals based on the linear prediction models for price (a) and power (b) for cultivators.
Agriculture 11 00197 g005
Figure 6. Qualitative evaluation for cultivators price prediction after application of linear models based on (a) working width, (b) power and (c) mass.
Agriculture 11 00197 g006
Figure 7. Qualitative evaluation of the multi-linear models for price prediction for all groups of tillage implements: (a) ploughs, (b) harrows and (c) cultivators.
Agriculture 11 00197 g007
Table 1. Main technical and descriptive information related to the tillage implements.
Characteristic Description/Type
Modelconstructing company, series, name
Type of implementplough, harrow, cultivator
Working element type moldboard, disc, cylindrical, tooth, etc.
Working element parameters number of working elements, distance between elements, dimensions
Attachment methodmounted, semi-mounted, trailed
Other parametersrequired power, working deepness, etc.
Dimensionsworking width, transport dimensions, mass
List pricebasic implement configuration provided by producer
Table 2. The range of the studied parameters’ values corresponding to the database.
Variable PloughHarrowCultivator
Required power, kW30–27015–3007–300
Mass, kg400–4900160–9600100–10,000
Working width, m0.4–40.9–90.85–10
Number of working elements1–93–1002–80
Price VAT excl., k€4–882–901.2–12
Table 3. Reference linear models for calculation of technical parameters and price of ploughs.
PriceSt. Errorp-Value
Pr = 160P + 33000.3610,100< 0.01
Pr = 13M − 1380.637700< 0.01
Pr = 14.9·103L − 37600.489150< 0.01
PowerSt. Errorp-value
P = 2.2·10−3Pr + 620.3637< 0.01
P = 0.050M + 280.6727< 0.01
P = 50.2L + 250.4036< 0.01
MassSt. Errorp-value
M = 0.048Pr + 6140.63470< 0.01
M = 13.4P + 1600.67440< 0.01
M = 873L + 1670.45570< 0.01
Working WidthSt. Errorp-value
L = 0.032·10−3Pr + 0.990.480.43< 0.01
L = 7.9·10−3P + 0.800.400.44< 0.01
L = 0.51·10−3M + 0.830.450.46< 0.01
P—power, kW; M—mass, kg; L—working width, m; Pr—estimated price, €.
Table 4. Reference linear models for calculation of technical parameters and prices of harrows.
PriceSt. Errorp-Value
Pr = 233P − 22650.688480<0.01
Pr = 8.82M + 15670.836135<0.01
Pr = 8208L − 10,3500.658925<0.01
PowerSt. Errorp-value
P = 2.9·10−3Pr + 360.6830<0.01
P = 0.030M + 330.7527<0.01
P = 28L − 7.50.6034<0.01
MassSt. Errorp-value
M = 0.095Pr + 1900.83635<0.01
M = 25P − 3350.75773<0.01
M = 806L − 8980.581010<0.01
Working WidthSt. Errorp-value
L = 79·10−6Pr + 2.10.650.88<0.01
L = 0.021P + 1.70.600.65<0.01
L = 0.72·10−3M + 2.20.580.95<0.01
P—power, kW; M—mass, kg; L—working width, m; Pr—estimated price, €.
Table 5. Reference linear models for calculation of technical parameters and prices of cultivators.
PriceSt. Errorp-Value
Pr = 215P − 38200.5311500<0.01
Pr = 9.6M − 416 0.895540<0.01
Pr = 6910L − 74900.4812000<0.01
PowerSt. Errorp-value
P = 2.4·10−3Pr + 480.5339<0.01
P = 0.026M + 430.5836.5<0.01
P = 25L + 5.50.5438<0.01
MassSt. Errorp-value
M = 0.093Pr + 1990.89546<0.01
M = 22.4P − 3420.581067<0.01
M = 707L − 6920.521150<0.01
Working WidthSt. Errorp-value
L = 70·10−6Pr + 2.10.481.2<0.01
L = 0.022P + 1.30.541.1<0.01
L = 0.74·10−3M + 2.00.521.2<0.01
P—power, kW; M—mass, kg; L—working width, m; Pr—estimated price, €.
Table 6. Multiple linear models for main technical parameters and price (power, mass, working width) of tillage implements.
PriceAdjusted R²Standard Error
PloughPr = 12M − 60P + 7040L − 43000.697080
HarrowPr = 2640L + 6.9M − 41500.865600
CultivatorPr = 9.6M − 4160.895540
PowerAdjusted R²Standard Error
PloughP = 0.044M + 12L + 180.6827
HarrowP = 9L + 0.023M + 13.30.8025
CultivatorP = 13L + 0.017M + 170.6633
MassAdjusted R²Standard Error
PloughM = 10.7P + 334L − 1060.70410
HarrowM = 249L + 20P − 746 0.80740
CultivatorM = 337L + 15P − 7740.64990
Working widthAdjusted R²Standard Error
PloughL = 0.35·10−3M + 3.1·10−3P + 0.740.470.43
HarrowL = 0.012P + 0.37·10−3M + 1.80.630.90
CultivatorL = 0.013P + 0.39·10−3M + 1.40.601.07
P—power, kW; M—mass, kg; L—working width, m; Pr—estimated price, €.
Table 7. Reference second order models for calculation of technical parameters and prices of plough.
PriceAdjusted R²Standard Error
Pr =261P − 0.37P² − 23500.3610,070
Pr =15M − 0.50·10−3M² − 18600.637750
Pr = 428L + 4000L² + 77900.508900
PowerAdjusted R²Standard Error
P = 6.0·10−3Pr − 55.3·10−9 Pr² + 180.4834
P = 0.07M − 4.43·10−6 M² + 130.6727
P = 21.7L + 7.9L² + 480.4036
MassAdjusted R²Standard Error
M= 0.097Pr − 0.743·10−6 Pr² + 210.70418
M= 17P − 0.014P² − 610.67440
M= 182L + 191L² + 7190.46560
Working WidthAdjusted R²Standard Error
L= 55.6·10−6 Pr − 0.352·10−9 Pr² + 0.70.500.41
L= 8.6·10−3 P − 2.8·10−6 P² + 0.750.400.46
L = 0.6·10−3 M − 19·10−9 M² + 0.760.450.44
P—power, kW; M—mass, kg; L—working width, m; Pr—estimated price, €.
Table 8. Reference second order models for calculation of technical parameters and prices of harrows.
PriceAdjusted R²Standard Error
Pr = 198P+ 0.14P² − 6560.688470
Pr = 12.4M − 0.51·10−3 M² − 23000.855770
Pr = 9930L − 194L² − 13,6000.658900
PowerAdjusted R²Standard Error
P = 4.2·10−3 Pr − 20.5·10−9 Pr² + 24.30.7030
P = 0.045M − 2.13·10−6 M² + 170.7825
P = 47.2L − 2.2L² − 44.60.6133.2
MassAdjusted R²Standard Error
M = 0.1Pr – 0.14·10−6 Pr² + 1070.83635
M = 17.8P + 0.03P² + 140.76765
M=1100L − 33.2L² − 14600.591000
Working WidthAdjusted R²Standard Error
L = 0.125·10−3 Pr − 0.74·10−9 Pr² + 1.660.670.84
L = 0.027P − 22.5·10−6 P² + 1.40.600.94
L = 1.1·10−3 M − 61.5·10−9 M² + 1.70.610.92
P—power, kW; M—mass, kg; L—working width, m; Pr—estimated price, €.
Table 9. Reference second order models for calculation of technical parameters and prices of cultivators.
PriceAdjusted R²Standard Error
Pr = 141P + 0.31P² − 8510.5311,500
Pr = 9.2M + 45·10−6M² − 1400.905540
Pr = 5440L + 169L² − 50400.4912,080
PowerAdjusted R²Standard Error
P = 4.2·10−3 Pr − 23·10−9 Pr² + 340.5936.5
P = 0.05M − 3.2·10−6 M² + 23.30.6533.4
P = 47.8L − 2.64L² − 330.5936
MassAdjusted R²Standard Error
M = 0.11Pr − 0.19·10−6Pr² + 840.90534
M = 16P + 0.026P² − 930.591060
M = 625L + 9.4L² − 5560.521150
Working WidthAdjusted R²Standard Error
L = 0.11·10−3 Pr − 0.6·10−9 Pr² + 1.750.531.16
L = 0.033P − 45·10−6 P² + 0.850.561.13
L = 1.2·10−3 M − 68·10−9 M² + 1.60.561.13
P—power, kW; M—mass, kg; L—working width, m; Pr—estimated price, €.
Publisher’s Note: MDPI stays neutral with regard to jurisdictional claims in published maps and institutional affiliations.

