Article

Bringing Semantics to the Vineyard: An Approach on Deep Learning-Based Vine Trunk Detection

by
André Silva Aguiar
1,2,*,
Nuno Namora Monteiro
3,
Filipe Neves dos Santos
1,
Eduardo J. Solteiro Pires
1,2,
Daniel Silva
1,2,
Armando Jorge Sousa
1,3 and
José Boaventura-Cunha
1,2
1
INESC TEC—INESC Technology and Science, 4200-465 Porto, Portugal
2
School of Science and Technology, University of Trás-os-Montes e Alto Douro, 5000-801 Vila Real, Portugal
3
Faculty of Engineering, University of Porto, 4200-465 Porto, Portugal
*
Author to whom correspondence should be addressed.
Agriculture 2021, 11(2), 131; https://doi.org/10.3390/agriculture11020131
Submission received: 18 January 2021 / Revised: 29 January 2021 / Accepted: 1 February 2021 / Published: 5 February 2021
(This article belongs to the Section Digital Agriculture)

Abstract

:
The development of robotic solutions in unstructured environments brings several challenges, mainly in developing safe and reliable navigation solutions. Agricultural environments are particularly unstructured and, therefore, challenging to the implementation of robotics. An example of this is the mountain vineyards, built-in steep slope hills, which are characterized by satellite signal blockage, terrain irregularities, harsh ground inclinations, and others. All of these factors impose the implementation of precise and reliable navigation algorithms, so that robots can operate safely. This work proposes the detection of semantic natural landmarks that are to be used in Simultaneous Localization and Mapping algorithms. Thus, Deep Learning models were trained and deployed to detect vine trunks. As significant contributions, we made available a novel vine trunk dataset, called VineSet, which was constituted by more than 9000 images and respective annotations for each trunk. VineSet was used to train state-of-the-art Single Shot Multibox Detector models. Additionally, we deployed these models in an Edge-AI fashion and achieve high frame rate execution. Finally, an assisted annotation tool was proposed to make the process of dataset building easier and improve models incrementally. The experiments show that our trained models can detect trunks with an Average Precision up to 84.16% and our assisted annotation tool facilitates the annotation process, even in other areas of agriculture, such as orchards and forests. Additional experiments were performed, where the impact of the amount of training data and the comparison between using Transfer Learning and training from scratch were evaluated. In these cases, some theoretical assumptions were verified.

1. Introduction

The development of robotic solutions in unstructured environments brings several challenges, mainly in developing safe and reliable navigation solutions. Agricultural environments are particularly unstructured and, therefore, challenging to the implementation of robotics. The Douro vineyards (Figure 1) are a great example of this.
These are located in the Douro Demarched Region, the oldest controlled winemaking region in the world, a UNESCO heritage place [1], and they are built in steep slope hills. The hill’s characteristics cause signal blockage that decreases the accuracy of signals thtat are emitted by the Global Navigation Satellite System (GNSS), which makes the use of, for example, the standard Global Positioning System (GPS), unreliable. Additionally, the terrain that is highly characterized by irregularities leads to the high inaccuracy of sensors, like wheel odometry and Inertial Measurement Units (IMU)s [2].
The vast extension of the vineyards and their challenging conditions lead to an increasing need for human labor substitution by automatic and autonomous machines. These machines can be used to perform operations, such as planting, harvesting, monitoring, supply of water, and nutrients [3]. Moreover, they can transform and have a significant impact on many agricultural economic sectors [4]. For mobile robots, the capability of autonomously navigating in steep slope vineyards has a mandatory requirement: real-time localization. For a robot to navigate safely in the vineyard, it needs to be able to localize itself. Feature-based localization is one of the most common approaches to do so [5,6,7]. However, the extraction of reliable and persistent features in an outdoor environment is a challenging task. The vineyard context makes sense to provide the robot with the ability to recognize vine trunks as high-level features to use in the localization and mapping processes. The robot can be endowed with camera systems and artificial intelligence to learn what a trunk is. Moreover, the application of robotics in these tasks can have impact in the agricultural economic sector [4]. However, real-time localization is an essential requiremen in implementing mobile robotics in agriculture. Usually, in steep slope vineyards, the localization approaches should work in the absence of satellite-based systems. Thus, the implementation of these algorithms is a challenging task, due to the characteristic unstructured scenes that compose these environments [8]. In this context, natural features can be used as landmarks in the localization procedure [5,6,7]. In the vineyard, vine trunks can be used to this effect, allowing for localizing the robot and simultaneously creating a semantic map of the environment. Thus, the robotic platform should be capable to perceive the scene and recognize these features. In other words, the robot has a semantic perception of the environment.In order to perform such tasks, Deep Learning (DL)-based object detection [9] can be used. DL [10,11] allows for a machine to learn to classify, detect, and segment objects using a given training dataset. Convolutional Neural Networks (CNN)s are widely used to perform such a task. They showed the highest performance levels in several contests in machine learning and pattern recognition [12]. Despite this, training a CNN from scratch, and obtaining accurate results while deploying it on a real scenario, assumes that both training and test data must be in the same feature space, and they have the same distribution [13]. However, in some real-world scenarios, data collection can be challenging and time-expensive. In order to overcome this limitation, learners can be trained with data easily collected from different domains [14,15,16]. In other words, the learning procedure can be performed, transferring knowledge from a given task that was already learned, and the training procedure can focus on a subset of layers of the CNN. This methodology is called Transfer Learning (TL) [17]. Image classification and object detection based on DL techniques are widely present in the agriculture sector, endowing machines with the capability to perform operations in the agriculture context, such as plant disease detection, weed identification, seed identification, fruit detection and counting, obstacle detection, and others [18,19,20].
Given all of the above, this work proposes using DL algorithms to detect vine trunks in a fast and precise way and while considering Edge-AI concepts. The main goal is to compute reliable semantic landmarks to use in Simultaneous Localization and Mapping (SLAM) pipelines of agricultural robots. In the current state-of-the-art, DL’s use to detect tree trunks is still an area quite under developed, as described in Table 1. Badeka et al. [21] propose a DL-based approach to detect vine trunks. The authors developed a dataset with 899 vineyard images and trained two different architectures: faster regions-convolutional neural network (Faster R-CNN) [22] and You Only Look Once version (YOLO) [23]. The results show that, in the best case, this work achieved an Average Precision (AP) of 72.3% and an execution time performance of 29.6 ms. The remaining state-of-the-art approaches use conventional image processing and range-based techniques in order to detect tree trunks in agricultural contexts.
Table 1. Summary of the current state-of-the-art regarding tree trunk detection in agricultural contexts.
ReferenceApproachPerformance
Badeka et al. [21]Deep Learning-based vine trunk detection. Uses Faster R-CNN and two YOLO versions.Average Precision of 73.2% and execution time of 29.6 ms.
Lamprecht et al. [24]Detection based on Airbone Laser Scanning. Uses a Crown Base Height estimation and 3D clustering to isolate laser points on tree trunks.Detection rate of 75% and overall accuracy of 84%.
Shalal et al. [25]Orchard tree detection using a camera and a laser sensor. Based on image segmentation and data fusion techniques.Average rate of detection confidence of 82.2%.
Xue et al. [26]Uses a camera and a laser sensor to detect and measure the trunk width. Algorithm based on data fusion and decision with Dempster-Shafer theory.Trunk width measurement with error rates from 6% to 16.7%.
Juman et al. [27]Ground removal by colour space combination and segmentation and trunk detection using the Viola-Jones detector.Detection rate of 97.8%.
Bargoti et al. [28]Implements a Hough transformation to extract trunk candidates, and uses pixelwise classification to update their likelihood of being a tree trunk.87–96% accuracy during the preharvest season, and 99% accuracy during the flowering season.
Colmenero-Martinez et al. [29]Uses an infrared sensor to detect tree trunks.Detection rate of 91%.
For example, Lamprecht et al. [24] use Airbone Laser Scanning to detect tree trunks. The authors studied their approach in an area of 109 trees and achieved an overall accuracy of 84%. Aiming to build a map of the orchard that is to be used in the mobile robotics context, Shalal et al. [25] use a camera and range sensor to detect trunks. This work uses image segmentation and data fusion techniques. Xue et al. [26] use a camera and laser sensor to detect and measure the trunk width. The experiments were conducted on 120 trees and 40 images, resulting in an error rate of 6% to 16.7%. Juman et al. [27] combine a ground removal technique with the Viola–Jones algorithm to detect trunks. This work is proposed in order to perform autonomous navigation in oil-palm plantations, and it achieves a detection rate of 97.8%. Bargoti et al. [28] propose the detection of tree trunks in structured apple orchards. The authors implement a Hough transform to extract trunk candidates, and use pixelwise classification to update their detection likelihood.
In other agricultural contexts, DL is highly present in the detection of natural agents. Fruit detection in orchards ishe most common application. Moreover, some works focus on obstacle and insect detection, as well as pest identification. The majority of works focus on fruit detection, mainly in orchards. Relative to these works, fruit counting is the most common application. Additionally, a minority of the state-of-the-art focuses on insect detection for pest identification and obstacle detection. Overall, most of the works present high performance with Average Precision (AP) or F1 scores higher than 80%. Table 2 provides a summary of these works.
Table 2. Summary of the current state-of-the-art on Deep Learning (DL)-based object detection in agriculture.
ReferenceApplicationPerformance
Dias et al. [30]Detect apple flowers.AP of 97.20% and F1 score of 92.10%.
Zheng et al. [31]Detect and classify crop species.AP of 92.79%.
Koirala et al. [32]Detect mango fruit.AP of 98.60% and F1 score of 96.70%.
Tian et al. [33]Detect apples in orchards.F1 score of 81.70%.
Bargoti and Underwood [34]Detect fruit in orchards.F1 score of 90.40% for apples, 90.80% for mangoes and 77.50% for almonds.
Sa et al. [35]Detect sweet pepper and rock melonF1 score of 83.80%.
Kirk et al. [36]Detect ripe soft fruits.F1 score of 74.40%.
Li et al. [37]Detect and count oil palm trees from high-resolution remote sensing images.Maximum overall detection accuracy of 99% and counting error less than 4% for each considered region.
Ding and Taylor [38]Detect pest.AP of 93.10%.
Zhong et al. [39]Detect flying insects.Counting accuracy of 93.71%.
Steen et al. [40]Detect an obstacle.Precision of 99.9% and recall of 36.7% in row crops, and  precision of 90.8% and a recall of 28.1% in mowing grass.
Dias et al. [30] implement a technique for apple flower identification, which is robust to changes in illumination and clutter. The authors use a pre-trained CNN and Transfer Learning concepts to create the detector. Data augmentation is applied to the original collected images to increase the dataset size. The results show that this work achieves an F1 score of 92.1% and an AP of 97.2%. In the context of mango fruit detection, Koirala et al. [32] compared the performance of six state-of-the-art DL architectures. Additionally, the authors proposed MangoYOLO, a new architecture based YOLO [23], which was specifically created for mango fruit detection. As a best result, MangoYOLO performed with an AP of 98.60%. Zheng et al. [31] propose a large dataset for species classification and detection, called CropDeep. The dataset contains more than 30,000 images of 31 different classes. The authors train state-of-the-art DL models to verify its validity, such as Resnet [41], where they obtained an AP of 92.79%.
Besides object detection, DL in agriculture can also be used to infer specific characteristics of the natural agents. For example, Li et al. [37] propose a DL framework to detect and count oil palm trees from high-resolution remote sensing images. The main goals of this work are to predict yield of palm oil and monitor the growth stage of palm trees. Tian et al. [33] implemented an improvement to the YOLO-V3 [42] model to estimate apples yield and their grown stages. The authors consider a variety of challenging conditions, such as overlapping apples, leaves, and branches; illumination variation; and, complex backgrounds. The experiments performed proved that, for a training dataset with three different growth stages, this approach has an F1 score of 81.7%. Bargoti and Underwood [34] use the standard Faster R-CNN architecture [22] to detect several types of fruits in orchards, such as apples, mangoes, and almonds. In this work, the authors explore the amount of data that are required to capture the variability of the agriculture environment, as well as the gain of using data augmentation techniques. Overall, this work was performed with high precision, resulting in an F1 score higher than 90%. Additionally, Sa et al. [35] propose a fruit detection system called DeepFruits while using the Faster R-CNN architecture. The proposed detectors are integrated in the software pipeline of an agricultural robot to estimate yield and automate the harvesting process. The results demonstrated that this work achieves an F1 score of 83.8% while detecting sweet pepper and rock-melon. To detect ripe soft fruits, Kirk et al. [36] propose a detector implemented as a combination of a conventional computer vision algorithm and a DL-based approach. The authors build a dataset with images captured over two months in the agricultural environment to test their implementation. The performed experiments show that this algorithm achieves an F1 score of 74.4%.
In addition to fruit detection, DL is also used in other relevant agriculture scenarios. The safety of machines and operators is essential in these environments. In this context, obstacle detection plays a major role ensuring the safety of the operations performed in agriculture. To pursue this goal, Steen et al. [40] use a CNN to detect an object type in row crops and grass mowing. The detector is able to detect the object with high precision, without detecting false positives, such as persons or other objects. Finally, insect and pest identification is also an important research area for the agriculture sector to avoid plant diseases. Zhong et al. [39] implemented a fast and accurate flying insect detection and counting. To do so, the YOLO [23] model is used in the detection stage, and an Support Vector Machine (SVM) in the counting stage. The detection pipeling supports six types of insects, and it performs with a counting accuracy of 93.71%. Ding and Taylor [38] create a CNN model to detect and count pest. The experiments show that the model is fast and precise (AP of 93.1%), and that it can be easily used to detect other kinds of pest.
Our previous works [43,44] focused on the usage and benchmark of low-power devices to deploy DL models while using a low quantity of training data. In this paper, the semantic vineyard perception problem is extended with the following main contributions and innovations:
  • A novel DL-oriented dataset for vine trunk detection called VineSet, publicly available (http://vcriis01.inesctec.pt/datasets/DataSet/VineSet.zip) and recognized by the ROS Agriculture community (http://wiki.ros.org/agriculture) as “A Large Vine Trunk Image Collection and Annotation using the Pascal VOC format”.
  • A way of extending the dataset size using data augmentation techniques.
  • The train, benchmark, and characterization of state-of-the-art Single Shot Multibox Detector (SSD) [45] models for vine trunk detection using the VineSet.
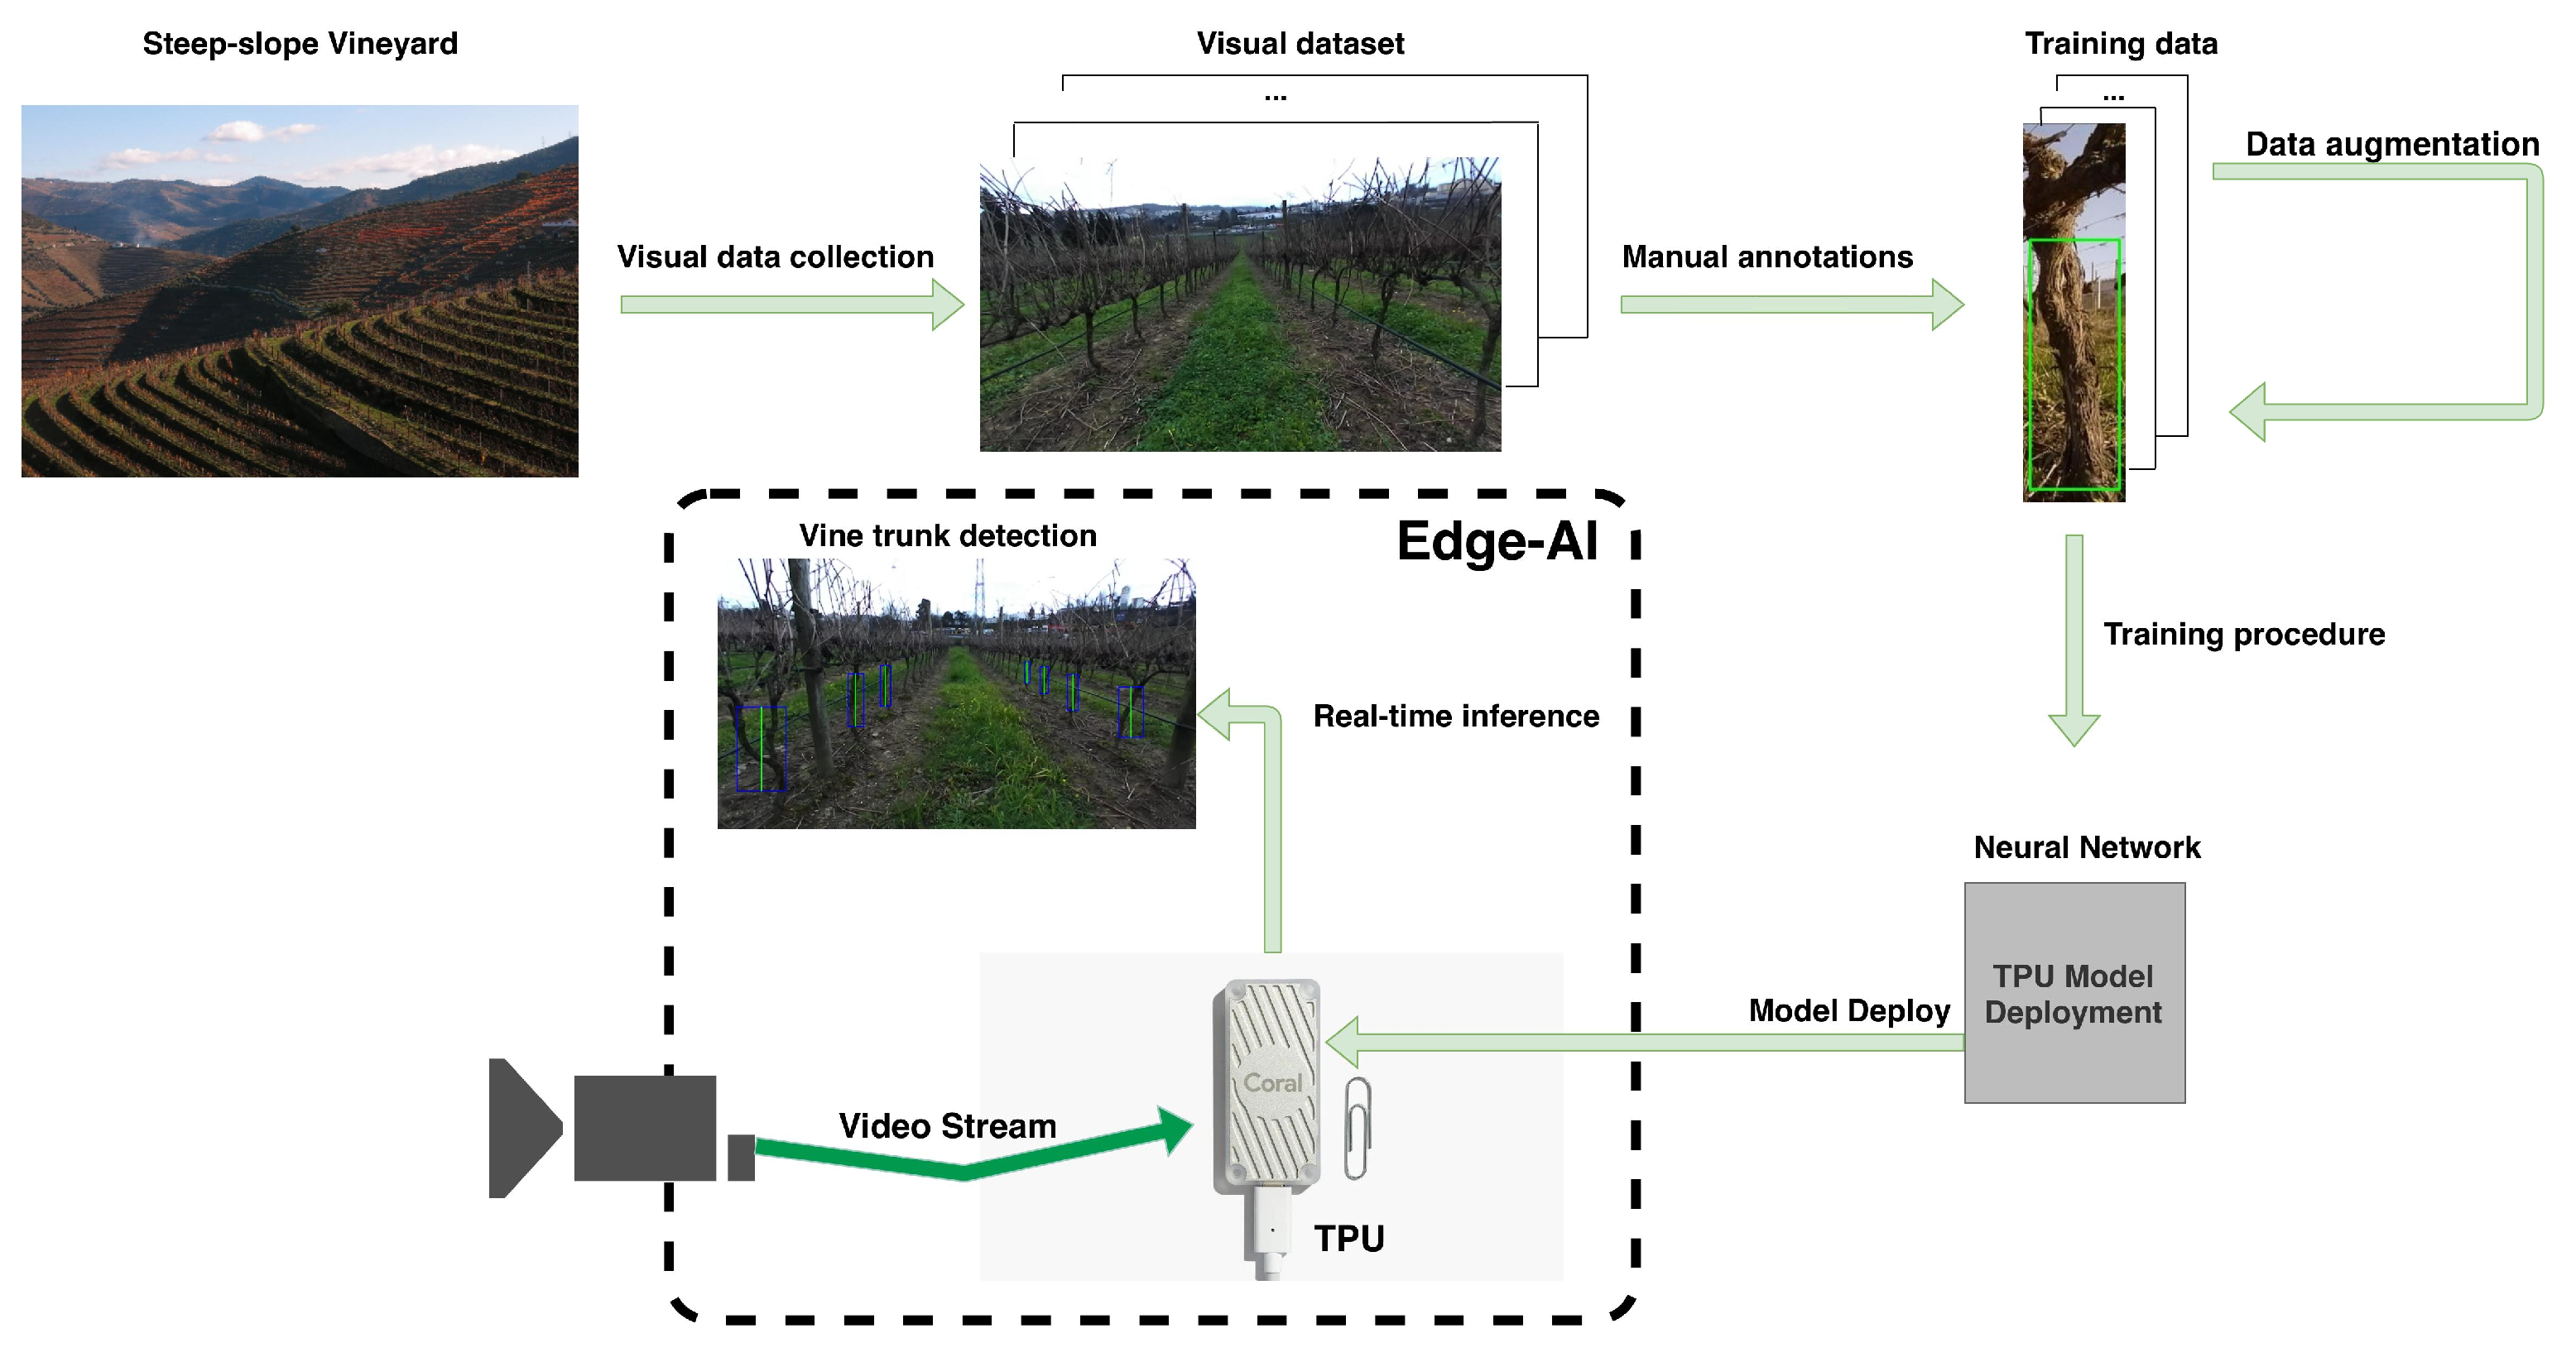
  • Real-time deployment of the models using a Tensor Processing Unit (TPU).
  • An automatic annotation tool for datasets of trunks in agricultural contexts.
The rest of the paper is described, as follows. Section 3 contains the methodology adopted, such as the data collection and augmentation methods, the training procedure, and the inference approaches. Section 4 presents the proposed system results while using the VineSet dataset and the respective analysis, characterization, and discussion. Finally, Section 5 summarizes the work.

2. Background

This work uses two sets of models based on the SSD architecture [45] to detect vine trunks, the MobileNets [46], and Inception-V2 [47]. The SSD architecture and the derived models are briefly described in this section.

2.1. Single Shot Multibox

SSD, Figure 2, is based on a feed-forward CNN that detects objects producing a fixed number of bounding boxes and scores.
This architecture is built upon a Neural Network (NN) that is based on a given standard architecture. Its main modules are:
  • Convolutional feature layers that decrease progressively in size, detecting objects at multiple scales.
  • Convolutional filters that are represented on the top of Figure 2 produce a fixed number of detection predictions.
  • A set of bounding boxes associated with each feature map cell.
These characteristics allow to detect objects at multiple scales, i.e., objects of different sizes in the images with different resolutions.

2.2. MobileNets

This set of models provide lightweight Deep Neural Networks (NNs) while using depthwise separable convolutions. In other words, the model factorizes convolutions into depthwise and 1 × 1 convolutions, called pointwise convolutions. The first applies a single filter to the input channel, and the second applies a 1 × 1 convolution, combining the outputs of the first. The CNN input is a tensor with shape D f × D f × M , where D f represents the input channel spatial width and height, and M is the input depth. After the convolution, a feature map of shape D f × D f × N is obtained, where N is the output depth. In this context, these model families use two hyper-parameters that allow the user to resize the model in order to meet the system requirements. These hyper-parameters are: width multiplier α and resolution multiplier ρ . The first is used to reduce the size of the CNN uniformly at each layer. For a given value of α ( 0 , 1 ] , the number of input channels M becomes α M , as well as the number of output channels N becomes α N . The width multiplier reduces the computational cost and number of parameters by α 2 . The second hyper-parameter, ρ , is also used to reduce the computational cost. This one is applied directly to the input image, setting its resolution. The ρ ( 0 , 1 ] values are chosen to obtain typical input image resolutions. Similarly to the width multiplier, the resolution multiplier also reduces the computational cost and the number of parameters by ρ 2 . Accordingly, both of the parameters are different ways of reducing the model size and computational cost. When combined, the effects on the final model can be even more significant.

2.3. Inception

Szegedy et al. [48] proposed the primary version of Inception. This model design is based on the premise that the desired object to classify or detect can present several sizes on different images. This leads to the difficulty of choosing the right kernel size. Inception proposes three different convolutional filter sizes to overcome this issue: 1 × 1, 3 × 3, and 5 × 5. Additionally, the NN model also computes max pooling. The output of all these operations is then concatenated, constituting the result of the respective Inception module.
Inception-V2 was developed to reduce the computational complexity of the original version. This is done by factorizing the convolution operations. For example, a 5 × 5 convolution is factorized into two 3 × 3 convolutions, improving the runtime performance. Similarly, an  m × m convolution can be factorized into a combination of 1 × m and m × 1 convolutions.

3. Materials and Methods

The reliable semantic perception of an agricultural environment by a robot is a task that requires several development steps, as well as high amounts of learning data. In this work, a large collection of data in several vineyard contexts is proposed. This innovation created the VineSet, a dataset with RGB images of four different vineyards, and thermal images of a single one, containing the annotations for each image. The proposed dataset is available (http://vcriis01.inesctec.pt/datasets/DataSet/VineSet.zip) and it was recognized by the ROS Agriculture community (http://wiki.ros.org/agriculture) as “A Large Vine Trunk Image Collection and Annotation using the Pascal VOC format”. In addition, our pipeline supports a variety of augmentation operations that allow for extending the original dataset. The augmentation procedure automatically generates the annotations for the augmented images. With this information, state-of-the-art SSD models are trained using the Tensorflow (https://www.tensorflow.org/) API and then deployed in an Edge-AI manner. Figure 3 represents the main steps performed until real-time vine trunk detection.
In addition to this vine trunk detection pipeline, an assisted labelling framework is also proposed. A DL model is used to automatically annotate an input dataset and provide the annotations in a standard format. The user can then load the annotations and manually annotate the remaining objects not detected by the DL model, as detailed in Section 3.5. In terms of cost, we propose a cost-effective solution that requires two main hardware components: a standard RGB camera (https://www.raspberrypi.org/products/raspberry-pi-high-quality-camera/) (<70€), and a low-cost TPU device (https://coral.ai/products/accelerator) (<60€). The devices must be plugged to a central processing unit, such as a microprocessor or a standard computer. This being said, the proposed solution is affordable for small/medium farmers, and it can have an impact in the improvement of the semantic perception systems in vineyards.

3.1. Data Acquisition

In order to acquire images in real vineyard scenarios, we used our robotic platform AgRob V16 [49], which is represented in Figure 4.
This robot contains a frontal stereo RGB camera and a frontal thermal camera. To collect the image data, the robot travelled along the vineyard corridors of four different vineyards, and then recorded video streams saved in the ROSBag file format. In one of the vineyards, the thermal camera was activated, and also recorded video to the same file format. After all, the acquisition on the field, the ROSBag files were processed, and image frames were extracted from them at a fixed frame-rate, which resulted in a total of 952 vineyard images. Figure 5 shows an example of each type of image collected.
From this, one can see that the dataset presents considerable data variability. In fact, the VineSet contains images that were collected at different stages of the year that capture different characteristics of the vineyards imposed by the temporal offset. Additionally, it presents images of vineyards with and without foliage and with different levels of luminosity. Finally, the presence of thermal vineyard images adds the notion of temperature to the dataset, which can improve the learning procedure.

3.2. Data Annotation

Given the training dataset, the perceptible vine trunks were manually annotated on the images. Figure 6 shows an image example of each vine with the respective annotations.
The output from this procedure is a set of bounding boxes with different sizes for each image. These are represented in a .xml file with the Pascal VOC annotation format, containing the label class that is considered and the four corners location of each bounding box. It is worth noting that the annotations are a fundamental part of the VineSet dataset, since they represent trunk’s location in the object detection learning procedure.

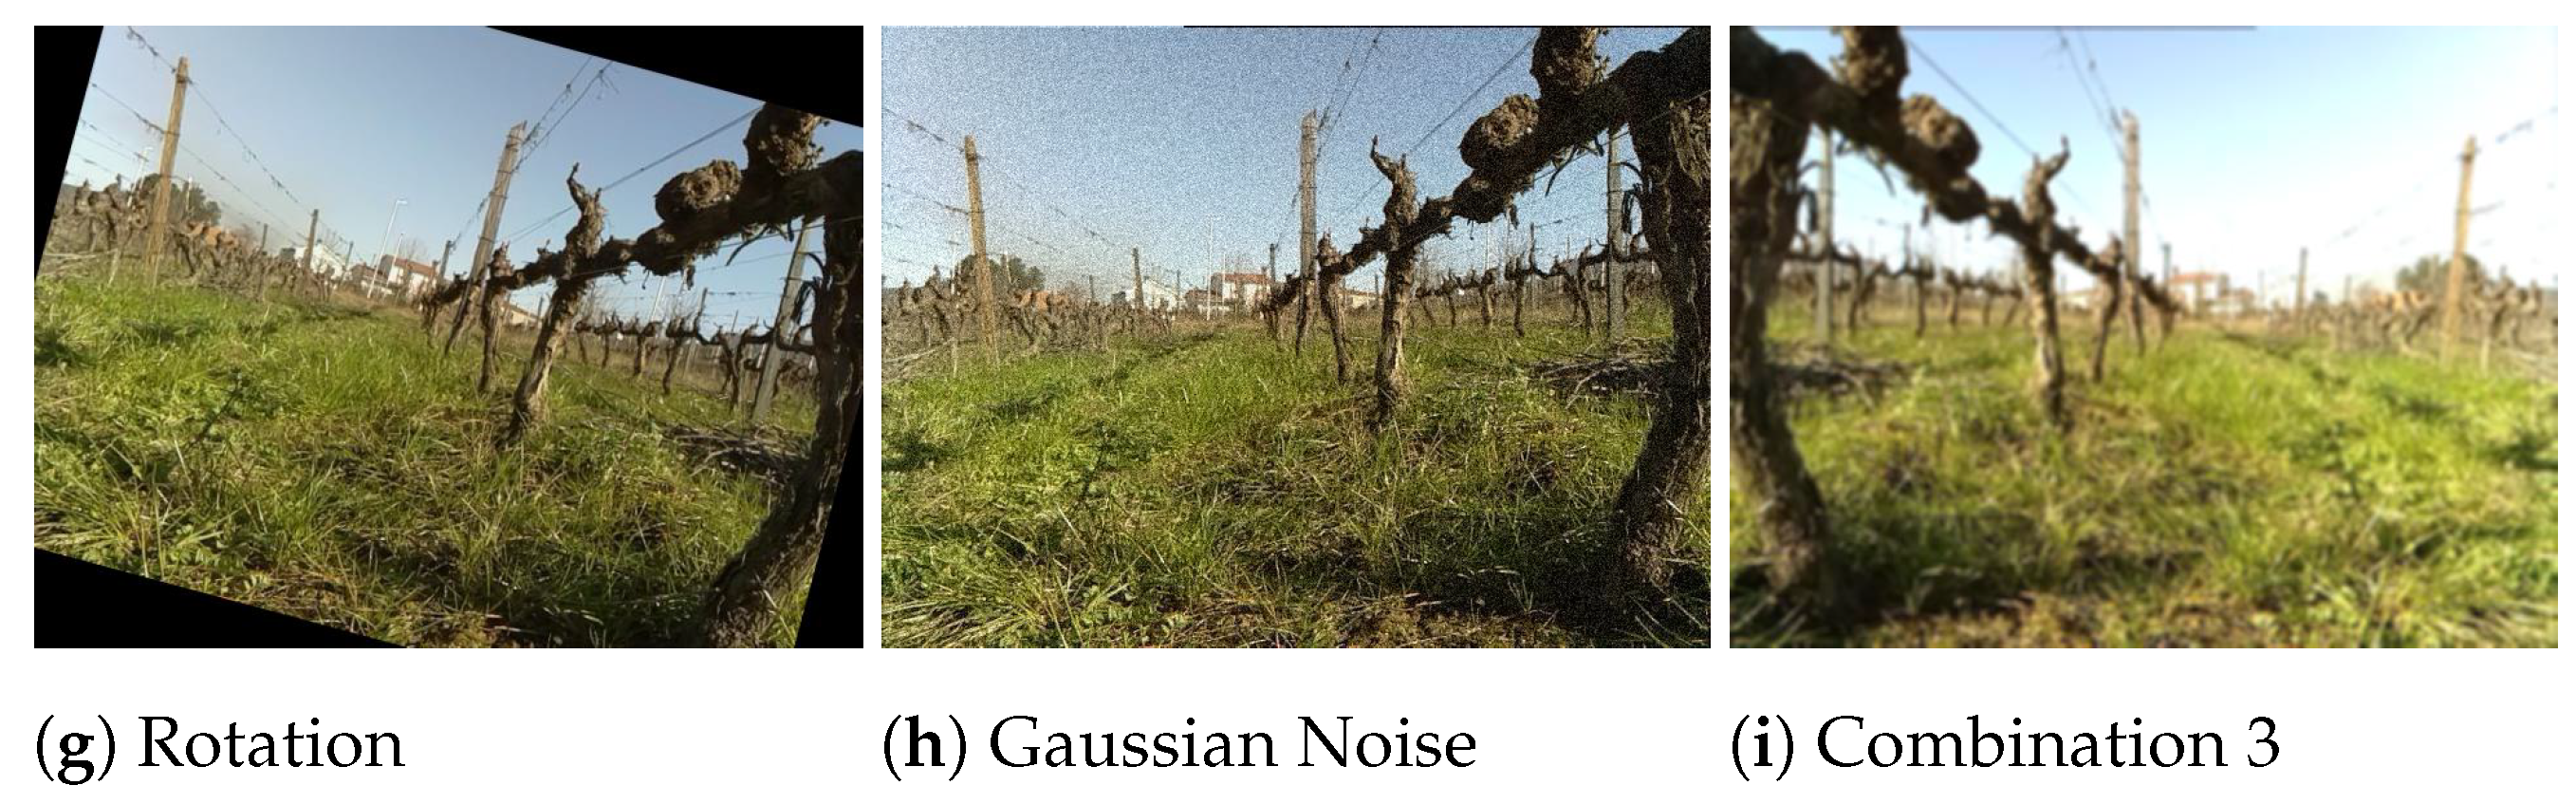
3.3. Data Augmentation

Even though DL outperforms most traditional Machine Learning (ML) methods in terms of precision and real-time application [18], one of the biggest challenges is to overcome overfitting. This frequent ML problem consists of modelling the data too well, only learning the expected output for each input instead of learning the input data’s general distribution. Additionally, conditions, such as variation of sunlight illumination during the day or the outdoor environment terrain, may affect performance. In order to avoid overfitting and the network generalization, data augmentation is a usual method to enhance data variability for training by enlarging the dataset using label-preserving transformations. Thus, to increase the VineSet’s diversity and robustness, the collected images were pre-processed with the augmentation techniques presented in Table 3, and VineSet was extended to 9481 images.
As described, the VineSet is extended by applying operations on the original images, such as rotation, translation, scaling, flipping, multiplication, saturation, and the addition of noise sampled from a Gaussian distribution. In addition, a random combination of three of the previous operations is also supported. This highly increases the number of combinations of operations possible and, consequently, increases the extended dataset variability. Figure 7 represents an example of an application of the augmentation operations to a single image.

3.4. Training Procedure

The Edge-AI-based deployment of NNs is performed while using a TPU. This hardware device is provided by Google and requires models that were trained using the Tensorflow [50] API. Tensorflow is an open-source end-to-end framework for machine learning and DL that provides tools, libraries, and models. With this tool, the implementation of DL applications can be built in a more straightforward, comprehensive, and flexible way. In the Edge-AI context, Tensorflow provides a tool, called Tensorflow Lite, which is device-oriented. Using Tensorflow Lite, the trained models can be transformed to be compatible with edge-based hardware. In this work, this tool is used for two main ends:
  • the full quantization of models to 8-bit precision; and,
  • compilation of the model to the TPU context.
Step 1. consists of converting the training models from 32-bit to 8-bit precision, since the TPU device can only deploy fully quantized models. The second step is a fundamental part of the process. In this, the model is compiled to the TPU context. In other words, the DL model operations are allocated to the device. The unsupported operations remain allocated to the host device, usually a CPU. Thus, the higher the number of allocated operations to the edge device, the faster the inference procedure will be. With this in mind, the model selection is crucial for the reliable operation of the detectors. For the object detection task, the SSD is the most appropriate, and one specific set of models was particularly implemented for edge- and embedded-based applications: the MobileNets [46]. In this work, SSD MobileNet-V1 and SSD MobileNet-V2 were both trained and deployed, as well as the SSD Inception-V2 model [47]. The three models were benchmarked and characterized by evaluating the dataset size and comparing the inference performance between training them from scratch and using Transfer Learning.

3.5. Assisted Labelling Tool

Training a DL model involves several steps, one of the most important of which is data annotation. Generally, this step is a long process, and the time that is spent depends on several factors, such as the total number of images that the dataset has the number of classes and the ease of manually identifying the bounding box that corresponds to each class. Thus, this work proposes creating an assisted labelling procedure that uses AI to help the annotation process in the detection of trunks in the vineyards. Figure 8 represents the layout of the created application.
In this way, a comprehensive and user-friendly python notebook was developed. The procedure of this new solution consists of using an online platform, Google Colaboratory (https://colab.research.google.com), so that the user can save his machine’s resources. This tool provides a DL model that is trained for detecting vine trunks, and also capable of detecting trunks in other contexts such as orchards or forests. Accordingly, an essential factor for automating this process is the use of the DL model. Taking the results obtained in Section 4 into account, the SSD MobileNet-V1 trained with VineSet was the model chosen for the detection of trunks in the images introduced in this tool. The assisted labelling procedure uses this model to pre-process the user dataset, automatically annotating the detected trunks, saving the annotations in the Pascal VOC format. The user can then load the automatic annotations and complete them manually. This tool reduces the percentage of annotations taken manually, significantly reducing the time that it takes to insert labels into relatively large datasets. It is worth noting that this procedure is iterative, in the way that the user can improve DL-based object detection models performance, by iteratively annotating objects that the model fails to recognize.

4. Results

This section evaluates the semantic vineyard perception captured by on-board sensors while using Edge-AI technologies. The evaluation considers the vine trunk detection precision and inference time performance.

4.1. Methodology

A subset of the entire dataset was used for test purposes and not employed in the training procedures in order to test and evaluate the models. The test set selection is randomly generated, picking 10% of the VineSet images. In this work, two train datasets were used. This was done to evaluate the impact of the training dataset size on the detectors performance. Thus, the original VineSet dataset and a small subset of it with 336 non-augmented images were used. The evaluation approach is described in Section 4.2. In addition, the inference time per image was measured for each model deployed in the TPU, while considering the average inference time for all the images present in the test dataset. Finally, the assisted labelling procedure is evaluated when considering three experiments: the first in a vineyard not present in the VineSet dataset, other in forest images, and a final one in a hazelnut orchard. The labelling was assisted in these three scenarios, and the time that was saved in the annotation procedure was measured for each of them.

4.2. Object Detection Metrics

The PASCAL VOC Challenge [51] was used to evaluate the considered model’s performance on Google’s USB Accelerator. Most of DL-based works use AP to evaluate their models, as shown in Section 1. Thus, the use of this metric simplifies the comparison between state-of-the-art approaches. In order to compute the AP, Pascal VOC starts by calculating the Intersection over Union (IoU). Given an annotated ground truth bounding box B g , and a detected bounding box B d , the IoU is computed, as follows:
I o U = m ( B g B d ) m ( B g B d )
where m ( x ) denotes the area of x. Figure 9, shows a graphical representation of this concept.
Thus, IoU represents the quotient between the overlap area and the union area between the ground truth and bounding boxes’ detection. Using this definition, for a given threshold value t, three main concepts can be defined:
  • True Positive (TP): IoU t , i.e., a correct detection.
  • False Positive (FP): IoU t , i.e., an incorrect detection.
  • False Negative (FN): a ground truth is not detected.
In the case that multiple detections for a single annotation (or ground truth) are computed, this metric only considers as TP the one that presents the higher IoU value. All of the other detections are marked as FPs. Subsequently, to compute the model AP, two concepts are defined. The first, precision p, is defined as the total number of TPs over all the detections. The second, recall r, is the total number of TPs over all the ground truths. With these two concepts, AP is calculated as a combination of precision and recall. In other words, the AP is the average value of the precision vs recall curve p ( r ) for r [ 0 , 1 ] . The evaluation considers that a suitable detector is the one that maintains the precision high for an increase in recall. Mathematically, this is expressedm as follows
r = 0 1 ( r n + 1 r n ) p i n t e r p ( r n + 1 )
with
p i n t e r p ( r n + 1 ) = max r ˜ ; r ˜ r n + 1 p ( r ˜ )
where p ( r ˜ ) is the measured precision at recall r ˜ .
This work also evaluates the models while using the F1 score. This score is the harmonic mean between the precision p and recall r, and it can be calculated as follows:
F 1 = 2 p · r p + r

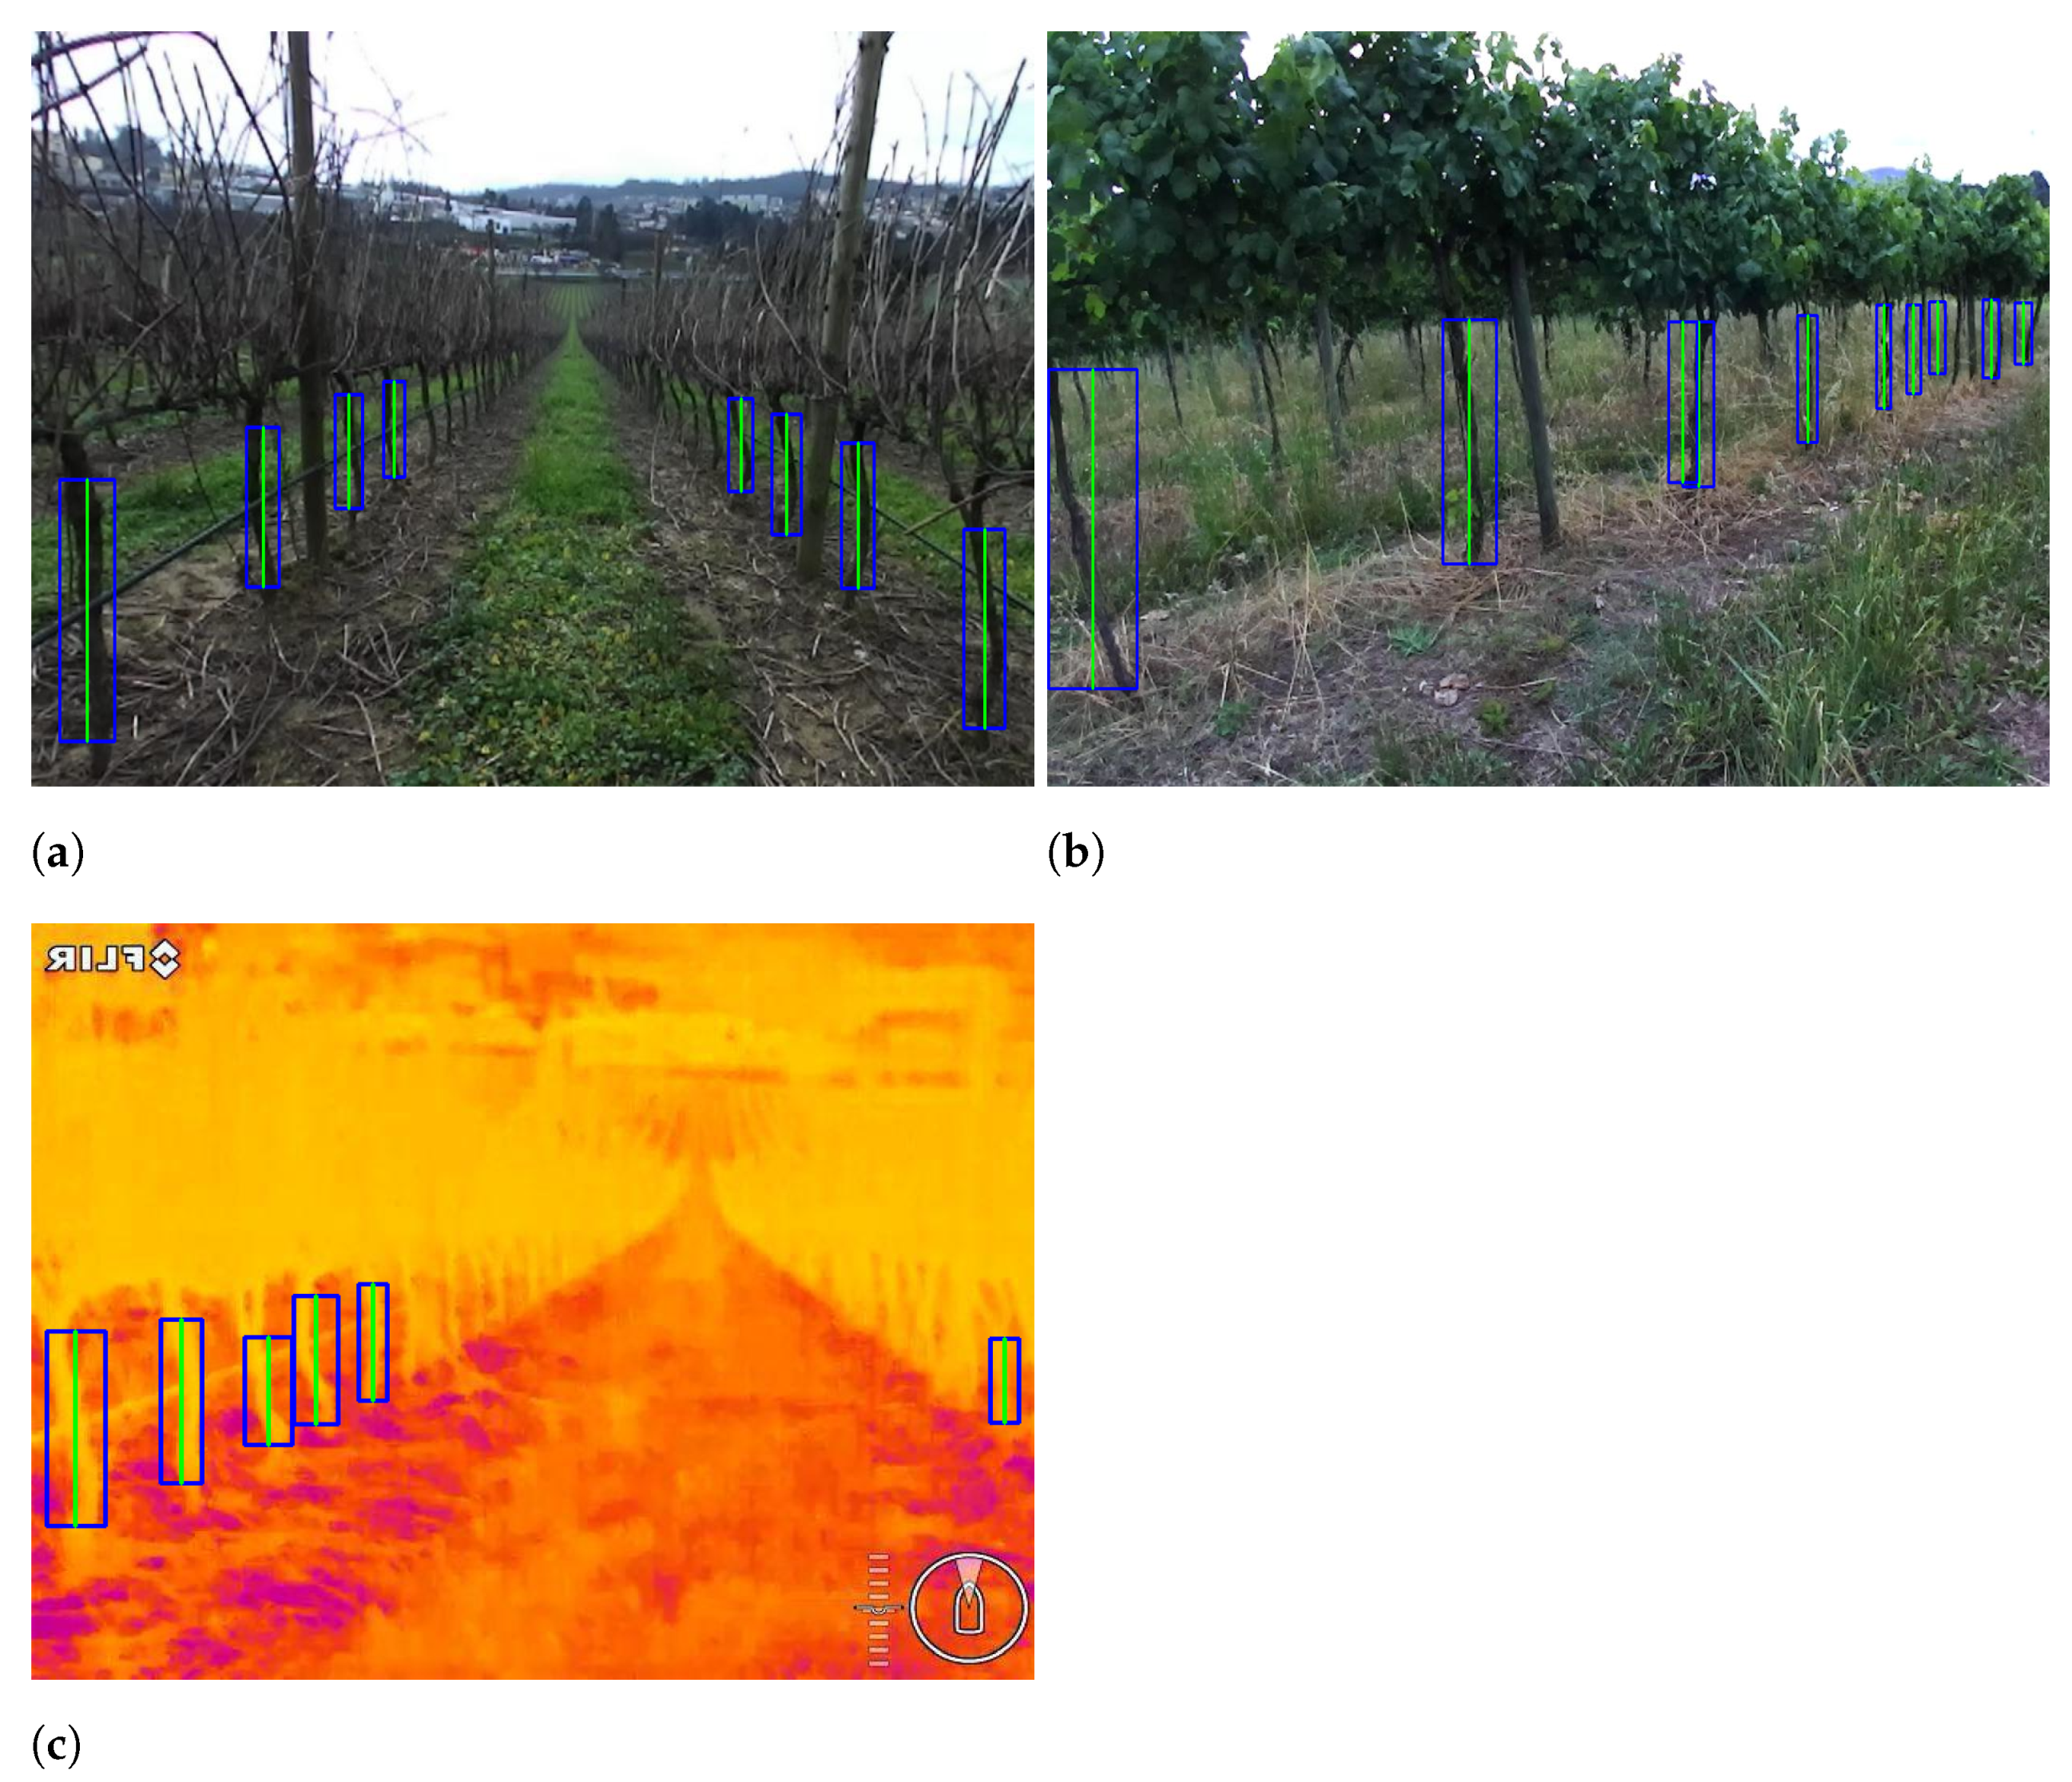
4.3. Detectors Performance

In this work, in order to evaluate the models performance, we consider an IoU threshold of 0.50, since we are interested in detecting trunks with high and medium precision to use as landmarks for Simultaneous Localization and Mapping in agriculture. Additionally, trunks are non-uniform agents that present inclination and perturbations. Thus, a detection can still be valid and precise, even if it does not exactly match the annotation. Table 4 summarizes the models’ performance in terms of precision and F1 score.
When considering the trained models with VineSet using Transfer Learning (fine-tuning), we achieved a maximum AP of 84.16%, corresponding to SSD MobileNet-V1. This proves that the VineSet dataset can be successfully used to train models to detect vine trunks, even while considering lightweight model, such as the MobileNets. SSD MobileNet-V2 achieves a similar precision (83.01%), which is expected, since both models have similar architectures. The SSD Inception-V2 presents a lower precision (75.78%), but the higher F1 score (0.848). This means that this model is the one that has the best balance between precision and recall. Figure 10 shows an example of three detections using the SSD MobileNet-V1.
In terms of inference time, from Table 5 several conclusions can be taken.
The edge TPU device is built with a specific architecture that is optimized to deploy DL models. If the models are compatible with it, then it is expected that the inference runs at high frame rate. From the experiments performed, the MobileNets achieved an average inference time of 21.18 ms and 23.14 ms. In terms of frequency, this is equivalent to approximately 50 frames per second. This means that the edge TPU can process approximately 50 images and output the desired detections in one second. For SSD Inception-V2, the processing rate is slower. The edge device has an average inference time of 359.64 ms for this device. This can be explained by two main reasons. Firstly, the MobileNets use depthwise separable convolution, while Inception uses standard convolution, which results in fewer parameters on MobileNet when compared to Inception. Secondly, the first set of models is more oriented to edge devices. Thus, in the compilation process for the TPU, a higher number of operations is allocated to it. On the opposite side, the SSD Inception-V2 allocates more operations to the host CPU, due to the non-compatibility of some of them. These two factors lead to the decrease of the inference time performance.

4.4. Impact of the Dataset Size on the Detection Performance

In order to evaluate the training dataset size impact in the final models’ performance, we trained them using a small subset of the VineSet. Table 4 summarizes all of the obtained results in terms of AP and F1 score. As expected, the models that were trained with lower amounts of data present lower precision. The lower variability of data leads to a lower learning capability and, consequently, to a lower inference performance. In this context, we verified a decay of 34.42% of AP for SSD MobileNet-V1, 30.03 for SSD MobileNet-V2, and 29.68% for SSD Inception-V2. Thus, the decrease in the training dataset size has a significant impact on the models performance. This proves the high importance of considering a considerable amount of data with variability when dealing with DL models.

4.5. Comparison of Transfer Learning against Training from Scratch

One of the main questions of developers while training and deploying DL models is to fine-tune a pre-trained model or to train it from scratch. When using Transfer Learning, the model uses some of the pre-trained weights and restores other ones. Thus, the starting point on Transfer Learning is one step ahead when comparing training the same model from scratch. In the last case, all of the weights have to be learned, leading to a longer learning process. To test this, we train the three models from scratch using two epoch values (50,000 and 100,000). From Table 4, we can verify that, for models that are trained from scratch to achieve similar performance as compared with the ones fine-tuned, the number of training epochs has to be doubled. From Figure 11, this is also visible.
Here, it is possible to verify that the training loss for the fine-tuned models converges faster. Additionally, the validation loss has a more precise starting point for these models, as visible from Figure 11c,d. Thus, these experiments proved the theoretical assumptions that were made.

4.6. Assisted Labelling Procedure

Several factors were analyzed in comparison with manual annotation in order to assess the performance of our assisted labelling procedure. Specifically, the average time to manually label a trunk was measured over several experiments, and it was concluded that, on average, the time spent per trunk annotation is 5 s. Thus, once this value is established, the total time that is spent on several images can also be estimated. The time spent on assisted annotation was calculated from the percentage of annotations made automatically, and the percentage of annotations made manually. In this way, the total time that is spent by the tool is calculated through the time spent by the automatic annotation plus the offset created by the missing annotations. Table 6 summarizes the results.
These experiments used the proposed assisted annotation procedure to automatically annotate the images from other vineyards, but also from an orchard, and a forest. The results estimate that the automatic annotation tool can reduce the average labelling time from 6.35 min. to 1.74 min for vineyards. In orchards, the tool annotates 48.34% of the trunks and, in forests, 28.05%. This means that only the remaining set of trunks have to be annotated by the user. The tool can be iterative improved by updating the back-end DL model with user’s annotations. Figure 12 shows the result of the automatic annotation in three different contexts.

4.7. Discussion

The experiments performed revealed several takeaways. With a wide variety of data, lightweight DL models can be used for detection purposes in agricultural contexts. With these models, Edge-AI-based devices can be used to perform high-performance inference. As discussed, one of the most important factors to build successful detectors is to provide sufficient amounts of varied learning data. Additionally, using models that already have a learning history can accelerate the learning procedure, thus saving resources and time.
In comparison with the state-of-the-art, our approach outperforms the work that was proposed by Badeka et al. [21] that achieved an AP of 73.2% using DL models to detect vine trunks. Other approaches use conventional image processing techniques, or data fusion, to achieve the same goal. In particular, Lamprecht et al. [24] uses a 3D clustering procedure to isolate laser points on tree trunks, achieving an overall accuracy of 84%. Shalal et al. [25] fuse a camera with a laser sensor to detect orchard trunks with a detection confidence of 82.2%. Our approach achieves similar results using less resources, presenting extremely high inference rates. Regarding the works that use DL in other agricultural contexts, our approach presents a state-of-the-art performance (AP higher than 80%) and promotes DL concepts in vineyard contexts. We think that these concepts have extreme importance in agricultural robotics and that, shortly, they will be usually approached to the detriment of more conventional image processing techniques. In comparison with our work, some works present higher precision rates, such as Dias et al. [31], Zheng et al. [31], and Koirala et al. [32]. In relation with these, our work uses simpler DL models with less operations and being less computationally expensive. Even so, this paper can still present a state-of-the-art performance, with the advantage of running at high frame rates.
The major drawback faced while implementing the proposed techniques was the high amount of time and resources spent during the annotation process. This led to the creation of the automatic annotation tool, so that, in the future, we can spend less time in this step. Looking to the future, one of the most important steps will be to develop models and acquire data, so that robots can also have this level of perception during the night. In most agricultural sectors, robots can be employed to autonomously perform several tasks during this period. Consequently, they should also have the ability to detect objects and natural agents at night.

5. Conclusions

In this work, DL is used to detect semantic features in vineyards. Single Shot Multibox detectors are trained while using a novel built in-house dataset, the VineSet. The models are converted to an edge TPU context and then deployed in this hardware device. Additionally, an assisted annotation tool is proposed to ease the dataset creation procedure. The results show that our detectors present an AP up to 84.16% and an F1 score up to 0.848. The MobileNets are executed in the edge TPU at a high frame rate, with an average inference time per image up to 23.14 ms. Additionally, from the characterization performed, two main conclusions can be made: the amount of training data has a significant impact on the detectors’ performance; and, the number of training epochs has to be double in order for a detector trained from scratch achieve a similar performance of the one fine-tuned. Finally, the annotation tool proved to help in the annotation process, being capable of automatically annotating trunks in other agricultural contexts, such as orchards and forests.
In future work, we aim to project and implement a DL model from scratch in order to detect vine trunks. Additionally, we will integrate the proposed models in a Simultaneous Localization and Mapping stack as landmark extractors.

Author Contributions

Conceptualization, A.S.A., N.N.M. and F.N.d.S.; methodology, A.S.A., N.N.M. and F.N.d.S.; validation, E.J.S.P., D.S., A.J.S. and J.B.-C.; investigation, A.S.A., N.N.M. and F.N.d.S.; resources, F.N.d.S. and A.J.S.; writing—original draft preparation, A.S.A., N.N.M.; writing—review and editing, E.J.S.P., D.S., A.J.S. and J.B.-C.; supervision, F.N.d.S., E.J.S.P., A.J.S. and J.B.-C. All authors have read and agreed to the published version of the manuscript.

Funding

The research leading to these results has received funding from the European Union’s Horizon 2020—The EU Framework Programme for Research and Innovation 2014-2020, under grant agreement No. 101000554.

Institutional Review Board Statement

Not applicable.

Informed Consent Statement

Not applicable.

Acknowledgments

André Silva Pinto de Aguiar thanks the FCT—Foundation for Science and Technology, Portugal for the Ph.D. Grant DFA/BD/5318/2020.

Conflicts of Interest

The authors declare no conflict of interest.

References

  1. Andresen, T.; de Aguiar, F.B.; Curado, M.J. The Alto Douro Wine Region greenway. Landsc. Urban Plan. 2004, 68, 289–303. [Google Scholar] [CrossRef]
  2. Dos Santos, F.N.; Sobreira, H.; Campos, D.; Morais, R.; Moreira, A.P.; Contente, O. Towards a reliable robot for steep slope vineyards monitoring. J. Intell. Robot. Syst. 2016, 83, 429–444. [Google Scholar] [CrossRef]
  3. Roldán, J.J.; del Cerro, J.; Garzón-Ramos, D.; Garcia-Aunon, P.; Garzón, M.; de León, J.; Barrientos, A. Robots in Agriculture: State of Art and Practical Experiences. In Service Robots; InTech: London, UK, 2018. [Google Scholar] [CrossRef] [Green Version]
  4. Duckett, T.; Pearson, S.; Blackmore, S.; Grieve, B.; Chen, W.H.; Cielniak, G.; Cleaversmith, J.; Dai, J.; Davis, S.; Fox, C.; et al. Agricultural Robotics: The Future of Robotic Agriculture. arXiv 2018, arXiv:cs.RO/1806.06762. [Google Scholar]
  5. Dos Santos, F.N.; Sobreira, H.M.P.; Campos, D.F.B.; Morais, R.; Moreira, A.P.G.M.; Contente, O.M.S. Towards a Reliable Monitoring Robot for Mountain Vineyards. In Proceedings of the 2015 IEEE International Conference on Autonomous Robot Systems and Competitions, Vila Real, Portugal, 8–10 April 2015; pp. 37–43. [Google Scholar] [CrossRef]
  6. Cheein, F.A.; Steiner, G.; Paina, G.P.; Carelli, R. Optimized EIF-SLAM algorithm for precision agriculture mapping based on stems detection. Comput. Electron. Agric. 2011, 78, 195–207. [Google Scholar] [CrossRef]
  7. Aguiar, A.; Santos, F.; Santos, L.; Sousa, A. Monocular Visual Odometry Using Fisheye Lens Cameras. In Progress in Artificial Intelligence; Moura Oliveira, P., Novais, P., Reis, L.P., Eds.; Springer International Publishing: Cham, Switzerland, 2019; pp. 319–330. [Google Scholar]
  8. Aguiar, A.S.; dos Santos, F.N.; Cunha, J.B.; Sobreira, H.; Sousa, A.J. Localization and Mapping for Robots in Agriculture and Forestry: A Survey. Robotics 2020, 9, 97. [Google Scholar] [CrossRef]
  9. Zhao, Z.; Zheng, P.; Xu, S.; Wu, X. Object Detection With Deep Learning: A Review. IEEE Trans. Neural Netw. Learn. Syst. 2019, 30, 3212–3232. [Google Scholar] [CrossRef] [Green Version]
  10. LeCun, Y.; Bengio, Y.; Hinton, G. Deep Learning. Nature 2015, 521, 436–444. [Google Scholar] [CrossRef]
  11. Goodfellow, I.; Bengio, Y.; Courville, A. Deep Learning; MIT Press: Cambridge, MA, USA, 2016. [Google Scholar]
  12. Schmidhuber, J. Deep learning in neural networks: An overview. Neural Netw. 2015, 61, 85–117. [Google Scholar] [CrossRef] [Green Version]
  13. Pan, S.J.; Yang, Q. A Survey on Transfer Learning. IEEE Trans. Knowl. Data Eng. 2010, 22, 1345–1359. [Google Scholar] [CrossRef]
  14. Weiss, K.; Khoshgoftaar, T.M.; Wang, D. A survey of transfer learning. J. Big Data 2016, 3, 9. [Google Scholar] [CrossRef] [Green Version]
  15. Lu, J.; Behbood, V.; Hao, P.; Zuo, H.; Xue, S.; Zhang, G. Transfer learning using computational intelligence: A survey. Knowl. Based Syst. 2015, 80, 14–23. [Google Scholar] [CrossRef]
  16. Shao, L.; Zhu, F.; Li, X. Transfer Learning for Visual Categorization: A Survey. IEEE Trans. Neural Netw. Learn. Syst. 2015, 26, 1019–1034. [Google Scholar] [CrossRef]
  17. Torrey, L.; Shavlik, J. Transfer Learning. In Handbook of Research on Machine Learning Applications; IGI Global: Hershey, PA, USA, 2009. [Google Scholar] [CrossRef]
  18. Santos, L.; Santos, F.N.; Oliveira, P.M.; Shinde, P. Deep Learning Applications in Agriculture: A Short Review. In Robot 2019: Fourth Iberian Robotics Conference; Silva, M.F., Luís Lima, J., Reis, L.P., Sanfeliu, A., Tardioli, D., Eds.; Springer International Publishing: Cham, Switzerland, 2020; pp. 139–151. [Google Scholar]
  19. Kamilaris, A.; Prenafeta-Boldú, F.X. Deep learning in agriculture: A survey. Comput. Electron. Agric. 2018, 147, 70–90. [Google Scholar] [CrossRef] [Green Version]
  20. Kamilaris, A.; Prenafeta-Boldú, F.X. A review of the use of convolutional neural networks in agriculture. J. Agric. Sci. 2018, 156, 312–322. [Google Scholar] [CrossRef] [Green Version]
  21. Badeka, E.; Kalampokas, T.; Vrochidou, E.; Tziridis, K.; Papakostas, G.; Pachidis, T.; Kaburlasos, V. Real-time vineyard trunk detection for a grapes harvesting robot via deep learning. In Proceedings of the Thirteenth International Conference on Machine Vision, Rome, Italy, 2–6 November 2020; Osten, W., Nikolaev, D.P., Zhou, J., Eds.; International Society for Optics and Photonics, SPIE: Bellingham, WA, USA, 2021; Volume 11605, pp. 394–400. [Google Scholar] [CrossRef]
  22. Ren, S.; He, K.; Girshick, R.; Sun, J. Faster R-CNN: Towards Real-Time Object Detection with Region Proposal Networks. arXiv 2015, arXiv:cs.CV/1506.01497. [Google Scholar] [CrossRef] [Green Version]
  23. Redmon, J.; Divvala, S.; Girshick, R.; Farhadi, A. You Only Look Once: Unified, Real-Time Object Detection. In Proceedings of the IEEE Conference on Computer Vision and Pattern Recognition (CVPR), Las Vegas, NV, USA, 27–30 June 2016. [Google Scholar]
  24. Lamprecht, S.; Stoffels, J.; Dotzler, S.; Haß, E.; Udelhoven, T. aTrunk—An ALS-Based Trunk Detection Algorithm. Remote Sens. 2015, 7, 9975–9997. [Google Scholar] [CrossRef] [Green Version]
  25. Shalal, N.; Low, T.; McCarthy, C.; Hancock, N. A preliminary evaluation of vision and laser sensing for tree trunk detection and orchard mapping. In Proceedings of the Australasian Conference on Robotics and Automation (ACRA 2013), Sydney, Australia, 2–4 December 2013; pp. 1–10. [Google Scholar]
  26. Xue, J.; Fan, B.; Yan, J.; Dong, S.; Ding, Q. Trunk detection based on laser radar and vision data fusion. Int. J. Agric. Biol. Eng. 2018, 11, 20–26. [Google Scholar] [CrossRef] [Green Version]
  27. Juman, M.A.; Wong, Y.W.; Rajkumar, R.K.; Goh, L.J. A novel tree trunk detection method for oil-palm plantation navigation. Comput. Electron. Agric. 2016, 128, 172–180. [Google Scholar] [CrossRef]
  28. Bargoti, S.; Underwood, J.P.; Nieto, J.I.; Sukkarieh, S. A Pipeline for Trunk Detection in Trellis Structured Apple Orchards. J. Field Robot. 2015, 32, 1075–1094. [Google Scholar] [CrossRef]
  29. Colmenero-Martinez, J.T.; Blanco-Roldán, G.L.; Bayano-Tejero, S.; Castillo-Ruiz, F.J.; Sola-Guirado, R.R.; Gil-Ribes, J.A. An automatic trunk-detection system for intensive olive harvesting with trunk shaker. Biosyst. Eng. 2018, 172, 92–101. [Google Scholar] [CrossRef]
  30. Dias, P.A.; Tabb, A.; Medeiros, H. Apple flower detection using deep convolutional networks. Comput. Ind. 2018, 99, 17–28. [Google Scholar] [CrossRef] [Green Version]
  31. Zheng, Y.Y.; Kong, J.L.; Jin, X.B.; Wang, X.Y.; Su, T.L.; Zuo, M. CropDeep: The Crop Vision Dataset for Deep-Learning-Based Classification and Detection in Precision Agriculture. Sensors 2019, 19, 1058. [Google Scholar] [CrossRef] [Green Version]
  32. Koirala, A.; Walsh, K.B.; Wang, Z.X.; McCarthy, C. Deep learning for real-time fruit detection and orchard fruit load estimation: Benchmarking of ‘MangoYOLO’. Precis. Agric. 2019, 20, 1107–1135. [Google Scholar] [CrossRef]
  33. Tian, Y.; Yang, G.; Wang, Z.; Wang, H.; Li, E.; Liang, Z. Apple detection during different growth stages in orchards using the improved YOLO-V3 model. Comput. Electron. Agric. 2019, 157, 417–426. [Google Scholar] [CrossRef]
  34. Bargoti, S.; Underwood, J. Deep fruit detection in orchards. In Proceedings of the 2017 IEEE International Conference on Robotics and Automation (ICRA), Singapore, 29 May–3 June 2017; pp. 3626–3633. [Google Scholar] [CrossRef] [Green Version]
  35. Sa, I.; Ge, Z.; Dayoub, F.; Upcroft, B.; Perez, T.; McCool, C. DeepFruits: A Fruit Detection System Using Deep Neural Networks. Sensors 2016, 16, 1222. [Google Scholar] [CrossRef] [Green Version]
  36. Kirk, R.; Cielniak, G.; Mangan, M. L*a*b*Fruits: A Rapid and Robust Outdoor Fruit Detection System Combining Bio-Inspired Features with One-Stage Deep Learning Networks. Sensors 2020, 20, 275. [Google Scholar] [CrossRef] [PubMed] [Green Version]
  37. Li, W.; Fu, H.; Yu, L.; Cracknell, A. Deep Learning Based Oil Palm Tree Detection and Counting for High-Resolution Remote Sensing Images. Remote Sens. 2017, 9, 22. [Google Scholar] [CrossRef] [Green Version]
  38. Ding, W.; Taylor, G.W. Automatic moth detection from trap images for pest management. Comput. Electron. Agric. 2016, 123, 17–28. [Google Scholar] [CrossRef] [Green Version]
  39. Zhong, Y.; Gao, J.; Lei, Q.; Zhou, Y. A Vision-Based Counting and Recognition System for Flying Insects in Intelligent Agriculture. Sensors 2018, 18, 1489. [Google Scholar] [CrossRef] [Green Version]
  40. Steen, K.A.; Christiansen, P.; Karstoft, H.; Jørgensen, R.N. Using Deep Learning to Challenge Safety Standard for Highly Autonomous Machines in Agriculture. J. Imaging 2016, 2, 6. [Google Scholar] [CrossRef] [Green Version]
  41. He, K.; Zhang, X.; Ren, S.; Sun, J. Deep Residual Learning for Image Recognition. In Proceedings of the The IEEE Conference on Computer Vision and Pattern Recognition (CVPR), Las Vegas, NV, USA, 27–30 June 2016. [Google Scholar]
  42. Redmon, J.; Farhadi, A. YOLOv3: An Incremental Improvement. arXiv 2018, arXiv:cs.CV/1804.02767. [Google Scholar]
  43. Pinto de Aguiar, A.S.; Neves dos Santos, F.B.; Feliz dos Santos, L.C.; de Jesus Filipe, V.M.; Miranda de Sousa, A.J. Vineyard trunk detection using deep learning—An experimental device benchmark. Comput. Electron. Agric. 2020, 175, 105535. [Google Scholar] [CrossRef]
  44. Aguiar, A.S.; Santos, F.N.D.; De Sousa, A.J.M.; Oliveira, P.M.; Santos, L.C. Visual Trunk Detection Using Transfer Learning and a Deep Learning-Based Coprocessor. IEEE Access 2020, 8, 77308–77320. [Google Scholar] [CrossRef]
  45. Liu, W.; Anguelov, D.; Erhan, D.; Szegedy, C.; Reed, S.E.; Fu, C.; Berg, A.C. SSD: Single Shot MultiBox Detector. In Proceedings of the European Conference on Computer Vision, Zurich, Switzerland, 6–12 September 2015. [Google Scholar]
  46. Howard, A.G.; Zhu, M.; Chen, B.; Kalenichenko, D.; Wang, W.; Weyand, T.; Andreetto, M.; Adam, H. MobileNets: Efficient Convolutional Neural Networks for Mobile Vision Applications. arXiv 2017, arXiv:cs.CV/1704.04861. [Google Scholar]
  47. Szegedy, C.; Vanhoucke, V.; Ioffe, S.; Shlens, J.; Wojna, Z. Rethinking the Inception Architecture for Computer Vision. arXiv 2015, arXiv:cs.CV/1512.00567. [Google Scholar]
  48. Szegedy, C.; Liu, W.; Jia, Y.; Sermanet, P.; Reed, S.; Anguelov, D.; Erhan, D.; Vanhoucke, V.; Rabinovich, A. Going Deeper With Convolutions. In Proceedings of the The IEEE Conference on Computer Vision and Pattern Recognition (CVPR), Boston, MA, USA, 7–12 June 2015. [Google Scholar]
  49. Santos, L.; Santos, F.; Mendes, J.; Costa, P.; Lima, J.; Reis, R.; Shinde, P. Path Planning Aware of Robot’s Center of Mass for Steep Slope Vineyards. Robotica 2020, 38, 684–698. [Google Scholar] [CrossRef]
  50. Abadi, M.; Barham, P.; Chen, J.; Chen, Z.; Davis, A.; Dean, J.; Devin, M.; Ghemawat, S.; Irving, G.; Isard, M.; et al. TensorFlow: A system for large-scale machine learning. arXiv 2016, arXiv:1605.08695. [Google Scholar]
  51. Everingham, M.; Van Gool, L.; Williams, C.K.; Winn, J.; Zisserman, A. The pascal visual object classes (voc) challenge. Int. J. Comput. Vis. 2010, 88, 303–338. [Google Scholar] [CrossRef] [Green Version]
Figure 1. Typical steep slope vineyard in the Douro’s region. The Douro Demarched region (41° 06 06″ N 7°47 56″ W) extends for many Portugal cities, such as Mesão Frio, Peso da Régua, Santa Marta de Penaguião, Vila Real, and others.
Agriculture 11 00131 g001
Figure 2. Single Shot Multibox architecture [45].
Agriculture 11 00131 g002
Figure 3. High-level design of the vine trunk detection framework. The procedure starts with the data acquisition in real-world vineyards, followed by the manual vine trunk annotation. The VineSet is extended using data augmentation techniques to increase the dataset size. Finally, the Neural Networks are trained and deployed in a Edge-AI manner, using dedicated hardware.
Agriculture 11 00131 g003
Figure 4. The AgRob V16 robotic platform recording data in one of the vineyards that compose the VineSet.
Agriculture 11 00131 g004
Figure 5. The five categories of vineyard images that compose the VineSet. (ad) Four of them are from different Portugal Vineyards and (e) the other represents the set of thermal images of the vineyard present in Figure 5a.
Agriculture 11 00131 g005
Figure 6. The result of the annotation process for trunk detection in two different vineyards represented in (a,b). The green dots represent the extremes of the annotated bounding boxes that contain the vineyard trunks.
Agriculture 11 00131 g006
Figure 7. Set of several augmentation operations that were applied to VineSet, such as translation, multiplication, hue and saturation, flip, rotation, Gaussian noise, and, finally, a random combination of three of the previously mentioned operations.
Agriculture 11 00131 g007aAgriculture 11 00131 g007b
Figure 8. The assisted labelling tool interface.
Agriculture 11 00131 g008
Figure 9. Interception over union representation.
Agriculture 11 00131 g009
Figure 10. Detection results in (a,b) two RGB images from different vineyards and (c) one thermal image using Single Shot Multibox Detector (SSD) MobileNet-V1 trained with VineSet.
Agriculture 11 00131 g010
Figure 11. Train and validation loss of SSD MobileNet-V1 using 50,000 epochs and considering Transfer Learning and training from scratch.
Agriculture 11 00131 g011
Figure 12. Automatic annotations in different areas of agriculture.
Agriculture 11 00131 g012
Table 3. Description of the augmentation operations used to expand the original collection of data.
Augmentation OperationDescription
RotationRotates the image by 15, −15 and 45 degrees.
TranslationTranslates the image by −30% to +30% on x- and y-axis.
ScaleScales the image to a value of 50 to 150% of their original size.
FlippingMirrors the image horizontally.
MultiplyMultiplies all pixels in an image with a random value sampled once per image, which can be used to make images lighter or darker.
Hue and saturationIncreases or decreases hue and saturation by random values. This operation first transforms images to HSV colourspace, then adds random values to the H and S channels, and afterwards converts back to RGB.
Gaussian noiseAdds noise sampled from Gaussian distributions element-wise to images.
Random combinationApplies a random combination of three of the previous operations.
Table 4. AP (%) and F1 Scores of the trained models. The three models were trained while using a small subset of the VineSet, and VineSet itself. In addition, using VineSet, three experiments were performed for each model. The performance of each one was compared using Transfer Learning (by fine-tuning) and training them from scratch with two different numbers of training epochs.
M delTrain DatasetFine-TuningFrom ScratchFrom Scratch
50 k50 k100 k
AP (%)F1AP (%)F1AP (%)F1
SSD MobileNet-V1Small subset49.740.610----
SSD MobileNet-V252.980.590----
SSD Inception-V246.100.610----
SSD MobileNet-V1VineSet84.160.84168.440.68585.930.834
SSD MobileNet-V283.010.80860.440.63983.700.812
SSD Inception-V275.780.84858.050.65876.770.849
Table 5. Inference time per image (ms) of each trained model deployed on the edge TPU device.
ModelInference Time per Image (ms)
SSD MobileNet-V121.18
SSD MobileNet-V223.14
SSD Inception-V2359.64
Table 6. Assisted labelling procedure evaluation.
DatasetNumber of ImagesNumber of TrunksAutomatic
Annotations (%)
Average Time with
Assisted Labelling (min)
Average Time without
Assisted Labelling (min)
Other vineyards117572.321.746.35
Hazelnut orchard2013948.345.9911.58
Forest264164728.05101.97137.25
Publisher’s Note: MDPI stays neutral with regard to jurisdictional claims in published maps and institutional affiliations.

