Article

Responses of Branch Number and Yield Component of Soybean Cultivars Tested in Different Planting Densities

1
Institute of Crop Sciences, Chinese Academy of Agricultural Sciences/National Soybean Industrial Technology R & D Center, Beijing 100081, China
2
School of Agronomy, Jiangxi Agricultural University, Nanchang 330045, China
*
Author to whom correspondence should be addressed.
Agriculture 2021, 11(1), 69; https://doi.org/10.3390/agriculture11010069
Submission received: 14 December 2020 / Revised: 7 January 2021 / Accepted: 13 January 2021 / Published: 15 January 2021

Abstract

:
Increasing planting density is one of the key management practices to enhance soybean yield. A 2-yr field experiment was conducted in 2018 and 2019 including six planting densities and two soybean cultivars to determine the effects of planting density on branch number and yield, and analyze the contribution of branches to yield. The yield of ZZXA12938 was 4389 kg ha−1, which was significantly higher than that of ZH13 (+22.4%). In combination with planting year and cultivar, the soybean yield increased significantly by 16.2%, 31.4%, 41.4%, and 46.7% for every increase in density of 45,000 plants ha−1. Yield will not increase when planting density exceeds 315,000 plants ha−1. A correlation analysis showed that pod number per plant increased with the increased branch number, while pod number per unit area decreased; thus, soybean yield decreased. With the increase of branch number, the branch contribution to yield increased first, and then plateaued. ZH13 could produce a high yield under a lower planting density due to more branches, while ZZXA12938 had a higher yield potential under a higher planting density due to the smaller branch number and higher tolerance to close planting. Therefore, seed yield can be increased by selecting cultivars with a little branching capacity under moderately close planting.

1. Introduction

Soybean, an important raw material in vegetable oil, protein-rich human food, and animal feed, plays an important role in global food security [1,2]. With economic growth and diet change, the demand for soybean products will continue to increase [3,4]. In the case of China, soybean consumption has exceeded 100 million tons in 2017, while the self-sufficiency rate is only approximately 15% [5], a huge supply gap. Many researchers have investigated that planting soybeans densely can remarkably increase aboveground biomass and seed yield [6,7,8,9]. In addition, the plots with typical or high yield records often have higher planting densities. In Arkansas, United States, a record soybean yield of 7501 kg ha−1 was recorded in 2014 with a planting density of 371,000 plants ha−1 [10]. In Xinjiang Province, China, the highest soybean yield in 2010 was 6088 kg ha−1 with a planting density of 299,000 plants ha−1 [11]. Soybean plants can intercept and use solar radiation more efficiently under dense planting, which is an important crop management for high-yielding soybean [2,12,13,14].
The aboveground canopy structure is one of the most important phenotypic traits in soybean [13,15]. Canopy structure determines the light distribution, light interception, and efficiency of solar energy conversion of the crop population, which affects the accumulation and distribution of photosynthetic products [9]. Branching as an important component of canopy structure also affects the formation of soybean yield [15,16,17,18]. On soybean plants, pods can be found at internodes of the main stem and branches [19,20]. Kahlon et al. [21] and Egli [22] showed that the soybean yield can be similar between two fields, one with a high density planting and low branching capacity and the other with a low-density planting and high branching capacity. Soybean can compensate for yield loss that occurs by self-regulating branch development and increasing the branch setting rate in adverse conditions [13,23]. Previous studies have found a high correlation between the yield per plant and the yield of soybean branches [20,24,25]. For example, Carpenter and Board [20] found that the soybean yield per plant can be increased by 3.78 g when the branch weight of soybean increased by 1 g.
Branch capacity for compensating yield loss is dependent on planting densities. When soybean planting density is too low, the yield of branches cannot compensate for the loss of yield due to the shortage of seedlings [17,26,27]. The number and growth of branches are also influenced by factors such as genotype and agricultural management [28,29]. The branches of soybean are developed from axillary buds. The gene expression of the low-branching cultivars regulating axillary bud development is low, and the number of plant branches finally formed is smaller, while the genes that regulate the development of axillary buds in multibranching cultivars were active, and more branches were formed in the end [26,27]. In addition, light quality is also an important factor affecting the development of axillary buds. The axillary bud development of soybean was inhibited under low light condition, which can reduce branch number [30]. With the increased planting density, the light condition in the crop population was deteriorative, which will affect plant morphological structure in return [14,16,31]. Therefore, the relationship between branch number and planting density in soybean remains to be explored.
In addition, tolerance to high planting density was found to be different among soybean cultivars that had different plant types [14,18,20,32]. To fully utilize land and light energy resources, high planting density tolerance is gradually enhanced with the newly released soybean cultivars. Compared with the older cultivars, the current soybean cultivars often have an optimized canopy structure under dense planting, thus alleviating the negative effect of densification on branch number and pod number per plant [18]. To date, the relationship between branch number and planting density among the cultivars released in different periods have not been evaluated. Moreover, the differences in the effects of branching on yield composition between old and new cultivars need to be analyzed.
In the present study, two soybean cultivars (ZZXA12938, released in the 2010s; ZH13, released in the 2000s) were sown under six planting densities. The objectives of this study were to (1) analyze the yield of soybean cultivars under different planting densities, (2) evaluate the branching characteristics of soybean cultivars under various planting densities, and (3) investigate the branch yield contribution rate of soybean under different planting densities. We proposed the following hypothesis: (1) high density planting can significantly increase soybean seed yield, (2) the number of soybean branches decreased with the increase of planting density, and (3) the increase of yield contribution rate of mainstem was the main reason for yield increase under dense planting.

2. Materials and Methods

2.1. Experimental Site

Field experiments were carried out in 2018 and 2019 at Xinxiang Experimental Station (N 35°09′, E 113°48′) of Institute of Crop Sciences, Chinese Academy of Agricultural Sciences, Henan Province, China. This experimental field has sandy-loam soil, with the upper 0.4 m of soil containing 12.9 g kg−1 organic matter, 63.8 mg kg−1 total nitrogen (N), 15.9 mg kg−1 available phosphorus (P), and 112.1 mg kg−1 available potassium (K). The preceding crop was winter wheat. Mean monthly air temperature and rainfall during the soybean growing seasons are shown in Table 1. The average monthly temperature of soybean growing season in 2018 and 2019 was 25.0 and 25.1 °C, respectively. The amounts of precipitation during the growing season in were 262.1 and 343.3 mm, respectively.

2.2. Experimental Design

Experiments were laid out as a split plot design with four replicates in both years with cultivar as the first factor and planting density as the second factor. Soybean cultivars ZZXA12938 and ZH13 were used. ZZXA12938 is a convergent type cultivar of MG 3.9 with subindeterminate, which was selected and bred in the 2010s. ZH13 is a semidwarf cultivar of MG 3.7 with subindeterminate, which was released in the 2000s. ZH13 is widely planted in China. There were six planting densities included (i.e., 135,000, 180,000, 225,000, 270,000, 315,000, and 360,000 plants ha−1), which were randomly distributed within the main plot. Each plot was 72 m2 in area (7.2 m × 10 m). Soybean was sown at a row spacing of 0.4 cm. The plant spacing of soybean among the six planting densities were 18.5, 13.9, 11.1, 9.3, 7.9, and 6.9 cm, respectively. In order to ensure the final number of plants in the field meets the requirement of the experimental density, 3 seeds were planted in one hill during soybean sowing. When soybean plants reached the V3 stage, the redundant plants in each hole were eliminated by artificial thinning, and the final planting density in the experiment was reached. Soybean was sown on 12 June 2018 and on 18 June 2019. Each plot was irrigated with 60 mm of water immediately after sowing. Each plot received 75 kg N ha−1, 100 kg P2O5 ha−1, and 75 kg K2O ha−1 before sowing and no top-dressing was added during growth. Seed harvest was performed on 7 October 2018 and 14 October 2019.

2.3. Plant Sampling and Analysis

At the physiological maturity (R7) stage of soybean, three 4 m2 (0.8 m × 5 m) quadrats were randomly selected from each plot to measure yield (kg ha−1, the grain moisture content was calculated as 13.5%).
Three plant samples were randomly selected from each plot. Each sample contains 50 soybean plants. The number of branch, pod, and seed in mainstem and in branch were recorded. The seed weight in ZZXA12938 and ZH13 was also determined.
The contribution of the yield of soybean branches (%) was calculated as the ratio of seed weight in branches (g) over weight per plant (%). The result obtained was multiplied by 100 to get a percentage value.

2.4. Statistical Analysis

The effects of planting densities and years on seed yield, yield components, and branch number were evaluated using univariate analysis of variance (ANOVA) procedures. After verifying the homogeneity of error variances, all data across years, cultivars, and planting densities were pooled for use in the ANOVA. Differences were determined using least significant difference analysis, with differences considered significant at p = 0.05. The relationship between yield and planting density, as well as seed (pod) per area and branch number was analyzed using quadratic regression. The relationship between seed (pod) per plant and branch number was analyzed by linear regression. The relationship between yield and branch number, as well as the relationship between the contribution of branches on yield and branch number were analyzed using segmental regression. All analyses were conducted using SPSS 19.0 (SPSS Inc., Chicago, IL, USA).

3. Results

3.1. Response of Yield and Yield Components to Planting Density

Seed yield, seed number, pod number, and hundred-seed weight were significantly affected by planting density and cultivar (Table 2, p ≤ 0.001). The seed yield of ZZXA12938 was 4389 kg ha−1, which was 22.4% higher than that of ZH13. This finding indicates that the cultivar ZZXA12938 had a higher yield potential compared with ZH13. In addition, the number of seeds per plant and pods per plant of ZZXA12938 were 50.8% and 36.0% higher, respectively, compared with ZH13. In contrast, the hundred-seed weight was significantly 31.4% lower in ZZXA12938 compared with ZH13, indicating that the high yield potential of ZZXA12938 was mainly due to the greater number of pods and seeds per plant (Table 2).
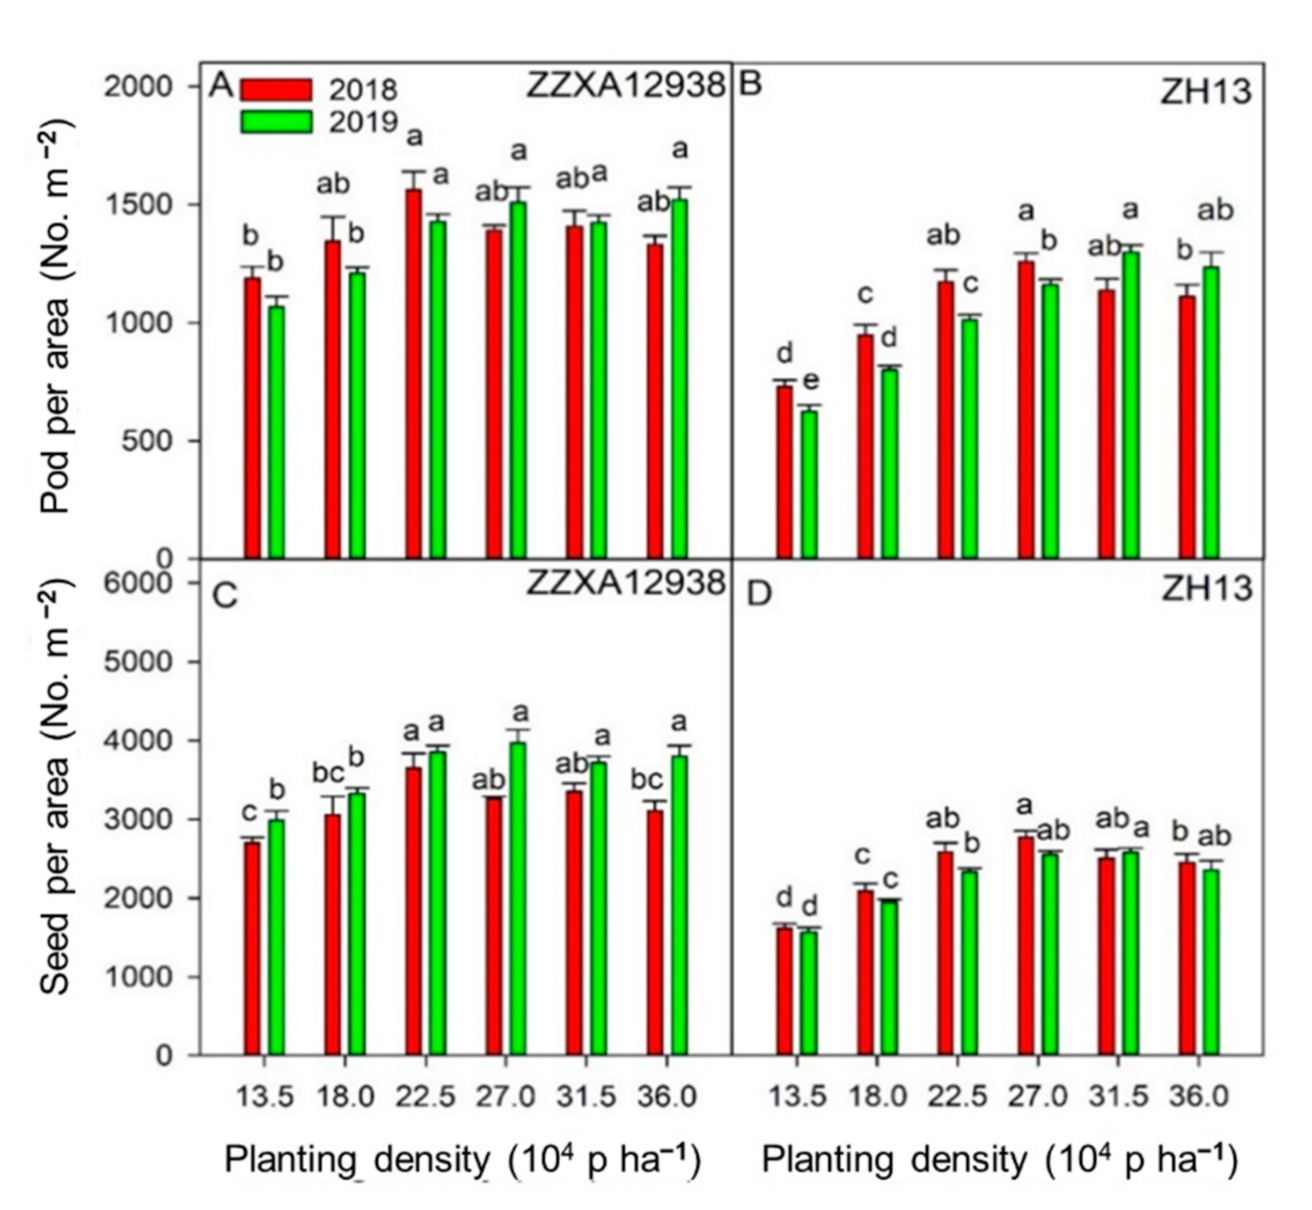
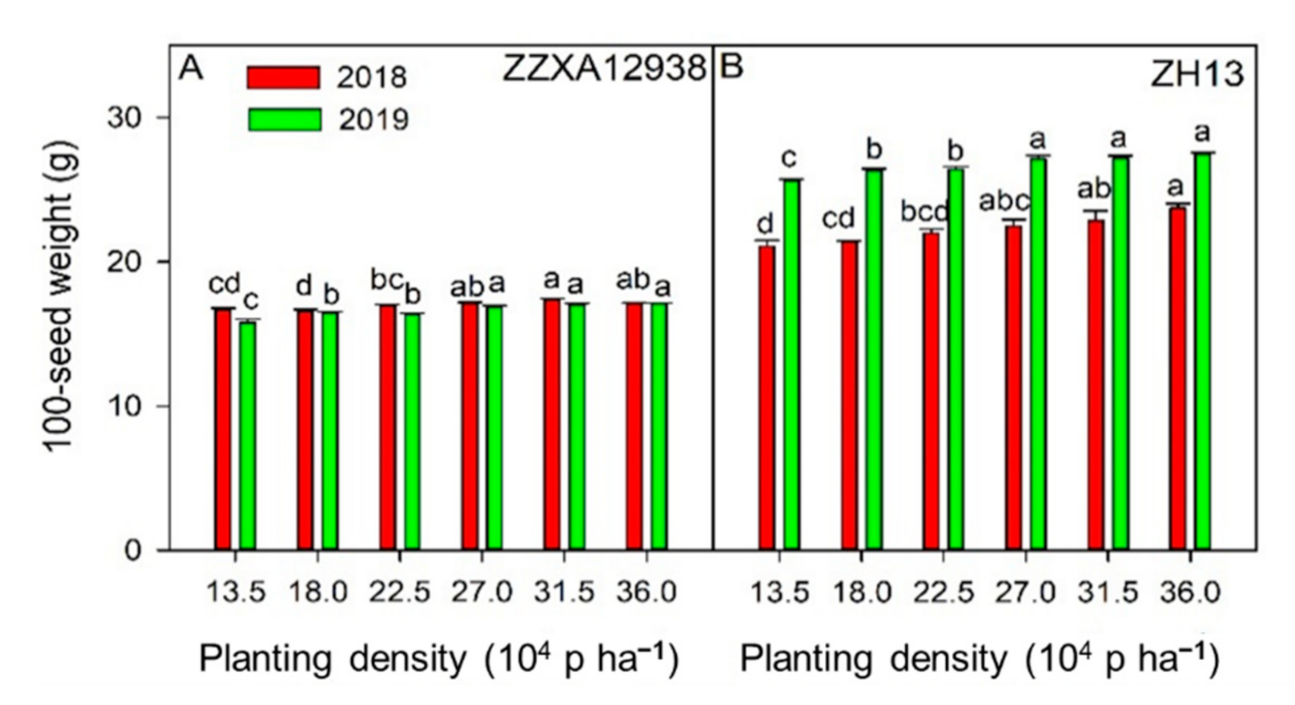
With the increase of planting density, the number of pods and seeds per plant decreased gradually for both cultivars (Figure 1). However, the variation of the relationship between pods and seeds per plant and planting density for the two soybean cultivars differed. As the planting density increased from 135,000 to 270,000 plants ha−1, the number of pods and seeds per ZZXA12938 individual decreased by 35.7% and 36.4%, respectively. There was no significant change with further increase in planting density. No significant changes were found in the number of pods and seeds per ZH13 individual as the planting density increased from 135,000 to 225,000 plants ha−1. In addition, as the planting density increased from 225,000 to 360,000 plants ha−1, the number of pods and seeds per ZH13 individual decreased by 32.9% and 39.0%, respectively. With the increase of planting density, the number of pods and seeds per area showed a trend of increasing first, then plateauing (Figure 2). The number of pods and seeds per area in ZZXA12938 were both significantly higher than that in ZH13 under the same planting conditions. With the increase in planting density, the 100-seed weight increased gradually (Figure 3). As the planting density increased from 135,000 to 360,000 plants ha−1, the 100-seed weight of ZZXA12938 and ZH13 increased by 5.3% and 9.4%, respectively. The 100-seed weight in ZZXA12938 was significantly lower than that for ZH13 in the same treatment.
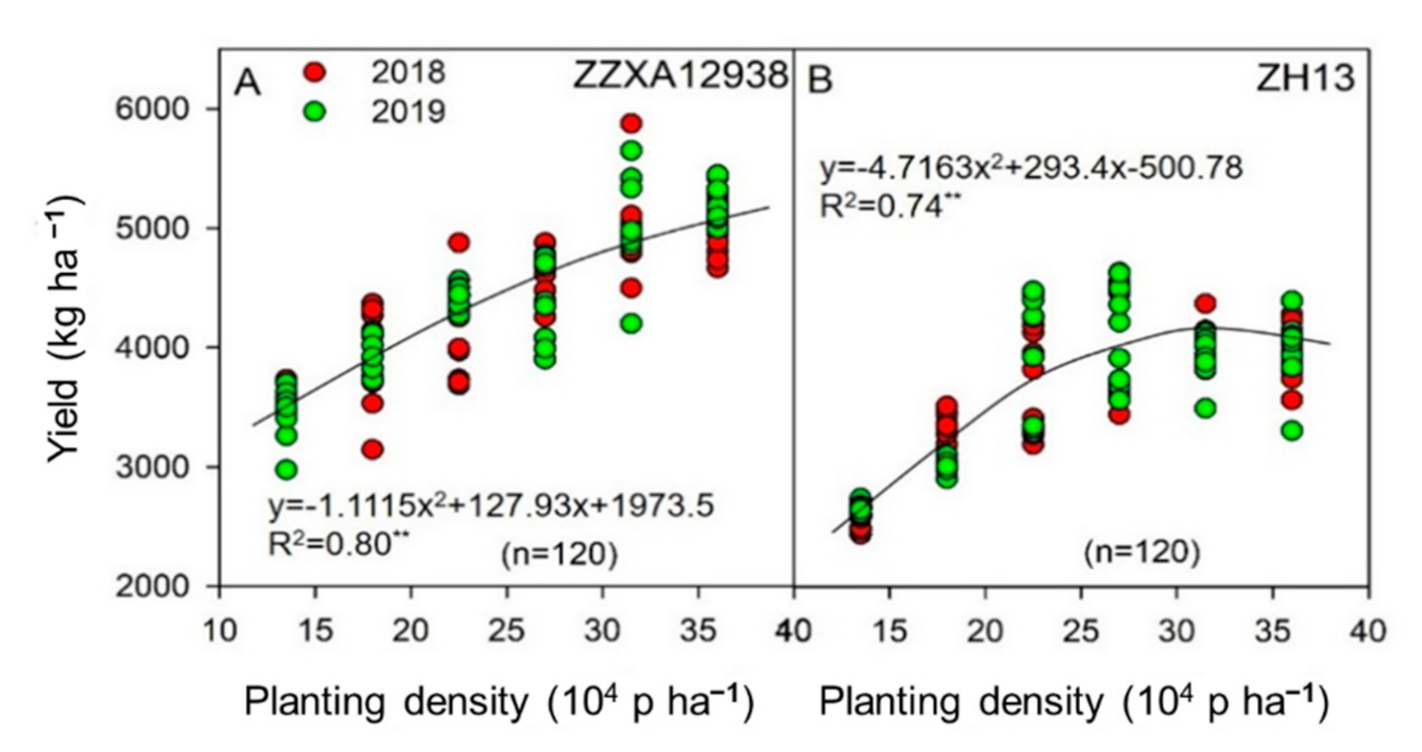
The soybean yield increased significantly by 16.2%, 31.4%, 41.4%, and 46.7% for every increase in planting density of 45,000 plants ha−1, within the range of 135,000 to 315,000 plants ha−1. As planting density increased from 315,000 to 360,000 plants ha−1, there was no significant change in seed yield. The yield and planting density of soybean cultivars showed a quadratic function (Figure 4, p ≤ 0.01). According to the regression model, the optimal density of ZZXA12938 was 350,000 plants ha−1 in the present study, while that of ZH13 was 311,000 plants ha−1. The maximum simulated seed yield of ZZXA12938 was 5090 kg ha−1, which was 25.3% higher than that of ZH13 (4062 kg ha−1), indicating that the former had a higher yield potential.

3.2. Response of Branching to Planting Density

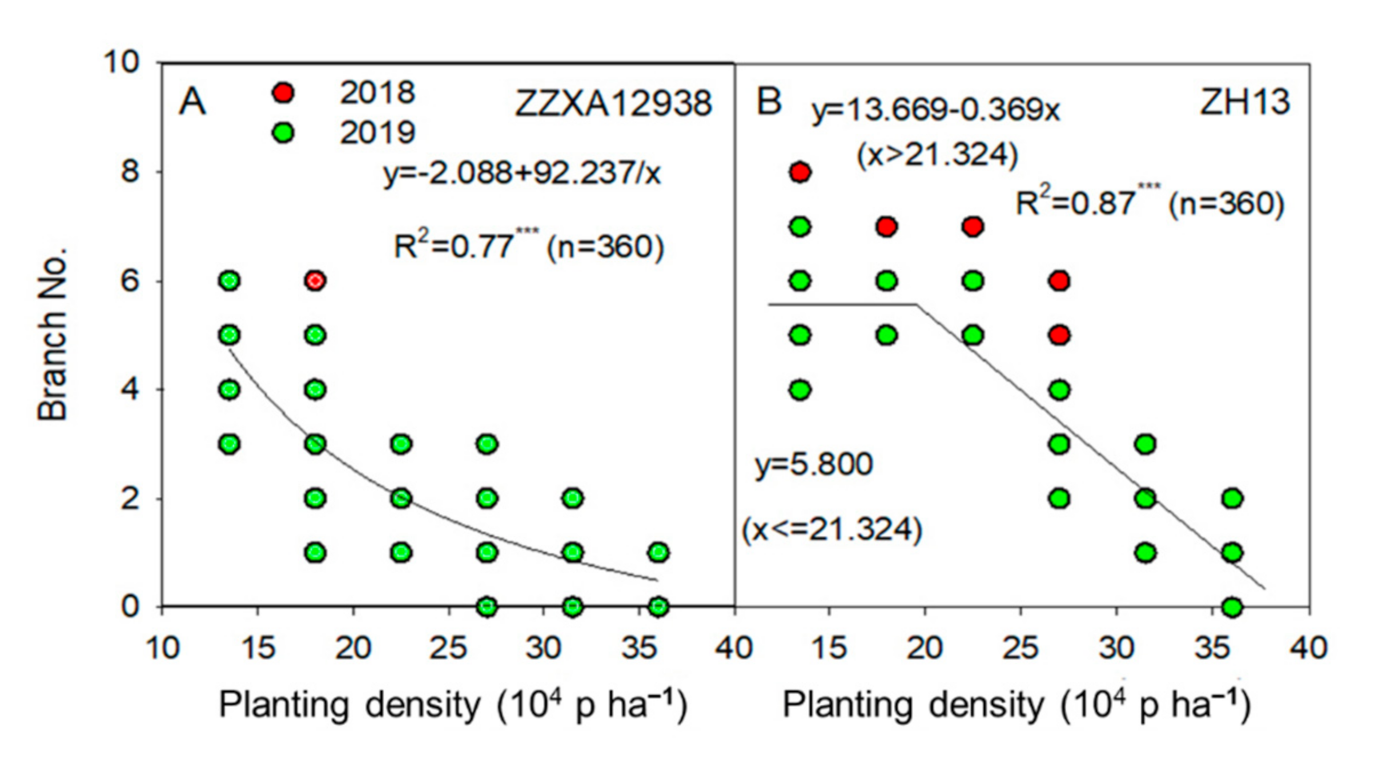
The correlation between branch number and planting density was different for the two soybean cultivars (Figure 5). A significant negative correlation was found between planting density and branch number in ZZXA12938. With the increase of planting density, the number of soybean branches decreased sharply first and then slowly, and the final branch number tended to be zero (Figure 5A). However, a plateau followed by a linear relationship was found between branch number and planting density for ZH13 (Figure 5B). The branch number for ZH13 did not change with the increase of planting density until planting density increased to 213,240 plants ha−1 based on the regression curve. When planting density was above 213,240 plants ha−1, the number of soybean branches decreased linearly.

3.3. Relationship between the Number of Seeds and Pods, and Branches

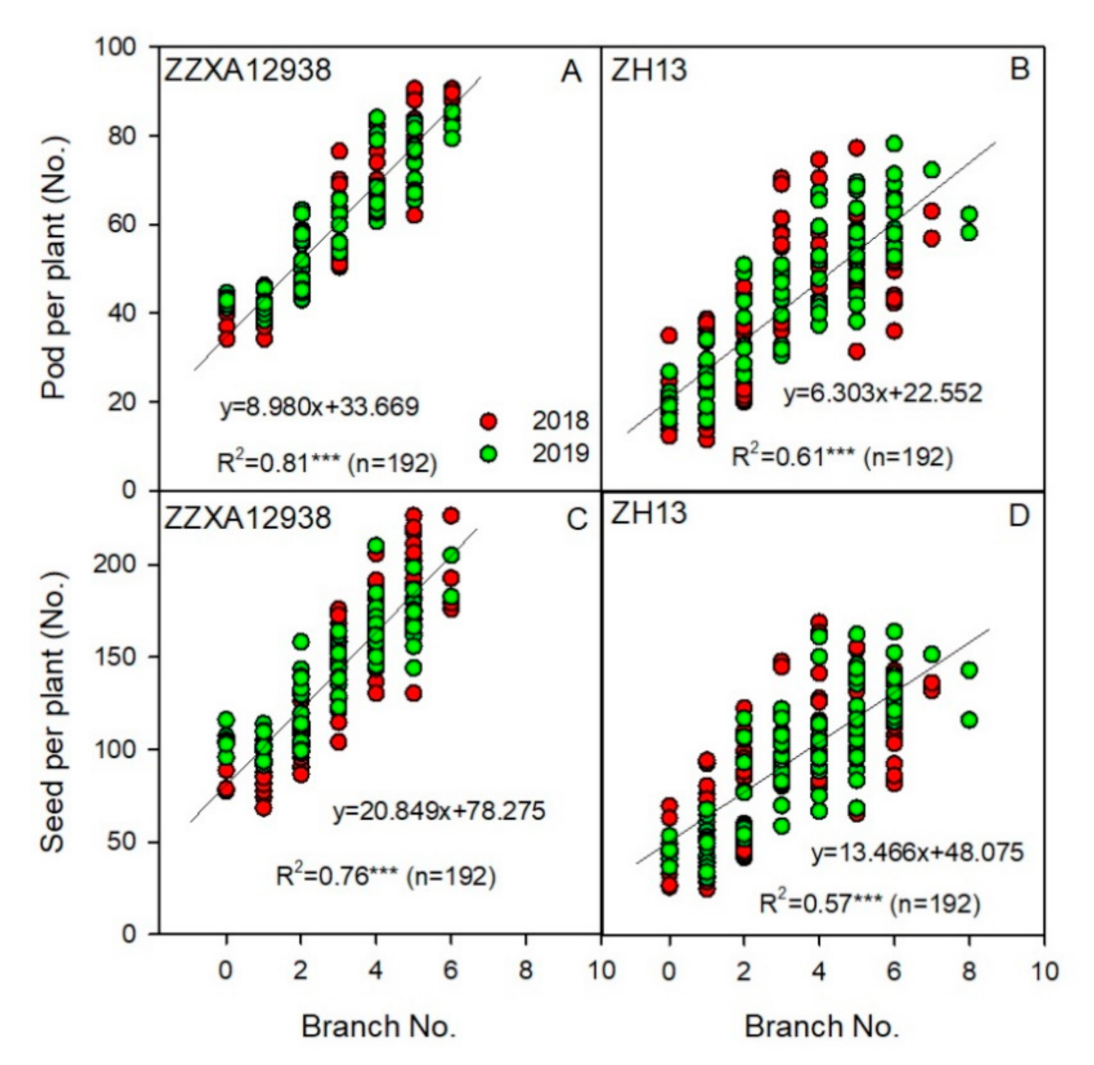
A significant positive relationship was found between the number of pods and seeds per plant and the number of branches (Figure 6, p ≤ 0.001). With the increase in the number of branches, the extent to which the number of pods and seeds per plant increased in ZZXA12938 was higher than that in ZH13 (i.e., the slope and intercept of the curve for ZZXA12938 were both higher).
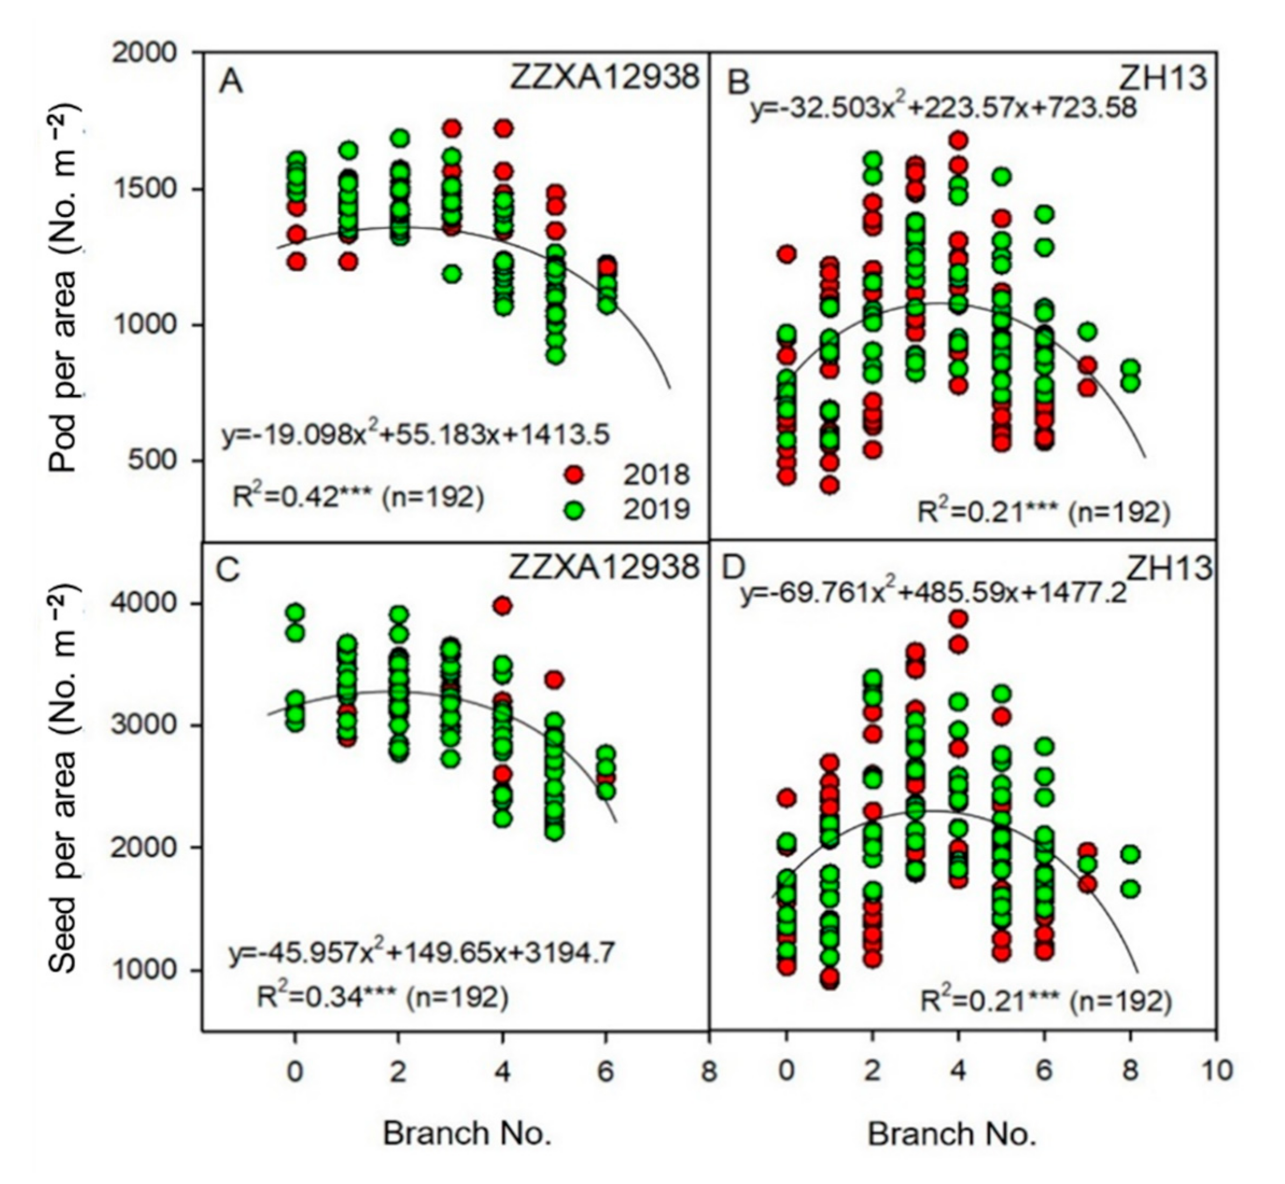
The numbers of pods and seeds per area of soybean and the number of branches are shown in a quadratic function (Figure 7, p ≤ 0.001). With the increase in the number of branches, the number of pods and seeds per unit area increased first and then decreased. The maximum value of pods and seeds per area of ZZXA12938 and ZH13 were found when the branch number ranged from 1.45 to 1.63 and from 3.44 to 3.47, respectively.
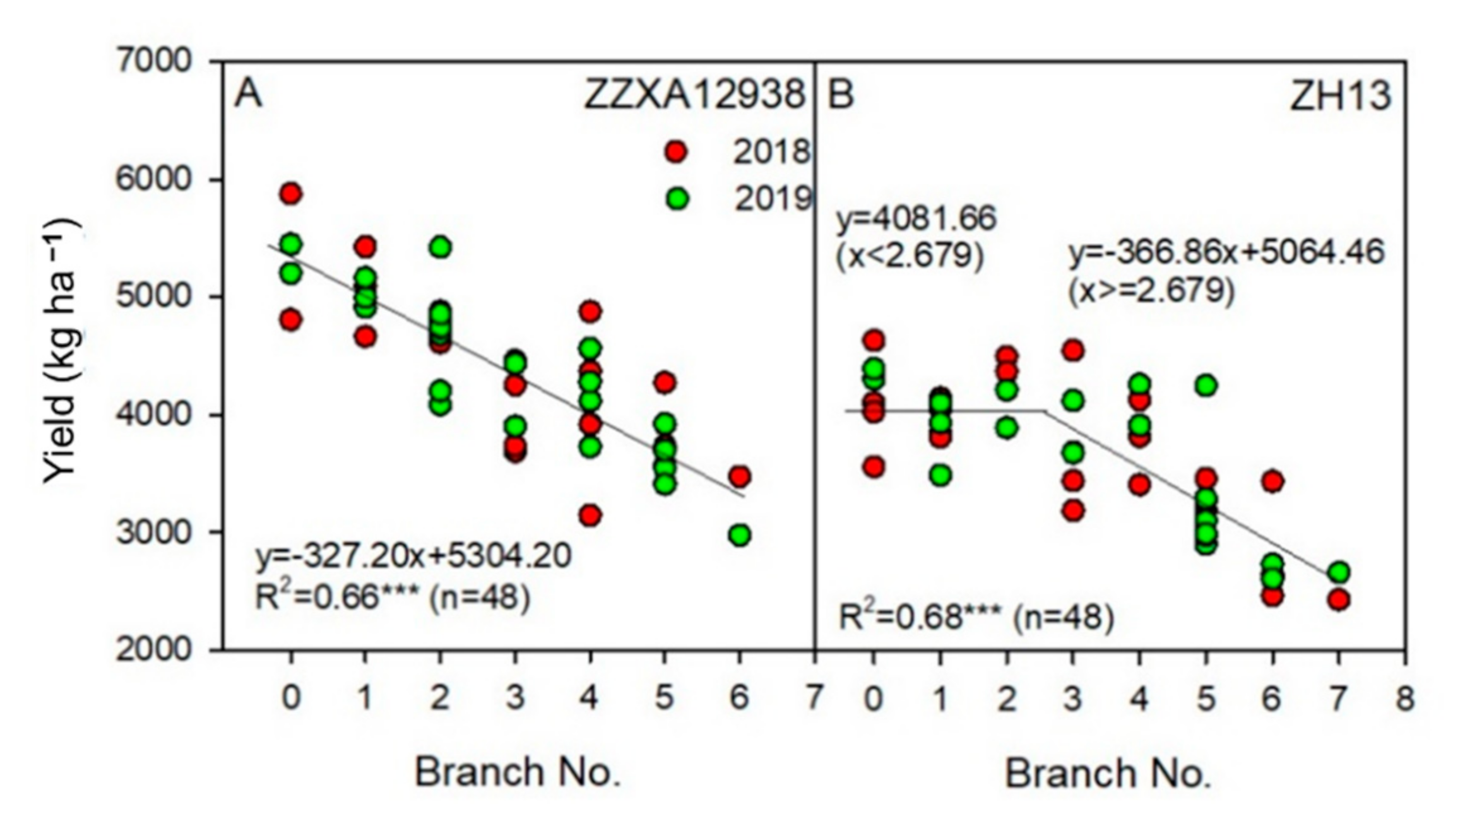
The correlations between seed yield and the number of branches were different for the two soybean cultivars (Figure 8, p ≤ 0.001). A significant negative correlation was found between seed yield and branch number in ZZXA12938 (Figure 8A). However, a plateau followed by a linear relationship was found between seed yield and the number of branches in ZH13 (Figure 8B). The seed yield of ZH13 remained at the same level with the increase in the number of branches from 0 to 2.7 branch per plant, and then decreased gradually.

3.4. Branch Yield Contribution Rate

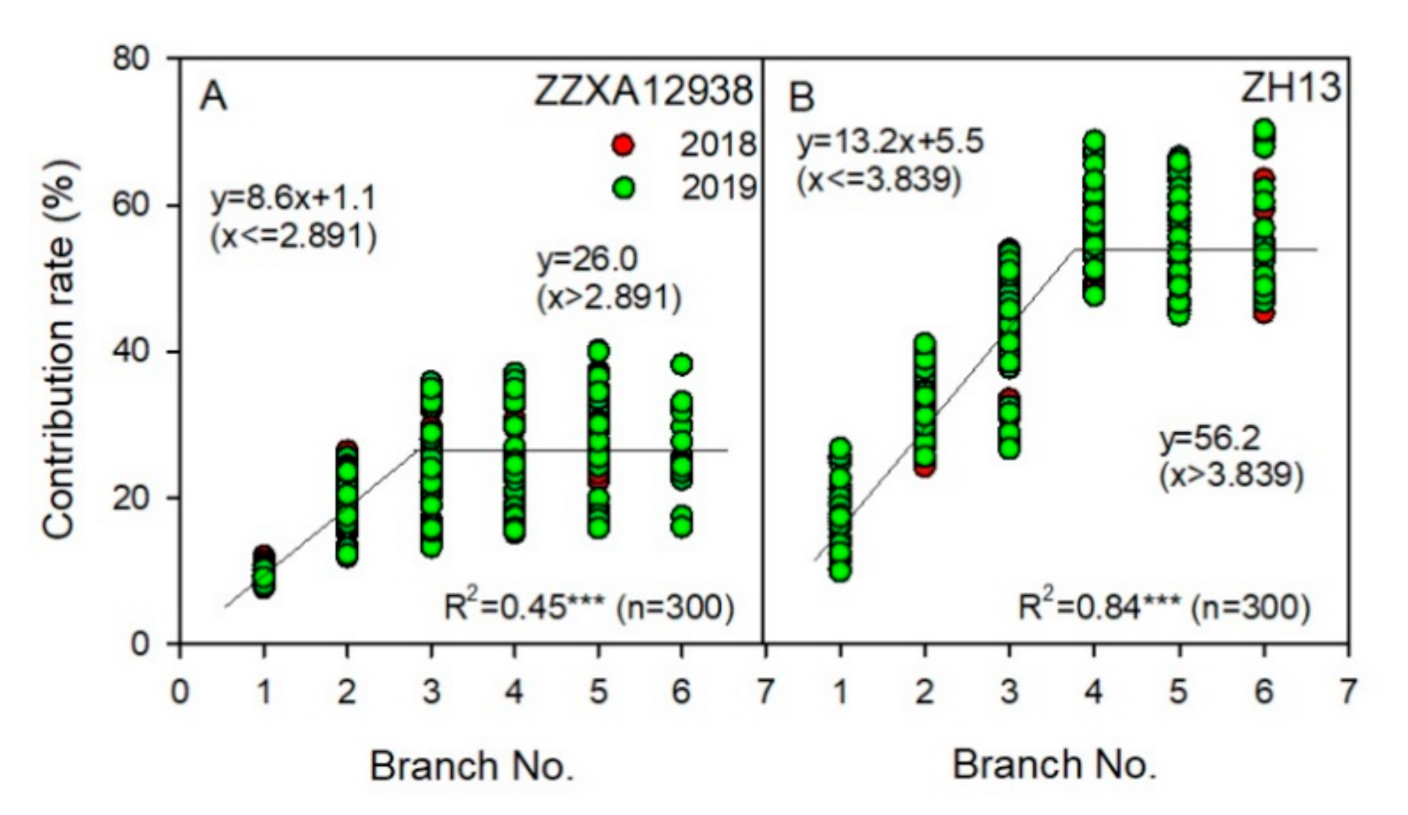
Linear plus platform relationship was found between branch yield contribution rate and branch number for soybean (Figure 9, p ≤ 0.001). Compared to ZH13, with the increase of the branch number, the branch yield contribution rate in ZZXA12938 was lower and the increasing duration was shorter (the inflection points in ZZXA12938 and ZH13 were 2.89 and 3.84, respectively). The branch yield contribution rate in ZZXA12938 at the plateau stage was 26%, which was significantly lower than that in ZH13 (56.2%). The results indicated that the yield of ZH13 was strongly dependent on its branch number and should be planted at a relative low density, while the yield of ZZXA12938 was strongly dependent on its mainstem and should be planted densely.

4. Discussion

Close planting improves light interception and photosynthesis, resulting in a remarkable increase in biomass and seed yield [16,33,34,35]. Under a constant harvest index, the increase of crop yield under dense planting conditions was due to the increase of dry matter accumulation [9,36]. In the present study, seed yield of the two soybean cultivars were determined under six different planting densities, and the yield increased first and then decreased with the increase of planting density according to the regression model (Figure 4). Egli [37] and Holshouser and Whittaker [38] showed that the optimal planting density of soybean ranged from 70,000 to 600,000 plants ha−1 depending on cultivar. From the regression model, the optimal density of ZZXA12938 was 350,000 plants ha−1 in the field experiment, while that of ZH13 was 311,000 plants ha−1, which was consistent with the previous results [37,38]. In the present study, seed yield of ZZXA12938 was 4389 kg ha−1, which was 22.4% greater than that of ZH13 (Table 1). In addition, seed yield of ZZXA12938 can reach up to 5090 kg ha−1 based on the regression model, which was 25.3% higher than that in ZH13 (Figure 4). These findings indicate that the cultivar ZZXA12938 is more suitable for dense planting and has a higher yield potential.
Pods grow at the nodes of the soybean plant. Many researchers have studied the relationship between seed yield and the number of nodes and indicated that the number of nodes per unit area should be increased in order to achieve high soybean yield [21,23,39]. The pod–nodes occur on both the mainstem and branches of the soybean plant [19,20]. Branch number for the two cultivars showed an obvious difference with the increase of planting density (Figure 5). The branching capacity of ZZXA12938 can be stimulated only under lower planting densities. However, for ZH13, the branch number can increase to more than five under a low density condition, and then decreased gradually with the further increase of planting density. Previous studies showed that the number of branches in a soybean plant depends on the genetic characteristics of the cultivar and the growth environment [28,29,40]. In the past, soybean production in China was mainly dominated by smallholders, with low sowing rate and serious land leakage, which required the soybean cultivars having a strong branching ability. Currently, mechanized seeding technology is widely applied, which can make the field grown plants evenly distributed. Therefore, the requirements on the branching ability of cultivars have been gradually reduced [41]. In this context, increasing planting density is becoming an increasingly important strategy to increase soybean yield. Wolters and Jürgens [28] and Wang et al. [29] showed that the development of axillary buds was inhibited with the increase of planting density. Therefore, an optimal planting density is essential to ensure soybean yield for a given cultivar in a specific region.
A significant positive correlation was found between the number of pods and seeds per plant and the number of branches (Figure 6), which was consistent with previous studies [13,23]. The results showed that soybean could increase the total number of nodes by increasing the number of branches, thus increasing the number of pods per plant and seed yield per plant. However, the increase of branches was based on the premise of low planting density, which is the cost of losing the number of plants per unit area. Therefore, the increase of pod number per unit area is the key factor for high soybean yield [22,42]. According to the regression equation, the number of pods and seeds per unit area of ZZXA12938 and ZH13 decreased significantly when the number of branches was greater than 1.6 and 3.4, respectively (Figure 7). In addition, soybean yield decreased with the further increase of branch number (Figure 8), which indicated that it was difficult to obtain a higher seed yield only by increasing the number of soybean branches under low planting regimes.
In the present study, the yield formation of the two soybean cultivars had different responses to dense planting. Compared with ZH13, ZZXA12938 was suitable for higher planting density and had a higher yield potential (Figure 4). In contrast, seed yield formation of the ZH13 was more dependent on branches (Figure 9). The yield of ZZXA12938 decreased significantly with the increase of branching, while the yield of ZH13 remained steady with the increase of branching, and then decreased significantly (Figure 8). The results showed that cultivar ZH13 showed a stronger compensation by increasing branching under low density planting, while ZZXA12938 possessed a higher yield potentiality by improving the tolerance to high planting density.

5. Conclusions

This study has fully verified our hypothesis. Firstly, increasing planting density is an important approach to achieving the potential of soybean yield. As the planting density increased from 135,000 to 360,000 plants ha−1, the seed yield of soybean was significantly increased by 48.2%. Secondly, there was generally a negative correlation between branch number and planting density. Compared with cultivar ZH13, ZZXA12938 was more tolerant to high planting density and has a higher yield potential. Therefore, based on the current advanced seeding technology, it is necessary to select the cultivars with a weak branching ability and a moderately dense planting for high yielding.

Author Contributions

Conceptualization, S.H., T.H., and C.W.; methodology, C.X. and R.L.; software, C.X. and R.L.; validation, S.S., T.H., and C.W.; formal analysis, C.X., R.L., W.S., and T.W.; investigation, C.X. and R.L.; resources, S.S., T.H., and C.W.; data curation, C.X. and R.L.; writing—original draft preparation, C.X.; writing—review and editing, C.X. and R.L.; visualization, C.X. and R.L.; supervision, T.H. and C.W.; project administration, T.H. and C.W.; funding acquisition, T.H. and C.W. All authors have read and agreed to the published version of the manuscript.

Funding

This research was supported by the National Key Research and Development Program of China (2018YFD0100901).

Institutional Review Board Statement

Not applicable.

Informed Consent Statement

Not applicable.

Data Availability Statement

The data presented in this study are available on request from the corresponding author.

Acknowledgments

We are thankful to Shoubing Huang for his help in English editing for the paper.

Conflicts of Interest

The authors declare no conflict of interest.

References

  1. Song, W.; Yang, R.; Wu, T.; Wu, C.; Sun, S.; Zhang, S.; Jun, B.; Tian, S.; Liu, X.; Han, T. Analyzing the effects of climate factors on soybean protein, oil contents and compositions by extensive and high-density. J. Agric. Food Chem. 2016, 64, 4121–4130. [Google Scholar] [CrossRef]
  2. Carciochi, W.; Schwalbert, R.; Andrade, H.; Corassa, G.; Carter, P.; Gaspar, P.; Schmidt, J.; Ciampitti, I. Soybean seed yield response to plant density by yield environment in North America. Agron. J. 2019, 111, 1923–1932. [Google Scholar] [CrossRef] [Green Version]
  3. Oslaj, M.; Mursec, B.; Vindis, P. Biogas production from maize hybrids. Biomass Bioenergy 2010, 34, 1538–1545. [Google Scholar] [CrossRef]
  4. Mauser, W.; Klepper, G.; Zabel, F.; Delzeit, R.; Hank, T.; Putzenlechner, B.; Calzadilla, A. Global biomass production potentials exceed expected future demand without the need for cropland expansion. Nat. Commun. 2015, 6, 8946. [Google Scholar] [CrossRef] [PubMed] [Green Version]
  5. Yin, Y.; Xu, C.; Song, W.; Hu, S.; Wu, C. Increasing planting density is an important approach to achieve the potential of soybean yield. Soils Crops 2019, 8, 361–367. [Google Scholar] [CrossRef]
  6. Purcell, L.C.; Ball, R.A.; Reaper, J.D.; Vories, E.D. Radiation use efficiency and biomass production in soybean at different plant population densities. Crop Sci. 2002, 42, 172–177. [Google Scholar] [CrossRef]
  7. Gan, Y.; Stulen, I.; Van Keulen, H.; Kuiper, P.J.C. Physiological response of soybean genotypes to plant density. Field Crops Res. 2002, 74, 231–241. [Google Scholar] [CrossRef]
  8. Zhang, W.; Zhang, H.; Wang, H.; Xie, F.; Chen, Z. Effects of spacings and planting densities on agronomic traits and yield in high-oil soybeans. Soybean Sci. 2006, 25, 283–287. [Google Scholar] [CrossRef]
  9. Xu, C.; Huang, S.; Tian, B.; Ren, J.; Meng, Q.; Wang, P. Manipulating planting density and nitrogen fertilizer application to improve yield and reduce environmental impact in Chinese maize production. Front. Plant Sci. 2017, 8, 1234. [Google Scholar] [CrossRef]
  10. Hightower, M. Arkansas Producer Smashes State Soybean Yield Record. Delta Farm Press Exclusive Insight, 2014. Available online: http//connection.ebscohost.com/clarticles/98312029 (accessed on 7 January 2021).
  11. Wang, X.G.; Zhao, N.L.; Wei, J.J.; Dong, Z. Case analysis of super-high-yielding soybean cultivar, Zhonghuang 35. Soybean Sci. 2011, 30, 1051–1053. [Google Scholar] [CrossRef]
  12. Walker, E.R.; Mengistu, A.; Bellaloui, N.; Koger, C.H.; Roberts, R.K.; Larson, J.A. Plant population and row-spacing effects on maturity group III soybean. Agron. J. 2010, 102, 821–826. [Google Scholar] [CrossRef] [Green Version]
  13. Suhre, J.; Weidenbenner, N.; Rowntree, S.; Wilson, E.; Naeve, S.; Conley, S.; Casteel, S.; Diers, B.; Esker, P.; Specht, J. Soybean yield partitioning changes revealed by genetic gain and seeding rate interactions. Agron. J. 2014, 106, 1631–1642. [Google Scholar] [CrossRef] [Green Version]
  14. Zhang, R.; Fu, L.; Tong, B.; Wu, Q.; Liu, C.; Zhu, H.; Sun, G. Effect of plant density and row spacing on agronomic characteristics and yield for different soybeans. Soybean Sci. 2015, 34, 52–55. [Google Scholar] [CrossRef]
  15. Zhang, X.; Du, J.; Zheng, D. Effect of density on canopy structure and photosynthetic characteristics in soybean population. Agri. Res. Arid Areas 2011, 29, 75–80. [Google Scholar]
  16. Gaspar, A.P.; Conley, S.P. Responses of canopy reflectance, light interception, and soybean seed yield to replanting suboptimal stands. Crop Sci. 2015, 55, 377–385. [Google Scholar] [CrossRef]
  17. Mathan, J.; Bhattacharya, J.; Ranjan, A. Enhancing crop yield by optimizing plant developmental features. Development 2016, 143, 3283–3294. [Google Scholar] [CrossRef] [Green Version]
  18. Sun, Z.X.; Su, C.; Yun, J.; Jiang, Q.; Wang, L.; Wang, Y.; Cao, D.; Zhao, F.; Zhao, Q.; Zhang, M.; et al. Genetic improvement of the shoot architecture and yield in soya bean plants via the manipulation of GmmiR156b. Plant Biotechnol. J. 2019, 17, 50–62. [Google Scholar] [CrossRef] [Green Version]
  19. Board, J. Yield components related to seed yield in determinate soybean. Crop Sci. 1987, 27, 1296–1297. [Google Scholar] [CrossRef]
  20. Carpenter, A.; Board, J. Growth dynamic factors controlling soybean yield stability across plant populations. Crop Sci. 1997, 37, 885–891. [Google Scholar] [CrossRef]
  21. Kahlon, C.; Board, J.; Kang, M. An analysis of yield component changes for new vs. old soybean cultivars. Agron. J. 2011, 103, 13–22. [Google Scholar] [CrossRef]
  22. Egli, D. The relationship between the number of nodes and pods in soybean communities. Crop Sci. 2013, 53, 1668–1676. [Google Scholar] [CrossRef]
  23. Orlowski, J.; Gregg, G.; Lee, C. Early-season lactofen application has limited effect on soybean branch and mainstem yield components. Crop Sci. 2016, 56, 432–438. [Google Scholar] [CrossRef]
  24. Frederick, J.; Camp, C.; Bauer, P. Drought-stress effects on branch and mainstem seed yield and yield components of determinate soybean. Crop Sci. 2001, 41, 759–763. [Google Scholar] [CrossRef]
  25. Norsworthy, J.; Shipe, E. Effect of row spacing and soybean genotype on mainstem and branch yield. Agron. J. 2005, 97, 919–923. [Google Scholar] [CrossRef]
  26. Chen, L.; Yang, H.; Fang, Y.; Guo, W.; Chen, H.; Zhang, X.; Dai, W.; Chen, S.; Hao, Q.; Yuan, S.; et al. Overexpression of GmMYB14 improves high-density yield and drought tolerance of soybean through regulating plant architecture mediated by the brassinosteroid pathway. Plant Biotechnol. J. 2020, 1–15. [Google Scholar] [CrossRef]
  27. Bao, A.; Chen, H.; Chen, L.; Chen, S.; Hao, Q.; Guo, W.; Qiu, D.; Shan, Z.; Yang, Z.; Yuan, S.; et al. CRISPR/Cas9-mediated targeted mutagenesis of GmSPL9 genes alters plant architecture in soybean. BMC Plant Biol. 2019, 19, 131. [Google Scholar] [CrossRef] [Green Version]
  28. Wolters, H.; Jürgens, G. Survival of the flexible, hormonal growth control and adaptation in plant development. Nat. Rev. Genet. 2009, 10, 305–317. [Google Scholar] [CrossRef]
  29. Wang, H.G.; Zhang, Z.L.; Li, H.Y.; Zhao, X.Y.; Liu, X.M.; Ortiz, M.; Lin, C.T.; Liu, B. CONSTANS-LIKE7 regulates branching and shade avoidance response in Arabidopsis. J. Exp. Bot. 2013, 64, 1017–1024. [Google Scholar] [CrossRef] [Green Version]
  30. Yang, F.; Fan, Y.; Wu, X.; Cheng, Y.; Liu, Q.; Feng, L.; Chen, J.; Wang, Z.; Wang, X.; Yong, T.; et al. Auxin-to-Gibberellin Ratio as a Signal for Light Intensity and Quality in Regulating Soybean Growth and Matter Partitioning. Front. Plant Sci. 2018, 9, 56. [Google Scholar] [CrossRef] [Green Version]
  31. Coulter, J.; Sheaffer, C.C.; Haar, M.J.; Wyse, D.L.; Orf, J.H. Soybean cultivar response to planting date and seeding rate under organic management. Agron. J. 2011, 103, 1223–1229. [Google Scholar] [CrossRef]
  32. Place, G.T.; Reberg-Horton, S.C.; Dunphy, J.E.; Smith, A.N. Seeding rate effects on weed control and yield for organic soybean production. Weed Technol. 2009, 23, 497–502. [Google Scholar] [CrossRef]
  33. Lee, C.D.; Egli, D.B.; TeKrony, D.M. Soybean response to plant population at early and late planting dates in the Mid-South. Agron. J. 2008, 100, 971–976. [Google Scholar] [CrossRef]
  34. De Luca, M.J.; Nogueira, M.A.; Hungria, M. Feasibility of lowering soybean planting density without compromising nitrogen fixation and yield. Agron. J. 2014, 106, 2118–2124. [Google Scholar] [CrossRef] [Green Version]
  35. Wang, Q.; Xue, J.; Zhang, G.; Chen, J.; Xie, R.; Ming, B.; Hou, P.; Wang, K.; Li, S. Nitrogen split application can improve the stalk lodging resistance of maize planted at high density. Agriculture 2020, 10, 364. [Google Scholar] [CrossRef]
  36. Ittersum, M.K.; Cassman, K. Yield gap analysis—Rationale, methods and applications—Introduction to the Special Issue. Field Crop. Res. 2013, 143, 1–3. [Google Scholar] [CrossRef] [Green Version]
  37. Egli, D.B. Plant density and soybean yield. Crop Sci. 1988, 28, 977–981. [Google Scholar] [CrossRef]
  38. Holshouser, D.L.; Whittaker, J.P. Plant population and row spacing effects on early soybean production systems in the Mid-Atlantic USA. Agron. J. 2002, 94, 603–611. [Google Scholar] [CrossRef]
  39. Board, J.; Modali, H. Dry matter accumulation predictors for optimal yield in soybean. Crop Sci. 2005, 45, 1790–1799. [Google Scholar] [CrossRef]
  40. Sayama, T.; Hwang, T.Y.; Yamazaki, H.; Yamaguchi, N.; Komatsu, K.; Takahashi, M.; Suzuki, C.; Miyoshi, T.; Tanaka, Y.; Xia, Z. Mapping and comparison of quantitative trait loci for soybean branching phenotype in two locations. Breed. Sci. 2010, 60, 380–389. [Google Scholar] [CrossRef] [Green Version]
  41. Wang, C.; Wu, T.; Sun, S.; Xu, R.; Ren, J.; Wu, C.; Jiang, B.; Hou, W.; Han, T. Seventy-five years of improvement of yield and agronomic traits of soybean cultivars released in the Yellow-Huai-Hai River Valley. Crop Sci. 2016, 56, 2354–2364. [Google Scholar] [CrossRef]
  42. Cox, W.; Cherney, J. Growth and yield responses of soybean to row spacing and seeding rates. Agron. J. 2011, 103, 123–128. [Google Scholar] [CrossRef]
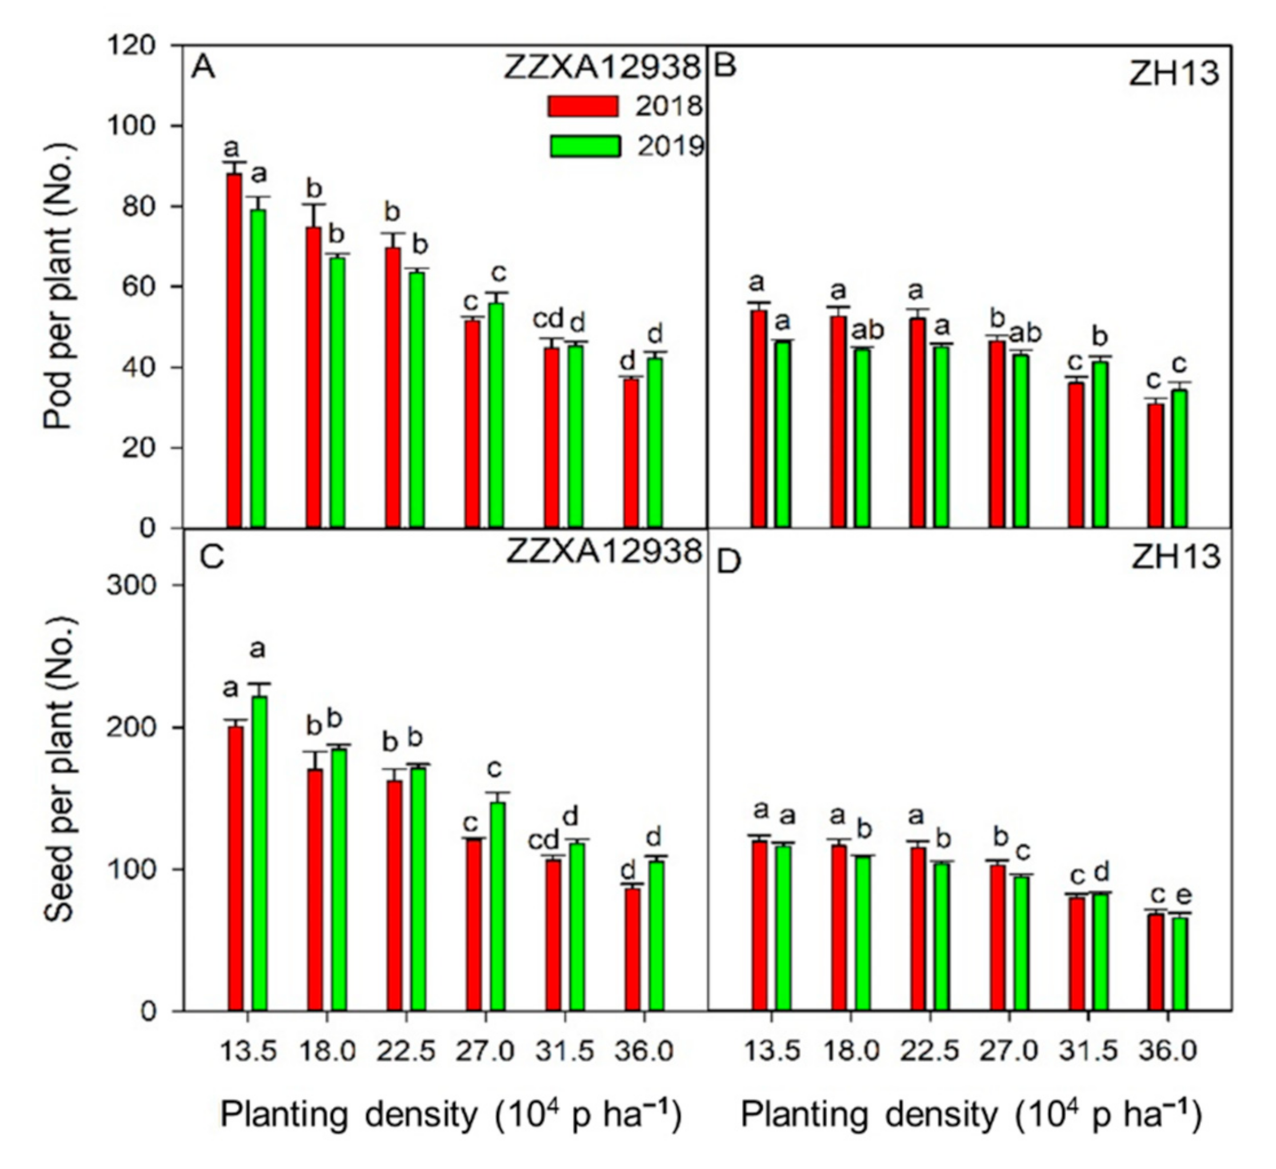
Figure 1. Pod and seed number per plant as an effect of planting density and cultivar ((A,C): ZZXA12938; (B,D): ZH13). Error bars represent the standard deviation of the mean. Different lowercase letters in the same year indicate significant differences among the treatments (p ≤ 0.05).
Agriculture 11 00069 g001
Figure 2. Pod and seed number per area as an effect of planting density and cultivar ((A,C): ZZXA12938; (B,D): ZH13). Error bars represent the standard deviation of the mean. Different lowercase letters in the same year indicate significant differences among the treatments (p ≤ 0.05).
Agriculture 11 00069 g002
Figure 3. Hundred-seed weight as an effect of planting density and cultivar ((A): ZZXA12938; (B): ZH13). Error bars represent the standard deviation of the mean. Different lowercase letters in the same year indicate significant differences among the treatments (p ≤ 0.05).
Agriculture 11 00069 g003
Figure 4. The relationship between yield and planting density for (A) ZZXA12938 and (B) ZH13. Markers with different colors represent different growing seasons; ** indicates that the correlation is significant at the p ≤ 0.01 level.
Agriculture 11 00069 g004
Figure 5. The relationship between the number of branches and soybean planting density for (A) ZZXA12938 and (B) ZH13. Markers with different colors represent different growing season; *** indicates that the correlation is significant at the p ≤ 0.001 level.
Agriculture 11 00069 g005
Figure 6. The relationship between pods and seeds per plant and branch number for (A,C) ZZXA12938 and (B,D) ZH13. Markers with different colors represent different growing season; *** indicates that the correlation is significant at the p ≤ 0.001 level.
Agriculture 11 00069 g006
Figure 7. The relationship between the number of pods and seeds per unit area and the branch number for (A,C) ZZXA12938 and (B,D) ZH13. Markers with different colors represent different growing season; *** indicates that the correlation is significant at the p ≤ 0.001 level.
Agriculture 11 00069 g007
Figure 8. The relationship between seed yield and the branch number for (A) ZZXA12938 and (B) ZH13. Markers with different colors represent different growing season; *** indicates that the correlation is significant at the p ≤ 0.001 level.
Agriculture 11 00069 g008
Figure 9. The relationship between branch yield contribution rate and branch number for (A) ZZXA12938 and (B) ZH13. Markers with different colors represent different growing season; *** indicates that the correlation is significant at the p ≤ 0.001 level.
Agriculture 11 00069 g009
Table 1. Monthly mean air temperature and rainfall during the 2018–2019 soybean growing season in Xinxiang, China.
Growing MonthAir Temperature (°C)Rainfall (mm)
2018201920182019
June22.629.175.459.9
July27.829.778.530.8
August29.527.172.7114.6
September29.023.035.373.5
October16.316.40.264.5
Table 2. Yield and yield components of soybean under different planting densities.
FactorSeed No.Pod No.Hundred-SeedYield
Plant−1Area (m−2)Plant−1Area (m−2)Weight (g)(kg ha−1)
Year2018120.4 b2759.2 b53.2 a1215.2 a19.6 b4052 a
2019123.6 a2912.3 a51.6 b1190.8 b21.6 a3924 a
CultivarZZXA12938146.7 a3397.2 a60.4 a1364.8 a16.8 b4389 a
ZH1397.3 b2274.2 b44.4 b1041.2 b24.5 a3587 b
Density13.5164.0 a2214.3 e67.6 a902.5 d19.8 d3053 e
(104 × plant ha−1)18.0144.6 b2602.1 d59.6 b1075.2 c20.2 c3546 d
22.5137.9 c3102.4 ab57.4 c1294.0 b20.4 c4012 c
27.0111.8 d3135.0 a50.1 d1329.6 a20.9 b4315 b
31.595.2 e3036.2 b42.6 e1317.2 ab21.1 ab4477 a
36.078.7 f 2924.4 c37.1 f1299.5 ab21.4 a4524 a
Cultivar (C)******************
Density (D)******************
C × D ******************
Note: values within the same column followed by different lowercase letters are significantly different among different treatments at the p ≤ 0.05 level; *** indicates significant differences at the p ≤ 0.001 level.
Publisher’s Note: MDPI stays neutral with regard to jurisdictional claims in published maps and institutional affiliations.