Differences in the Growth and Physiological Responses of the Leaves of Peucedanum japonicum and Hordeum vulgare Exposed to Salinity

 ,
, 
 ,
,
Abstract
1. Introduction
2. Materials and Methods
2.1. Plant Materials and Experimental Setup
2.2. Relative Water Content and Osmotic Potential
2.3. Sucrose Analysis
2.4. Chlorophyll and Carotenoid Analysis
2.5. Mineral Analysis
2.6. Statistical Analysis
3. Results
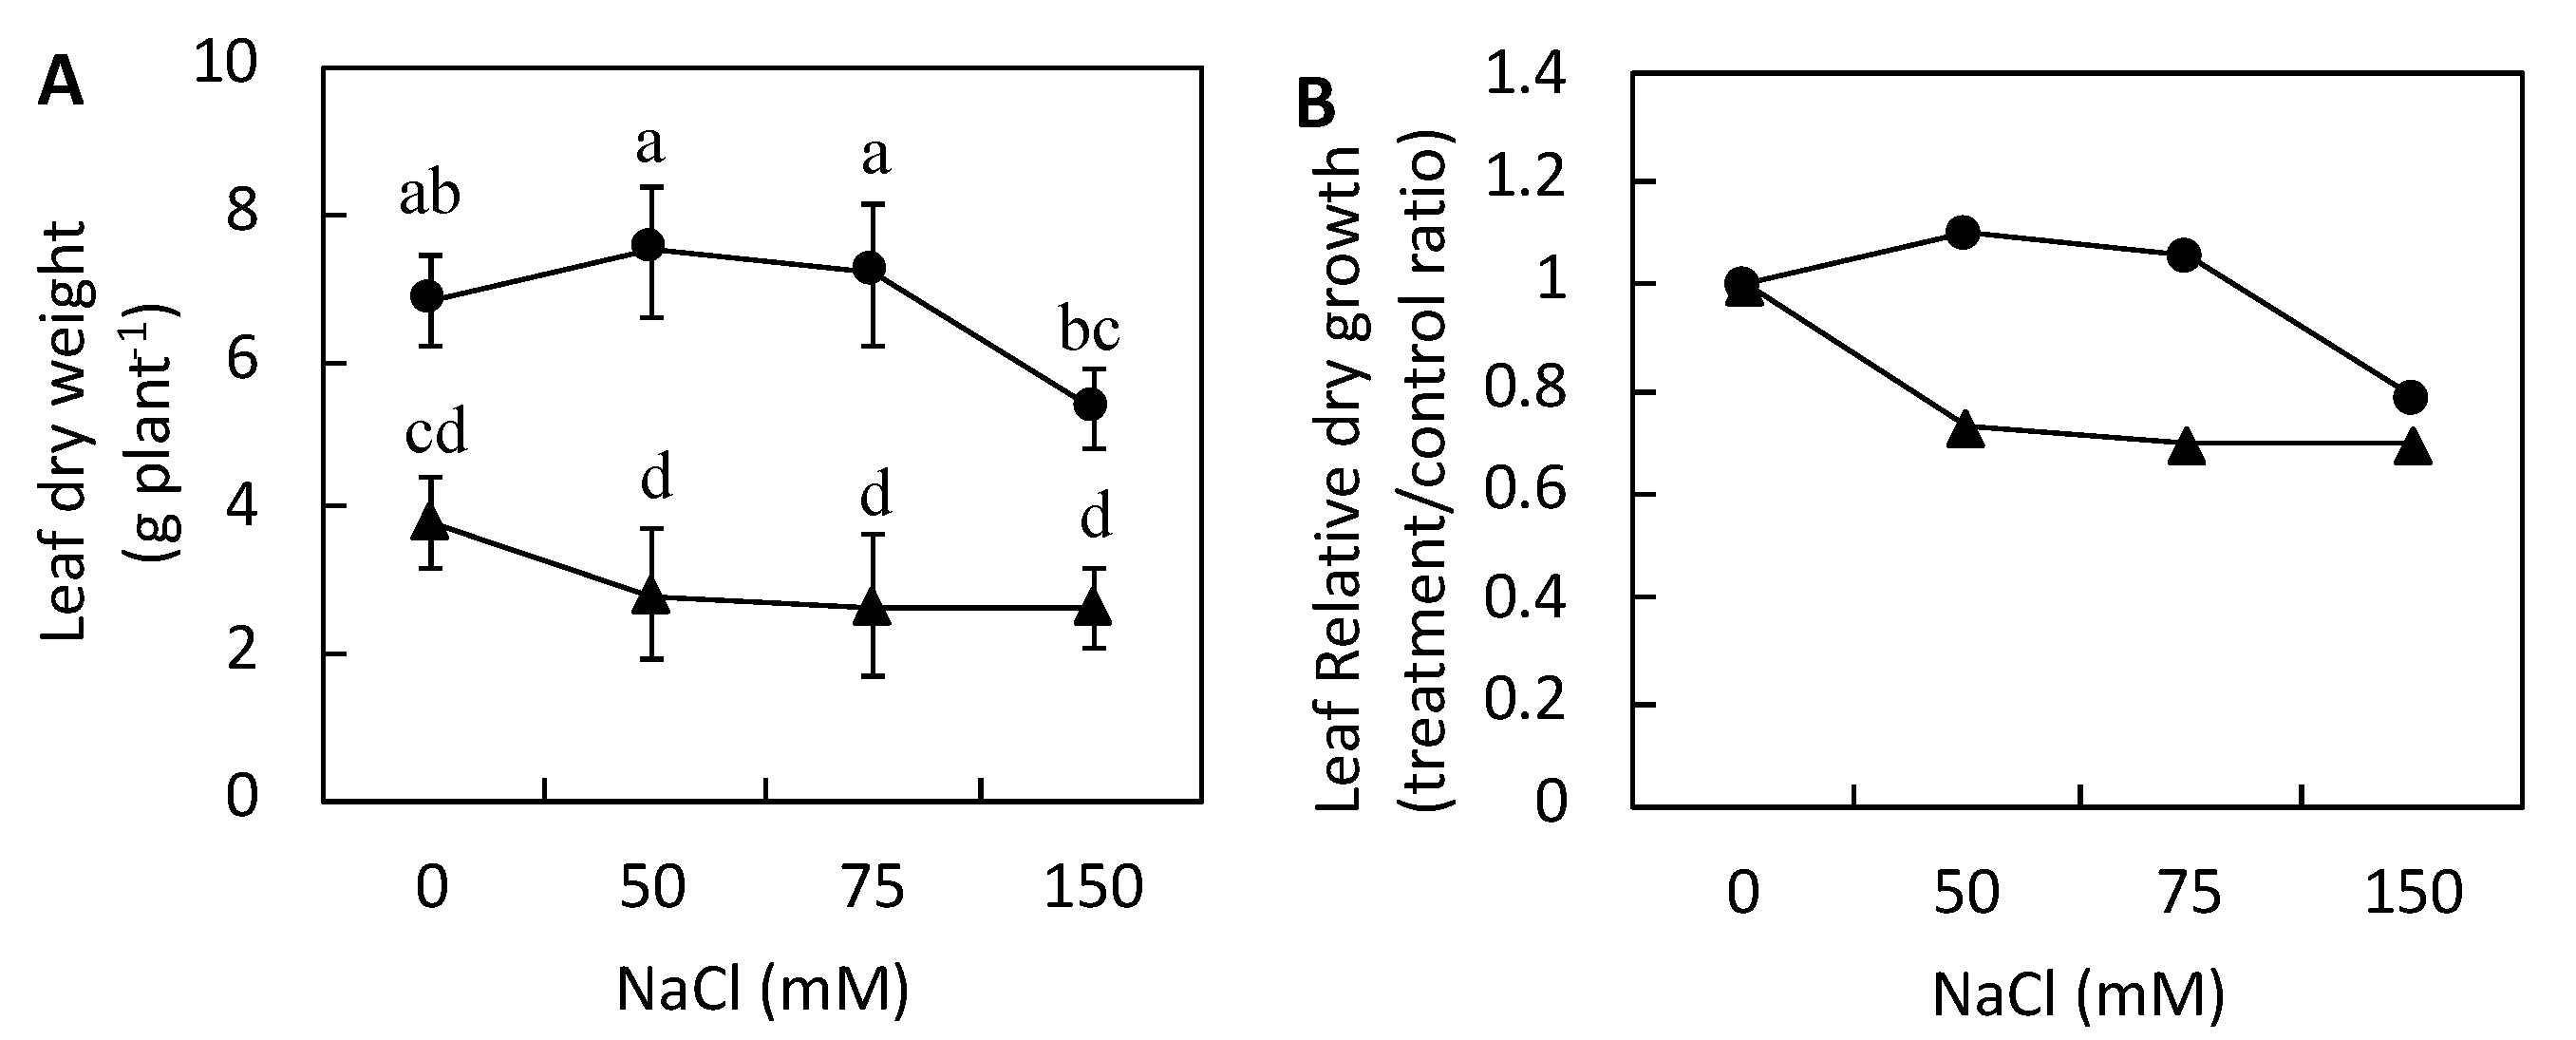
3.1. Plant Growth
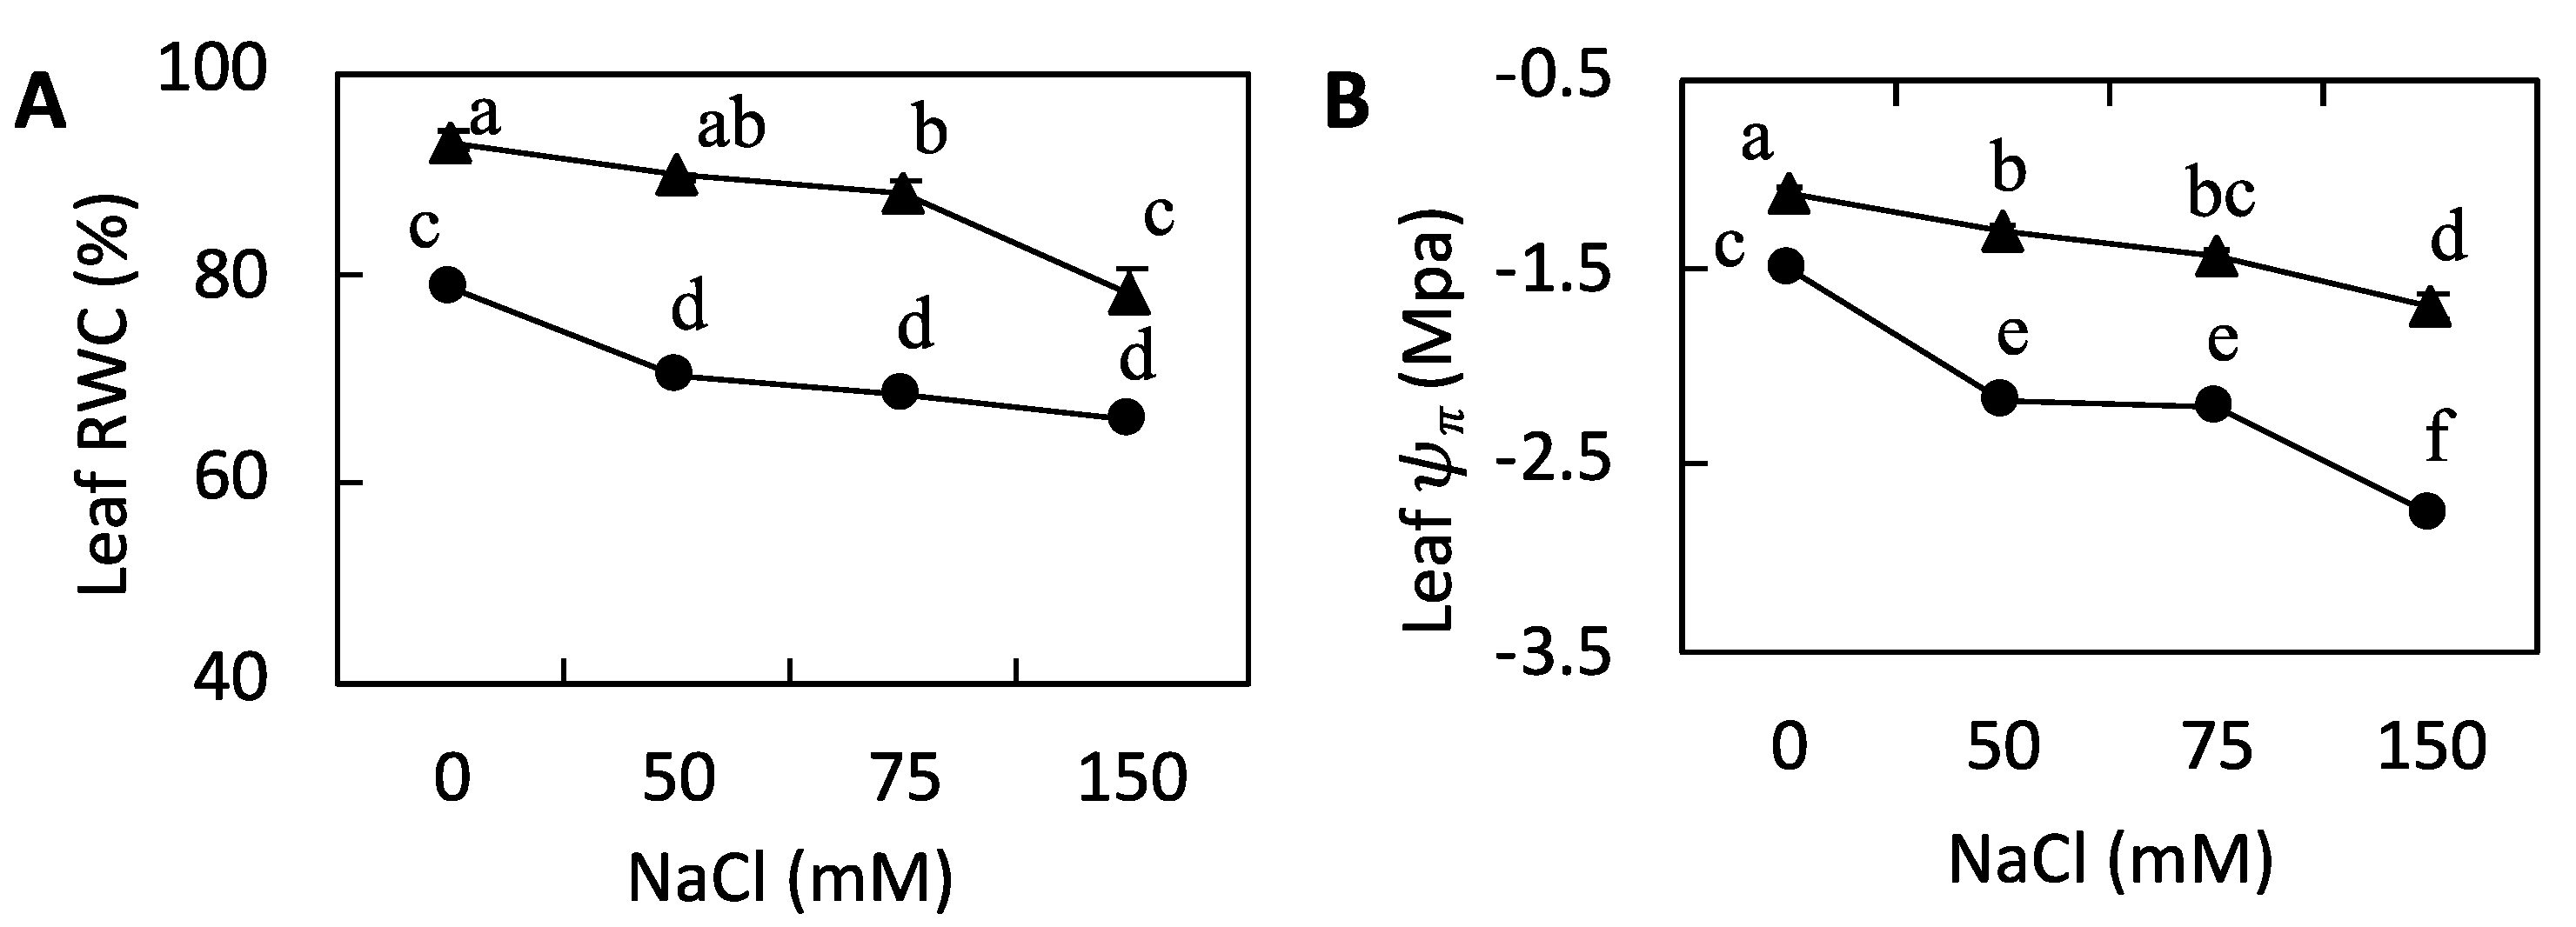
3.2. Leaf RWC and Ψπ
3.3. Leaf Chlorophyll and Carotenoid Concentrations
3.4. Cation Concentrations
3.5. Anion Concentrations
3.6. Nitrogen and Sucrose Concentrations
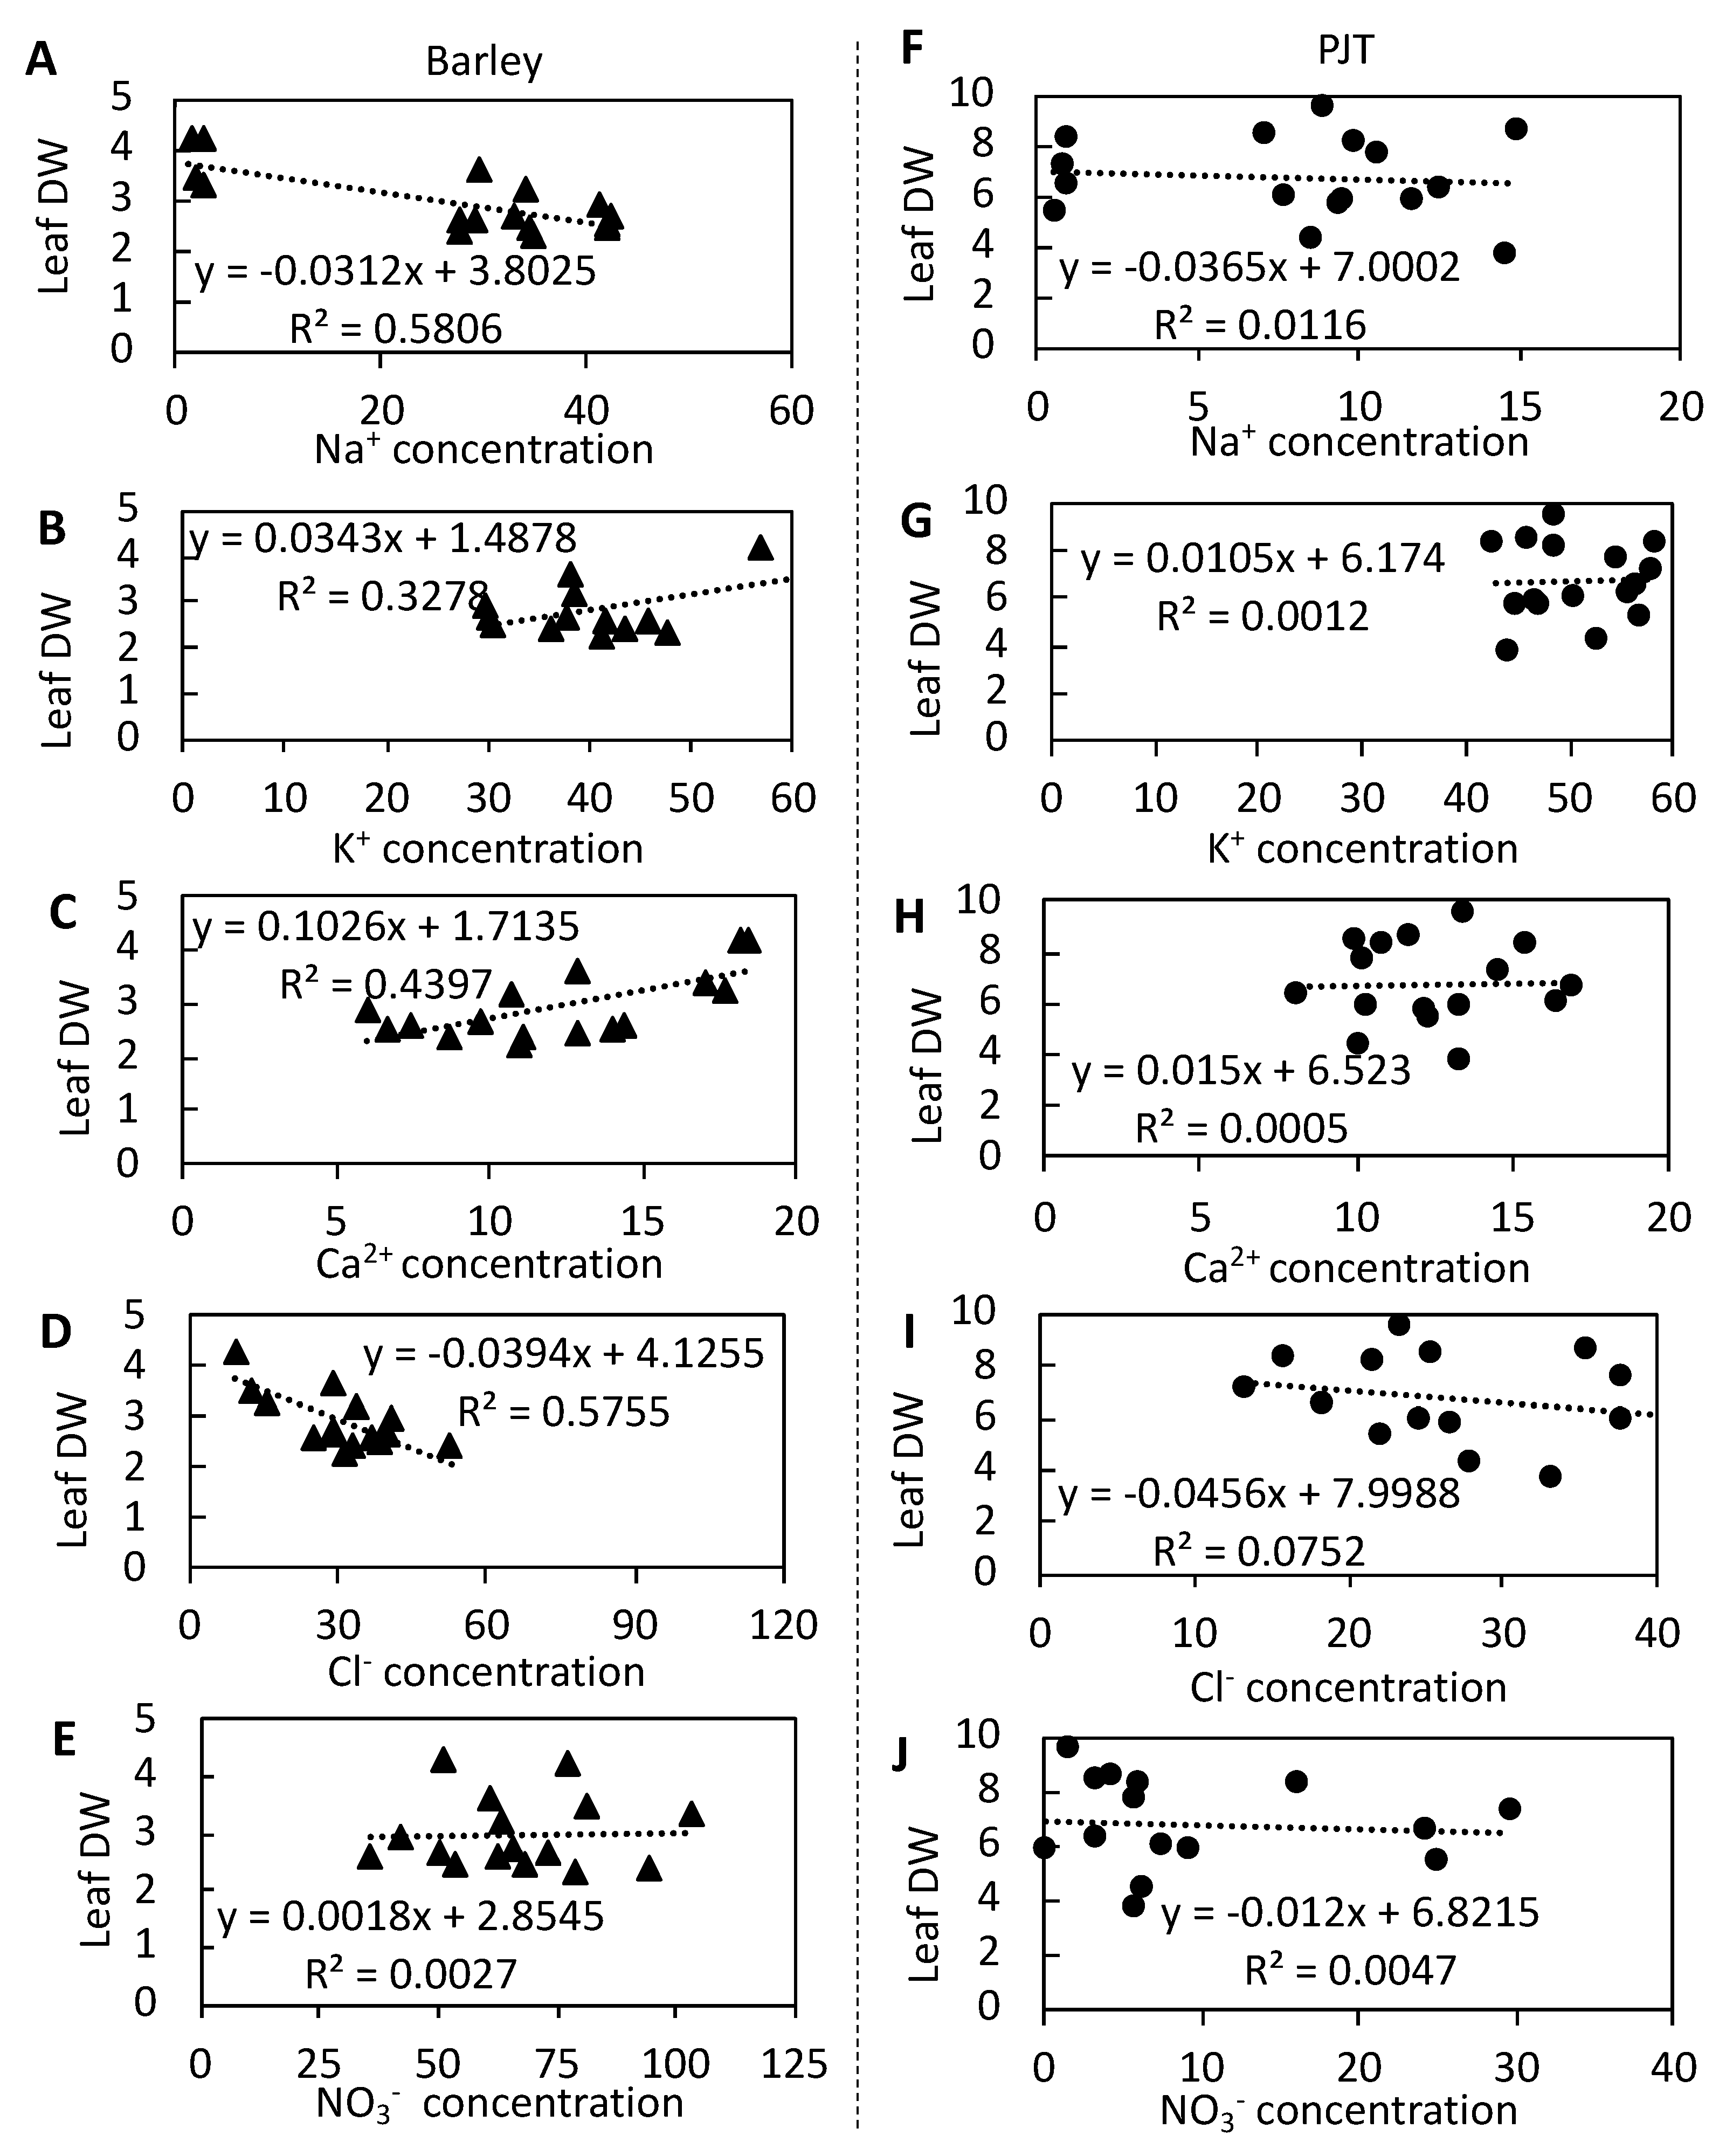
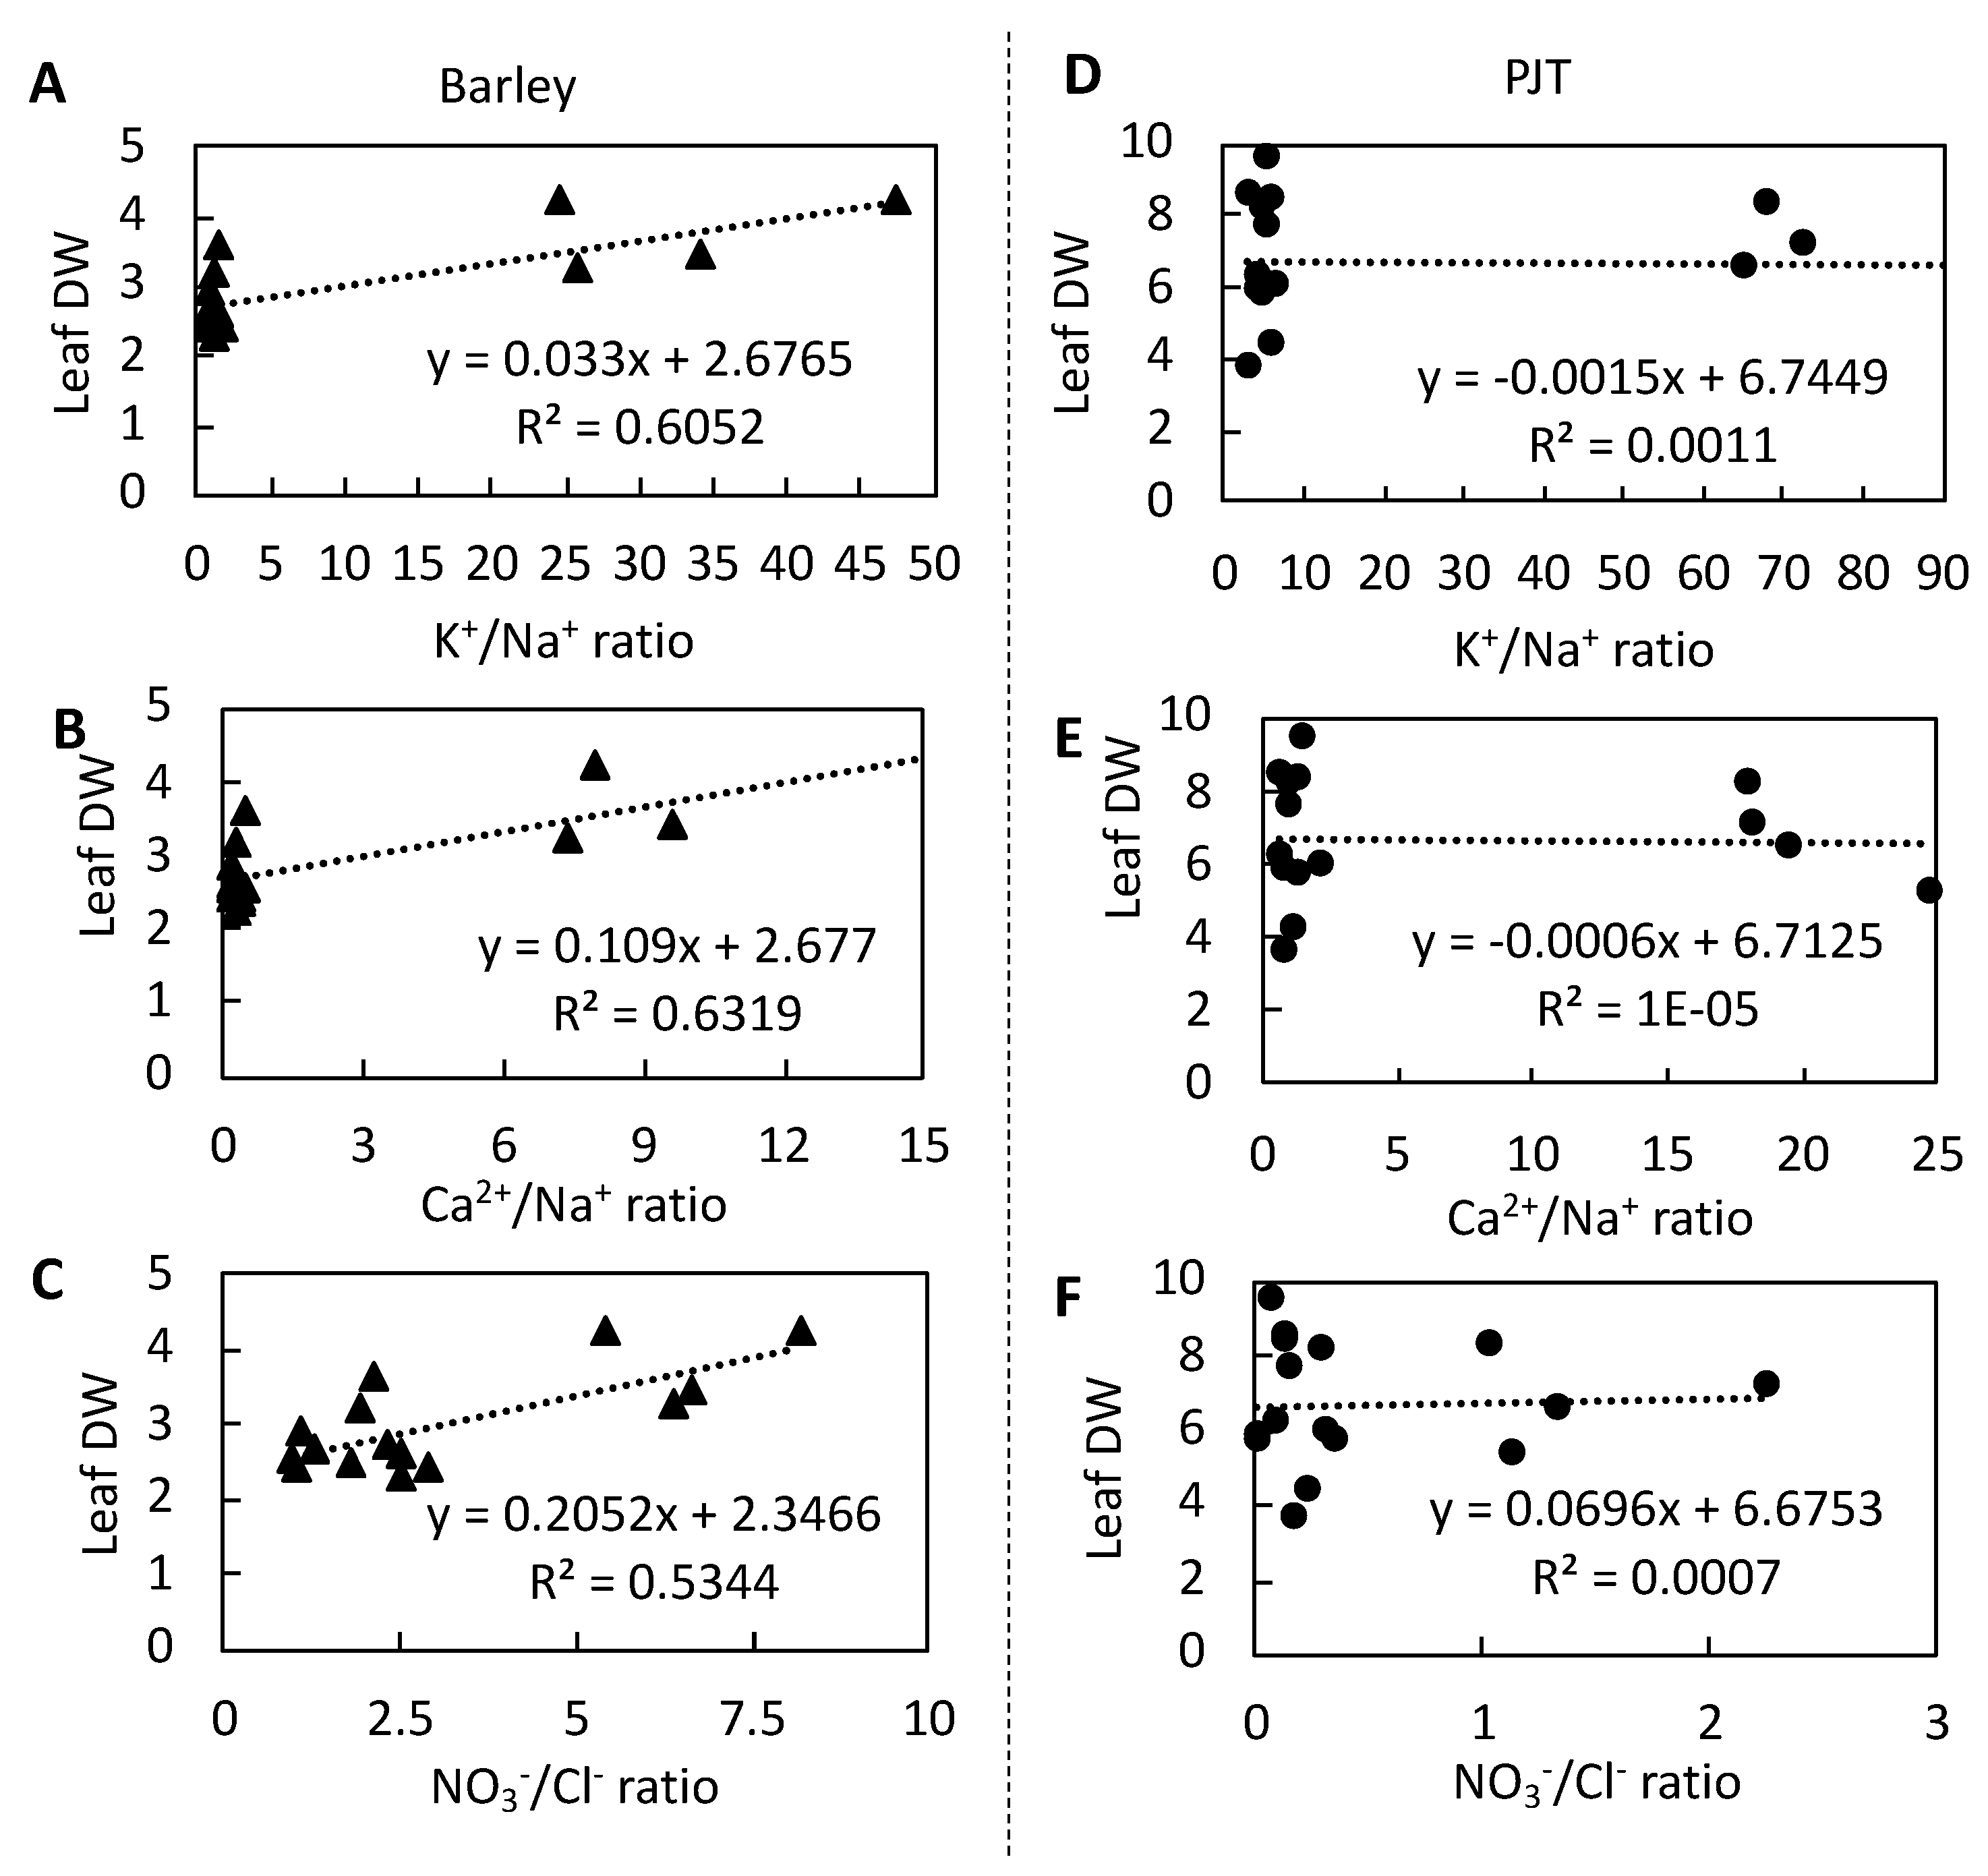
3.7. Relationships between the Ion Concentrations and Dry Weights in Barley and P. Japonicum Leaves
4. Discussion
4.1. Leaf Growth and Leaf Water Uptake
4.2. P. Japonicum Maintains Lower Na+ and Cl− Concentrations in Leaves at High NaCl Concentrations
4.3. P. Japonicum Maintains a Higher Ionic Balance in Leaves than Barley
4.4. Sucrose and Total Nitrogen Concentrations in Leaves
5. Conclusions
Author Contributions
Funding
Conflicts of Interest
References
- Deinlein, U.; Stephan, A.B.; Horie, T.; Luo, W.; Xu, G.; Schroederet, J.I. Plant salt-tolerance mechanisms. Trends Plant Sci. 2014, 19, 371–379. [Google Scholar] [CrossRef] [PubMed]
- Munns, R.; Tester, M. Mechanisms of Salinity Tolerance. Annu. Rev. Plant Biol. 2008, 59, 651–681. [Google Scholar] [CrossRef] [PubMed]
- Flowers, T.J.; Colmer, T.D. Plant salt tolerance: Adaptation in halophytes. Ann. Bot. 2015, 115, 327–331. [Google Scholar] [CrossRef] [PubMed]
- Tavakkoli, E.; Fatehi, F.; Coventry, S.; Rengasamy, P.; McDonald, G.K. Additive effects of Na+ and Cl− ions on barley growth under salinity stress. J. Exp. Bot. 2011, 62, 2189–2203. [Google Scholar] [CrossRef] [PubMed]
- Shoresh, M.; Spivak, M.; Bernstein, N. Involvement of calcium-mediated effects on ROS metabolism in the regulation of growth improvement under salinity. Free Radical. Biol. Med. 2011, 51, 1221–1234. [Google Scholar] [CrossRef]
- Uzilday, B.; Ozgur, R.; Sekmen, A.H.; Yildiztugay, E.; Turkan, I. Changes in the alternative electron sinks and antioxidant defense in chloroplasts of the extreme halophyte Eutrema parvulum (Thellungiella parvula) under salinity. Ann. Bot. 2015, 115, 449–463. [Google Scholar] [CrossRef]
- Flowers, T.J.; Munns, R.; Colmer, T.D. Sodium chloride toxicity and the cellular basis of salt tolerance in halophytes. Ann. Bot. 2015, 115, 419–431. [Google Scholar] [CrossRef]
- Teakle, N.L.; Tyerman, S.D. Mechanisms of Cl− transport contributing to salt tolerance. Plant Cell Environ. 2010, 33, 566–589. [Google Scholar] [CrossRef]
- Flowers, T.J.; Colmer, T.D. Salinity tolerance in halophytes. New Phytol. 2008, 179, 945–963. [Google Scholar] [CrossRef]
- Chen, C.C.; Agrawal, D.C.; Lee, M.R.; Lee, R.J.; Kuo, C.L.; Wu, C.R.; Tsay, H.S.; Chang, H.C. Influence of LED light spectra on in vitro somatic embryogenesis and LC-MS analysis of chlorogenic acid and rutin in Peucedanum japonicum Thunb.: A medicinal herb. Bot. Stud. 2016, 57, 9. [Google Scholar] [CrossRef]
- Taira, N.; Nugara, R.N.; Inafuku, M.; Takara, K.; Ogi, T.; Ichiba, T.; Iwasaki, H.; Okabe, T.; Oku, H. In vivo and in vitro anti-obesity activities of dihydropyranocoumarins derivatives from Peucedanum japonicum Thunb. J. Funct. Foods 2017, 29, 19–28. [Google Scholar] [CrossRef]
- Kim, J.M.; Erkhembaatar, M.; Lee, G.S.; Lee, J.H.; Noh, E.M.; Lee, M.; Song, H.K.; Lee, C.H.; Kwon, K.B.; Kim, M.S. Peucedanum japonicum thunb. ethanol extract suppresses RANKL-mediated osteoclastogenesis. Exp. Ther. Med. 2017, 14, 410–416. [Google Scholar] [CrossRef] [PubMed]
- Chun, J.M.; Lee, A.R.; Kim, H.S.; Lee, A.Y.; Gu, G.J.; Moon, B.C.; Kwon, B.I. Peucedanum japonicum extract attenuates allergic airway inflammation by inhibiting Th2 cell activation and production of pro-inflammatory mediators. J. Ethnopharmacol. 2018, 211, 78–88. [Google Scholar] [CrossRef] [PubMed]
- Blicharz-Kania, A.; Andrejko, D.; Kluza, F.; Rydzak, L.; Kobus, Z. Assessment of the potential use of young barley shoots and leaves for the production of green juices. Sustainability 2019, 11, 3960. [Google Scholar] [CrossRef]
- Liu, L.; Ueda, A.; Saneoka, H. Physiological responses of white Swiss chard (Beta vulgaris L. subsp. cicla) to saline and alkaline stresses. Aust. J. Crop Sci. 2013, 7, 1046–1052. [Google Scholar]
- Turner, N.C. Technique and experimental approaches for the measurement of plant water status. Plant Soil 1981, 58, 339–366. [Google Scholar] [CrossRef]
- Arnon, D.I. Copper enzymes in isolated chloroplasts. Polyphenoloxidase in Beta vulgaris. Plant Physiol. 1949, 24, 1–15. [Google Scholar] [CrossRef]
- Parihar, P.; Singh, S.; Singh, R.; Singh, V.P.; Prasad, S.M. Effect of salinity stress on plants and its tolerance strategies: A review. Environ. Sci. Pollut. Res. 2015, 22, 4056–4075. [Google Scholar] [CrossRef]
- Yamada, M.; Kuroda, C.; Fujiyama, H. Function of sodium and potassium in growth of sodium-loving Amaranthaceae species. Soil Sci. Plant Nutr. 2016, 62, 20–26. [Google Scholar] [CrossRef]
- Wu, H.; Shabala, L.; Barry, K.; Zhou, M.; Shabala, S. Ability of leaf mesophyll to retain potassium correlated with salinity tolerance in wheat and barley. Physiol. Plant. 2013, 149, 515–527. [Google Scholar] [CrossRef]
- Ding, X.; Tian, C.; Zhang, S.; Song, J.; Zhang, F.; Mi, G.; Feng, G. Effects of NO3−-N on the growth and salinity tolerance of Tamarix laxa Willd. Plant Soil 2010, 331, 57–67. [Google Scholar] [CrossRef]
- Ashraf, M. Biotechnological approach of improving plant salt tolerance using antioxidants as marker. Biotechnol. Adv. 2009, 27, 84–93. [Google Scholar] [CrossRef] [PubMed]
- Gill, S.S.; Tuteja, N. Reactive oxygen species and antioxidant machinery in abiotic stress tolerance in crop plants. Plant Physiol. Biochem. 2010, 48, 909–930. [Google Scholar] [CrossRef]
- Hmelak Gorenjak, A.; Cencič, A. Nitrate in vegetables and their impact on human health, a review. Acta Aliment. 2013, 42, 158–172. [Google Scholar] [CrossRef]


| Parameters | Species | NaCl (mM) | |||
|---|---|---|---|---|---|
| 0 | 50 | 75 | 150 | ||
| Carotenoid | Barley | 0.27 ± 0.01 a | 0.27 ± 0.01 a | 0.28 ± 0.00 a | 0.26 ± 0.01 a |
| PJT | 0.27 ± 0.01 a | 0.26 ± 0.01 a | 0.27 ± 0.01 a | 0.28 ± 0.00 a | |
| Chlorophyll a | Barley | 1.09 ± 0.06 a | 1.10 ± 0.02 a | 1.13 ± 0.05 a | 1.03 ± 0.06 a |
| PJT | 1.06 ± 0.08 a | 1.06 ± 0.10 a | 1.00 ± 0.05 a | 1.04 ± 0.04 a | |
| Chlorophyll b | Barley | 0.32 ± 0.02 a | 0.31 ± 0.01 a | 0.33 ± 0.02 a | 0.30 ± 0.01 a |
| PJT | 0.28 ± 0.02 a | 0.29 ± 0.03 a | 0.28 ± 0.02 a | 0.27 ± 0.02 a | |
| Total chlorophyll | Barley | 1.40 ± 0.08 a | 1.41 ± 0.03 a | 1.46 ± 0.07 a | 1.33 ± 0.08 a |
| PJT | 1.37 ± 0.08 a | 1.35 ± 0.13 a | 1.27 ± 0.07 a | 1.32 ± 0.06 a |
| Parameters | Species | NaCl (mM) | |||
|---|---|---|---|---|---|
| 0 | 50 | 75 | 150 | ||
| Na+ (mg g−1 DW) | Barley | 1.9 ± 0.3 e | 28.3 ± 0.5 c | 34.0 ± 0.5 b | 41.8 ± 0.3 a |
| PJT | 0.8 ± 0.0 e | 9.4 ± 1.1 d | 10.9 ± 1.4 d | 10.8 ± 1.5 d | |
| K+ (mg g−1 DW) | Barley | 58.8 ± 1.3 a | 43.2 ± 2.1 d | 40.1 ± 1.3 d | 31.6 ± 1.5 e |
| PJT | 57.4 ± 0.4 a | 48.1 ± 2.8 bc | 50.5 ± 1.9 b | 47.1 ± 1.3 bc | |
| Ca2+ (mg g−1 DW) | Barley | 17.8 ± 0.3 a | 13.1 ± 0.7 bc | 11.1 ± 0.7 c | 7.2 ± 0.6 d |
| PJT | 14.8 ± 0.9 b | 10.9 ± 1.2 c | 10.7 ± 0.4 c | 13.3 ± 1.1 bc | |
| Mg2+ (mg g−1 DW) | Barley | 4.5 ± 0.4 a | 2.8 ± 0.1 b | 2.4 ± 0.1 bc | 1.9 ± 0.1 cd |
| PJT | 1.7 ± 0.1 c | 1.5 ± 0.2 cd | 1.0 ± 0.1 d | 1.5 ± 0.2 cd | |
| K+/Na+ | Barley | 32.8 ± 5.2 b | 1.5 ± 0.0 d | 1.2 ± 0.0 d | 0.8 ± 0.0 d |
| PJT | 80.3 ± 11.7 a | 5.2 ± 0.4 c | 4.9 ± 0.6 c | 4.6 ± 0.8 c | |
| Ca2+/Na+ | Barley | 10.0 ± 1.8 b | 0.5 ± 0.0 d | 0.3 ± 0.0 d | 0.2 ± 0.0 d |
| PJT | 20.1 ± 1.6 a | 1.2 ± 0.2 c | 1.0 ± 0.1 c | 1.3 ± 0.3 c |
| Parameters | Species | NaCl (mM) | |||
|---|---|---|---|---|---|
| 0 | 50 | 75 | 150 | ||
| Cl− (mg g−1 DW) | Barley | 11.4 ± 0.9 c | 29.1 ± 2.3 b | 33.1 ± 1.9 ab | 42.7 ± 4.1 a |
| PJT | 17.4 ± 0.2 c | 29.0 ± 0.4 b | 30.6 ± 0.4 b | 36.1 ± 0.5 ab | |
| NO3− (mg g−1 DW) | Barley | 78.2 ± 7.9 a | 72.6 ± 10.8 ab | 68.8 ± 3.8 ab | 45.7 ± 3.4 b |
| PJT | 23.8 ± 2.8 ac | 4.5 ± 1.7 d | 5.7 ± 0.5 d | 3.5 ± 1.9 d | |
| SO42− (mg g−1 DW) | Barley | 3.3 ± 0.3 a | 3.2 ± 0.5 a | 2.9 ± 0.1 a | 3.6 ± 0.1 a |
| PJT | 15.7 ± 2.3 a | 10.2 ± 2.0 b | 11.5 ± 1.1 ab | 13.8 ± 3.2 ab | |
| NO3−/Cl− | Barley | 6.6 ± 1.0 a | 2.5 ± 0.2 b | 2.1 ± 0.2 bc | 1.1 ± 0.1 d |
| PJT | 1.4 ± 0.3 cd | 0.2 ± 0.0 e | 0.2 ± 0.0 e | 0.1 ± 0.0 e |
| Parameters | Species | NaCl (mM) | |||
|---|---|---|---|---|---|
| 0 | 50 | 75 | 150 | ||
| N (mg g−1 DW) | Barley | 52.2 ± 0.9 a | 51.3 ± 0.9 a | 50.3 ± 0.4 a | 49.2 ± 0.9 a |
| PJT | 38.4 ± 1.0 b | 34.6 ± 1.9 c | 36.1 ± 1.2 bc | 34.2 ± 0.9 c | |
| Sucrose (mg g−1 DW) | Barley | 95.7 ± 17.8 b | 94.2 ± 13.8 b | 102.1 ± 8.3 b | 157.4 ± 18.5 ab |
| PJT | 166.8 ± 17.5 a | 147.6 ± 15.9 ab | 172.1 ± 28.1 a | 173.0 ± 11.8 a |
© 2020 by the authors. Licensee MDPI, Basel, Switzerland. This article is an open access article distributed under the terms and conditions of the Creative Commons Attribution (CC BY) license (http://creativecommons.org/licenses/by/4.0/).
Share and Cite
Liu, L.; Nakamura, Y.; Taliman, N.A.; Sabagh, A.E.; Moghaieb, R.E.; Saneoka, H. Differences in the Growth and Physiological Responses of the Leaves of Peucedanum japonicum and Hordeum vulgare Exposed to Salinity. Agriculture 2020, 10, 317. https://doi.org/10.3390/agriculture10080317
Liu L, Nakamura Y, Taliman NA, Sabagh AE, Moghaieb RE, Saneoka H. Differences in the Growth and Physiological Responses of the Leaves of Peucedanum japonicum and Hordeum vulgare Exposed to Salinity. Agriculture. 2020; 10(8):317. https://doi.org/10.3390/agriculture10080317
Chicago/Turabian StyleLiu, Liyun, Yuki Nakamura, Nisar Ahmad Taliman, Ayman EL Sabagh, Reda EA Moghaieb, and Hirofumi Saneoka. 2020. "Differences in the Growth and Physiological Responses of the Leaves of Peucedanum japonicum and Hordeum vulgare Exposed to Salinity" Agriculture 10, no. 8: 317. https://doi.org/10.3390/agriculture10080317
APA StyleLiu, L., Nakamura, Y., Taliman, N. A., Sabagh, A. E., Moghaieb, R. E., & Saneoka, H. (2020). Differences in the Growth and Physiological Responses of the Leaves of Peucedanum japonicum and Hordeum vulgare Exposed to Salinity. Agriculture, 10(8), 317. https://doi.org/10.3390/agriculture10080317