Article

Application of Artificial Neural Networks to Analyze the Concentration of Ferulic Acid, Deoxynivalenol, and Nivalenol in Winter Wheat Grain

by
Gniewko Niedbała
1,*,
Danuta Kurasiak-Popowska
2,
Kinga Stuper-Szablewska
3 and
Jerzy Nawracała
2
1
Institute of Biosystems Engineering, Faculty of Agronomy and Bioengineering, Poznań University of Life Sciences, Wojska Polskiego 50, 60-627 Poznań, Poland
2
Department of Genetics and Plant Breeding, Faculty of Agronomy and Bioengineering, Poznan University of Life Sciences, Dojazd 11, 60-632 Poznań, Poland
3
Department of Chemistry, Faculty of Wood Technology, Poznan University of Life Sciences, Wojska Polskiego 75, 60-625 Poznań, Poland
*
Author to whom correspondence should be addressed.
Agriculture 2020, 10(4), 127; https://doi.org/10.3390/agriculture10040127
Submission received: 24 February 2020 / Revised: 5 April 2020 / Accepted: 11 April 2020 / Published: 14 April 2020
(This article belongs to the Special Issue Artificial Neural Networks in Agriculture)

Abstract

:
Biotic stress, which includes infection by pathogenic fungi, causes losses of wheat yield in terms of quantity and quality. Ear Fusarium is caused by strains of F. graminearum and F. culmorum, which can produce mycotoxins—deoxynivalenol (DON) and nivalenol (NIV). One of the wheat’s defense mechanisms against stressors is the activation of biosynthesis pathways of antioxidant compounds, including ferulic acid. The aim of the study was to conduct pilot studies on the basis of which neural models were created that would examine the impact of the variety and weather conditions on the concentration of ferulic acid, and link its content with the concentration of deoxynivalenol and nivalenol. The plant material was 23 winter wheat genotypes with different Fusarium resistance. The field experiment was conducted in 2011–2013 in Poland in three experimental combinations, namely: with full chemical protection; without chemical protection, but infested with natural disease (control); and in the absence of fungicidal protection, with artificial inoculation by genus Fusarium fungi. As a result of the pilot studies, three neural models—FERUANN analytical models (ferulic acid content), DONANN (deoxynivalenol content) and NIVANN (nivalenol content)—were produced. Each model was based on 14 independent features, 12 of which were in the form of quantitative data, and the other two were presented as qualitative data. The structure of the created models was based on an artificial neural network (ANN) of the multilayer perceptron (MLP) with two hidden layers. The sensitivity analysis of the neural network showed the two most important features determining the concentration of ferulic acid, deoxynivalenol, and nivalenol in winter wheat seeds. These are the experiment variant (VAR) and winter wheat variety (VOW).

1. Introduction

During the growing season, wheat is exposed to numerous biotic and abiotic stresses. The factors causing abiotic stress are intense solar radiation, low or high temperature, excess or shortage of water, strong winds, etc. Biotic stress includes pests or diseases [1,2]. The plant’s response to stress depends on many factors, including the applied variety, age, and developmental stage of plant. Numerous developmental, morphological, and physiological adaptations enable the passive avoidance of stress. The active interaction of the plant and stressor cause defense responses that prevent or tolerate changes.
One of the most important biogenic stressors is the infestation of crops by pathogenic fungi. This results in crop losses, the level of which depends on the variety, meteorological conditions, and cultivation technology. Potential losses can be minimized using appropriate agrotechnical measures and fungicide protection [3]. The most effective method for limiting the effects of disease infestation is the use of varieties containing resistance genes for individual diseases. In such cases, during plant cultivation, the accumulation of various combinations of many genes are applied [4].
A completely different strategy should be adopted in the case of Fusarium, because of the specificity of both the pathogen and the mechanism of pathogenesis. Resistance to Fusarium is a quantitative trait, associated with the presence of many quantitative trait loci (QTL) [5,6,7,8,9]. Almost every wheat chromosome has been identified with this type of QTL [10]. One of the most effective R genes that fight Fusarium is Fhb1 from the Sumai 3 wheat variety. Unfortunately, this variety has many unfavorable agronomic traits strongly linked to the Fhb1 gene. Growers are therefore looking for other sources to fight this disease.
Pathogenic fungi cause not only quantitative, but also qualitative losses in the wheat yield as well as a reduction in grain quality parameters (thousand grain weight, falling number, sedimentation number, and total protein content) [11,12,13,14,15,16]. Quality losses are not only the result of the development of pathogen mycelium, but also the effect of secondary metabolite production by fungi called mycotoxins. Fusarium fungi, mainly F. culmorum and F. graminearum, produce deoxynivalenol (DON) and zearalenone, which are highly toxic to humans and animals [17]. In 2005, the European Union introduced a standard where the maximum allowable DON concentration was set at 1250 μg/kg of unprocessed wheat grain (1.25 ppm (parts per million)).
In addition to genetic studies on wheat resistance to Fusarium, research has also been conducted on the biochemical aspects of plant responses to a massive pathogen attack. Based on the literature sources [18,19] and our own [20,21] research, it was found that antioxidative processes based on the significantly increased biosynthesis of the low-molecular antioxidants of the plant have a significant impact on pathogenesis, and constitute the first line of defense against pathogens. Based on the concentration of the selected phenolic acids, including ferulic acid, it is possible to assess the degree of disease risk at an early stage of pathogenesis [20,22]. Taking into account all of the current information on the mechanism of wheat resistance to Fusarium [20,23,24], as well as the results of chemical analyzes from three years of field experiments on wheat, it was decided to use modern methods of data analysis to determine the relationship between the concentration of ferulic acid; the concentration of deoxynivalenol and nivalenol (NIV), depending on weather conditions; and the infestation degree by fungal diseases.
Recently, increasing interest in microbiological forecasting is being observed, which has been mainly used for the examination of bacterial pathogens in the context of food. Modern computer technologies are used in other interdisciplinary research areas. Many new methods, such as artificial neural network (ANN), fuzzy logic, and genetic algorithms, which are part of artificial intelligence methods, are being used for multidimensional data analysis. Recent years show that there has been a significant increase in the use of nonlinear data modeling methods in agriculture. Particularly important analysis results are observed when using artificial neural networks, the results of which are often compared with classical statistical methods, e.g., multiple regression. As a result of the possibility of learning and generalizing data, the use of ANN gives better results than statistical methods. Neural modeling methods are used in classification, identification, and prediction, therefore, their potential is significant for practical application in broadly understood agriculture [25,26,27,28,29,30,31,32,33,34,35,36,37,38,39].
One of the most interesting uses of ANN is crop yield prediction. Forecasting of winter rapeseed and winter wheat yield has been applied in many works [40,41,42,43,44,45]. Because of the fact that plant yield is affected by many factors, such as meteorological conditions, fertilization level, and soil cultivation method, the use of modern data analysis techniques brings even more accurate results. In addition, because of the unique properties of data processing, ANN can simultaneously analyze empirical data in a quantitative and qualitative form. Such data are not possible to achieve using classical statistical methods, as they are usually limited only to the quantitative interpretation of the analyzed data. Therefore, the purpose of the work is to conduct pilot studies on the basis of which neural models will be produced that examine the impact of the variety and weather conditions on the concentration of ferulic acid, and to link its content with the concentration of deoxynivalenol and nivalenol.

2. Materials and Methods
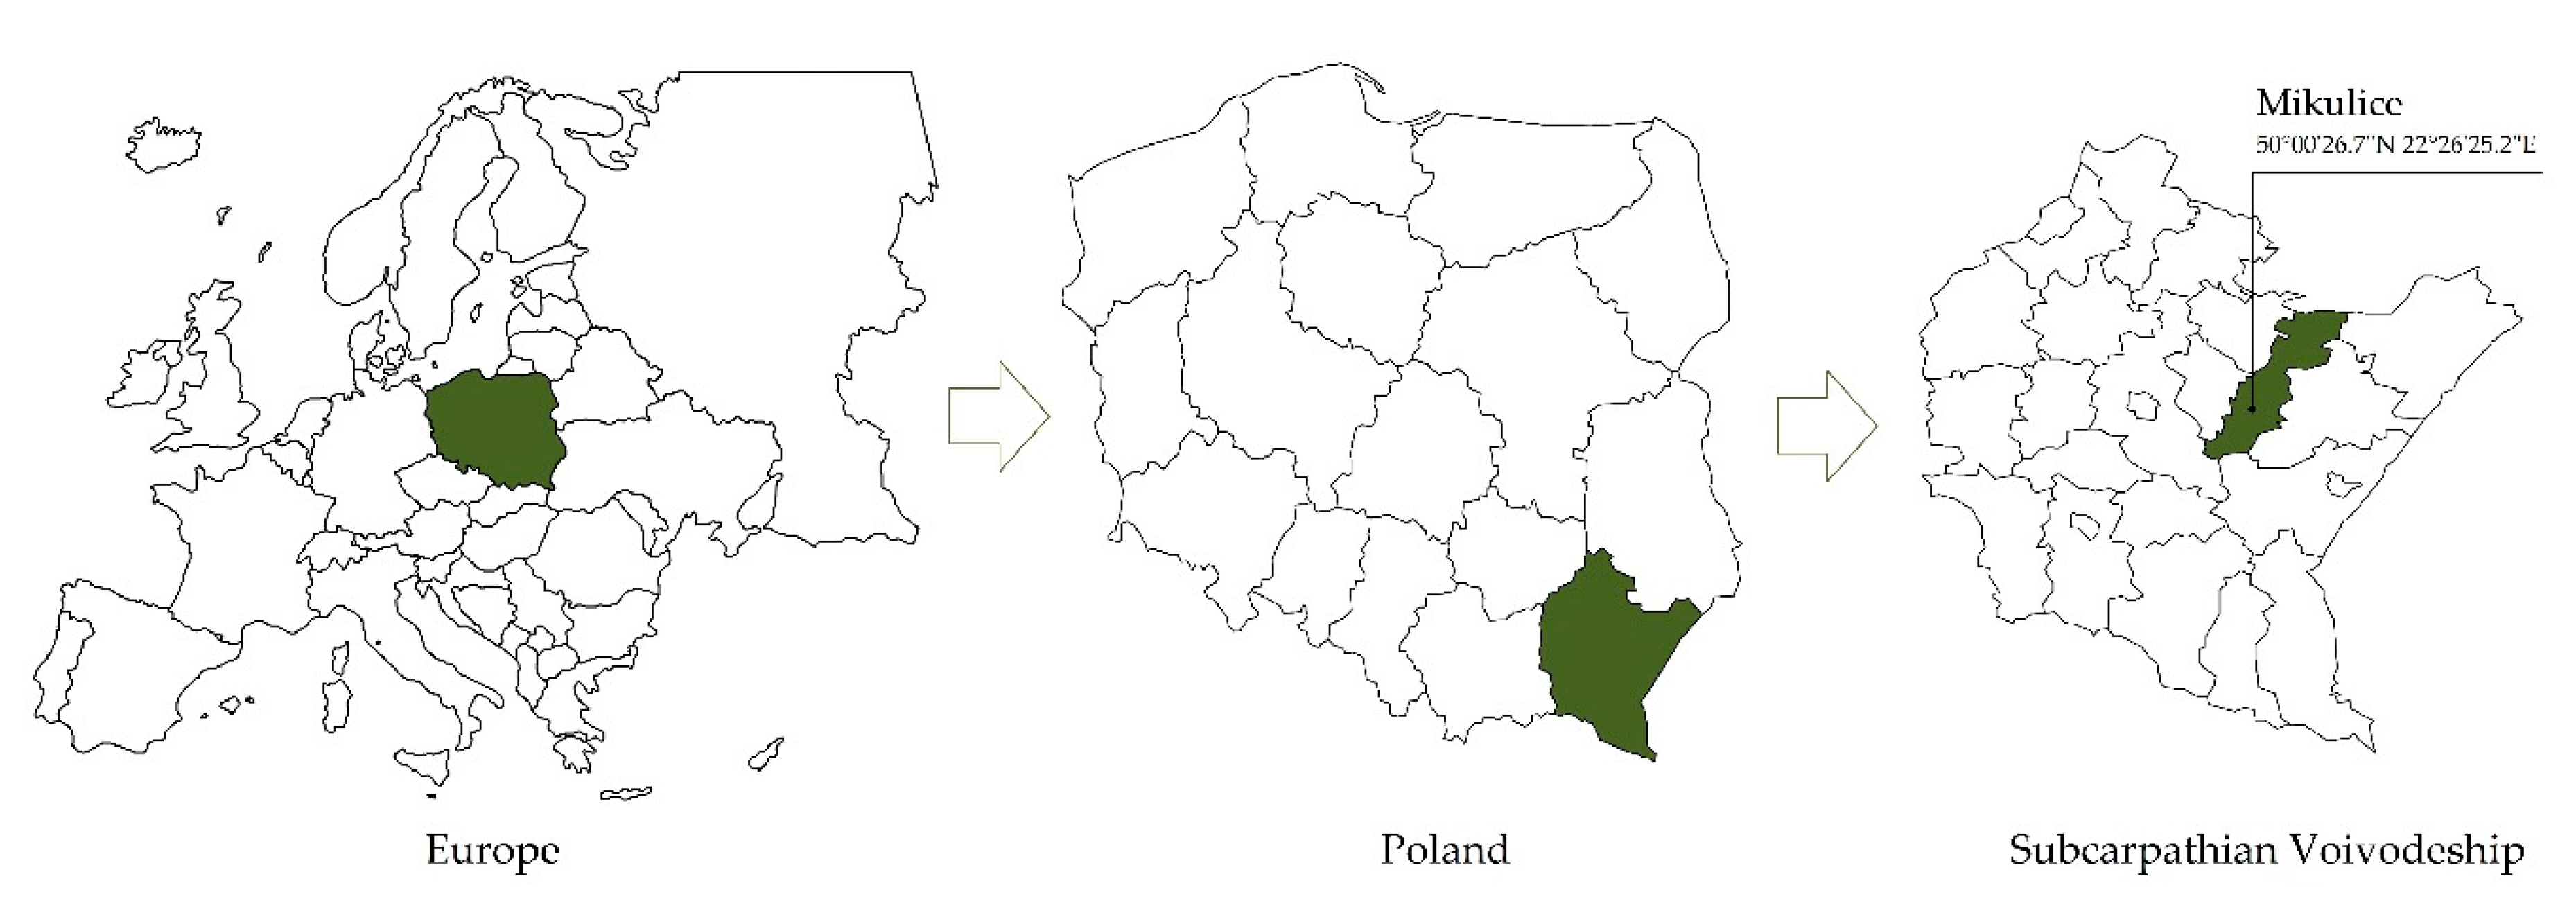
2.1. Site Location

The field experiment was conducted during the 2011–2013 growing seasons in Poland at the Mikulice Breeding and Production Facility belonging to the Małopolska Plant Breeding Station (50°00′26.7′′ N 22°26′25.2′′ E; Figure 1).
The plant material was 23 winter wheat genotypes (Table S1) with different Fusarium wilt resistance, as follows: 13 wheat lines obtained from Polish plant breeding companies; seven genotypes from six European countries; and three from the Department of Genetics and Plant Breeding, the Poznań University of Life Sciences [20]. The experiment had the following two factors: the first was the variant of protection and the second was the wheat genotype. All of the wheat genotypes were sown onto 3 m2 plots in three replications in three different variants:
-
full chemical crop protection (CH)—fungicides: Duet Ultra 497 SC (epoxyconazole, thiophanate methyl) at a concentration of 0.6 l·ha−1, and Capalo 337.5 SE (fenpropimorph, epoxyconazole, and metrafenone) at 2 l·ha−1;
-
no chemical crop protection, natural infestation (K);
-
no chemical crop protection, artificial inoculation with fungi from the genus Fusarium (I).
No fungicides were applied to the experimental plots of K and I.
The genotypes were sown on 29 September 2010, 27 September 2011, and 28 September 2012, and harvested on 5 August 2011, 2 August 2012, and 7 August 2013.
The inoculum used in the inoculation was produced from three isolates obtained from F. graminearum and three isolates obtained from F. culmorum.
After the appearance of first symptoms, the severity of the Fusarium wilt was assessed. The disease index (DI) was calculated from the following formula [46,47]:
DI = number of infected plants total number of plants × 100
The average monthly temperatures and monthly precipitation, measured according to the (World Meteorological Organization) WMO guidelines for the years 2011–2013, were obtained from a Vantage Vue 6357 UE 9 meteorological station (Davis Instruments) located approximately 400 m from the experimental field (Table S2).
After harvest, the plant height was measured and chemical analyzes were carried out (Table 1).

2.2. Determination of Ferulic Acid

The ferulic acid in the samples was analyzed after alkaline and acidic hydrolysis [20]. Analysis was performed using an Aquity H class (Ultra Performance Liquid Chromatography) UPLC system equipped with a Waters Acquity PDA detector (Waters Corporation, Parsippany, NJ, USA). Chromatographic separation was performed on an Acquity UPLC® BEH C18 column (100 mm × 2.1 mm, particle size 1.7 μm; Waters CorporationWaters, Dublin, Ireland). The elution was done with a gradient using the following mobile phase composition: (A) acetonitryl with 0.1% formic acid and (B) 1% aqueous formic acid mixture (pH = 2). The concentrations of phenolic compounds were determined using an internal standard at wavelengths of λ = 320 nm and 280 nm. Compounds were identified based on a comparison of the retention time of the analyzed peak with the retention time of the standard, and by adding a specific amount of the standard to the analyzed samples. The detection level was 1 μg/g. The retention time for ferulic acid was 17.50 min.

2.3. Determination of Trichothecenes

The grain samples were analyzed for the presence of trichothecenes, according to Perkowski et al. [48]. The trichothecenes of group B (DON and NIV) were analyzed as TMS (trimethylsilylsilyl ethers) derivatives. The analyses were run on a gas chromatograph (Hewlett Packard GC 6890) hyphenated to a mass spectrometer (Hewlett Packard 5972 A, Waldbronn, Germany), using an HP-5MS, 0.25 mm × 30 m capillary column. Quantitative analysis was performed in the single ion monitored mode (SIM) using the following ions for the detection of DON, 103 and 512, and NIV, 191. Qualitative analysis was performed in the SCAN mode (100–700 amu).

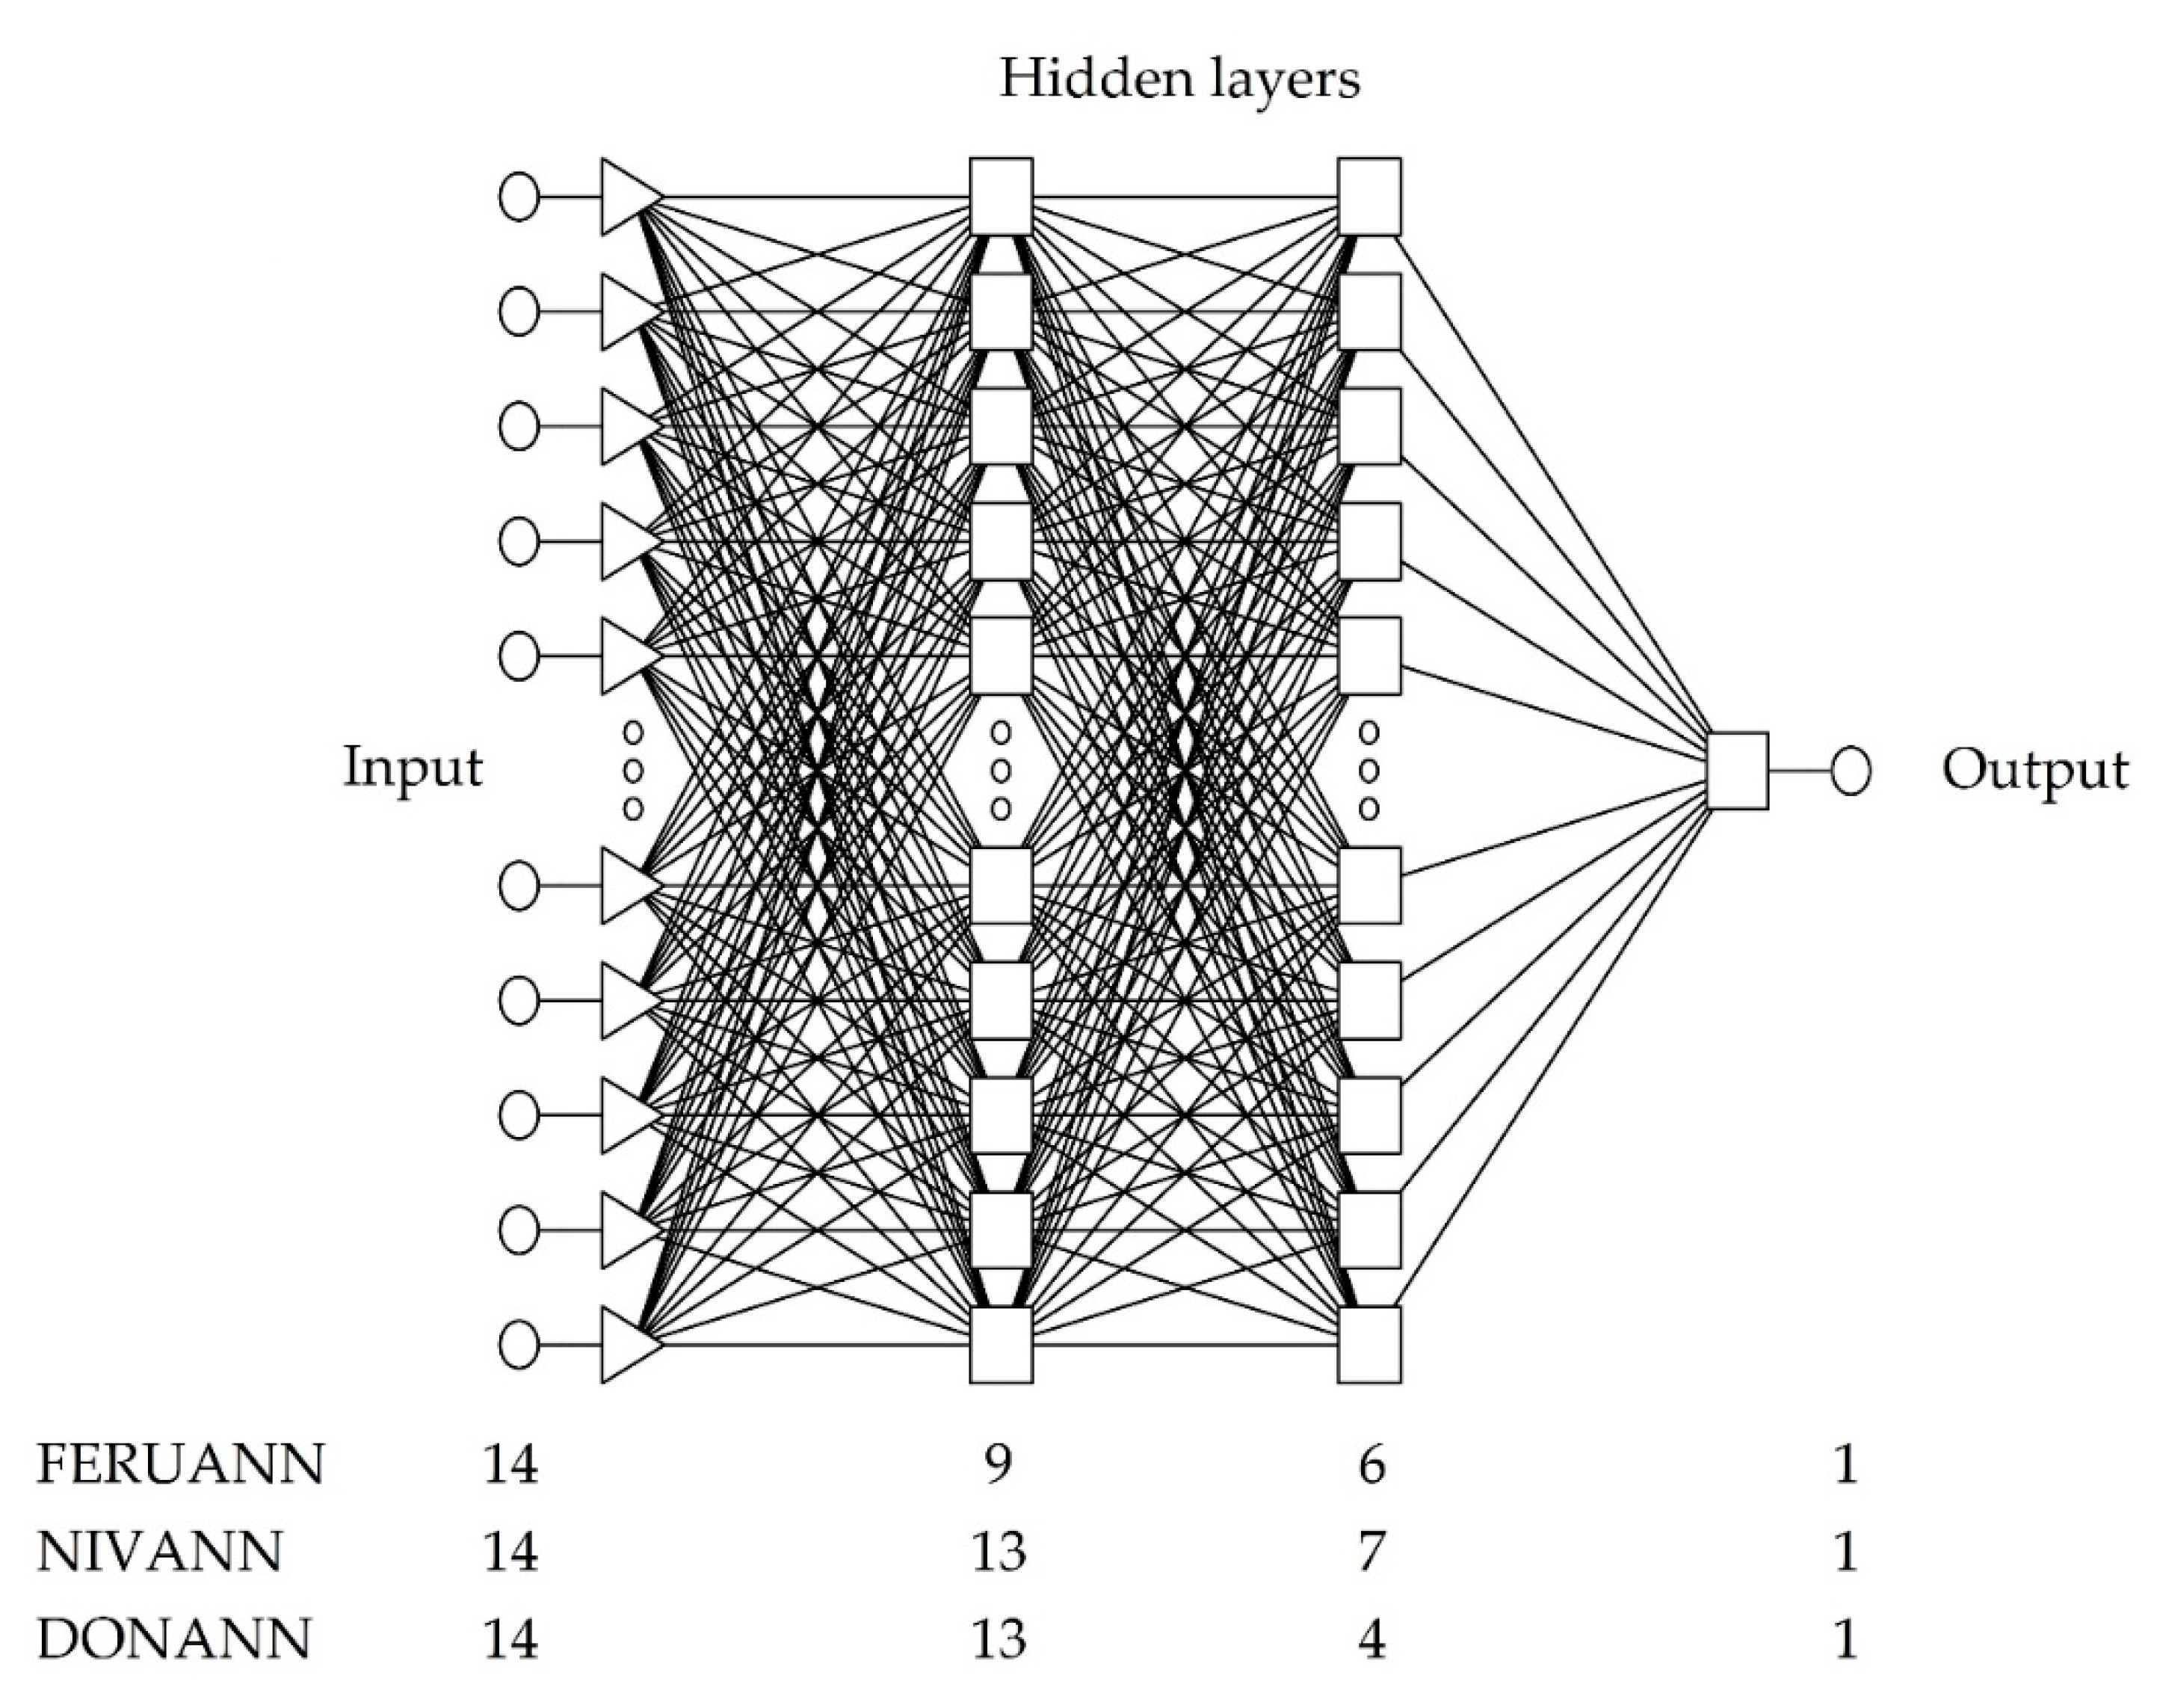
2.4. The Method of Constructing Neural Models

For the construction of three FERUANN analytical models (ferulic acid content), DONANN (deoxynivalenol content), and NIVANN (nivalenol content), artificial neural networks were applied using an Automatic Network Designer (AND) from Statistica v7.1 (StatSoft Inc., Tulsa, OK, USA). Each model was the result of learning 10,000 networks, one of which was selected for further analysis. For creation of the models, 138 data were used, and were divided into three sets, namely: learning, validation, and test. The structure of sets was divided into appropriately 70%:15%:15%. (96:21:21 cases for each set). Based on previous research [40,41,42,43,44], MLP (multilayer perceptron) topology networks with two hidden layers were selected for the analysis. This type of network is mainly used for regression or classification data analysis. Because of the use of AND, the assessment parameters for each neural model were adopted based on the following indicators: standard deviation, mean error, error deviation, mean absolute error, quotient deviations, and correlation. The best neural model was selected based on the highest correlation value and the lowest mean absolute error value. After selecting one neural model for each variant, a sensitivity analysis of the neural network was performed. This analysis determines the value of each independent variable (network input) in the FERUANN, DONANN, and NIVANN models produced. To determine the extent of the independent variable, the “error quotient” indicator was used. This indicator describes the ratio of error to error obtained using all of the independent features. This means that the greater the value, the greater the importance of the feature. If the value of the error quotient was less than 1, a given variable could be removed from the model to improve its quality. However, this is not mandatory. The indicator of the error ratio is “rank”, which indicates the order of variables through a decreasing error value—rank 1 for a specific independent variable is of greatest importance for the network.

3. Results

As a result of the analyzes, three independent neural models, FERUANN, DONANN, and NIVANN, were created. Each model was based on 14 independent variables, 12 of which were in the form of quantitative data, and the other 2 were presented as qualitative data (Table 1). The structure of the generated models was based on the multi-layer perceptron (MLP) ANN type with two hidden layers. The FERUANN model had nine neurons in the first hidden layer and six neurons in the second hidden layer. Accordingly, the DONANN model had 13 and 7 neurons, and the NIVANN model 13 and 4 neurons (Figure 2).
The best network fit for each model was selected from 10,000 networks, based on the best qualitative indicators. In the FERUANN model, the correlation coefficient was 0.9887, while in the DONANN model, the correlation coefficient was 0.9919. The last NIVANN model had a slightly lower correlation coefficient of 0.8106, however, it was still at an acceptable level (Table 2).
In the next step, sensitivity analysis of the generated FERUANN, DONANN, and NIVANN neural models was performed (Table 3). As a result, the independent variables that had the greatest impact on the concentration of ferulic acid, deoxynivalenol, and nivalenol were identified. In the FERUANN model, the largest error quotient was achieved by experiment variant (VAR), which amounted to 7.0823. Another feature in this model was winter wheat variety (VOW), which reached a much lower level of just 3.1471. Other independent variables in this model have reached values slightly higher than 1, which indicates z low impact on the ferulic acid content, but they should be left in the model. The situation is slightly different with the DONANN model. As before, the independent variables VAR and WOV achieved the highest values 1.3778 and 1.1069, respectively, but the other five independent features (T1-3, P6, T7, WH, and DI) achieved an error quotient smaller than 1. In view of the above, these features can be removed from the model, as their impact on the final result of the analysis is scant. The NIVANN model pointed out the two most important independent qualitative variables—VOW and VAR—whose error quotients were 1.6315 and 1.4793, respectively. Other independent variables, as in the FERUANN model, have reached an error quotient above 1. This means that they should be left in the model. All of the sensitivity analysis results of neural networks are presented in Table 3.

4. Discussion

One may find many relationships in the literature between genotype resistance and the resulting Fusarium wilt infestation, and the level of mycotoxin contamination [49]. Most often, ear Fusarium wilt is caused by F. graminearum and F. culmorum, which can produce mycotoxins from the group of trichothecenes, including DON and NIV. The production of toxins by individual strains of fungi depends on many factors, which include, first of all, the pathogen–plant interaction or the prevailing climatic conditions. The degree of ear infestation observed in the field is the result of the resistance of types I and II of the genotype. Type I is the resistance of the plant to the infection itself, and type II is resistance against spreading the pathogen in the ear [50].
Miedaner et al. [49] observed a significant effect of genotypic variability on DON accumulation in wheat. The most resistant varieties significantly affected DON production in the Mesterházy [51] experiment. In the most resistant varieties, a very low toxin contamination of grain was observed, despite the high toxin production by pathogenic fungi. Similarly, in the experiments by Miedaner et al. [49] and Paul et al. [3], the most resistant varieties accumulated less DON. In our own research, 23 wheat genotypes were used. The lines obtained from Polish breeding companies, according to the breeders, were characterized by varied resistance to Fusarium and other fungal diseases. Three winter wheat lines brought from the Department of Genetics and Plant Breeding of the Poznań University of Life Sciences were characterized by a high resistance to both mildew and Fusarium. These lines come from crossing English and French half-dwarf forms with leading Polish varieties. The remaining seven genotypes were varieties and lines from six European countries (Germany, the Czech Republic, Austria, the Netherlands, Hungary, and Sweden), which were used as sources of resistance to Fusarium. The current independent observations indicate a significant role of the variety in shaping the quantitative profile of the analyzed toxins. In the built neural models of DONANN and NIVANN, the error quotient for the variety reached a value of 1.1 in DON production, and 1.63 in the production of NIV. In turn, high correlations between field infestation and DON content in the grain were observed by Miedaner et al. [52] and Mesterházy [51]. The content of DON and NIV has been presented in detail in the publication Stuper-Szablewska et al. [21]. The content of DON was not dependent on the index disease calculated on the basis of the field observations. Index disease also had a very low significance in cases of NIV accumulation (13th position in the constructed NIVANN neural model). Potential differences are probably as a result of the large race diversity of pathogens, genotypes used, and environmental conditions [49].
The results of the studies on the effect of fungicides as a research factor on the extent of Fusarium infestation and the content of DON are not unambiguous, this may result from the use of fungicides containing various active substances, different doses and terms of application, diversity of pathogens attacking the plant, differences between varieties, and various weather conditions [53]. In the studies of Homdork et al. [54], the use of triazole fungicide lowered the concentration of DON in grain after inoculation compared with the control group. In turn, the use of fungicide in conditions of natural infestation did not have a significant impact on the level of DON and NIV reduction in the grain [55]. In studies conducted at various locations in the USA regarding the effect of tebuconazole on the content of DON, Paul et al. [3] found that the use of fungicide was more effective in reducing Fusarium wilt infestation in comparison with the level of DON reduction. Independent research found a significant impact of the experimental combination on the concentration of DON and NIV. The presence of a fungicide during a pathogen attack is an additional stressor for both plants and the pathogen itself. The use of chemical plant protection limits the development of the pathogen, which in response increases mycotoxin biosynthesis.
Genetically determined plant resistance to Fusarium can be modified by humidity and air temperature. In the conducted neural network sensitivity analysis, weather conditions from early January to the end of the vegetation period had an impact on the level of mycotoxins and ferulic acid. Only winter temperature (T1-3), end of vegetation period in July (T7), and rainfall from June (P6) affected the content of DON in the conducted experiment.
Field tests aimed at demonstrating the relationship between the level of pathogens, mycotoxins, and weather conditions are very difficult, because of the inability to prepare an experiment in which only one factor will change. In view of the above, literature data on the subject are very divergent, e.g., Miedaner et al. [49] could not relate weather conditions with the content of DON and NIV.
However, some authors suggest that some morphological features are important during Fusarium infection [56]. Their occurrence protects plants against necroses to which the pathogen may lead. Snijders [57] believed that on the one hand, tall plants tend to have a lower level of natural infection by Fusarium; on the other, many semi-dwarf plants with increased resistance to Fusarium can be selected. Probably, which is confirmed by our own research, the genotype of the plant itself is more important than its height. In the sensitivity analysis of neural models, the content of DON was not dependent on the height of the plants, and its impact on the NIV content was very small.
One of the most important defense mechanisms of wheat against stressors of various etiologies is the activation of the biosynthesis pathways of antioxidant compounds. One may find verification in literature sources, which has also been confirmed by our own research, that ferulic acid is one of the main compounds actively participating in the plant’s immune mechanisms [58].
In the study [58], the profiles of bound phenolic acids were similar in all of the wheat genotypes analyzed, and ferulic acid accounted for 72% to 85% of all acids. The authors observed a strong genotypic diversification in the ferulic acid content in the analyzed winter wheat genotypes, ranging from 181 to 742 mg/kg. In the research by Hernández et al. [59], the ferulic acid content ranged from 439 mg/kg (Raposo variety) to 1450 mg/kg (Colorado variety). The influence of the variety on the ferulic acid content is confirmed by numerous studies; however, differences in the examined content of this acid are observed [60,61,62]. Stuper-Szablewska et al. [21] showed that the average content of ferulic acid under control conditions was 844 mg/kg, 780 mg/kg, and 771 mg/kg in the years of the study. After inoculation, these values increased to 2248 mg/kg, 2574 mg/kg, and 3145 mg/kg, respectively [21].
The large range of variability of ferulic acid content in wheat varieties is also caused by the impact of environmental conditions and the interaction of the genotype with the environment [63]. An additional factor affecting the content of this acid is the occurrence of infection [21,64].

5. Conclusions

The harmful effect of mycotoxins imposes actions aimed at their minimization in raw materials and products intended for humans and animals. The most effective preventive action is limiting their formation in the field, by the cultivation of resistant genotypes. In the constructed FERUANN, DONANN, and NIVANN neural models, variety was a factor that significantly affected the content of ferulic acid, deoxynivalenol, and nivalenol in winter wheat seeds. This confirms the significant role of growing new varieties. Resistance breeding is carried out in many countries, and despite the difficulties, numerous resistant varieties are available, characterized by slower and the subsequent development of symptoms of Fusarium compared with sensitive varieties. As part of the pilot study discussed in this work, inoculation and fungicide spraying were treated as stressors. Both of these factors activate nonenzymatic resistance mechanisms, including phenolic acid biosynthesis. As a result, it was observed in our independent research in the FERUANN neural model that the applied experimental variant determined the ferulic acid content to the greatest extent. The variety feature also had a significant impact on the presence of ferulic acid.
The results of the conducted research using artificial neural networks indicate the possibility of the practical application of neural modeling methods to analyze the concentration of ferulic acid, deoxynivalenol, and nivalenol in winter wheat grain.

Supplementary Materials

The following are available online at https://www.mdpi.com/2077-0472/10/4/127/s1, Table S1: Pedigree of analysed winter wheat genotypes. Table S2: Rainfall and average air temperatures between January 2011 and December 2013.

Author Contributions

Conceptualization, G.N., D.K.-P., K.S.-S., and J.N.; data curation, G.N., D.K.-P., K.S.-S., and J.N.; formal analysis, G.N., D.K.-P., and K.S.-S.; funding acquisition, G.N.; investigation, D.K.-P. and J.N.; methodology, G.N., D.K.-P., and K.S.-S.; project administration, G.N.; resources, D.K.-P., K.S.-S., and J.N.; software, G.N.; supervision, G.N.; validation, G.N., D.K.-P., K.S.-S., and J.N.; visualization, G.N.; writing (original draft), G.N., D.K.-P., and K.S.-S.; writing (review and editing), K.S.-S. and J.N. All authors have read and agreed to the published version of the manuscript.

Funding

This research was funded by The Ministry of Agriculture and Rural Development R, grant number 801-13/12 (Basic research for biological progress in crop production).

Acknowledgments

The publication was co-financed within the framework of the Ministry of Science and Higher Education program titled “Regional Initiative Excellence” in 2019–2022, project no. 005/RID/2018/19.

Conflicts of Interest

The authors declare no conflict of interest. The funders had no role in the design of the study; in the collection, analyses, or interpretation of data; in the writing of the manuscript; or in the decision to publish the results.

References

  1. Fernandez, O.; Béthencourt, L.; Quero, A.; Sangwan, R.S.; Clément, C. Trehalose and plant stress responses: Friend or foe? Trends Plant Sci. 2010, 15, 409–417. [Google Scholar] [CrossRef] [PubMed]
  2. Mahajan, S.; Tuteja, N. Cold, salinity and drought stresses: An overview. Arch. Biochem. Biophys. 2005, 444, 139–158. [Google Scholar] [CrossRef] [PubMed]
  3. Paul, P.A.; Lipps, P.E.; Hershman, D.E.; McMullen, M.P.; Draper, M.A.; Madden, L.V. A Quantitative Review of Tebuconazole Effect on Fusarium Head Blight and Deoxynivalenol Content in Wheat. Phytopathology 2007, 97, 211–220. [Google Scholar] [CrossRef] [PubMed] [Green Version]
  4. McDonald, B.A.; Linde, C. Pathogen population genetics, evolutionary potential, and durable resistance. Annu. Rev. Phytopathol. 2002, 40, 349–379. [Google Scholar] [CrossRef] [PubMed] [Green Version]
  5. Xue, S.; Xu, F.; Tang, M.; Zhou, Y.; Li, G.; An, X.; Lin, F.; Xu, H.; Jia, H.; Zhang, L.; et al. Precise mapping Fhb5, a major QTL conditioning resistance to Fusarium infection in bread wheat (Triticum aestivum L.). Theor. Appl. Genet. 2011, 123, 1055–1063. [Google Scholar] [CrossRef]
  6. Xue, S.; Li, G.; Jia, H.; Xu, F.; Lin, F.; Tang, M.; Wang, Y.; An, X.; Xu, H.; Zhang, L.; et al. Fine mapping Fhb4, a major QTL conditioning resistance to Fusarium infection in bread wheat (Triticum aestivum L.). Theor. Appl. Genet. 2010, 121, 147–156. [Google Scholar] [CrossRef]
  7. Dhokane, D.; Karre, S.; Kushalappa, A.C.; McCartney, C. Integrated Metabolo-Transcriptomics Reveals Fusarium Head Blight Candidate Resistance Genes in Wheat QTL-Fhb2. PLoS ONE 2016, 11, e0155851. [Google Scholar]
  8. Giancaspro, A.; Giove, S.L.; Zito, D.; Blanco, A.; Gadaleta, A. Mapping QTLs for Fusarium Head Blight Resistance in an Interspecific Wheat Population. Front. Plant Sci. 2016, 7, 1381. [Google Scholar] [CrossRef]
  9. Arruda, M.P.; Brown, P.; Brown-Guedira, G.; Krill, A.M.; Thurber, C.; Merrill, K.R.; Foresman, B.J.; Kolb, F.L. Genome-Wide Association Mapping of Fusarium Head Blight Resistance in Wheat using Genotyping-by-Sequencing. Plant Genome 2016, 9. [Google Scholar] [CrossRef]
  10. Buerstmayr, H.; Ban, T.; Anderson, J.A. QTL mapping and marker-assisted selection for Fusarium head blight resistance in wheat: A review. Plant Breed. 2009, 128, 1–26. [Google Scholar]
  11. Riley, R.T.; An, N.H.; Showker, J.L.; Yoo, H.S.; Norred, W.P.; Chamberlain, W.J.; Wang, E.; Merrill, A.H.; Motelin, G.; Beasley, V.R.; et al. Alteration of Tissue and Serum Sphinganine to Sphingosine Ratio: An Early Biomarker of Exposure to Fumonisin-Containing Feeds in Pigs. Toxicol. Appl. Pharmacol. 1993, 118, 105–112. [Google Scholar] [CrossRef]
  12. Bal, G. Scab of Wheat: Prospects For Control. Plant Dis. 1994, 78, 760. [Google Scholar]
  13. McMullen, M.; Jones, R.; Gallenberg, D. Scab of Wheat and Barley: A Re-emerging Disease of Devastating Impact. Plant Dis. 1997, 81, 1340–1348. [Google Scholar] [PubMed] [Green Version]
  14. Gang, G.; Miedaner, T.; Schuhmacher, U.; Schollenberger, M.; Geiger, H.H. Deoxynivalenol and Nivalenol Production by Fusarium culmorum Isolates Differing in Aggressiveness Toward Winter Rye. Phytopathology 1998, 88, 879–884. [Google Scholar]
  15. D’Mello, J.P.F.; Placinta, C.M.; Macdonald, A.M.C. Fusarium mycotoxins: A review of global implications for animal health, welfare and productivity. Anim. Feed Sci. Technol. 1999, 80, 183–205. [Google Scholar]
  16. Muthomi, J.W.; Schütze, A.; Dehne, H.-W.; Mutitu, E.W.; Oerke, E.-C. Characterization of Fusarium culmorum isolates by mycotoxin production and aggressiveness to winter wheat/Charakterisierung von Isolaten von Fusarium culmorum anhand der Mykotoxinbildung und Aggressivität an Winterweizen. Z. Pflanzenkrankh. Pflanzenschutz/J. Plant Dis. Prot. 2000, 107, 113–123. [Google Scholar]
  17. Peng, W.-X.; Marchal, J.L.M.; van der Poel, A.F.B. Strategies to prevent and reduce mycotoxins for compound feed manufacturing. Anim. Feed Sci. Technol. 2018, 237, 129–153. [Google Scholar]
  18. Martínez, G.; Regente, M.; Jacobi, S.; Del Rio, M.; Pinedo, M.; de la Canal, L. Chlorogenic acid is a fungicide active against phytopathogenic fungi. Pestic. Biochem. Physiol. 2017, 140, 30–35. [Google Scholar]
  19. Siranidou, E.; Kang, Z.; Buchenauer, H. Studies on Symptom Development, Phenolic Compounds and Morphological Defence Responses in Wheat Cultivars Differing in Resistance to Fusarium Head Blight. J. Phytopathol. 2002, 150, 200–208. [Google Scholar]
  20. Stuper-Szablewska, K.; Kurasiak-Popowska, D.; Nawracała, J.; Perkowski, J. Response of non-enzymatic antioxidative mechanisms to stress caused by infection with Fusarium fungi and chemical protection in different wheat genotypes. Chem. Ecol. 2017, 33, 949–962. [Google Scholar]
  21. Stuper-Szablewska, K.; Kurasiak-Popowska, D.; Nawracała, J.; Perkowski, J. Quantitative profile of phenolic acids and antioxidant activity of wheat grain exposed to stress. Eur. Food Res. Technol. 2019, 245, 1595–1603. [Google Scholar] [CrossRef] [Green Version]
  22. Stuper-Szablewska, K.; Kurasiak-Popowska, D.; Nawracała, J.; Perkowski, J. Study of metabolite profiles in winter wheat cultivars induced by Fusarium infection. Cereal Res. Commun. 2016, 44, 572–584. [Google Scholar] [CrossRef] [Green Version]
  23. Goral, T.; Stuper-Szablewska, K.; Busko, M.; Boczkowska, M.; Walentyn-Goral, D.; Wisniewska, H.; Perkowski, J. Relationships between Genetic Diversity and Fusarium Toxin Profiles of Winter Wheat Cultivars. Plant Pathol. J. 2015, 31, 226–244. [Google Scholar] [CrossRef] [PubMed] [Green Version]
  24. Stuper-Szablewska, K.; Perkowski, J. Phenolic acids in cereal grain: Occurrence, biosynthesis, metabolism and role in living organisms. Crit. Rev. Food Sci. Nutr. 2019, 59, 664–675. [Google Scholar] [CrossRef] [PubMed]
  25. Abdipour, M.; Ramazani, S.H.R.; Younessi-Hmazekhanlu, M.; Niazian, M. Modeling Oil Content of Sesame (Sesamum indicum L.) Using Artificial Neural Network and Multiple Linear Regression Approaches. J. Am. Oil Chem. Soc. 2018, 95, 283–297. [Google Scholar] [CrossRef]
  26. Mohammadi Torkashvand, A.; Ahmadi, A.; Gómez, P.A.; Maghoumi, M. Using artificial neural network in determining postharvest LIFE of kiwifruit. J. Sci. Food Agric. 2019, 99, 5918–5925. [Google Scholar] [CrossRef] [PubMed]
  27. Taner, A.; Öztekin, Y.; Tekgüler, A.; Sauk, H.; Duran, H. Classification of Varieties of Grain Species by Artificial Neural Networks. Agronomy 2018, 8, 123. [Google Scholar] [CrossRef] [Green Version]
  28. Torkashvand, A.M.; Ahmadi, A.; Nikravesh, N.L. Prediction of kiwifruit firmness using fruit mineral nutrient concentration by artificial neural network (ANN) and multiple linear regressions (MLR). J. Integr. Agric. 2017, 16, 1634–1644. [Google Scholar] [CrossRef] [Green Version]
  29. Kujawa, S.; Dach, J.; Kozłowski, R.J.; Przybył, K.; Niedbała, G.; Mueller, W.; Tomczak, R.J.; Zaborowicz, M.; Koszela, K. Maturity classification for sewage sludge composted with rapeseed straw using neural image analysis. In Proceedings of the SPIE—The International Society for Optical Engineering, Chengu, China, 29 August 2016; Volume 10033, p. 100332H. [Google Scholar]
  30. Kozłowski, R.J.; Kozłowski, J.; Przybył, K.; Niedbała, G.; Mueller, W.; Okoł, P.; Wojcieszak, D.; Koszela, K.; Kujawa, S. Image analysis techniques in the study of slug behaviour. In Proceedings of the SPIE—The International Society for Optical Engineering, Chengu, China, 29 August 2016; Volume 10033, p. 100332I. [Google Scholar]
  31. Niedbała, G.; Mioduszewska, N.; Mueller, W.; Boniecki, P.; Wojcieszak, D.; Koszela, K.; Kujawa, S.; Kozłowski, R.J.; Przybył, K. Use of computer image analysis methods to evaluate the quality topping sugar beets with using artificial neural networks. In Proceedings of the SPIE—The International Society for Optical Engineering, Chengu, China, 29 August 2016; Volume 10033, p. 100332M. [Google Scholar]
  32. Boniecki, P.; Koszela, K.; Świerczyński, K.; Skwarcz, J.; Zaborowicz, M.; Przybył, J. Neural Visual Detection of Grain Weevil (Sitophilus granarius L.). Agriculture 2020, 10, 25. [Google Scholar] [CrossRef] [Green Version]
  33. Ryu, G.-A.; Nasridinov, A.; Rah, H.; Yoo, K.-H. Forecasts of the Amount Purchase Pork Meat by Using Structured and Unstructured Big Data. Agriculture 2020, 10, 21. [Google Scholar] [CrossRef] [Green Version]
  34. Apolo-Apolo, O.E.; Pérez-Ruiz, M.; Martínez-Guanter, J.; Egea, G. A Mixed Data-Based Deep Neural Network to Estimate Leaf Area Index in Wheat Breeding Trials. Agronomy 2020, 10, 175. [Google Scholar] [CrossRef] [Green Version]
  35. Abbaspour-Gilandeh, Y.; Molaee, A.; Sabzi, S.; Nabipur, N.; Shamshirband, S.; Mosavi, A. A Combined Method of Image Processing and Artificial Neural Network for the Identification of 13 Iranian Rice Cultivars. Agronomy 2020, 10, 117. [Google Scholar] [CrossRef] [Green Version]
  36. Abdipour, M.; Younessi-Hmazekhanlu, M.; Ramazani, S.H.R.; omidi, A. hassan Artificial neural networks and multiple linear regression as potential methods for modeling seed yield of safflower (Carthamus tinctorius L.). Ind. Crops Prod. 2019, 127, 185–194. [Google Scholar] [CrossRef]
  37. Ray, A.; Halder, T.; Jena, S.; Sahoo, A.; Ghosh, B.; Mohanty, S.; Mahapatra, N.; Nayak, S. Application of artificial neural network (ANN) model for prediction and optimization of coronarin D content in Hedychium coronarium. Ind. Crops Prod. 2020, 146, 112186. [Google Scholar] [CrossRef]
  38. Niazian, M.; Sadat-Noori, S.A.; Abdipour, M. Modeling the seed yield of Ajowan (Trachyspermum ammi L.) using artificial neural network and multiple linear regression models. Ind. Crops Prod. 2018, 117, 224–234. [Google Scholar] [CrossRef]
  39. Niazian, M.; Sadat-Noori, S.A.; Abdipour, M. Artificial neural network and multiple regression analysis models to predict essential oil content of ajowan (Carum copticum L.). J. Appl. Res. Med. Aromat. Plants 2018, 9, 124–131. [Google Scholar] [CrossRef]
  40. Niedbała, G. Simple model based on artificial neural network for early prediction and simulation winter rapeseed yield. J. Integr. Agric. 2019, 18, 54–61. [Google Scholar] [CrossRef] [Green Version]
  41. Niedbała, G. Application of artificial neural networks for multi-criteria yield prediction of winter rapeseed. Sustainability 2019, 11, 533. [Google Scholar] [CrossRef] [Green Version]
  42. Niedbala, G.; Kozlowski, R.J. Application of Artificial Neural Networks for Multi-Criteria Yield Prediction of Winter Wheat. J. Agric. Sci. Technol. 2019, 21, 51–61. [Google Scholar]
  43. Niedbała, G.; Nowakowski, K.; Rudowicz-Nawrocka, J.; Piekutowska, M.; Weres, J.; Tomczak, R.J.; Tyksiński, T.; Pinto, A.Á. Multicriteria prediction and simulation of winter wheat yield using extended qualitative and quantitative data based on artificial neural networks. Appl. Sci. 2019, 9, 2773. [Google Scholar] [CrossRef] [Green Version]
  44. Niedbała, G.; Piekutowska, M.; Weres, J.; Korzeniewicz, R.; Witaszek, K.; Adamski, M.; Pilarski, K.; Czechowska-Kosacka, A.; Krysztofiak-Kaniewska, A. Application of Artificial Neural Networks for Yield Modeling of Winter Rapeseed Based on Combined Quantitative and Qualitative Data. Agronomy 2019, 9, 781. [Google Scholar] [CrossRef] [Green Version]
  45. Wojciechowski, T.; Niedbala, G.; Czechlowski, M.; Nawrocka, J.R.; Piechnik, L.; Niemann, J. Rapeseed seeds quality classification with usage of VIS-NIR fiber optic probe and artificial neural networks. In Proceedings of the 2016 International Conference on Optoelectronics and Image Processing, ICOIP 2016, Warsaw, Poland, 10–12 June 2016. [Google Scholar]
  46. Kaushik, P.; Dhaliwal, M. Diallel Analysis for Morphological and Biochemical Traits in Tomato Cultivated under the Influence of Tomato Leaf Curl Virus. Agronomy 2018, 8, 153. [Google Scholar] [CrossRef] [Green Version]
  47. Viriyasuthee, W.; Saksirirat, W.; Saepaisan, S.; Gleason, M.L.; Jogloy, S. Jogloy Variability of Alternaria Leaf Spot Resistance in Jerusalem Artichoke (Helianthus Tuberosus L.) Accessions Grown in a Humid Tropical Region. Agronomy 2019, 9, 268. [Google Scholar]
  48. Perkowski, J.; Wiwart, M.; Buśko, M.; Laskowska, M.; Berthiller, F.; Kandler, W.; Krska, R. Fusarium toxins and total fungal biomass indicators in naturally contaminated wheat samples from north-eastern Poland in 2003. Food Addit. Contam. 2007, 24, 1292–1298. [Google Scholar] [CrossRef]
  49. Miedaner, T.; Reinbrecht, C.; Lauber, U.; Schollenberger, M.; Geiger, H.H. Effects of genotype and genotype-environment interaction on deoxynivalenol accumulation and resistance to Fusarium head blight in rye, triticale, and wheat. Plant Breed. 2001, 120, 97–105. [Google Scholar] [CrossRef]
  50. Foroud, N.; Eudes, F. Trichothecenes in Cereal Grains. Int. J. Mol. Sci. 2009, 10, 147–173. [Google Scholar] [CrossRef] [Green Version]
  51. Mesterházy, Á. Role of Deoxynivalenol in Aggressiveness of Fusarium graminearum and F. culmorum and in Resistance to Fusarium Head Blight. Eur. J. Plant Pathol. 2002, 108, 675–684. [Google Scholar] [CrossRef]
  52. Miedaner, T.; Schneider, B.; Geiger, H.H. Deoxynivalenol (DON) content and Fusarium head blight resistance in segregating populations of winter rye and winter wheat. Crop Sci. 2003, 43, 519–526. [Google Scholar] [CrossRef]
  53. Champeil, A.; Doré, T.; Fourbet, J. Fusarium head blight: Epidemiological origin of the effects of cultural practices on head blight attacks and the production of mycotoxins by Fusarium in wheat grains. Plant Sci. 2004, 166, 1389–1415. [Google Scholar] [CrossRef]
  54. Homdork, S.; Fehrmann, H.; Beck, R. Effects of Field Application of Tebuconazole on Yield, Yield Components and the Mycotoxin Content of Fusarium-infected Wheat Grain. J. Phytopathol. 2000, 148, 1–6. [Google Scholar] [CrossRef]
  55. Champeil, A.; Fourbet, J..; Doré, T.; Rossignol, L. Influence of cropping system on Fusarium head blight and mycotoxin levels in winter wheat. Crop Prot. 2004, 23, 531–537. [Google Scholar] [CrossRef]
  56. Rudd, J.C.; Horsley, R.D.; McKendry, A.L.; Elias, E.M. Host Plant Resistance Genes for Fusarium Head Blight. Crop Sci. 2001, 41, 620. [Google Scholar] [CrossRef] [Green Version]
  57. Snijders, C.H.A. Resistance in wheat to Fusarium infection and trichothecene formation. Toxicol. Lett. 2004, 153, 37–46. [Google Scholar] [CrossRef] [PubMed]
  58. Li, L.; Shewry, P.R.; Ward, J.L. Phenolic Acids in Wheat Varieties in the HEALTHGRAIN Diversity Screen. J. Agric. Food Chem. 2008, 56, 9732–9739. [Google Scholar] [CrossRef] [PubMed]
  59. Hernández, L.; Afonso, D.; Rodríguez, E.M.; Díaz, C. Phenolic Compounds in Wheat Grain Cultivars. Plant Foods Hum. Nutr. 2011, 66, 408–415. [Google Scholar] [CrossRef]
  60. Gallardo, C.; Jiménez, L.; García-Conesa, M.-T. Hydroxycinnamic acid composition and in vitro antioxidant activity of selected grain fractions. Food Chem. 2006, 99, 455–463. [Google Scholar] [CrossRef]
  61. Van Hung, P.; Maeda, T.; Miyatake, K.; Morita, N. Total phenolic compounds and antioxidant capacity of wheat graded flours by polishing method. Food Res. Int. 2009, 42, 185–190. [Google Scholar] [CrossRef]
  62. Zhou, K.; Laux, J.J.; Yu, L. Comparison of Swiss Red Wheat Grain and Fractions for Their Antioxidant Properties. J. Agric. Food Chem. 2004, 52, 1118–1123. [Google Scholar] [CrossRef] [PubMed]
  63. Martini, D.; Taddei, F.; Nicoletti, I.; Ciccoritti, R.; Corradini, D.; D’Egidio, M.G. Effects of Genotype and Environment on Phenolic Acids Content and Total Antioxidant Capacity in Durum Wheat. Cereal Chem. J. 2014, 91, 310–317. [Google Scholar] [CrossRef]
  64. Kasote, D.M.; Katyare, S.S.; Hegde, M.V.; Bae, H. Significance of Antioxidant Potential of Plants and its Relevance to Therapeutic Applications. Int. J. Biol. Sci. 2015, 11, 982–991. [Google Scholar] [CrossRef] [Green Version]
Figure 1. Location of the study site.
Agriculture 10 00127 g001
Figure 2. General diagram of the network, divided into hidden and input layers, and one output. FERUANN: ferulic acid content; NIVANN: nivalenol content; DONANN: deoxynivalenol content.
Agriculture 10 00127 g002
Table 1. Data structure in the neural models.
SymbolUnit of MeasureVariable NameThe Scope of Data
Quantitative data
P1-3mmSum of precipitation from 1 January to 31 March90–102
T1-3°CAverage air temperature from 1 January to 31 March−1.6–−1.1
P4mmSum of precipitation from 1 April to 30 April25–29
T4°CAverage air temperature from January 1 April to 30 April9.9–10
P5mmSum of precipitation from 1 May to 31 May4–70
T5°CAverage air temperature from 1 May to 31 May15.6–16
P6mmSum of precipitation from 1 June to 31 June102–103
T6°CAverage air temperature from 1 June to 31 June18.3–18.7
P7mmSum of precipitation from 1 July to 31 July33–58
T7°CAverage air temperature from 1 July to 31 July19.5–21.4
WHcmWheat height67–122
DI%Disease index0–95
Qualitative data
VARwordExperimental variantInoculation
Protection
Control
VOWwordVariety of wheatMUSZELKA
SMH 8489
KBP 08.17
ARKADIA
STH 9011
NAD 08104
STH 9035
AND 394/07
BAMBERKA
SMH 8540
KBP 08.8
SVPC 87185
CHD 7143/04
82/2011
TARKUS
91/2011
PRAAG 8
20816
83/2011
FREGATA
ERTUS
20818
UNG 136.6.1.1.
VAR: experiment variant; VOW: winter wheat variety. FERUANN analytical models (ferulic acid content), DONANN (deoxynivalenol content) and NIVANN (nivalenol content).
Table 2. The quality and structure of the neural models produced.
FERUANNDONANNNIVANN
Neural Network StructureMLP
14:38-9-6-1:1
MLP
14:38-13-7-1:1
MLP
14:38-13-4-1:1
Learning error0.02100.01750.0244
Validation error0.03490.03080.0301
Test error0.04920.03560.2288
Mean1646.792.97080.0705
Standard deviation1034.544.20310.1146
Average error12.840.05410.0076
Deviation error156.890.53360.0672
Mean Absolute error114.340.37050.0220
Quotient deviations0.15160.12690.5861
Correlation0.98870.99190.8106
FERUANN: ferulic acid content; DONANN: deoxynivalenol content; NIVANN: nivalenol content; MLP: multilayer perceptron.
Table 3. Sensitivity analysis of neural networks.
VariableModel
FERUANNDONANNNIVANN
QuotientRankQuotientRankQuotientRank
P1-31.597341.091731.14367
T1-31.197790.9860131.062911
P41.312071.034771.25974
T41.0780111.047761.12468
P51.0027141.075441.32813
T51.297681.073151.038112
P61.371850.9784141.09779
T61.633231.033581.18946
P71.1242101.012291.21635
T71.527650.9930121.085310
WH1.0355120.9963111.002514
DI1.0163130.9979101.029213
VAR7.082311.377811.47932
VOW3.147121.106921.63151
FERUANN: ferulic acid content; DONANN: deoxynivalenol content; NIVANN: nivalenol content; WH: DI: VAR: experiment variant; VOW: winter wheat variety.

