Article

Influence of Species Composition and Management on Biomass Production in Missouri

by
Ranjith P. Udawatta
1,2,*,
Clark J. Gantzer
1,
Timothy M. Reinbott
3,
Ray L. Wright
3,
Pierce A. Robert II
1 and
Walter Wehtje
1
1
School of Natural Resources, University of Missouri, Columbia, MO 65211, USA
2
The Center for Agroforestry, School of Natural Resources, University of Missouri, Columbia, MO 65211, USA
3
University of Missouri Bradford Research Center, 4968 Rangeline Road, Columbia, MO 65201-8973, USA
*
Author to whom correspondence should be addressed.
Agriculture 2020, 10(3), 75; https://doi.org/10.3390/agriculture10030075
Submission received: 23 January 2020 / Revised: 10 March 2020 / Accepted: 11 March 2020 / Published: 13 March 2020
(This article belongs to the Special Issue Agricultural Diversification)

Abstract

:
Perennial biofuel crops help to reduce both dependence on fossil fuels and greenhouse gas emissions while utilizing nutrients more efficiently compared to annual crops. In addition, perennial crops grown for biofuels have the potential to produce high biomass yields, are capable of increased carbon sequestration, and are beneficial for reducing soil erosion. Various monocultures and mixtures of perennial grasses and forbs can be established to achieve these benefits. The objective of this study was to quantify the effects of feedstock mixture and cutting height on yields. The base feedstock treatments included a monoculture of switchgrass (SG) and a switchgrass:big bluestem 1:1 mixture (SGBBS). Other treatments included mixtures of the base feedstock with ratios of base to native forbs plus legumes of 100:0, 80:20, 60:40, and 20:80. The study was established in 2008. Biomass crops typically require 2 to 3 years to produce a uniform stand. Therefore, harvest data were collected from July 2010 to July 2013. Three harvest times were selected to represent (1) biomass for biofuel (March), (2) forage (July), and (3) forage and biomass (October). Annual mean yields varied between 4.97 Mg ha−1 in 2010 to 5.56 Mg ha−1 in 2011. However, the lowest yield of 2.82 Mg ha−1 in March and the highest yield of 7.18 Mg ha−1 in July were harvested in 2013. The mean yield was 5.21 Mg ha−1 during the 4 year study. The effect of species mixture was not significant on yield. The cutting height was significant (p < 0.001), with greater yield for the 15 cm compared to the 30 cm cutting height. Yield differences were larger between harvest times during the early phase of the study. Yield difference within a harvest time was not significant for 3 of the 10 harvests. Future studies should examine changes in biomass production for mixture composition with time for selection of optimal regional specific species mixtures.

1. Introduction

Bioenergy acts (Biomass Research and Development Act 2000, Energy Policy Act 2005, and Energy Independence and Security Act 2007) and the Farm Bills of 2002, 2008, and 2014 have promoted renewable energy production, mandating 136 billion L production of biofuel by 2022. Biofuels play a role in helping reduce dependence on fossil fuels and greenhouse gas emissions [1]. Midwestern United States monocultures of perennial grasses have been promoted as a potential crop for biomass production. Perennial grasses use nutrients more efficiently compared to annual crops and produce high dry matter yields while reducing soil erosion and increasing carbon sequestration [2,3]. Planting perennial grasses provides numerous ecosystem services, including the reduction of non-native species [4]. Tilman suggests that marginal or retired Conservation Reserve Program (CRP) lands have potential for bioenergy production to avoid land competition with food production [5,6]. This idea supports the general consensus from Missouri agricultural producers that biofuel production will primarily be implemented on less productive soils, which are typically used for livestock production or are currently enrolled in the CRP [7]. Despite the benefits of growing bioenergy crops, challenges exist for producing sufficient feedstock to meet the 2022 production target.
US corn grain yield has increased by 0.12 Mg ha−1 annually since 1955, thanks to improvements in genetics and management [8]. Currently, more than 37% of the US corn crop is being used for ethanol production [9]. The highest corn production to date occurred in 2016 with 0.36 109 Mg of production on 38 106 ha of land [9]. Using an average corn-to-ethanol conversion rate, 2016 corn production could have produced 15.4 billion L of ethanol [10]. Although corn feedstock is an important contributor, other cellulosic feedstocks will be required to meet the 136 billion L target in 2022.
Typically, monocultures of switchgrass (Panicum virgantum L.), a native warm-season grass, or Miscanthus x giganteus, an introduced species, have been used for biomass production for cellulosic ethanol production. These two species have the potential to produce enough ethanol to offset one-fifth of the US fuel use if planted on ~9% of US cropland [11]. These species have been identified as potential high-biomass-producing species on water- and nutrient-limited eroded soils [12]. In a monoculture, switchgrass yields could vary between 5 and 20 Mg ha−1 in the US and are determined by weather, soil, ecotype (upland/lowland), and management [13,14,15,16]. Data from 39 sites across 17 states showed biomass yields of ~9 and ~13 Mg ha–1 for upland and lowland ecotypes, respectively [16].
Recent studies showed that a diversified cropping system may produce equal or greater biomass for fuel production compared to monocrop systems [17,18]. A yield from a diverse mixture of native grasses and forbs was ~240% greater than for monocrop yield after a decade [17]. In a 5 year study conducted across nine locations, Jungers [18] observed greatest yields with a mixture of four and eight species both with and without added nitrogen. Over time, biomass yield remained constant for these diverse mixtures.
Combination of native legumes and forbs with native warm-season grasses can decrease the need for N fertilizer and thus provide more options for livestock producers (e.g., grazing or biomass production for fuel). Tilman [5,6,17] highlighted the benefits that result from diverse combinations of native grasses and forbs, which create a portfolio effect whereby one species’ potential lack of performance is compensated by other species. Such mixtures can also provide additional financial incentives through enrolment in conservation programs (Ex, Cover Crop Standard Practice 340; https://efotg.sc.egov.usda.gov/references/public/IN/340_Cover_Crop.pdf). Establishing diverse mixtures of native forbs, legumes, and warm-season grasses on agricultural land can also provide environmental benefits such as habitat for bobwhite quail, grassland birds, and other wildlife requiring springtime successional vegetation for food and cover [19,20]. Several studies have described the importance of grazer interactions and ecological benefits as well as how grazing alters plant community species composition and impacts nutrient cycles [21,22]. A combination of native grasses, forbs, and legumes can improve soil and water conservation and provide habitats for pollinator species [23,24]. Establishing and managing diverse mixtures of native plants for biomass and forage crops reintroduces a species matrix adapted to a region’s climate and soil conditions [25].
In contrast to previously mentioned studies, significant variations in biomass yield across landscapes because of factors including soil type and weather conditions have been reported [26,27]. Studying feedstock yields for five years across topography in North Dakota, South Dakota, and Nebraska, Schmer [28] reported inconsistent relationships between switchgrass yields and topographic attributes. In Iowa and Minnesota, the effect of a field’s position within a particular landscape on biomass yield was inconsistent [29,30].
Biomass yield used for feedstock is also influenced by cropping practice and management [2,3]. The timing of harvest impacts yield quality parameters including moisture and ash contents and other traits [13,31,32,33]. Studying switchgras harvest times in Iowa, Vogel [34] recorded optimum feedstock yields for R3 to R5 (panicle fully emerged from boot to postanthesis) maturity stages. Others have shown yield responses to N fertilizers. No nitrogen treatment showed increasing yields up to the fourth year, while yields declined in the last sampling for the 160 kg ha−1 treatment in a 16 year study [35]. Angelini [36] concluded that fertilization mostly affects the initial four years of crop growth and then declines afterwards. The effects of management and soil fertility or nutrient supply are becoming increasingly important for the development of an efficient feedstock production strategy that can also provide other ecosystem services such as improved soil conservation as well as enhanced pollinator and wildlife habitat. Cutting heights influence the amount of residual vegetation that is available for use by a variety of grassland wildlife species for protective cover during the winter and for nesting habitats during spring [20]. Research suggests that the development of new switchgrass cultivars based on local ecotypes will also provide increased opportunities for the production of biomass and improved ecological services [37,38].
Considerable inconsistencies exist between the effects management and species composition on feedstock yields. Few studies have been conducted in claypan soils to examine possible differences in biomass yields for feedstock as influenced by factors such as soil fertility and crop management practices. Claypan soils (Major Land Resource Area 113) are characterized by a dense, impermeable clay horizon with very low hydraulic conductivity and greater runoff potential, thus potentially removing large amounts of sediment and nutrients from agricultural watersheds [39]. The objectives of this study were to examine the effects crop management practices such as cutting height, cutting time, and the influence of plant mixture diversity on feedstock yields for four years. A monoculture of switchgrass was established along with plots that contained equal combinations of switchgrass and big bluestem (Andropogon gerardii Vitman). Each of these combinations also contained mixtures of native forbs and legumes seeded at various grass-to-forb ratios to address these study objectives.

2. Materials and Methods

The study was established at the University of Missouri’s Bradford Research Center (MU BREC) in 2008. The study area consisted of a corn–soybean rotation prior to the establishment of the biomass plots, and soybean was the crop harvested during the previous year. This site represents a claypan soil (Mexico silt loam 0%–2% slope; Fine, smectitic, mesic Aeric Vertic Epiaqualfs) of central Missouri. The primary climate–soil–plant community classification is Claypan Summit Prairie (ecological site ID: R113XY001MO) see http://esis.sc.egov.usda.gov).
Feedstock treatments included a monoculture of switchgrass (SG), a switchgrass and big bluestem 1:1 mixture (SGBBS), and these grasses planted with varying ratios of native forbs and legumes. The switchgrass variety used was Cave in Rock. The grass to forb and legume species ratios used in the plantings were 100:0, 80:20, 60:40, and 20:80. The selection of native species, legumes, and forbs in the mixtures were based on ability to fix nitrogen and provide forage while enhancing plant diversity of the stand and improving wildlife habitat [40,41]. The legume species were Partridge pea (Chamaecrista fasciculate Michx.), Illinois bundle flower (Desmanthus illinoensis (Michx.) MacMill. ex B.L. Rob & Fernald), Showy tick trefoil (Desmodium candense (L.) DC.), Roundhead lespedeza (Lespedeza capitata Michx.), Slender lespedeza (Lespedeza virginica (L.) Britton), and Sensitive briar (Mimosa quadrivalvis var. nuttallii). Forbs were: Ashy sunflower (Helianthus mollis Lam.), Purple coneflower (Echinacea purpurea (L.) Moench), Plains coreopsis (Coreopsis palmate Nutt.), Maximimillian Sunflower (Helianthus maximiliani Schrad.), wild bergamot (Monarda fistulosa L.), and Oxeye sunflower (Heliopsis helianthoides (L.) Sweet).
Plots were established using a Hege plot drill during the fall of 2008. Broadleaf weeds were controlled with 2–4-D within the monoculture plots at full label rate. Monoculture grasses were fertilized with 36 kg (80 lbs) of nitrogen ha−1 rate according to soil test recommendations each year. Seeding rates were 50 seeds per 93 cm2. The study design consisted of four replicated blocks; thus, the design had four replications. Each plot within a block was 9.1m wide and 15m long. Each plot was divided into two subplots for the two cutting height treatments of 15 and 30 cm. Each of these subplots were completely harvested at the specified treatment height in March, July, and October. Total yield was determined by harvesting with a forage harvester constructed for the study. Dry weight of biomass for each harvested plot was determined by oven drying at 50 °C for a minimum of 3 days. Dry matter biomass yields for each year and treatment were analyzed using SAS 9.2 [42] PROC GLM MIXED to determine individual mixture, year, harvest time, and harvest height treatments on yields as described by Steel [43]. Regressions were analyzed to evaluate the effect of cutting time (month and month plus year) on yields and reported cutting time and yield relationships.

3. Results and Discussion

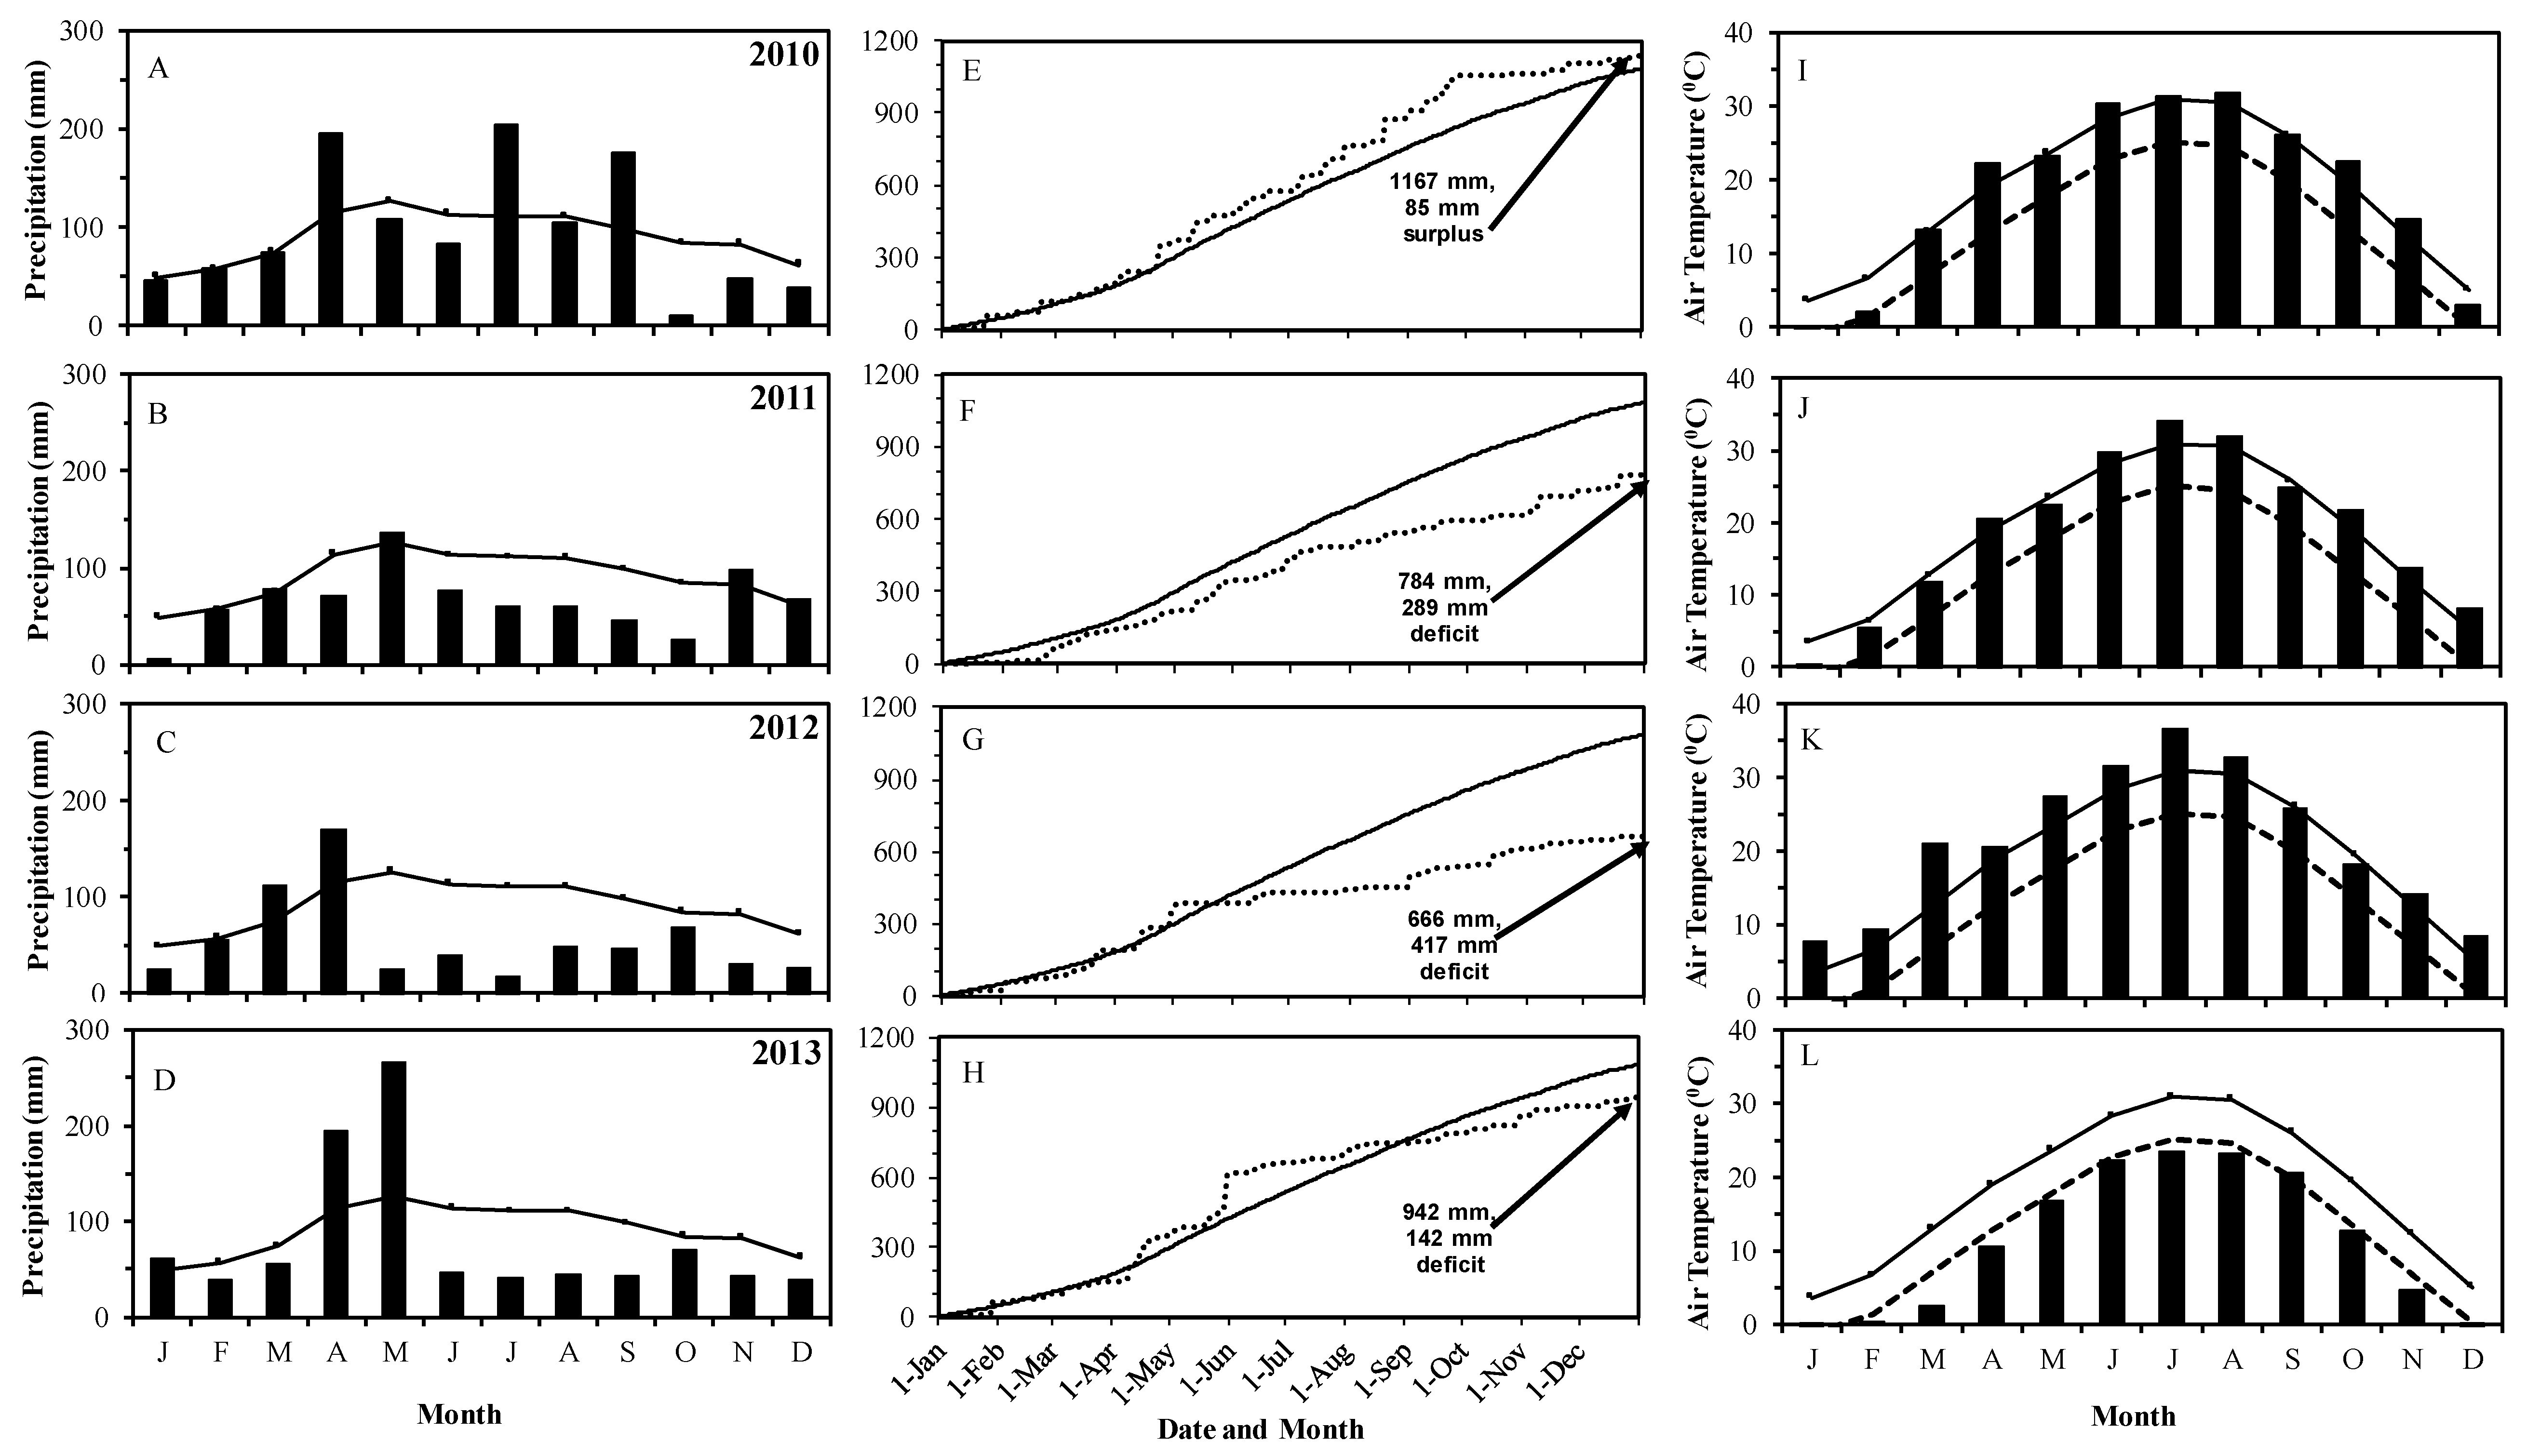
3.1. Rainfall and Temperature

Annual precipitation varied from the normal 30 y mean value of 1083 mm by 6%, −28%, −38%, and −13% for 2010, 2011, 2012, and 2013 (Figure 1, Table 1). Precipitation deviated by 15%, −33%, −36%, and −9% from the normal for 1 March to 31 October for 2010, 2011, 2012, and 2013. Rainfall amounts differed by 17%, −41%, −68%, and −60% from the long-term mean in those years during the most productive growth period of 1 June to 1 September. A normal year receives 335 mm of rain during the most productive growth period, compared to 393, 197, 106, and 133 mm during the study. In 2010, 2011, 2012, and 2013, rainfall amounts were below the long-term mean for 9, 10, 10, and 9 months. Among four years, 2012 was the driest and significant crop failures occurred in the county.
Monthly weather generally followed the long-term pattern until May in 2010 (Figure 1). July and September rainfall amounts were greater than the long-term monthly values. Sufficient rainfall during the first nine months of 2010 might have helped good growth of grass, better survival, and productive growth. However, three months (October, November, and December) of the year had amounts less than 50% of the long-term monthly values (Figure 1). The low rainfall in the last three months of 2010 and early 2011 may have influenced the soil moisture recharge and the plant growth in subsequent years.
Lower rainfall amounts in 2011, 2012, and 2013 caused large cumulative deficits within a year compared to the cumulative 30 year mean. The cumulative deficit was 289, 417, and 142 on December 31 of 2011, 2012, and 2013. The 2011 cumulative rainfall was below the normal for the entire year, while it was below normal from May to December in 2012. Rainfall in April and May of 2013 caused greater cumulative rainfall amounts than the long-term values. Lower rainfall amounts after June 2013 created a rainfall deficit during the last six months of 2013.
Maximum monthly temperature values were similar to 30 year monthly maximum values in 2010 (Figure 1). In 2011, monthly maximum values were above normal for March, May, June, July, October, November, and December. For 2012, only September and October had lower monthly maximum values than the 30 year monthly maximum values. Maximum March and July temperatures were 7 °C greater than the 30 year monthly maximum values. The last year of the study (2013) had favorable temperature conditions for plant growth (Figure 1).

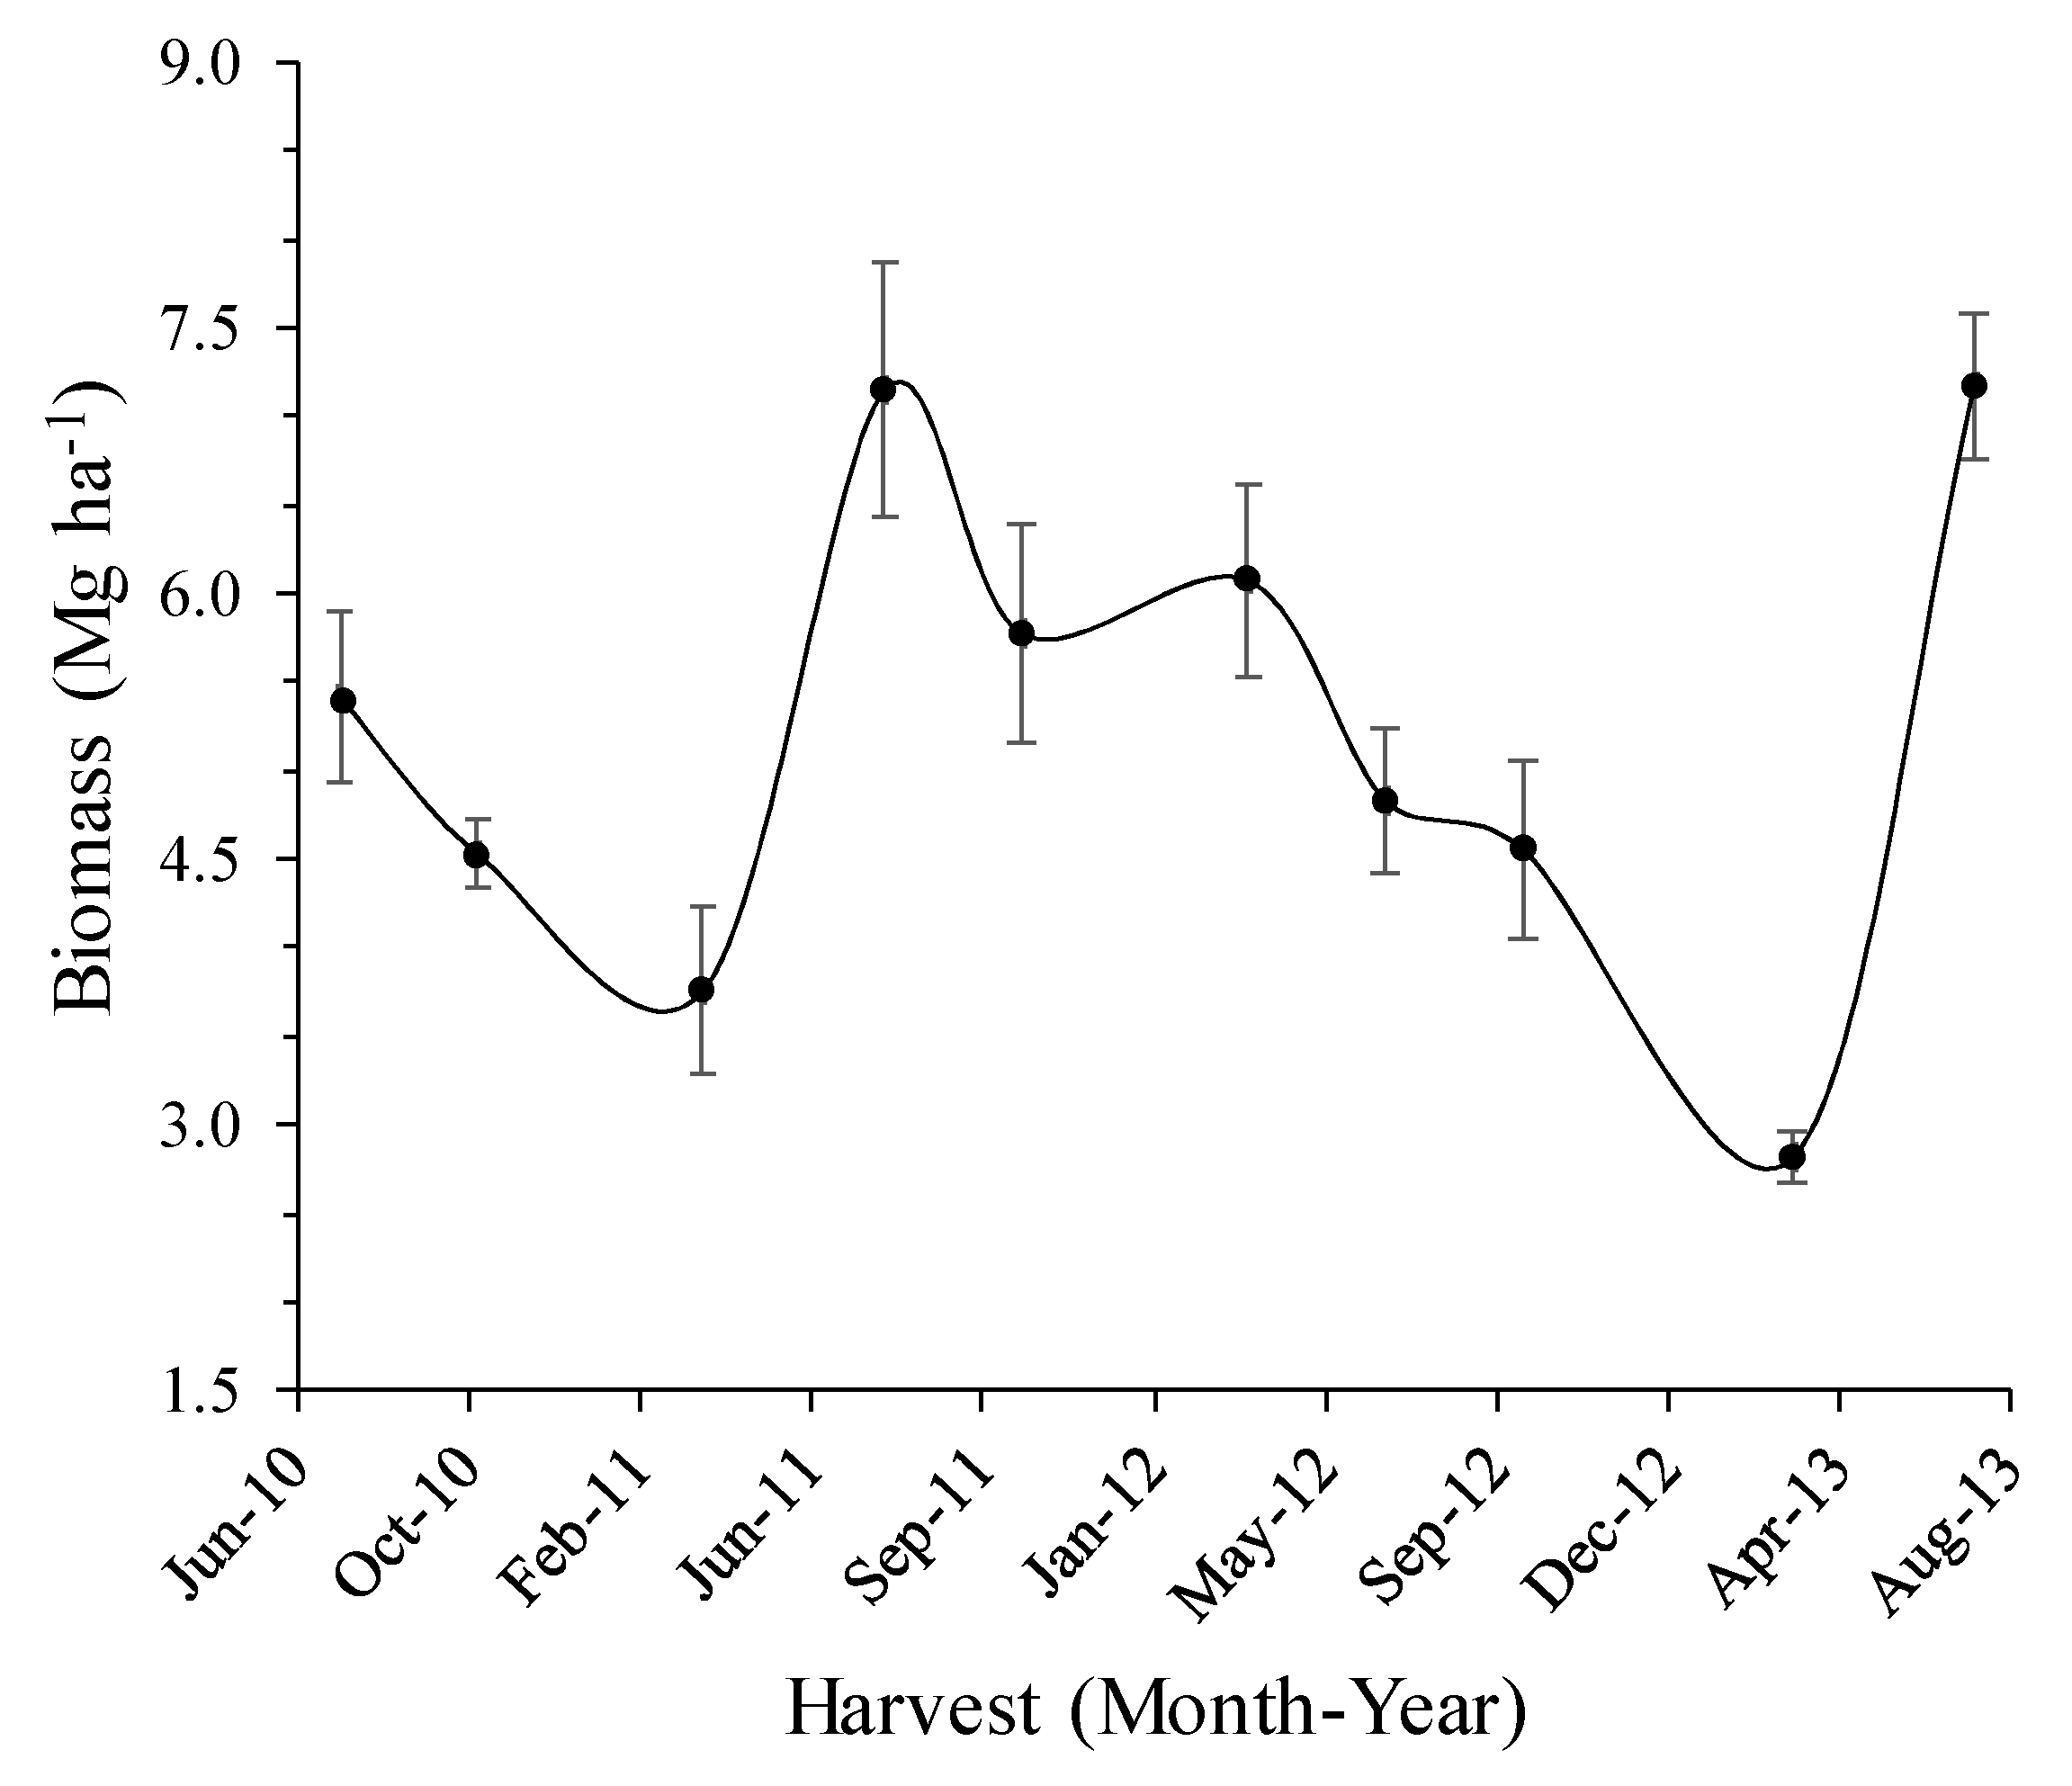
3.2. Biomass Yield and Weather

Annual mean yields during the study varied between 4.97 Mg ha−1 in 2010 to 5.56 Mg ha−1 in 2011. However, the lowest yield of 2.82 Mg ha−1 in March and the highest yield of 7.18 Mg ha−1 in July were observed in the same year, 2013 (Figure 2). Forage yields might have reflected the effects of growth responses during the early phase and the effects of weather. Our biomass yields were lower when compared with 10 Mg ha−1 harvested after three years [44]. These lower yields can be attributed to early phase of the experiment, dry weather conditions, and soil water deficit (Figure 1). In a metadata analysis Wullschleger [16] reported switchgrass yield ranging from 1 to 40 Mg ha−1, with the majority of data points within the 10–14 Mg ha−1 range. Our yields were within the ranges observed in other areas in the country.
Biomass yields fluctuated during the study period (Figure 2). Biomass yield decreased by 16% from the first harvest to the second harvest, and another 17% decrease occurred between the second and third harvests. The fourth harvest had the second largest (7.15 Mg ha−1) yield during the study, a 90% increase from the third harvest. Favorable growth conditions including above normal rainfall in 2010 and temperature conditions might have helped support plant growth before the fourth harvest (Figure 1). Similarly to our results, high precipitation and favorable temperatures produced 39 Mg ha−1 yields on switchgrass cultivar Alamo [16,45]. Dragoni [26] observed no yield differences in Arundo donax L. in single- and double-harvest systems in Italy over two years. However, biomass yields were lower in the second year for both harvest systems. Compared to our study, they had received sufficient rain during their study. In their study, the double-cut harvest had lower yield in the second harvest of the second year, while single-cut harvest had no substantial yield reduction. Biomass yields also varied by cutting time. The mean March yield was 69% of the July yield during the study. July yield was the highest with 6.14 Mg ha−1. October yield was 4.95 Mg ha−1, about 81% of the July yield. A regression using the cutting month as the independent variable and biomass yield as the dependent variable showed a nonsignificant (p = 0.191) linear relationship with a 0.37 coefficient of determination (r2). A regression model with year and month improved the r2 (0.45), although not significantly (p = 0.66).
Lower rainfall amounts and higher temperature conditions likely caused poor plant growth and lower yields after the fourth harvest of July 2011. The yield decline was 19% from the fourth to the fifth harvest. Subsequent forage yields were smaller than the previous yields for the next five harvests until March 2013 (Figure 2). March 2013 was the lowest yield during the 4 year study (2.82 Mg ha−1). Soil moisture deficit and above normal maximum temperatures likely affected the plant growth from July 2011 to March 2013 (Figure 1). Despite a 417 mm cumulative deficit by December 31 of 2012, the April–May precipitation and favorable temperature conditions in 2013 might have helped better plant growth and biomass yield thus increased to 7.18 Mg ha−1 in July 2013, a 155% increase from the March 2013 yield. Muir [46] observed that March to August rainfall in Stephenville, TX highly correlated with biomass yields. Similar to our results, in a 4-year study, Lee [47] correlated their biomass yields to April and May precipitation in South Dakota. The two yield increments, 3rd to 4th harvest and 9th to 10th harvest, suggested that rainfall was the main factor that controlled the biomass yields during the study. The surplus of 85 mm by December 2010 and the second surplus between March and May 2013 may have contributed to the recorded largest forage yields during the study.
Below normal rainfall and severe drought conditions significantly decreased biomass yields of all treatments. The yield increase in the fourth harvest (July 2011) can be attributed to early rain events in 2011 and favorable growth conditions. The reduction in yields in October 2011 could have been due to the lower rainfall and thus soil moisture limitations. Below normal rainfall during this growth period reduced yield. Severe drought, low soil moisture status, and extreme temperatures of 2012 reduced the subsequent yields in 2012. Similar to our results, Wullschleger [16] reported that biomass yield varied by temperature and rainfall. In their metadata analysis, biomass yield increased with increasing temperatures up to 14 °C and decreased. Sufficient rainfall during the growing season and favorable temperatures are critical factors for biomass yields [16,48,49,50]. Additionally, flexibility of harvesting can help to address weather patterns and bioenergy market for optimum benefits [51]. Other studies have shown that crop maturity negatively affected methane yields, while juvenile traits were detrimental for thermochemical processes but beneficial for anaerobic digestion [52,53,54].

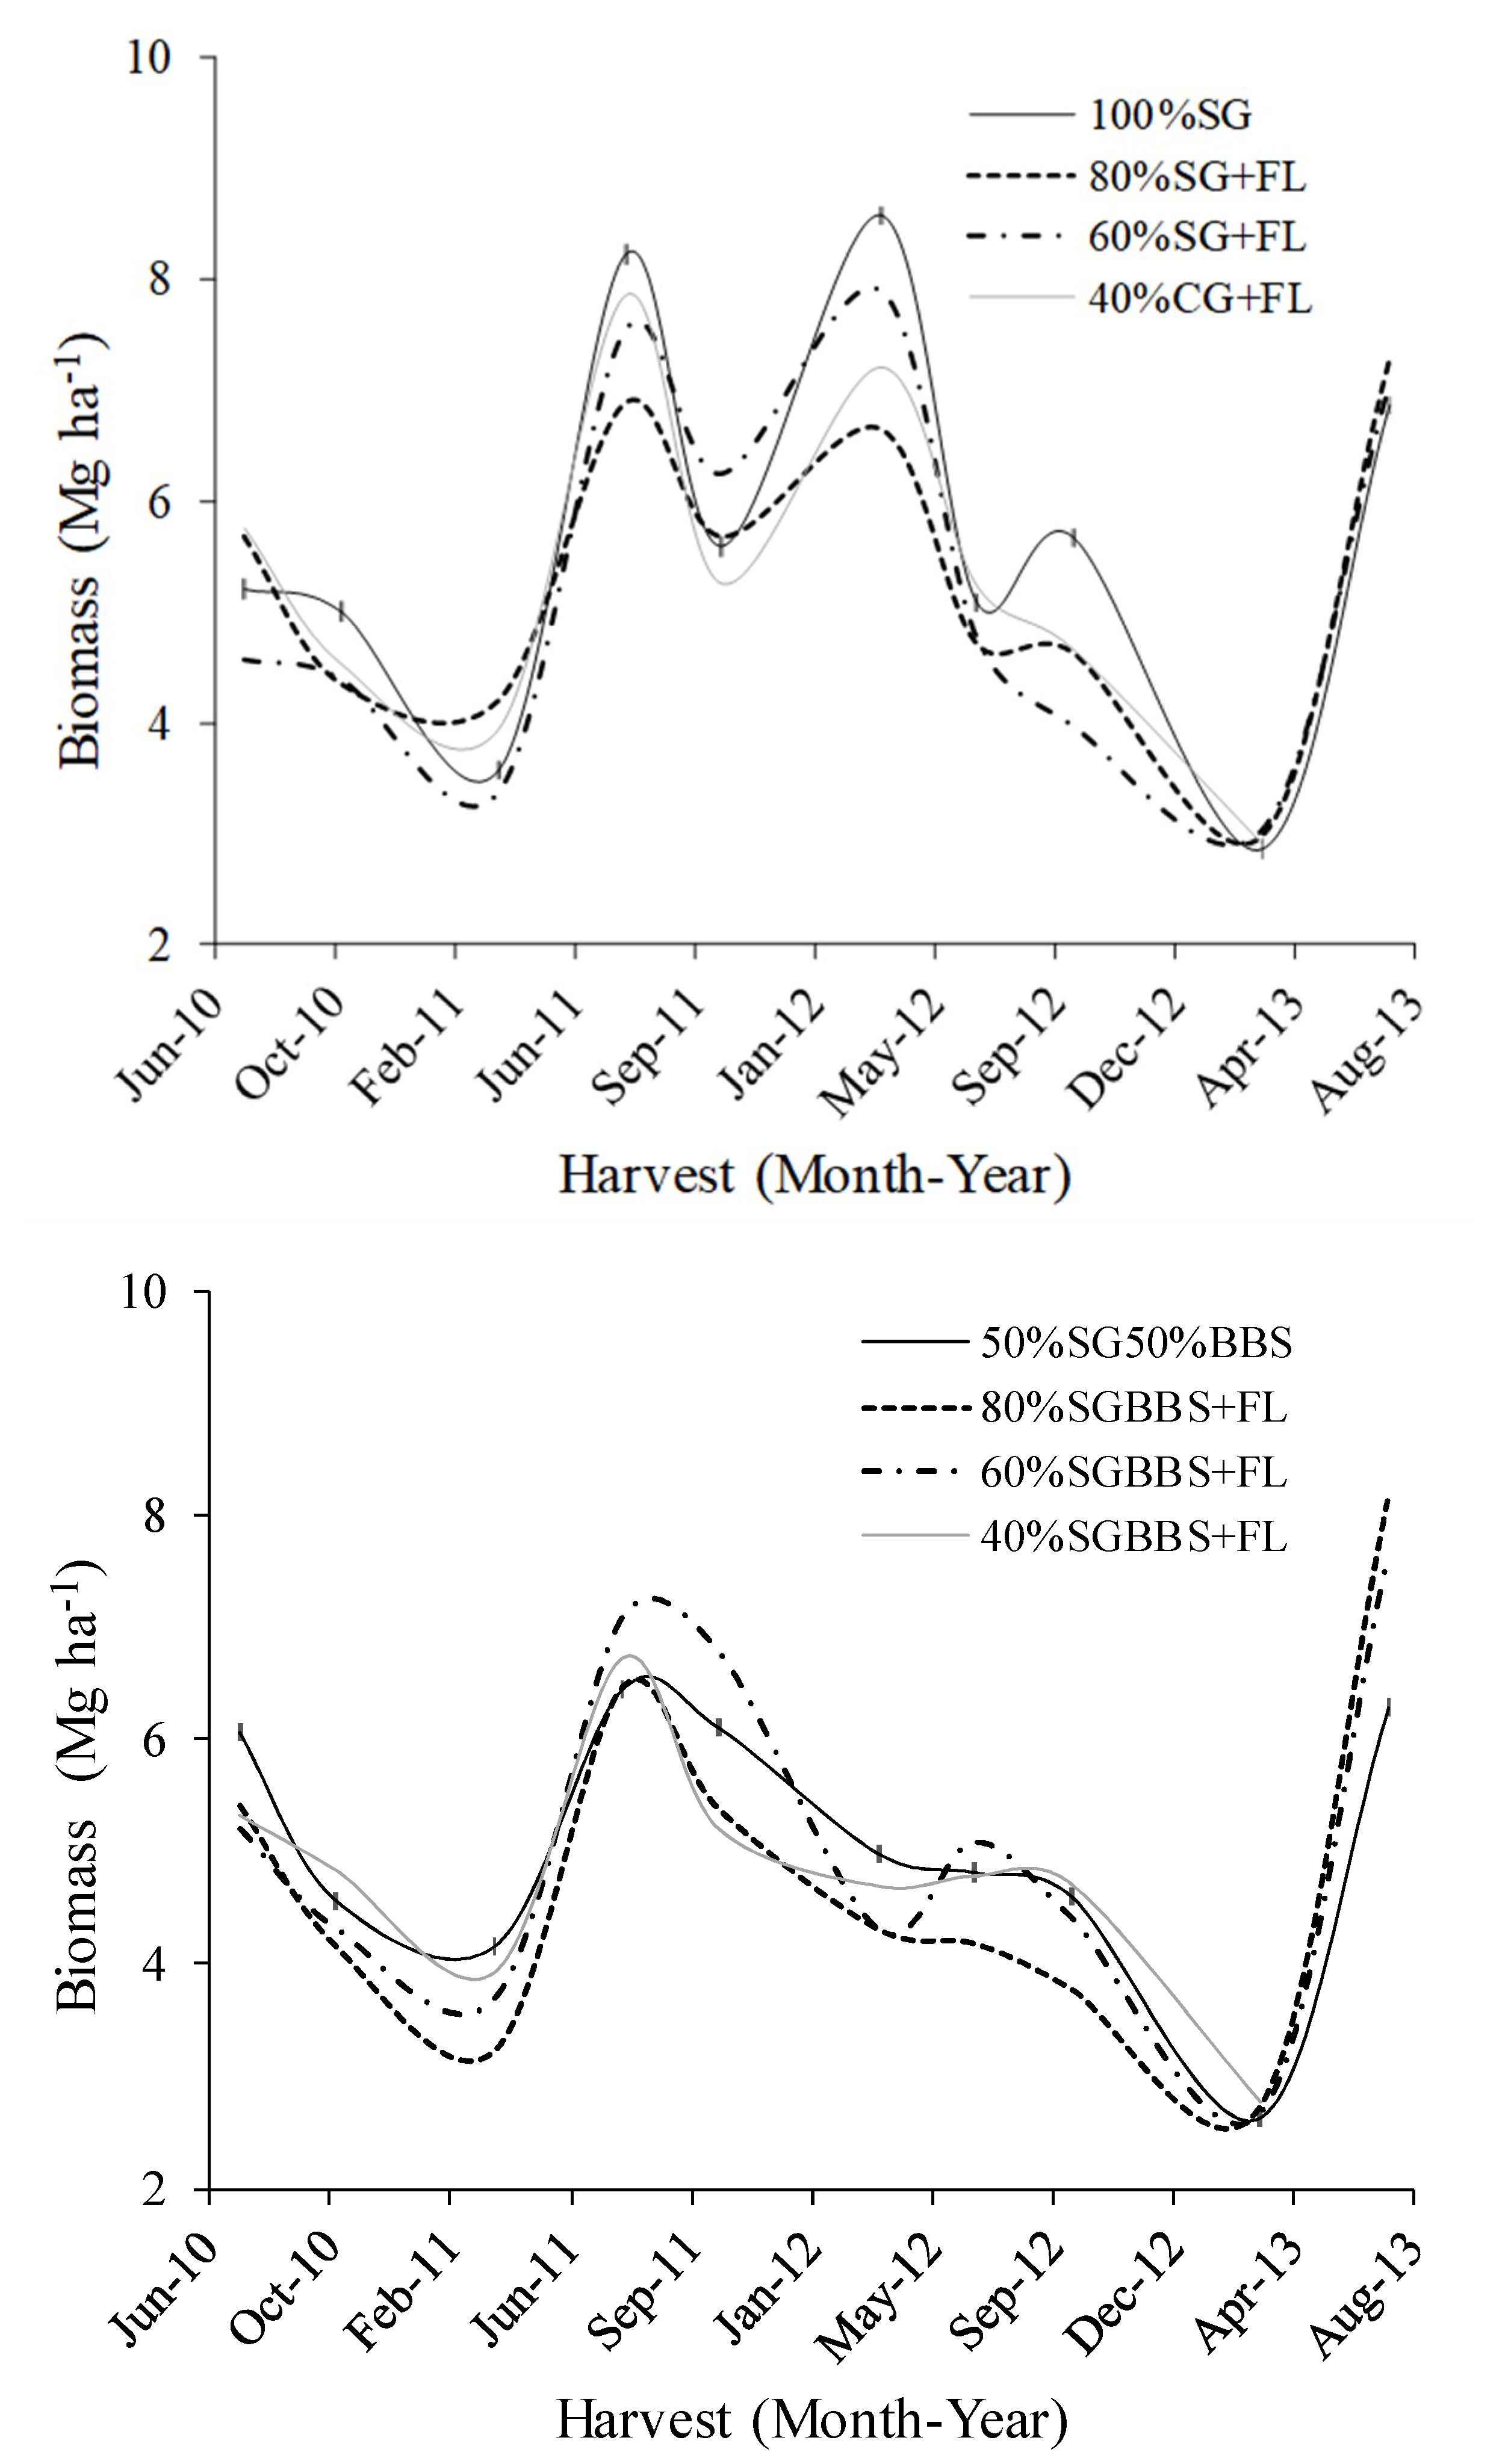
3.3. Mixture Composition and Yields

Our two main mixtures showed slightly different patterns of yield during the study (Figure 3). The SG mixtures had three prominent yield peaks, while the SGBBS mixtures had only two peaks. The first two mean peak yields were also larger for SG mixtures compared to SGBBS mixtures. This might indicate that SG responded better to favorable conditions compared to BBS. Similarly to our results, Jefferson [55] reported greater yield potential for SG across a latitudinal gradient compared to other species. However, the differences in yields among mixtures were not significant. Generally, all eight combinations followed the same pattern. The initial three harvests showed continuously declining yields. The fourth, sixth, and eighth yields were larger than the third, fourth, and seventh yields for most mixtures. The difference between mixtures were the smallest for 9th and 10th harvests. The 9th and 10th harvest occurred in 2013 after three years of growth. Species that were not suitable for the site and non-competitive species might have disappeared by this time and the yields would have come from the surviving few species. Each treatment may have been well established with surviving species during the fourth year. Figure 3 also shows variable yield differences among mixtures for the first three years of data collection, which supported this hypothesis, as those yields consisted of poorly performing species mixtures occupying the soil and space.
Many studies have reported increased biomass yields, and some with greater than 50% increases, with polycultures as compared to monocultures [5,17,56,57]. However, increased biomass yields with polyculture in long-term studies are inconclusive. Tilman [17] showed increased biomass yields with stand maturity for polycultures versus monocultures. In contrast, others have not observed similar increases in polyculture yields with stand maturity across various environments [58,59,60,61]. Our study in the Midwest of the USA was conducted during a time with below normal precipitation, a severe drought in 2012, and above normal temperature conditions. We cannot determine whether the differences in polyculture and monoculture were influenced by stand maturity or weather conditions. Studies that evaluate biomass yields for polycultures and monocultures on environmental gradients may be needed to determine site-suitable mixtures to meet the energy independence from biofuel, as data are lacking in the literature.

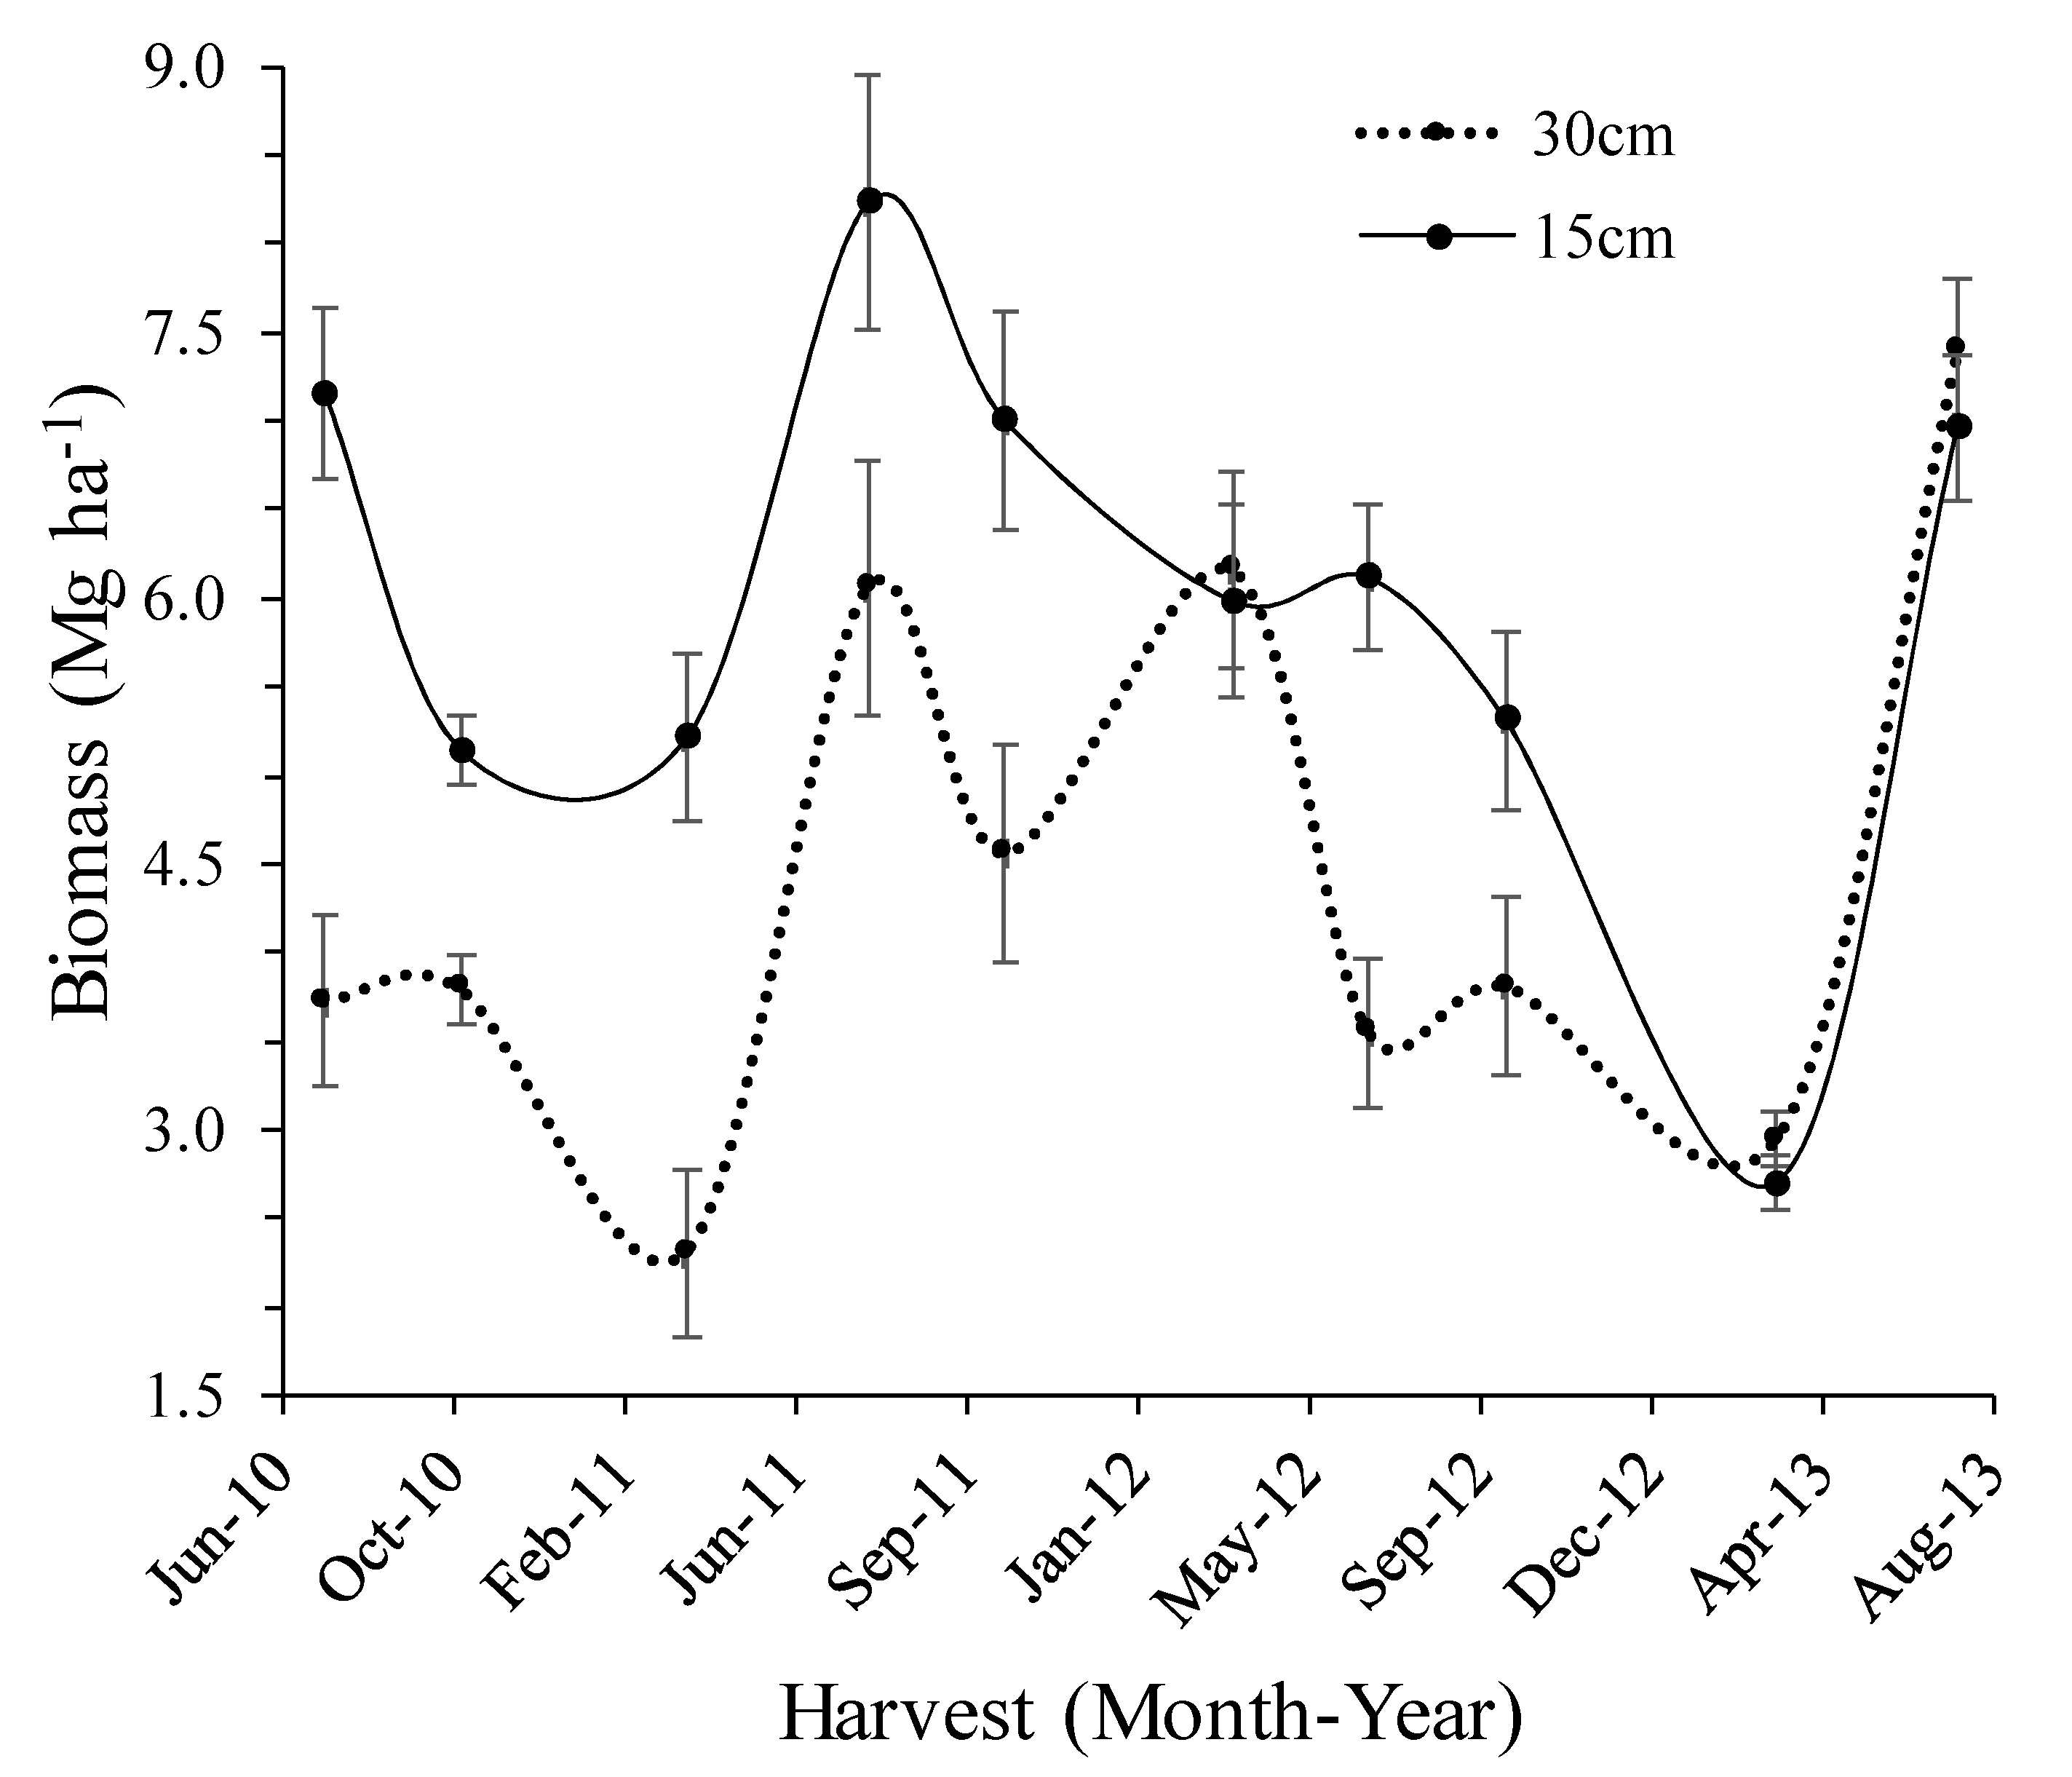
3.4. Cutting Height and Biomass Yield

The height of cutting had a significant effect on biomass yield (p < 0.0001; Figure 4). More biomass was harvested from the 15 cm cutting compared to the 30 cm cutting height. The 4 year means for the 15 cm and 30 cm height treatments were 5.98 and 4.43 Mg ha−1 for the study, respectively (Table 2). Similar differences were observed for yields by cutting heights within each year.
The difference between biomass yields for 15 cm and 30 cm cutting heights (15 cm yield minus 30 cm yield) varied between −0.44 Mg ha−1 for July 2013 and 2.91 Mg ha−1 in March 2011. Yield differences were much larger during the early phase of the study (Figure 4, Table 2). The yield difference within a harvest time was not significant for 3 (6th, 9th, and 10th) of the 10 harvests. The first harvest of 2012 and both March and July harvests of 2013 had slightly larger yields for the 30 cm cutting height than the 15 cm cutting height, although these differences were not significant.
The 15 cm cutting height treatment consistently produced greater yields in 2010 and 2011. Only two cutting heights in 2012 had greater yields for the 15 cm cutting height as compared to the 30 cm cutting height. The greatest yields for 15 cm (6.81 Mg ha−1) and 30 cm (5.17 Mg ha−1) cutting heights were observed in 2011 and 2013, respectively. For both cutting height treatments, similar yield increases were found for July 2013 harvest, with an average increase of 154% (158% and 152%), compared to the March 2013 yields. The 30 cm treatments showed the greatest increase, with a 163% increase between the March and October harvests in 2011.
The two cutting height treatments did not respond in the same fashion. In some years, it reduced the subsequent biomass yield. For example, biomass yields declined from October 2010 to March 2011, July 2011 to October 2011, March 2012 to July 2012, and October 2012 to March 2013 for the 30 cm height treatment (Table 2, Figure 3). These declines ranged from −23% to −42%. The 15 cm treatments showed yield declines for July 2010 to October 2010 and July 2011 to March 2013, with declines ranging from −13% to −49%. The 15 cm treatment recorded reduced yield for five times as compared to four times for the 30 cm treatment. Although overall yields were greater for the 15 cm treatment, the number of times with reduced yields was lower for the 30 cm treatment.
Food reserves and greater amount of biomass left in the field may have contributed to these differences. In a pruning height study, Tipu [62] found greater Leucaena leucocephala yields for higher cutting heights, with significantly greater number of branches, lengths of branches, and leaves per branch. A grazing study in Mongolia suggested taller cutting heights grazing land management, although initial yields were greater for shorter cutting heights [63]. These yield changes might indicate the effect of stored nutrients that can have an effect on subsequent growth of cutting height treatments. We cannot explain the mixture effects on resilience, as we did not estimate the mixture compositions in each year and at the end of the study.

3.5. Management Implications for Biomass Production

The effect of mixtures of the two main grass species combinations was unexpected, as there was no significant yield difference were observed between mixtures. However, the mixtures dominated by switchgrass had slightly more biomass production. Since the study did not evaluate the changes in mixture composition with time for a longer period (>10 years), we are unable to comment on reseeding frequency for the maintenance of a mixture.
The study highlighted the importance of cutting height. The 15 cm cutting height generated more biomass. However, during the last two harvests, the 15 and 30 cm cutting heights produced similar yields. This may suggest increased resilience and adaptability of the 15 cm cutting versus the 30 cm cutting. This study emphasized the importance of long-term evaluation of management, as the yields were almost identical in the fourth year. During the 4 year study period, rainfall was below normal in three years and temperatures were extremely high in two years. Weather factors influenced this 4 year study’s results.
Landowners may consider the establishment of biomass crops to avoid yield decreases near riparian buffers and to protect soils and water resources from erosion. Integration of economically valuable perennial species into biomass strips can help to generate additional income while improving soil, water, and wildlife habitats [64]. Biomass crop rows near the streams may also qualify for other conservation practices where landowners may minimize expenses and generate income.

4. Conclusions

In this 4 year plot study, we evaluated the biomass yields that resulted from the use of monocultures of native warm season grasses and varying mixtures of native forbs and legumes, with three cuttings conducted each year and at two cutting heights. Yields declined from the early cutting to subsequent cuttings in 2010 and 2012 when averaged across all mixtures, cutting times, and heights. In 2011 and 2013, yields increased from March to July, and declined in September for 2011. Whether or not mixtures were used was not significant, which indicates that the integration of native forbs and legumes with native warm-season grasses did not negatively influence biomass or forage production.
During this study, mid-Missouri experienced levels of annual precipitation that were well below the long-term mean, which influenced yield. However, results showed that mixtures of native warm-season grasses, forbs, and legumes are suitable for biomass production and forage crops in Missouri and can provide a source of forage during extreme summer drought conditions. This diversity of vegetation can also be managed to benefit a variety of wildlife in Missouri. Plots with varying ratios of mixtures generated acceptable yields compared with plots that utilized monocultures of native grasses and generally required fewer inputs, such as applications of nitrogen fertilizer, after initial seeding and establishment.
These results emphasize the importance of selecting site-suitable species for production, environmental, and economic benefits. Although cutting height was a major determinant of crop yields during the first three years after establishment, those differences disappeared during the last year of the study. Landowners who expect long-term benefits from these stands may have to sacrifice the initial forage yields that result from short cutting heights until the third or fourth year after establishment. However, landowners can optimize the value of using mixtures of native forbs and legumes with warm-season grasses by altering the timing of a harvest to take advantage of various markets, whether through cutting for biomass production in the late fall or spring or by haying or grazing for a livestock forage during the summer season. These are important considerations in managing a forage stand using native grasses with mixtures of forbs and legumes. The frequency of cutting and timing of harvests may help to adjust costs and income potential as well as optimize equipment availability.

Author Contributions

Investigation: R.P.U., C.J.G., T.M.R., R.A.P.II; Project Administration: T.M.R., R.A.P.II, W.W., R.L.W.; Methodology: T.M.R., R.A.P.II, W.W., R.L.W.; Formal analysis: R.P.U., C.J.G.; Original draft preparation: R.P.U., C.J.G.; Writing: R.P.U., C.J.G; Writing, reviewing, and editing: R.P.U., C.J.G., T.M.R., R.A.P.II, R.L.W. All authors have read and agreed to the published version of the manuscript.

Funding

This research was funded by NRCS Grant Number 0023235 NRCS 69-3A75-9-141Timothy Reinbott Titled “Demonstrating alternative methods of biofuel production to enhance farm profitability while improving wildlife habitat and soil and water conservation.”

Conflicts of Interest

The authors declare no conflict of interest.

References

  1. U.S. DOE (Department of Energy) 2009. Available online: http://www1.eere.energy.gov/biomass/biomass (accessed on 31 March 2017).
  2. Karp, A.; Shield, I. Bioenergy from plants and the sustainable yield challenge. New Phytol. 2008, 179, 15–32. [Google Scholar] [CrossRef]
  3. Zegada-Lizarazu, W.; Elbersen, H.W.; Cosentino, S.L.; Zatta, A.; Alexopoulou, E.; Monti, A. Agronomic aspects of future energy crops in Europe. Biofuels Bioprod. Bioref. 2010, 4, 674–691. [Google Scholar] [CrossRef]
  4. Soper, J.M.; Raynor, E.J.; Wienhold, C.; Schacht, W.H. Evaluating composition and conservation value of roadside plant communities in a grassland biome. Environ. Manag. 2019, 63, 789–803. [Google Scholar] [CrossRef] [PubMed]
  5. Tilman, D.; Hill, J.; Lehman, C. Carbon-negative biofuels from low-input high-diversity grassland biomass. Science 2006, 314, 1598–1600. [Google Scholar] [CrossRef] [PubMed] [Green Version]
  6. Tilman, D.; Socolow, R.; Foley, J.A.; Hill, J.; Larson, E.; Lynd, L.; Pacala, S.; Reilly, J.; Searchinger, T.; Somerville, C.; et al. Beneficial biofuels–The food, energy, environment trilemma. Science 2009, 325, 270–271. [Google Scholar] [CrossRef] [PubMed] [Green Version]
  7. Gelfand, I.; Sahajpal, R.; Zhang, X.; Izaurralde, R.C.; Gross, K.L.; Robertson, G.P. Sustainable bioenergy production from marginal lands in the, US Midwest. Nature 2013, 493, 514–517. [Google Scholar] [CrossRef]
  8. Nielson, R.L. Historical Corn Grain Yields for Indianan and the US 2012. Available online: https://www.agry.purdue.edu/ext/corn/news/timeless/yieldtrends.html (accessed on 1 June 2017).
  9. NASS.USDA.GOV. Available online: usda.nass.usda.gov/Charts_and_Maps/graphics/ 2017 (accessed on 10 August 2017).
  10. Bothast, R.J.; Schlicher, M.A. Biotechnological processes for conversion of corn into ethanol. Appl. Microbiol. Biotechnol. 2005, 67, 19–25. [Google Scholar] [CrossRef]
  11. Heaton, E.A.; Dohleman, F.G.; Long, S.P. Meeting US biofuel goals with less land: The potential of Miscanthus. Glob. Chang. Biol. 2008, 14, 2000–2014. [Google Scholar] [CrossRef]
  12. Wright, L.; Turhollow, A. Switchgrass selection as a “model “bioenergy crop: A history of the process. Biomass Bioenergy 2010, 34, 851–868. [Google Scholar] [CrossRef]
  13. Adler, P.R.; Sanderson, M.A.; Boateng, A.A.; Weimer, P.J.; Jung, H.J.G. Biomass yield and biofuel quality of switchgrass harvested in fall or spring. Agron. J. 2006, 98, 1518–1525. [Google Scholar] [CrossRef] [Green Version]
  14. Gunderson, C.A.; Davis, E.B.; Jager, H.I.; West, T.O.; Perlack, R.D.; Brandt, C.C.; Wullschleger, S.D.; Baskaran, L.M.; Wilkerson, E.G.; Downing, M.E. Exploring Potential, US Switchgrass Production for Lignocellulosic Ethanol. 2008 Technical Manuscript ORNL/TM-2007/183. Available online: http://bioenergy.ornl.gov (accessed on 1 April 2016).
  15. Vogel, K.P.; Mitchell, R.B. Heterosis in switchgrass: Biomass yield in swards. Crop Sci. 2008, 48, 2159–2164. [Google Scholar] [CrossRef] [Green Version]
  16. Wullschleger, W.S.; Davis, E.B.; Borsuk, M.E.; Gunderson, C.A.; Lynd, L.R. Biomass production in switchgrass across the united states: Database description and determinants of yield. Agron. J. 2010, 102, 1158–1168. [Google Scholar] [CrossRef] [Green Version]
  17. Tilman, D.; Reich, P.B.; Knops, J.M.H. Biodiversity and ecosystem stability in a decade-long grassland experiment. Nature 2006, 441, 629–632. [Google Scholar] [CrossRef] [PubMed]
  18. Jungers, J.M.; Clark, A.T.; Betts, K.; Mangan, M.E.; Sheaffer, C.C.; Wyse, D.L. Long-term biomass yield and species composition in native perennial bioenergy cropping systems. Agron. J. 2015, 107, 1627–1640. [Google Scholar] [CrossRef]
  19. Meehan, T.D.; Hurlbert, A.H.; Gratton, C. Bird communities in future bioenergy landscapes of the Upper Midwest. Proc. Natl. Acad. Sci. USA 2010, 107, 18533–18538. [Google Scholar] [CrossRef] [Green Version]
  20. Pierce, R.A., II; Reinbott, T.; Wright, R.; White, B.; Potter, L. Establishing and Managing Early Successional Habitats for Wildlife on Agricultural Lands; MU Extension Publication MP: Missouri, MO, USA, 2010; Volume 907, p. 20. [Google Scholar]
  21. McNaughton, S.J. Ecology of grazing ecosystem: The Serengeti. Ecol. Monogr. 1985, 55, 259–294. [Google Scholar] [CrossRef]
  22. Burkepile, D.E. Comparing aquatic and terrestrial grazing ecosystems: Is the grass really green? Oikos 2013, 122, 306–312. [Google Scholar] [CrossRef]
  23. Gardiner, M.A.; Tuell, J.K.; Isaacs, R.; Gibbs, J.; Ascher, J.S.; Landis, D.A. Implications of three biofuel crops for beneficial arthropods in agricultural landscapes. Bioenergy Res. 2010. [Google Scholar] [CrossRef] [Green Version]
  24. Haaland, C.; Naisbit, R.E.; Bersier, L.F. Sown wildflower strips for insect conservation: A review. Insect Conserv. Divers. 2011, 4, 60–80. [Google Scholar] [CrossRef]
  25. Packard, S.; Mutel, C.F. (Eds.) The Tallgrass Restoration Handbook: For Prairies, Savannas, and Woodlands; Society for Ecological Restoration; Island Press: Washington, DC, USA, 1997; p. 463. [Google Scholar]
  26. Dragoni, F.; Nasso, N.N.; O Di Tozzini, C.; Bonari, E.; Ragaglini, G. Aboveground yield and biomass quality of giant reed (arundo donax l.) as affected by harvest time and frequency. Bioenergy Res. 2015, 8, 1321–1331. [Google Scholar] [CrossRef] [Green Version]
  27. Hao, X.; Thelen, K.; Gao, J. Spatial variability in biomass yield of switchgrass, native prairie, and corn at field scale. Agron. J. 2016, 108, 548–558. [Google Scholar] [CrossRef]
  28. Schmer, M.R.; Mitchell, R.B.; Bogel, K.P.; Schacht, W.H.; Marx, D.B. Spatial and temporal effects on switchgrass stands and yield in the Great Plains. Bioenergy Res. 2010, 3, 159–171. [Google Scholar] [CrossRef] [Green Version]
  29. Thelemann, R.; Johnson, G.; Sheaffer, C.; Banerjee, S.; Cai, H.; Wyse, D. The effect of landscape position on biomass crop yield. Agron. J. 2010, 102, 513–522. [Google Scholar] [CrossRef] [Green Version]
  30. Wilson, D.M.; Heaton, E.A.; Schulte, L.A.; Gunther, T.P.; Shea, M.E.; Hall, R.B.; Headlee, W.L.; Moore, W.L.; Boersma, N.N. Establishment and short-term productivity of annual and perennial bioenergy crops across a landscape gradient. Bioenergy Res. 2014, 7, 885–898. [Google Scholar] [CrossRef]
  31. Lewandowski, I.; Heinz, A. Delayed harvest of miscanthus—Influences on biomass quantity and quality and environmental impacts of energy production. Eur. J. Agron. 2003, 19, 45–63. [Google Scholar] [CrossRef]
  32. Tahir, M.H.N.; Casler, M.D.; Moore, K.J.; Brummer, E.C. Biomass yield and quality of reed canarygrass under five harvest management systems for bioenergy production. Bioenergy Res. 2011, 4, 111–119. [Google Scholar] [CrossRef]
  33. Kering, M.K.; Butler, T.J.; Biermacher, J.T.; Guretzky, J.A. Biomass yield and nutrient removal rates of perennial grasses under nitrogen fertilization. Bioenergy Res. 2012, 5, 61–70. [Google Scholar] [CrossRef]
  34. Vogel, K.P.; Brejda, J.J.; Walters, D.T.; Buxton, D.R. Switchgrass biomass production in the Midwest, USA: Harvest and nitrogen management. Agon. J. 2002, 94, 413–420. [Google Scholar] [CrossRef]
  35. Monti, A.; Zegada-Lizarazu1, W. Sixteen-year biomass yield and soil carbon storage of giant reed (Arundo donax L.) grown under variable nitrogen fertilization rates. Bioenergy Res. 2016, 9, 248–256. [Google Scholar] [CrossRef]
  36. Angelini, L.G.; Ceccarini, L.; Bonari, E. Biomass yield and energy balance of giant reed (Arundo donax L.) cropped in central Italy as related to different management practices. Eur. J. Agron. 2005, 22, 375–389. [Google Scholar] [CrossRef]
  37. Yang, Z.; Shen, Z.; Tetreault, H.; Johnson, L.; Friebe, B.; Frazier, T.; Huang, L.; Burklew, C.; Zhang, X.; Zhao, B. Production of autopolyploid lowland switchgrass lines through in vitro chromosome doubling. Bioenergy Res. 2014, 7, 232–242. [Google Scholar] [CrossRef] [Green Version]
  38. Johnson, L.C.; Olsen, J.T.; Tetreault, H.; DeLaCruz, A.; Bryant, J.; Morgan, T.J.; Knapp, M.; Bello, N.M.; Baer, S.G.; Maricle, B.R. Intraspecific variation of a dominant grass and local adaptation in reciprocal garden communities along a, US Great Plains’ precipitation gradient: Implications for grassland restoration with climate change. Evol. Appl. 2015, 8, 705–723. [Google Scholar] [CrossRef] [Green Version]
  39. Anderson, S.H. Claypan and its Environmental Effects. In Encyclopedia of Agrophysics; Encyclopedia of Earth Sciences Series; Gliński, J., Horabik, J., Lipiec, J., Eds.; Springer: Dordrecht, The Netherlands, 2011. [Google Scholar]
  40. USDA NRCS 2016. Available online: https://www.nrcs.usda.gov/wps/portal/nrcs/detail/mo/plantsanimals/?cid=stelprdb1083060 (accessed on 10 June 2018).
  41. Sudkamp, S.; Chapman, R.; Pierce, R.A., II. Quail Friendly Plants of the Midwest; University of Missouri Extension MP: Missouri, MO, USA, 2008; Volume 903, p. 121. [Google Scholar]
  42. SAS. SAS User’s Guide, Statistics; Version 5; SAS Institute: Cary, NC, USA, 2010. [Google Scholar]
  43. Steel, R.G.D.; Torrie, J.H.; Dickey, D.A. Principles and Procedures of Statistics: A Biometrical Approach; Mcgraw Hill Series in Probability and Statistics; Mcgraw Hill: New York, NY, USA, 1997; p. 672. [Google Scholar]
  44. Heaton, E.; Voigt, T.; Long, S.P. A quantitative review of comparing the yields of two candidate C-4 perennial biomass crops in relation to nitrogen, temperature and water. Biomass Bioenergy 2004, 27, 21–30. [Google Scholar] [CrossRef]
  45. Kiniry, J.R.; Tischler, C.R.; van Esbroeck, G.A. Radiation use efficiency and leaf, CO2 exchange for diverse C4 grasses. Biomass Bioenergy 1999, 17, 95–112. [Google Scholar] [CrossRef]
  46. Muir, J.P.; Sanderson, M.A.; Ocumpaugh, W.R.; Jones, R.M.; Reed, R.L. Biomass production of Alamo switchgrass in response to nitrogen, phosphorus, and row spacing. Agron. J. 2001, 93, 896–901. [Google Scholar] [CrossRef]
  47. Lee, D.K.; Boe, A. Biomass production of switchgrass in central South Dakota. Crop Sci. 2005, 45, 2583–2590. [Google Scholar] [CrossRef]
  48. Sanderson, M.A.; Reed, R.L.; Ocumpaugh, W.R.; Hussey, M.A.; Van Esbroeck, G.; Read, J.C.; Tischler, C.R.; Hons, F.M. Switchgrass cultivars and germplasm for biomass feedstock production in Texas. Bioresour. Technol. 1999, 67, 209–219. [Google Scholar] [CrossRef]
  49. Berdahl, J.D.; Frank, A.B.; Krupinsky, J.M.; Carr, P.M.; Hanson, J.D.; Johnson, H.A. Biomass yield, phenology and survival of diverse cultivars and experimental strains in western North Dakota. Agron. J. 2005, 97, 549–555. [Google Scholar] [CrossRef] [Green Version]
  50. Parrish, D.J.; Fike, J.H. The biology and agronomy of switchgrass for biofuels. Crit. Rev. Plant. Sci. 2005, 24, 423–459. [Google Scholar] [CrossRef]
  51. Monti, A.; Bezzi, G.; Pritoni, G.; Venturi, G. Long-term productivity of lowland and upland switchgrass cytotypes as affected by cutting frequency. Bioresour. Technol. 2008, 99, 7425–7432. [Google Scholar] [CrossRef]
  52. Nizami, A.S.; Korres, N.E.; Murphy, J.D. Review of the integrated process for the production of grass biomethane. Environ. Sci. Technol. 2009, 43, 8496–8508. [Google Scholar] [CrossRef] [PubMed]
  53. Prochnow, A.; Heiermann, M.; Plöchl, M.; Linke, B.; Idler, C.; Amon, T.; Hobbs, P.J. Bioenergy from permanent grassland—A review: 1. Biogas. Bioresour. Technol. 2009, 100, 4931–4944. [Google Scholar] [CrossRef] [PubMed]
  54. Prochnow, A.; Heiermann, M.; Plöchl, M.; Amon, T.; Hobbs, P.J. Bioenergy from permanent grassland—A review: 2. Combustion. Bioresour. Technol. 2009, 100, 4945–4954. [Google Scholar] [CrossRef] [PubMed]
  55. Jefferson, P.G.; McCaughey, W.P. Switchgrass (Panicum virgatum L.) cultivar adaptation, biomass production, and cellulose concentration as affected by latitude of origin. ISRN Agron. 2012, 2012, 763046. [Google Scholar] [CrossRef] [Green Version]
  56. Khalsa, J.; Fricke, T.; Weisser, W.W.; Weigelt, A.; Wachendorf, M. Effects of functional groups and species richness on biomass constituents relevant for combustion: Results from a grassland diversity experiment. Grass Forage Sci. 2012, 67, 569–588. [Google Scholar] [CrossRef]
  57. Jungers, J.M.; Sheaffer, C.C.; Lamb, J.A. The effect of nitrogen, phosphorus, and potassium fertilizers on prairie biomass yield, ethanol yield, and nutrient harvest. Bioenergy Res. 2015, 8, 279–291. [Google Scholar] [CrossRef]
  58. Cardinale, B.J.; Nelson, K.; Palmer, M.A. Linking species diversity to the functioning of ecosystems: On the importance of environmental context. Oikos 2000, 91, 175–183. [Google Scholar] [CrossRef] [Green Version]
  59. Adler, P.R.; Sanderson, M.A.; Weimer, P.J.; Vogel, K.P. Plant species composition and biofuel yields of conservation grasslands. Ecol. Appl. 2009, 19, 2202–2209. [Google Scholar] [CrossRef] [Green Version]
  60. Johnson, M.V.; Kiniry, J.R.; Sanchez, H.; Polley, H.W.; Fay, P.A. Comparing biomass yields of low-input high-diversity communities with managed monocultures across the central United States. Bioenergy Res. 2010, 3, 353–361. [Google Scholar] [CrossRef] [Green Version]
  61. Griffith, A.P.; Epplin, F.M.; Fuhlendorf, S.D.; Gillen, R. A comparison of perennial polycultures and monocultures for producing biomass for biorefinery feedstock. Agron. J. 2011, 103, 617–627. [Google Scholar] [CrossRef] [Green Version]
  62. Tipu, S.U.; Hossain, K.L.; Islam, M.O.; Hossain, M.A. Effect of pruning height on shoot biomass yield of Leucaena leucocephala. Asian J. Plant Sci. 2006, 5, 1043–1046. [Google Scholar]
  63. Baatar, B.; Svavarsdóttir, K.; Aradóttir, Á.L.; Ægisdóttir, H.H. Effects of Cutting Height and Frequency on Yield in a Mongolian Rangeland; Land Restoration Training Programme: Reykjavík, Iceland, 2008. [Google Scholar]
  64. Schulte, L.A.; Niemi, J.; Helmers, M.J.; Liebman, M.; Arbuckle, J.D.; James, D.E.; Kolka, R.K.; O’Neal, M.E.; Tomer, M.D.; Tyndall, J.C.; et al. Prairie strips improve corn–soybean croplands. Proc. Natl. Acad. Sci. USA 2017, 114, 11247–11252. [Google Scholar] [CrossRef] [PubMed] [Green Version]
Figure 1. Monthly rainfall distribution (bars) and monthly 30 year mean (line) for 2010, 2011, 2012, and 2013 (AD); cumulative long-term and annual cumulative rainfall for 2010, 2011, 2012, and 2013 (EH); and monthly maximum temperature (bars), monthly 30 year maximum (black line) and monthly 30 year mean (broken line) for 2010, 2011, 2012, and 2013 (IL) at Bradford Research Center, University of Missouri.
Agriculture 10 00075 g001
Figure 2. Distribution of mean biomass yields for the eight mixture treatments for 2010, 2011, 2012, and 2013 by harvest time at the Bradford Research Center of University of Missouri, Columbia, Missouri, USA.
Agriculture 10 00075 g002
Figure 3. Distribution of mean biomass yields for the eight mixture treatments (100% switchgrass (SG), 80% SG with forbs and legumes, 60% SG with forbs and legumes, 20% SG with forbs and legumes, 50% SG with 50% big blue stem (BBS), 80% SGBBS with forbs and legumes, 60% SGBBS with forbs and legumes, 20% SGBBS with forbs and legumes) for 2010, 2011, 2012, and 2013 at the Bradford Research Center of University of Missouri, Columbia, Missouri, USA.
Agriculture 10 00075 g003
Figure 4. Distribution of mean biomass yields for 15 cm and 30 cm cutting height treatments for 2010, 2011, 2012, and 2013 at the Bradford Research Center of University of Missouri, Columbia, Missouri, USA.
Agriculture 10 00075 g004
Table 1. Annual, 1 March to 31 October, and 1 June to 1 September rainfall amounts and deviations from the long-term means during the study period at the Bradford Research Center, University of Missouri, USA.
Rainfall Category Long-Term2010201120122013
Annual (mm)10831149784666942
Percent deviation from the normal precipitation 6−28−38−13
1 March to 31 October (mm)832959554529760
Percent deviation from the normal precipitation 15−33−36−9
1 June to 1 September (mm)335393197106133
Percent deviation from the normal precipitation 17−41−68−60
Table 2. Biomass yields by harvest time, change (as a percentage of previous harvest), annual mean for 15 cm and 30 cm cutting treatments at the Bradford Research Center, University of Missouri, Columbia, Missouri, USA.
Harvest15 cm30 cm
Harvest TimeNumberYieldChangeAnnualYieldChangeAnnual
Mg ha−1%Mg ha−1Mg ha−1%Mg ha−1
July 201017.16 3.72
October 201025.14−286.153.7923.76
March 201135.211 2.30−39
July 201148.2358 6.06163
October 201157.00−156.814.56−254.31
March 201265.99−14 6.1635
July 201276.122 3.54−42
October 201285.31−135.803.8174.5
March 201392.70−49 2.94−23
July 2013106.961584.837.401525.17
Study period 5.98 4.43

