Abstract
Cotton is an essential commercial crop. Unfortunately, this crop is affected by many pests and diseases, which can cause considerable loss in yield. Climate has a strong correlation with the occurrence of pests and diseases in crops. Currently, weather forecasting services are available to the farmers, which help with weather-based planning of farm operations. Still, weather-based pest and disease forewarning services are not available to all the farmers. Unfortunately, cotton cultivation consumes about one-third of total pesticide consumption, which increases the cost of production apart from polluting the environment. An information and communication technology (ICT) based intelligent pest and disease forewarning system for cotton is an innovative system for providing forewarning on pests and diseases. It aims at improving farm productivity through better crop management. In this paper, the proposed method aims to predict the occurrence of pests and diseases based on microclimatic parameters. This pest and disease forewarning information and appropriate crop management practices will be disseminated to the farmers using electronic media through short message service (SMS), the Internet, etc. In this way, both livelihood security and environmental security are achieved. The proposed model shows a higher optimal performance then the two related works in terms of the average root mean square error rate, average accuracy rate, average percentage error rate, and prediction accuracy.
1. Introduction
Agriculture is primarily dependent on the weather. Often a strong correlation exists between climate and the occurrence of pests and diseases in the crop. To find out what this correlation is, the continuous monitoring of pests and disease incidence at regular intervals is essential. If this correlation is known, forewarning on the incidence of pests and diseases with anticipated weather considers can be done [1]. At present, the India Meteorological Department prepares an agrometeorological advisory bulletin twice a week and disseminates it to the farming community.
For this research, we are considering the pest and diseases of cotton crops. Cultivation of cotton provides livelihood to more than 42 million people in India. In cotton, pests and diseases cause vast losses, and these losses are aggravated by unfavorable soil and climatic conditions. At present, the economic loss in a cotton yield ranges from 5% to 15% due to pests and diseases [2]. If no prevention and control measures are taken, the loss may shoot up to 50%. Farmers rely on the heavy use of insecticides to control these pests, but this can cause pesticide residue problems.
As per a report by the Cotton Corporation of India [3], the total area for growing cotton in India represented 27% of the global scope of cotton in 2001–2002, but production was only 12% of the worldwide total. Technology-based precise farming paved the way to achieve this to 32% of the world production. The growing area for cotton was reported to have increased from 10.8296 million ha to 12.5 million ha in 2016–2019, but the production rate decreased from 34.5 million bales to 33 million bales in 2018–2019. To address this issue, information communication technology (ICT) proliferation can be used in a better way to enhance the production level.
The major impediments to achieving higher productivity in tropical and subtropical agriculture are the severe damage caused by pests, diseases, and weeds [4]. The loss estimated in India was about 200,000 million Indian rupees (INR) every year. Leafhopper, i.e., Amrasca devastans, is a critical pest of cotton in southern Tamilnadu, and the loss accounted for 390 kg ha−1 [5,6]. The use of synthetic pesticides in India has increased steadily because of the spreading use of new high yielding varieties and their greater vulnerability to pests and diseases [7]. Synthetic pesticides sale jumped from 8000 tons to 85,000 tons. In 1960, only about 6 million hectares received chemical pesticides, but by the early 1990s, around 100 million hectares were being treated [8].
The best way to avoid pest outbreaks is to curb the pests before they get a foothold in the crop field. Pest forewarning is possible only if the pleasant weather conditions for insect infestation are fully known [9]. Recent integrated pest management [10,11] studies suggest that weather conditions play a critical role in pest and disease outbreaks. A sound pest and disease surveillance system is essential for integrated pest management (IPM) in cotton so that timely plant protection measures can be launched on a need basis to reduce the cost of cultivation and avoid contamination of the ecosystem.
Machine learning algorithms [12,13] have been adopted to predict pests and diseases. A deep residual network in [14] was developed to categorize significant pests that affect cotton crop yield. Forecasting models are treated as an essential module of the pest and disease management process. Management practices need to be timed to coincide with phases in the pathogen life cycle [15]. An agriculture framework was developed for highlighting the relationship among the pests and disease occurrence and weather parameters using IoT devices and unmanned aerial vehicles [16]. This framework was built using image processing techniques, linear regression, and a Bayesian network.
The following research gaps in pest and disease forewarning are identified from the extensive literature survey, which need to be adequately addressed in order to expect precise results.
- Few pests and diseases forecast models have been developed, and the existing ones have poor predictabilities.
- Sensor technology has not been fully explored in disease prediction.
- Very few intelligent diseases forecast models have been developed based on microclimate influence.
- The available location-specific information on weather-related pest and disease incidence in rain fed crops is scanty, scattered, and inadequate.
- The current forecast information does not reach the farmers in time.
Hence, this work is proposed to collect information on microclimate conditions and pests and diseases that help to develop a microclimate-based pest and disease prediction system for cotton crop. We also test the performance efficiency of the proposed work.
2. Materials and Methods
2.1. Material Used for Cotton Cultivation
We used a 2000 square meter farm field for experimentation. In the farm field, we cultivated cotton crop during the cropping season rabi (September to February) in 2017–2019. The following materials were used for cotton cultivation [17]. SVPR 2 variety cotton seed, vermicompost, azospirillum, phosphobacteria, Azophost, and farmyard manure were used to prepare the farm field. Ridges and furrows were made 10 m in length with appropriate spacing. Acid delinting was performed on the cotton seeds using sulphuric acid. Trichoderma viride, carbendazim, biocontrol agents, and pungam leaf extract were used in the pretreatment and hardening of the seeds. For fertilizers, we used nitrogen, phosphorus, and potassium (NPK) fertilizers with a micronutrient mixture. Pendimethalin was used for weed management. To prevent early buds and squares, napthalene acetic acid was used.
2.1.1. Technology Used
The notable core areas of computer science such as wireless sensor networks (WSN), the Internet [16], mobile technologies, and machine learning algorithms were used. The sensor networks were used to collect the microclimatic parameters from the crop field. Time-series models help predict future occurrences based on past data. Tools such as the Internet and mobile phones will be used to disseminate the forewarning messages and recommend pest and disease management practices to the farming community.
2.1.2. Area Used and Duration of the Study
In India, the study was carried out on a black soil farm located at Kovilpatti (9.17° N 77.87° E), elevation 106 m, belonging to the district Thoothukudi with a total area of 49 Km2. It is situated under the rainfed tract. The main cotton varieties grown are Gossypium arboreum and Gossypium hirsutum. The weather usually is 27 °C with the wind speed at 8 km/h and a 65% humidity. The data collection and sampling were carried out during the rabi season, which is from 1 October – 30 February, during 2017–2019.
2.1.3. Phenological Study
The phenological sampling was carried out in the study area during the rabi season in 2017–2019 (from 1 October to cotton harvest in February). A total of 40 plants were selected and monitored. During the three years of study (2005–2007), weekly visits to the farm area were carried out. The number of visits increased to twice a week for flowering and boll development in the cotton crop.
2.1.4. Data Used
Microclimatic data (maximum temperature (MaxT), minimum temperature (MinT), morning relative humidity (MRH), afternoon relative humidity (ARH), evening relative humidity (ERH), wind direction (WD), rainfall (RF), wind speed (WS), sunshine hour (SSH), leaf wetness (LW), and leaf temperature (LT)) for a two-year duration were recorded through sensor networks. The 2012–2018 historical weather data from the India Meteorological Department website were used. We obtained a total of 59 datasets of cotton pests taken from the NAIP website and the real data collected from the farm field. The sizes of each dataset vary from 60 to 1164. The substantially sized datasets were used to perform the proposed model’s training phase to guarantee accuracy and stability. Eight groups of datasets (DS1, DS2, DS3, DS4, DS5, DS6, DS7, and DS8) were mostly used to determine the prediction accuracy of the proposed system of the pest occurrence, and these details are tabulated in Table 1.

Table 1.
Details of the dataset group of cotton.
2.2. Methodology Used
In this work, we developed an intelligent pest and disease forewarning system. It was developed by inferring the correlation of climatic factors and pest and disease occurrences. Figure 1 shows the system architecture of the proposed approach.
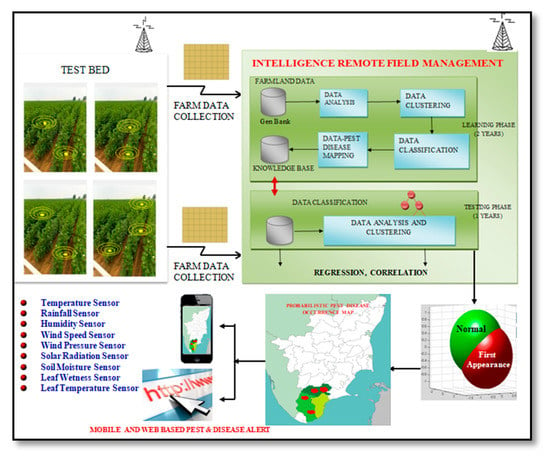
Figure 1.
System architecture of the intelligent pest and disease forewarning model.
The proposed system is an automated system based on the past microclimate data (rainfall, temperature, relative humidity, soil moisture, sunshine hours, evaporation, wind direction, wind speed, atmospheric pressure, leaf moisture, leaf temperature, etc.). It predicts the occurrence of pests and diseases daily, thereby reducing productivity loss due to pests and diseases. We developed the entire system as a layer-wise approach, which is illustrated in Figure 2.
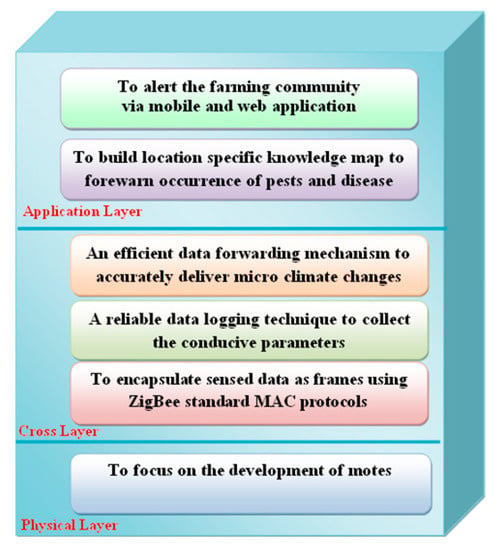
Figure 2.
Layer-wise implementation approach.
The physical layer of the proposed model is responsible for the development of sensor motes and their deployment. The system is based on a wireless sensor network consisting of sensor motes, wireless routers, a data server, and the sink node. The sensor motes were statically deployed in the farm field. The farm was deployed with one sensor to perceive the rainfall, temperature, sunshine hours, evaporation, wind direction, wind speed, and atmospheric pressure. Nearly 25 sensor motes were deployed in the farm field’s various places to measure relative humidity, soil moisture, leaf moisture, leaf temperature, etc. The number of sensor motes requirement was derived based on the farm field area and the sensor motes’ coverage and connectivity. Figure 3 shows the model of sensor mote installation in the farm field. We had access to MicaZ motes, sensor boards (MTS101), a processor radio microcontroller (MPR2400CA), a mote interface board (MIB520), and programming boards (MIB510) through Tiny OS and nesC programming language.
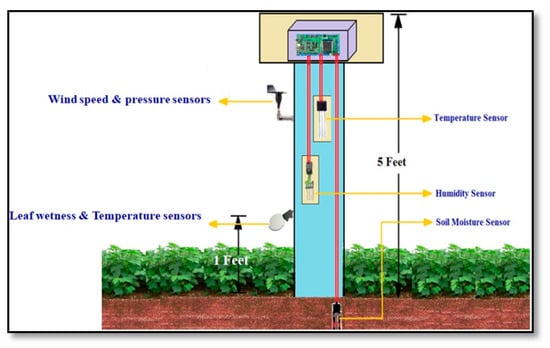
Figure 3.
Sensor motes installation model.
The proposed model’s cross layer is responsible for encapsulating the data as frames, data logging, and data forwarding. Moreover, the monitoring and forewarning system for cotton cultivation mainly consists of the following processes: data acquisition, data transmission, data processing, components controlling, and information dissemination through web mobile applications. The cross layer takes care the abovementioned processes. The sensors deployed on the farm field would send the perceived data to the base station (sink node) in a multihop fashion. The base station allows for data aggregation of the sensor motes in a computer platform. Since all the components have full compliance with the Institute of Electrical and Electronics Engineers (IEEE) standard 802.15.4, a multihop mesh network was established and maintained in the farm field [18]. An MPR2400 board was used for sensor-to-sensor and sensor-to-gateway communication. A typical data flow from the farm field to the data processing station is shown in Figure 4. The base station routes the location-specific microclimatic data to the forewarning center using General Packet Radio Service (GPRS) connectivity. This layer ensures the collection of microclimatic data and forwarding the same for further developing a pest and disease forewarning system for the cotton crop.
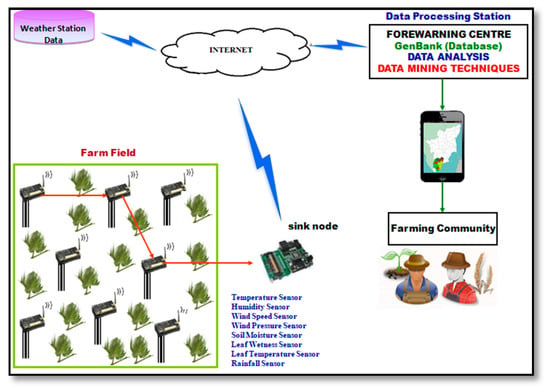
Figure 4.
Microclimatic data collection and forwarding.
The proposed system’s application layer is the heart of microclimate-based pest and disease management through a forewarning system for sustainable cotton production. Figure 5 specifies the process of finding the location-based knowledge map to provide forewarning on the occurrence of pests and disease. The primary aim of the system is to automate pest and disease prediction intelligently, that is, the system is designed to be capable of forecasting the occurrence of pests and diseases accurately without human intervention. The application layer includes the following processes. The entire process is divided into five blocks.
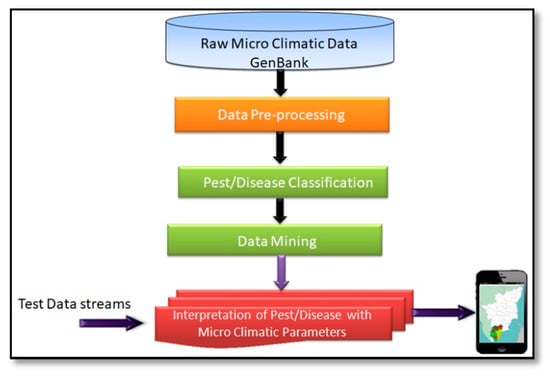
Figure 5.
Process of finding the location based knowledge map to predict the pests and disease.
Microclimate parameters of the cotton crop were collected using wireless sensors that have been installed on the black soil farm of Kovilpatti. A popular energy-efficient protocol can be used to collect instantaneous data from the field. The sensors also transmitted the data to the base station continuously. Temperature, rainfall, relative humidity, solar radiation, wind speed, and soil moisture are the parameters recorded in JavaScript Object Notation (JSON) file format. It gets converted to the readable .txt file format. The processed data were then moved to the Hadoop Distributed File System (HDFS), and preprocessing sequences were performed on the microclimatic data. The dataset size is managed by eliminating irrelevant data and duplicate records. The pest and disease occurrence data were collected manually from the crop field at regular intervals. Missing data were simulated and filled in the dataset. The major pests and diseases of cotton that affect the yield and the conducive weather conditions for their occurrence are shown in Table 2. The data spread range for Thrips occurrence is shown in Figure 6.

Table 2.
Pest and disease of cotton crop and conducive weather for the pest and disease occurrence.
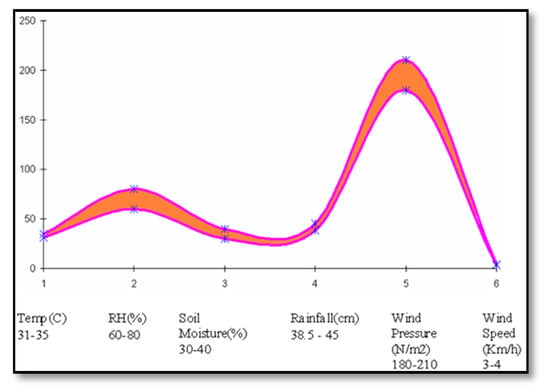
Figure 6.
Data spread range for the pest Thrips.
In this work, the outbreak of pests and diseases due to microclimate changes was studied. The Kaa tool was used to perform the analytics. Decision-tree classification and case-based classification approaches were adopted for data classification. Partitioning methods were used for data clustering. We used the R tool for performing the prediction of pest and disease occurrence. From the microclimatic data in the past years, we arrived at compiling the time-series data using R language.
Further, the time-series data were decomposed into more detailed parameters based on seasonality, day, trend, and time. A time-series plot was drawn to visualize the climate data using a line chart. The microclimatic data changes have a seasonality-pattern that is always more or less similar, and we could see that some parameter data have different values from year to year. Significance was calculated for three p values (0.01, 0.05, and 0.1). The proposed system calculated the correlation between pest and disease pressure for a given day and the weather parameter values from the previous one to two weeks.
Finally, the autoregressive integrated model (ARIMA) was used to predict pests and disease in cotton crops once a week. Climate variables displaying the highest positive correlation coefficients and pest disease occurrence for the previous weeks were chosen as estimators. ARIMA is a class of models for predicting a time series. It includes long trend value, fluctuations of the series in periods of less than one year and longer than one year, and random factors. A model is treated as an autoregressive one if the series’s values are related to previous values of the variable. In this model, thrips tabaci and ramularia areola are related to the climate conditions detected during the earlier days. A multiple linear regression function is used in which the dependent variable is the observation in the time t, and the independent variables are related to the dependent variable. Three parameters were tested in the ARIMA (p, d, q) model. The first parameter p is the autoregressive parameter measuring the values’ independent effect with a specified delay. A first order autoregression means that each value in the series is affected by the one preceding values. The second parameter d is differentiation; it is a number of nonseasonal differences, and it defines the number of times that a time series was transformed by calculating the differences between the sequence of values and its predecessors. The third parameter q is a running mean value representing the number of lagged forecast errors.
An autocorrelation plot (ACP) on stationary time-series data was generated to create the ARIMA model. From the ACP, we can find moving average parameters. The partial correlation coefficient value was used to get the moving average parameter. The ARIMA model developed was tested with observed data from the farm field compared with data predicted by the developed model. The above results found that ARIMA (1, 0, 2) is the appropriate model to predict pest and disease occurrences based on the microclimatic information. The forewarning results made available to the farming community as e-agriculture products can assist in significant pest and disease management through appropriate prevention and control measures. Moreover, important forewarning information can be disseminated to the farming community through web and mobile-based technologies, such as short message service and voice calls.
3. Results and Discussion
We created an intelligent pest and disease forewarning system to manage the pest and disease of cotton crops based on the microclimatic conditions. This system is a novel one because it augments the potency of sensor networks, learning models, and ICT to perform precise pest management. The early and accurate finding of plant diseases is used in preventing yield loss. Nine different machine learning and deep learning systems based on plant disease and pest detection systems were developed [19]. These systems commonly used images (typical plant/leaves images, infected plant/leaves images) as primary data. From among nine systems, we chose three different techniques, namely artificial neural networks (ANN), long short-term memory (LSTM), and support vector machine (SVM), to test the effectiveness of the proposed work.
An automatic disease diagnosis and the controlling system was proposed to identify the disease infection on cotton leaves based on soil quality monitoring. The support vector machine approach [20] recognized five common diseases that affect cotton leaves. It used an android application to send the detected infection name and the recommended remedies to the farmers. The farmers then used Internet of Things technologies to control both the motor for irrigation and the sprinkler to spray the pesticides. Since SVM can handle multiple continuous and categorical variables, it is widely used and is the most popular machine learning approach for the classification process. It splits the data into different classes to find a maximum marginal hyperplane. It can represent the other classes in a multidimensional hyper- or decision-plane in an iterative manner with minimized error, but it requires more time for training, and hence it may not be apt for large datasets. Moreover, the performance will not be better if the dataset has overlapping classes.
A plant disease recognition model was created in [21] using deep neural networks. A convolutional neural network based plant disease identification system used in [22] is also available. The image dataset was used as input to the model. It identified nearly thirteen different types of leaf diseases that occur in the crop. The ANN was trained using the pest and disease analysis dataset. It has three layers with a different count of neurons in each layer. In order to avoid overfitting, a dropout layer was also used. The first layer is the input layer that used 512 neurons, and a Rectified Linear Unit (RELU) was used as the activation function [23]. The RELU activation function (f(z)) is a half-rectified one where f(z) = 0 when z < 0 and f(z) = z when z ≥ 0. Then, the second layer of the ANN includes 256 neurons with the activation function Sigmoid. It also includes a dropout layer proportional to the input layer. The third (intermediate) layer consists of 128 neurons with the same Sigmoid activation function and is then followed by the dropout layer. The output layer is configured with two neurons, with Softmax as the activation function. The activation functions tell the network how to judge when a particular node weight has created a good fit. The selection of activation functions for different layers was performed based on the trial and error method. Five epochs were used at each layer to facilitate the learning of neurons.
The deep learning model LSTM in [12] is a particular class of recurrent neural networks that outperforms in solving long-term dependency and time-series problems. The LSTM model was designed to capture the relationship between the weather feature data that were used to predict pests and diseases. The model contains a set of input gates for entering the current-cell input features; the forget gate decides if and how much information should be forgotten for the last memory. The output one controls the information outputting from the current cell. In LSTM, the climate pest temporal data should be converted to three dimensions of tenser data. This architecture includes two subsystems called LSTM layers and connection layers. The first one is used for capturing the temporal relationship between the climate data and the outbreak of pests and diseases. The second subsystem is used to reduce the output dimensions and then map the output vector to a final prediction decision.
The proposed method is compared with the other techniques in terms of prediction accuracy, average root mean square error, average percentage error. We also approximately calculated the anticipated revenue generation by implementing the proposed work. From Figure 7, it is clear that the prediction accuracy is high when the dataset contains a greater number of pest and disease data. This enabled the system to learn all possible conducive microclimatic combinations that create the conditions for pests and cotton crop diseases.
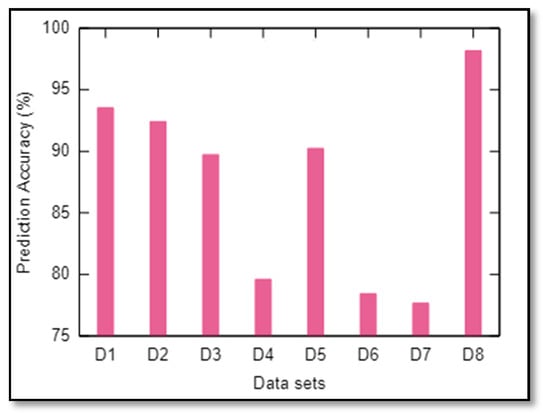
Figure 7.
Prediction accuracy.
Figure 8 and Figure 9 illustrate the RMSE and average error rate of the proposed intelligent pest and disease forewarning system for cotton crop. The above error rate was derived by calculating the false positive rate, correct negative rate, prediction rate, true positive value, and false negative values.
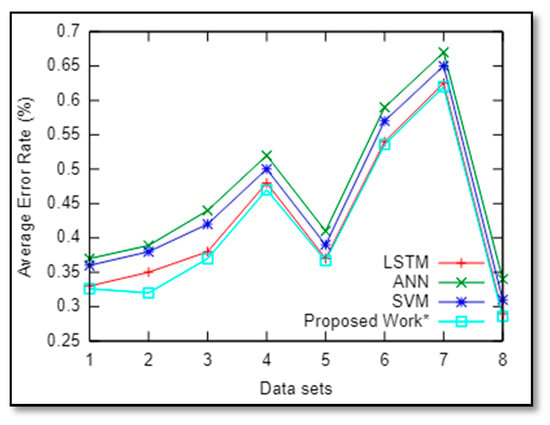
Figure 8.
Average percentage error rate.
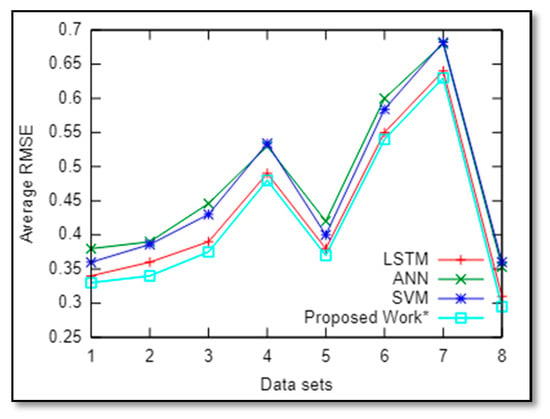
Figure 9.
Average root mean square error rate.
From Figure 9 and Figure 10, it is clear that the proposed system exhibits a more optimal performance over other related works. After the basic model of the proposed work was developed, the other parameters were adjusted to achieve higher performance. The model itself can update the learning parameters in real time. The learning parameters were updated according to the current input data, and the same can be used to predict the occurrences of other pests of the cotton crop. Figure 10 compares the average accuracy rate of four works. From the result, it is clear that the proposed work outperforms the other three works. The main reason for the performance enhancement is the life cycle of various pests and diseases of cotton crop, which has the highest linear relationship with the microclimatic factors seen in the data we collected in real time from the farm field.
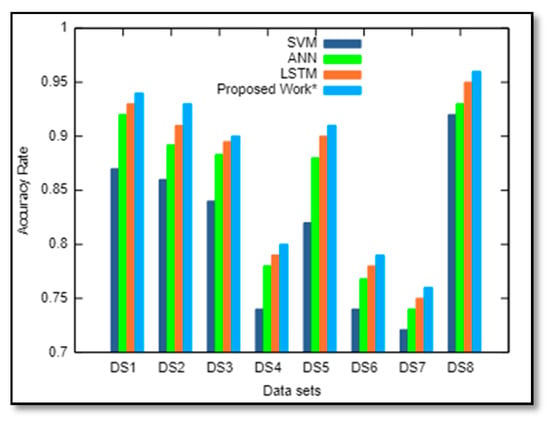
Figure 10.
Average accuracy rate.
We calculated the expected gain due to pest and disease forewarning service in the domain districts due to pesticide usage. Data on reducing environmental pollution are extrapolated in Table 3.

Table 3.
Anticipated receipts.
4. Conclusions
This paper presented an intelligent pest and disease online prediction system for cotton crops based on microclimatic parameters. The WSN was deployed on a black soil farm to get real-time microclimatic data, and the same data were then stored in the database. HDFS and Kaa tools were used in data analytics. The proposed system predicts the occurrence of Thrips tabaci and Ramularia areola using the time series ARIMA model. The predicted results were compared with actual pest and disease occurrence in the farm field. Dynamic threshold was used in calculating the error. The presented approach was implemented using Python programming and tested through the farm field’s real-time dataset. An application and an interactive voice response system were also developed to disseminate timely advice and guideline to the farmers. The experimental result analyses confirm that the proposed scheme shows an optimal detection rate and a minimal false alarm rate. The proposed approach was compared with existing methods such as the ANN, SVM, and LSTM. The comparison found that the proposed model outperforms the existing works in terms of accuracy rate, average root mean square error, and average percentage error. We calculated the anticipated revenue with the proposed system from the cotton production based on the gain due to savings in pesticide usage and gain due to additional yield. Through the timely and judicious use of pesticides due to pest and disease forewarning, service cost of cultivation was reduced, and pesticide residues were avoided. In this way, livelihood security and environmental security are achieved.
In future works, we plan to get help from the self-help groups in the Thoothukudi, Tirunelveli, and Virudhunagar districts to reach the regional farming community of those districts. We will introduce the proposed work to the district level farmers through the district-wide agricultural officer (Quality Control and information and Training) of Tamilnadu. The developed model will be presented in the Smart India Hackathon (SIH) contest in order to reach the agriculture sector’s ministries, managerial, government, private organizations, and academic personnel, as this would enable us to connect with the farmers in our country more easily. The main goal for subsequent research will be modeling the most adjusted multivariate multistep ARIMA models for the most common pests such as Aphis gossypii, Amrasca devastans, and Pempherulus affinis. The proposed system’s graphical user interface will be enhanced with augmented reality potential that aims to provide automatic crop disease diagnosis with a visual inspection. It could benefit the users with little to no knowledge of the plants that they are cultivating.
Author Contributions
B.M. and P.B. made the study on wireless sensor technology, database design, application development, forecasting model development; P.B. participated in the sensors deployment in farm land, made data collection; R.D. helped in deriving the inference from the collected microclimatic data and occurrence of pests and diseases in the farm field. B.M. developed the time series model and alert dissemination application. R.D. helped in developing the optimal forecast model. B.M. drafted the manuscript. R.D. and P.B. revised the manuscript critically. All authors have read and agreed to the published version of the manuscript.
Funding
This research received no external funding.
Acknowledgments
We would like to thank the people who made this research work possible.
Conflicts of Interest
The authors declare no conflict of interest
References
- Balikai, R.A.; Venkatesh, H.; Sagar, D. Development of models to predict insect pest populations-An eco-friendly tactic for pest management. J. Farm Sci. 2019, 32, 1–13. [Google Scholar]
- Illán, J.G.; Bloom, E.H.; Wohleb, C.H.; Wenninger, E.J.; Rondon, S.I.; Jensen, A.S.; Crowder, D.W. Landscape structure and climate drive population dynamics of an insect vector within intensely managed agroecosystems. Ecol. Appl. 2020. [Google Scholar] [CrossRef]
- Cotton Advisory Board (CAB). Available online: https://cotcorp.org.in/statistics.aspx (accessed on 27 October 2020).
- Mahmood, I.; Imadi, S.R.; Shazadi, K.; Gul, A.; Hakeem, K.R.; Akhtar, M.; Abdullah, S. (Eds.) Effects of Pesticides on Environment. In Plant, Soil and Microbes; Springer International Publishing: Cham, Switzerland, 2016. [Google Scholar]
- Patel, R.; Radadia, G.G. Population dynamics of cotton jassid, Amrascabiguttulabiguttula (Ishida) and natural enemies in relation to weather parameters under rainfed conditions. J. Entomol. Zool. Stud. 2018, 6, 664–672. [Google Scholar]
- Saeed, R.; Razaq, M.; Hardy, I.C.W. The importance of alternative host plants as reservoirs of the cotton leaf hopper, Amrascadevastans, and its natural enemies. J. Pest Sci. 2015, 88, 517–531. [Google Scholar] [CrossRef]
- Arzu, Ö.; Dilek, A.; Muhsin, K. Pesticides, Environmental Pollution, and Health. Environmental Health Risk-Hazardous Factors to Living Species; Larramendy, M.L., Soloneski, S., Eds.; IntechOpen: London, UK, 2016. [Google Scholar]
- Marchand, P.A. Synthetic agrochemicals: A necessary clarification about their use exposure and impact in crop protection. Environ. Sci. Pollut. Res. 2019, 26, 17996–18000. [Google Scholar] [CrossRef] [PubMed]
- Saeed, H.; Ehetisham-Ul-Haq, M.; Atiq, M.; Kamran, M.; Idrees, M.; Ali, S.; Burhan, M.; Mohsan, M.; Iqbal, M.; Nazir, S.; et al. Prediction of cotton leaf curl virus disease and its management through resistant germplasm and bio-products. Arch. Phytopathol. Plant Prot. 2018, 51, 170–186. [Google Scholar] [CrossRef]
- Dhawan, A.K. Integrated Pest Management in Cotton. Integrated Pest Management in the Tropics; New India Publishing Agency: New Delhi, India, 2019; pp. 499–575. [Google Scholar]
- Mohammad, Z.A.M.; Manjurul, H.M.; Sirajul, I.; Emran, H.; Sabiha, B.H.; Shahela, B.H.M.; Sakhawat, H. Comparative Study of Integrated Pest Management and Farmers Practices on Sustainable Environment in the Rice Ecosystem. Int. J. Zool. 2016, 2016, 1–12. [Google Scholar] [CrossRef]
- Xiao, Q.; Li, W.; Kai, Y.; Chen, P.; Zhang, J.; Wang, B. Occurrence prediction of pests and diseases in cotton on the basis of weather factors by long short-term memory network. BMC Bioinform. 2019, 20, 688. [Google Scholar] [CrossRef] [PubMed]
- Corrales, D.C.; Corrales, J.C.; Figueroa-Casas, A. Towards Detecting Crop Diseases and Pest by Supervised Learning. Ing. Univ. 2015, 19, 207–228. [Google Scholar] [CrossRef]
- Alves, A.N.; Witenberg, S.R.; Souza, D.L.B. Cotton pests classification in field-based images using deep residual networks. Comput. Electron. Agric. 2020, 174, 105488. [Google Scholar] [CrossRef]
- Collier, R.H. Pest and Disease Prediction Models. Encycl. Appl. Plant Sci. 2017, 31, 120–123. [Google Scholar]
- Gao, D.; Sun, Q.; Hu, B.; Zhang, S.A. Framework for Agricultural Pest and Disease Monitoring Based on Internet-of-Things and Unmanned Aerial Vehicles. Sensors 2020, 20, 1487. [Google Scholar] [CrossRef] [PubMed]
- Practice for Cotton Cultivation from TNAU AgriTech Web Portal. Available online: https://agritech.tnau.ac.in/agriculture/agri_cropproduction_fibre_irrigatedcotton.html (accessed on 2 December 2020).
- Yan, X.; Cao, J.; Sun, L.; Zhou, J.; Wang, S.; Song, A. Accurate analytical-based multi-hop localization with low energy consumption for irregular networks. IEEE Trans. Veh. Technol. 2019, 69, 2021–2033. [Google Scholar] [CrossRef]
- Nagrare, V.S.; Nandini, G.N.; Waghmare, V.N. Cotton Crop Protection Strategies. 2018. Available online: https://www.cicr.org.in/pdf/Cotton_Crop_Protection_Strategies_2018.pdf (accessed on 8 December 2020).
- Sladojevic, S.; Arsenovic, M.; Anderla, A.; Culibrk, D.; Stefanovic, D. Deep Neural Networks Based Recognition of Plant Diseases by Leaf Image Classification. Comput. Intell. Neurosci. 2016, 6, 1–11. [Google Scholar] [CrossRef]
- Boulent, J.; Foucher, S.; Théau, J.; St-Charles, P.L. Convolutional neural networks for the automatic identification of plant diseases. Front. Plant Sci. 2019, 10, 941. [Google Scholar] [CrossRef]
- Jyothi, P.; Mytri, V.A. Prediction Model for Population Dynamics of Cotton Pest (Thrips tabaci Linde) using Multilayer-Perceptron Neural Network. Int. J. Comput. Appl. 2013, 67, 19–26. [Google Scholar] [CrossRef]
- Türkoğlu, M.; Hanbay, D. Plant disease and pest detection using deep learning-based features. Turkish J. Electr. Eng. Comp. Sci. 2019, 27, 1636–1651. [Google Scholar]
- Season and Crop Report 2011–2012 from Tamilnadu Agri Tech Web Portal. Available online: https://agritech.tnau.ac.in/index.html (accessed on 8 December 2020).
- Adhao, A.S.; Pawar, V.R. Automatic Cotton Leaf Disease Diagnosis and Controlling Using Raspberry Pi and IoT. In Intelligent Communication and Computational Technologies; Springer: Singapore, 2018; Part II, Chapter 15; pp. 157–167. [Google Scholar]
Publisher’s Note: MDPI stays neutral with regard to jurisdictional claims in published maps and institutional affiliations. |
© 2020 by the authors. Licensee MDPI, Basel, Switzerland. This article is an open access article distributed under the terms and conditions of the Creative Commons Attribution (CC BY) license (http://creativecommons.org/licenses/by/4.0/).