1. Introduction
One of the fundamental and important issues in the production cycle of agricultural products is the type of tillage operations [
1]. Along with trying to do proper tillage operations, which consumes a significant portion of the energy in crop production [
2], it is highly important to optimize the operations and the implements used to cultivate agricultural products [
3]. The most common and oldest tillage implement is the moldboard plow. In addition to plows, there are some types of subsoilers, called para-plows, that have a lower draft than conventional subsoilers [
4,
5], which nowadays are widely used in the form of para-plows with wing and without a wing. Determining the force acting on these agricultural implements by the soil (soil resistance), estimating the energy required to carry out tillage operations, and choosing a favorable traction force to carry out the desired operations, as well as managing the decisions required in the implementation of large-scale mechanization to save fuel and energy consumption are of great importance [
6]. Therefore, measuring the forces acting on tillage implements is one of the main goals of many researchers in the field of tillage and soil dynamics. Determining the horizontal and vertical components of soil cutting and draft force has attracted the attention of many researchers [
7,
8,
9]. This is in direct relationship between the forces acting on tillage implements and their stability during tillage operations, and the energy applied to the soil, as well as the size of the tractor (power source) to carry out tillage operations [
6,
10].
Researchers use agricultural dynamometers to measure the forces acting on the implements during agricultural operations. Some dynamometers measure all force components acting on the implements. In some other designs, only the horizontal and vertical forces are measured [
11]. In many other systems, only the horizontal force (draft force) is measured [
12]. Godwin et al. [
13] used a three-point hitch dynamometer to measure the torque and force acting on tillage equipment. The dynamometer was tested and evaluated in both field and laboratory modes. It was able to measure a maximum force of 100 kN in three directions of the coordinate axes and a maximum torque of 100 kN/m in three directions about the coordinate axes. Khan et al. [
14] used a bi-axial extended octagonal ring (EOR) transducer system to measure the horizontal and vertical forces acting on the implements. The system was used for a maximum horizontal load of 80 kN and a maximum vertical load of 60 kN. Askari et al. [
15] developed an adjustable three-point hitch dynamometer, with a capacity of 50 kN, to measure the forces acting on the tractor and mounted implements. This dynamometer provided a variable width and height of dynamometer links to meet a wide range of implementations. The force-sensing element in this system consisted of a rubber (load cell) that was installed between the frames. Irshad Ali et al. [
16] studied the horizontal, vertical, and lateral forces acting on a moldboard plow in a laboratory environment. Studies were conducted at different depths, speeds, and humidity. With increasing speed and depth, the highest horizontal force of 5.113 kN was obtained. Also, with an increase in humidity from 27% to 33%, the horizontal force was reduced.
Godwin et al. [
17] used a mathematical model to predict the draft force acting on the moldboard plow. The geometric parameters of the plow body, plowing speed, and soil characteristics were used to determine the above model. The results showed that the predicted and measured forces differed by 2.8%. Roul et al. [
18] developed an artificial neural network with a background learning algorithm to predict the draft force of various tillage equipment in a sandy loam clay soil under different soil and operational conditions. Al-Hamed et al. [
19] used an artificial neural network (ANN) to predict the draft force required by a disk plow. The proposed neural network model used 10 input parameters: plowing depth, plowing speed, sand content, clay content, silt content, disk diameter, disk attack angle, tilt angle, soil moisture content, and soil density. An algorithm based on backpropagation was used to train the network. The coefficients of determination for the testing points of this model were obtained to be between 0.915 and 0.934. Akbarnia et al. [
20] also used a neural network model with a backpropagation training algorithm to predict the draft force required by two winged share tillage tools in loam soil. The input parameters for the above network were the working depth, speed, and the width of the wing used in the implement. The developed model predicted the draft force with a mean relative error of 0.56 compared to the measured values. Pentoś and Pieczarka [
21] developed a mathematical model using an artificial neural network (ANN) to predict the draft force. Soil texture, soil moisture, compaction, horizontal deformation, and vertical load were used as input parameters of the neural network. The coefficient of determination of the model for the validation data set for the draft force was 0.945.
The ANFIS system creates a fuzzy inference system using a set of input–output data. The ANFIS system is a combination of fuzzy logic and neural network systems. In other words, the ANFIS is a fuzzy system that gives us the power of qualitative expression and, in this respect, it is similar to neural networks with variable structure system. This means its structure is determined according to the data. The determination of the parameters of the membership functions in this algorithm is performed using the backpropagation algorithm or its combination with the least squares method. This adjustment method allows fuzzy systems to achieve their data acquisition structure [
22,
23].
In this study, the horizontal, vertical, and lateral forces acting on different implements were measured at different speeds and depths. Using ANFIS system, models were presented to predict each of these forces by taking into account the type of the implement and working depth and speed as system inputs.
2. Materials and Methods
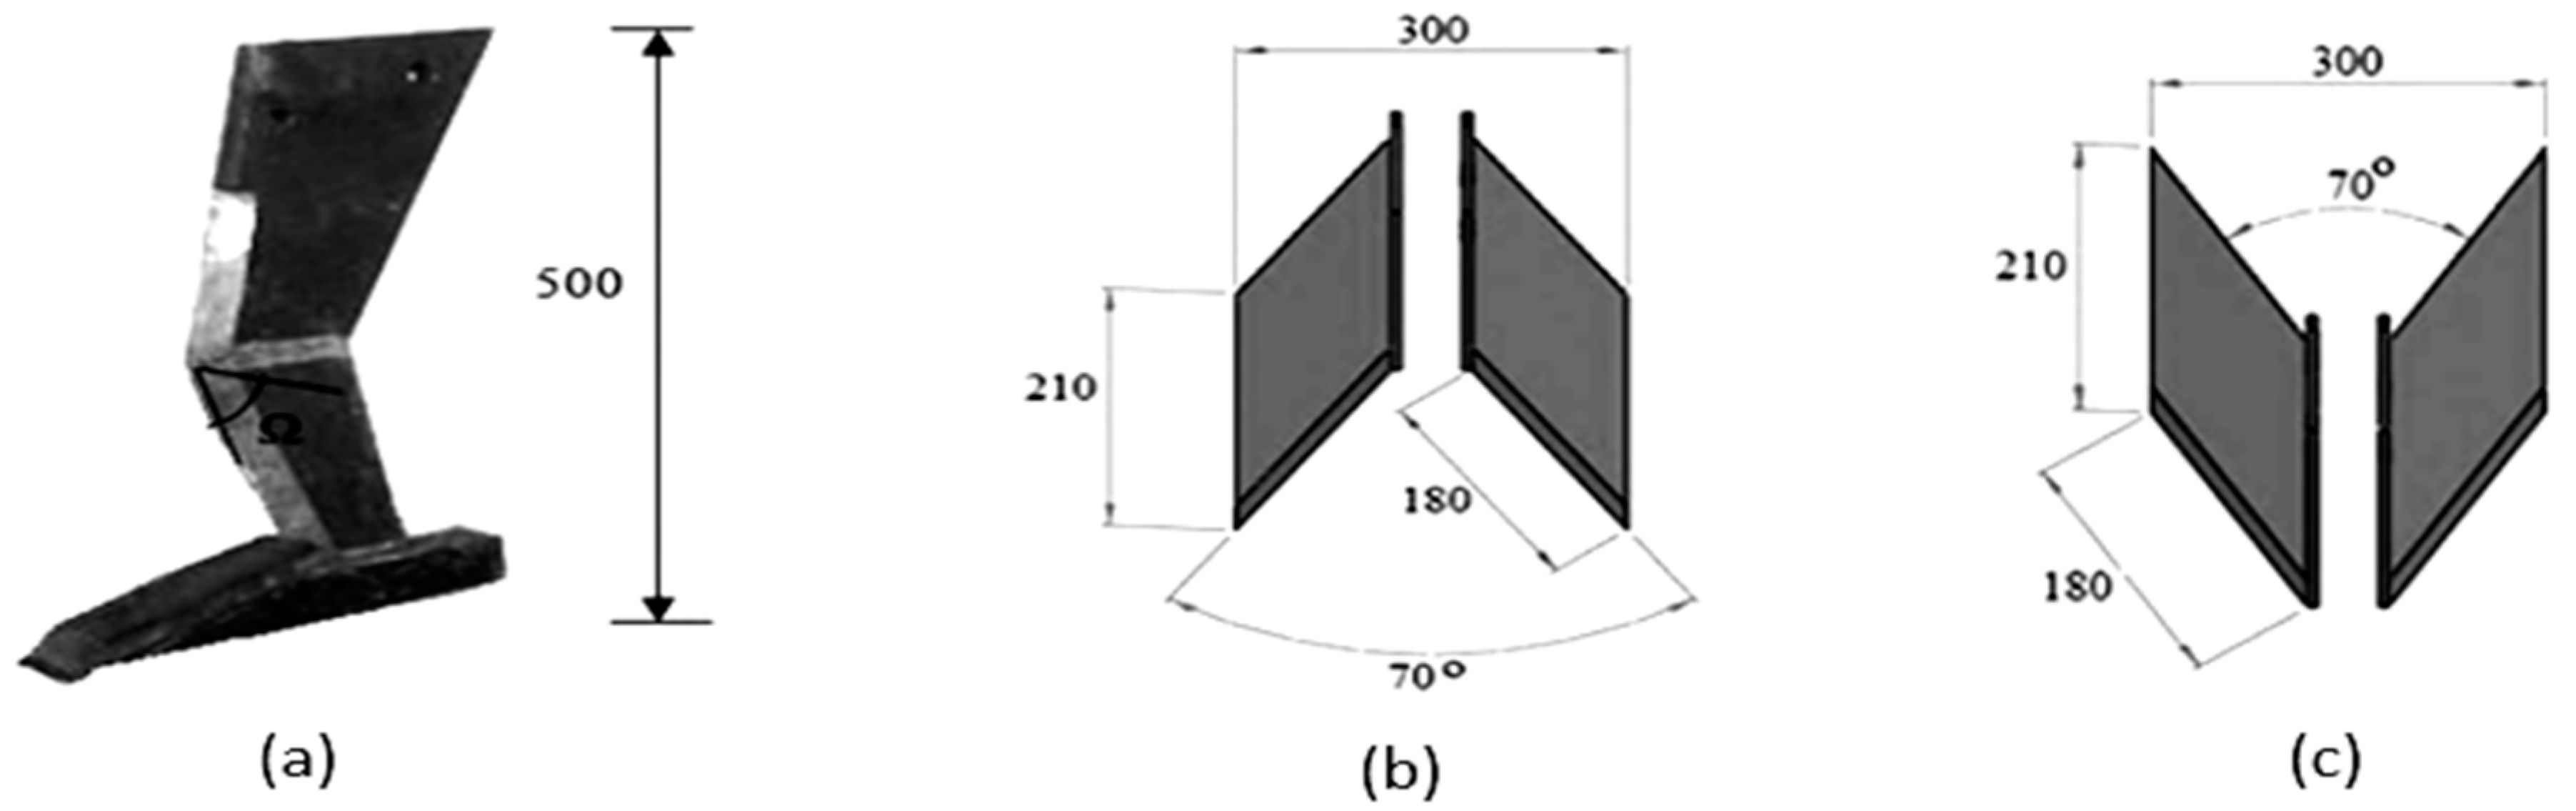
Field experiments were carried out on the research fields of Mohaghegh Ardabili University (longitude E 48°17′35″, latitude 38°12′40″, and altitude 1350 m above sea level) where wheat residues from previous cultivation had remained on the ground. The experiment was performed at three working depths of 10 cm, 20 cm, 30 cm; three forward speeds of 2 km/h, 5 km/h, 7 km/h; and using a moldboard plow and para-plows with three different wing levels [
24] including without wing, with forward-bent wing, and with backward-bent wing (
Figure 1).
The soil of the experimental site was clay loam (Cambisols in World Reference Base for Soil Resources (WRB), International Union of Soil Sciences (IUSS), 2014, Vienna, Austria). The soil moisture and other properties were measured at three ranges of soil depth (0–10 cm, 10–20 cm, and 20–30 cm). Soil samples were carried to the soil science laboratory, weighed, oven dried at 105 °C for 24 h, and weighed again [
25]. Some characteristics of Ardabil agricultural research center was presented in
Table 1.
Massey Ferguson (MF) 285 tractor (Iran Tractor Manufacturing Company, Tabriz, Iran) with a single differential with 75 hp, equipped with precision measuring instrument systems, was used to conduct field trials. Field experiments were performed, by taking into account the type of tillage implement, working speed, and depth as three effective and independent parameters, with five replications for each treatment. A total of 180 experiments were performed in the form of randomized complete block design (RCBD). Each experimental plot was 2.5 m wide and 15 m long, and, at each stage, the draft, vertical, and lateral forces acting on the implements were measured. The fifth wheel mechanism was used to measure the forward speed of the tractor. This wheel is equipped with an electronic tachometer (pulse meter) that senses the gear teeth mounted on the center of the wheel and generates pulses. To obtain the actual speed of the tractor, the pulsed signal (Hz) was measured and then was converted into the real forward speed using the calibration relationship (Equation (1)).
where S is the actual forward velocity, in m/s.
To measure the depth, a standard depth stabilization wheel mounted on the frame of the implements was used. The arm, which provided the connection between the wheel and the frame, had three positions to provide the three desired depths of 10, 20, and 30 cm, which allowed the implements to work at the specified depth and prevent the implement from penetrating to the lower depths. To ensure the correct working depth of the implements, the desired depth was also measured manually and the accuracy of the operation of the depth stabilization wheel was assured.
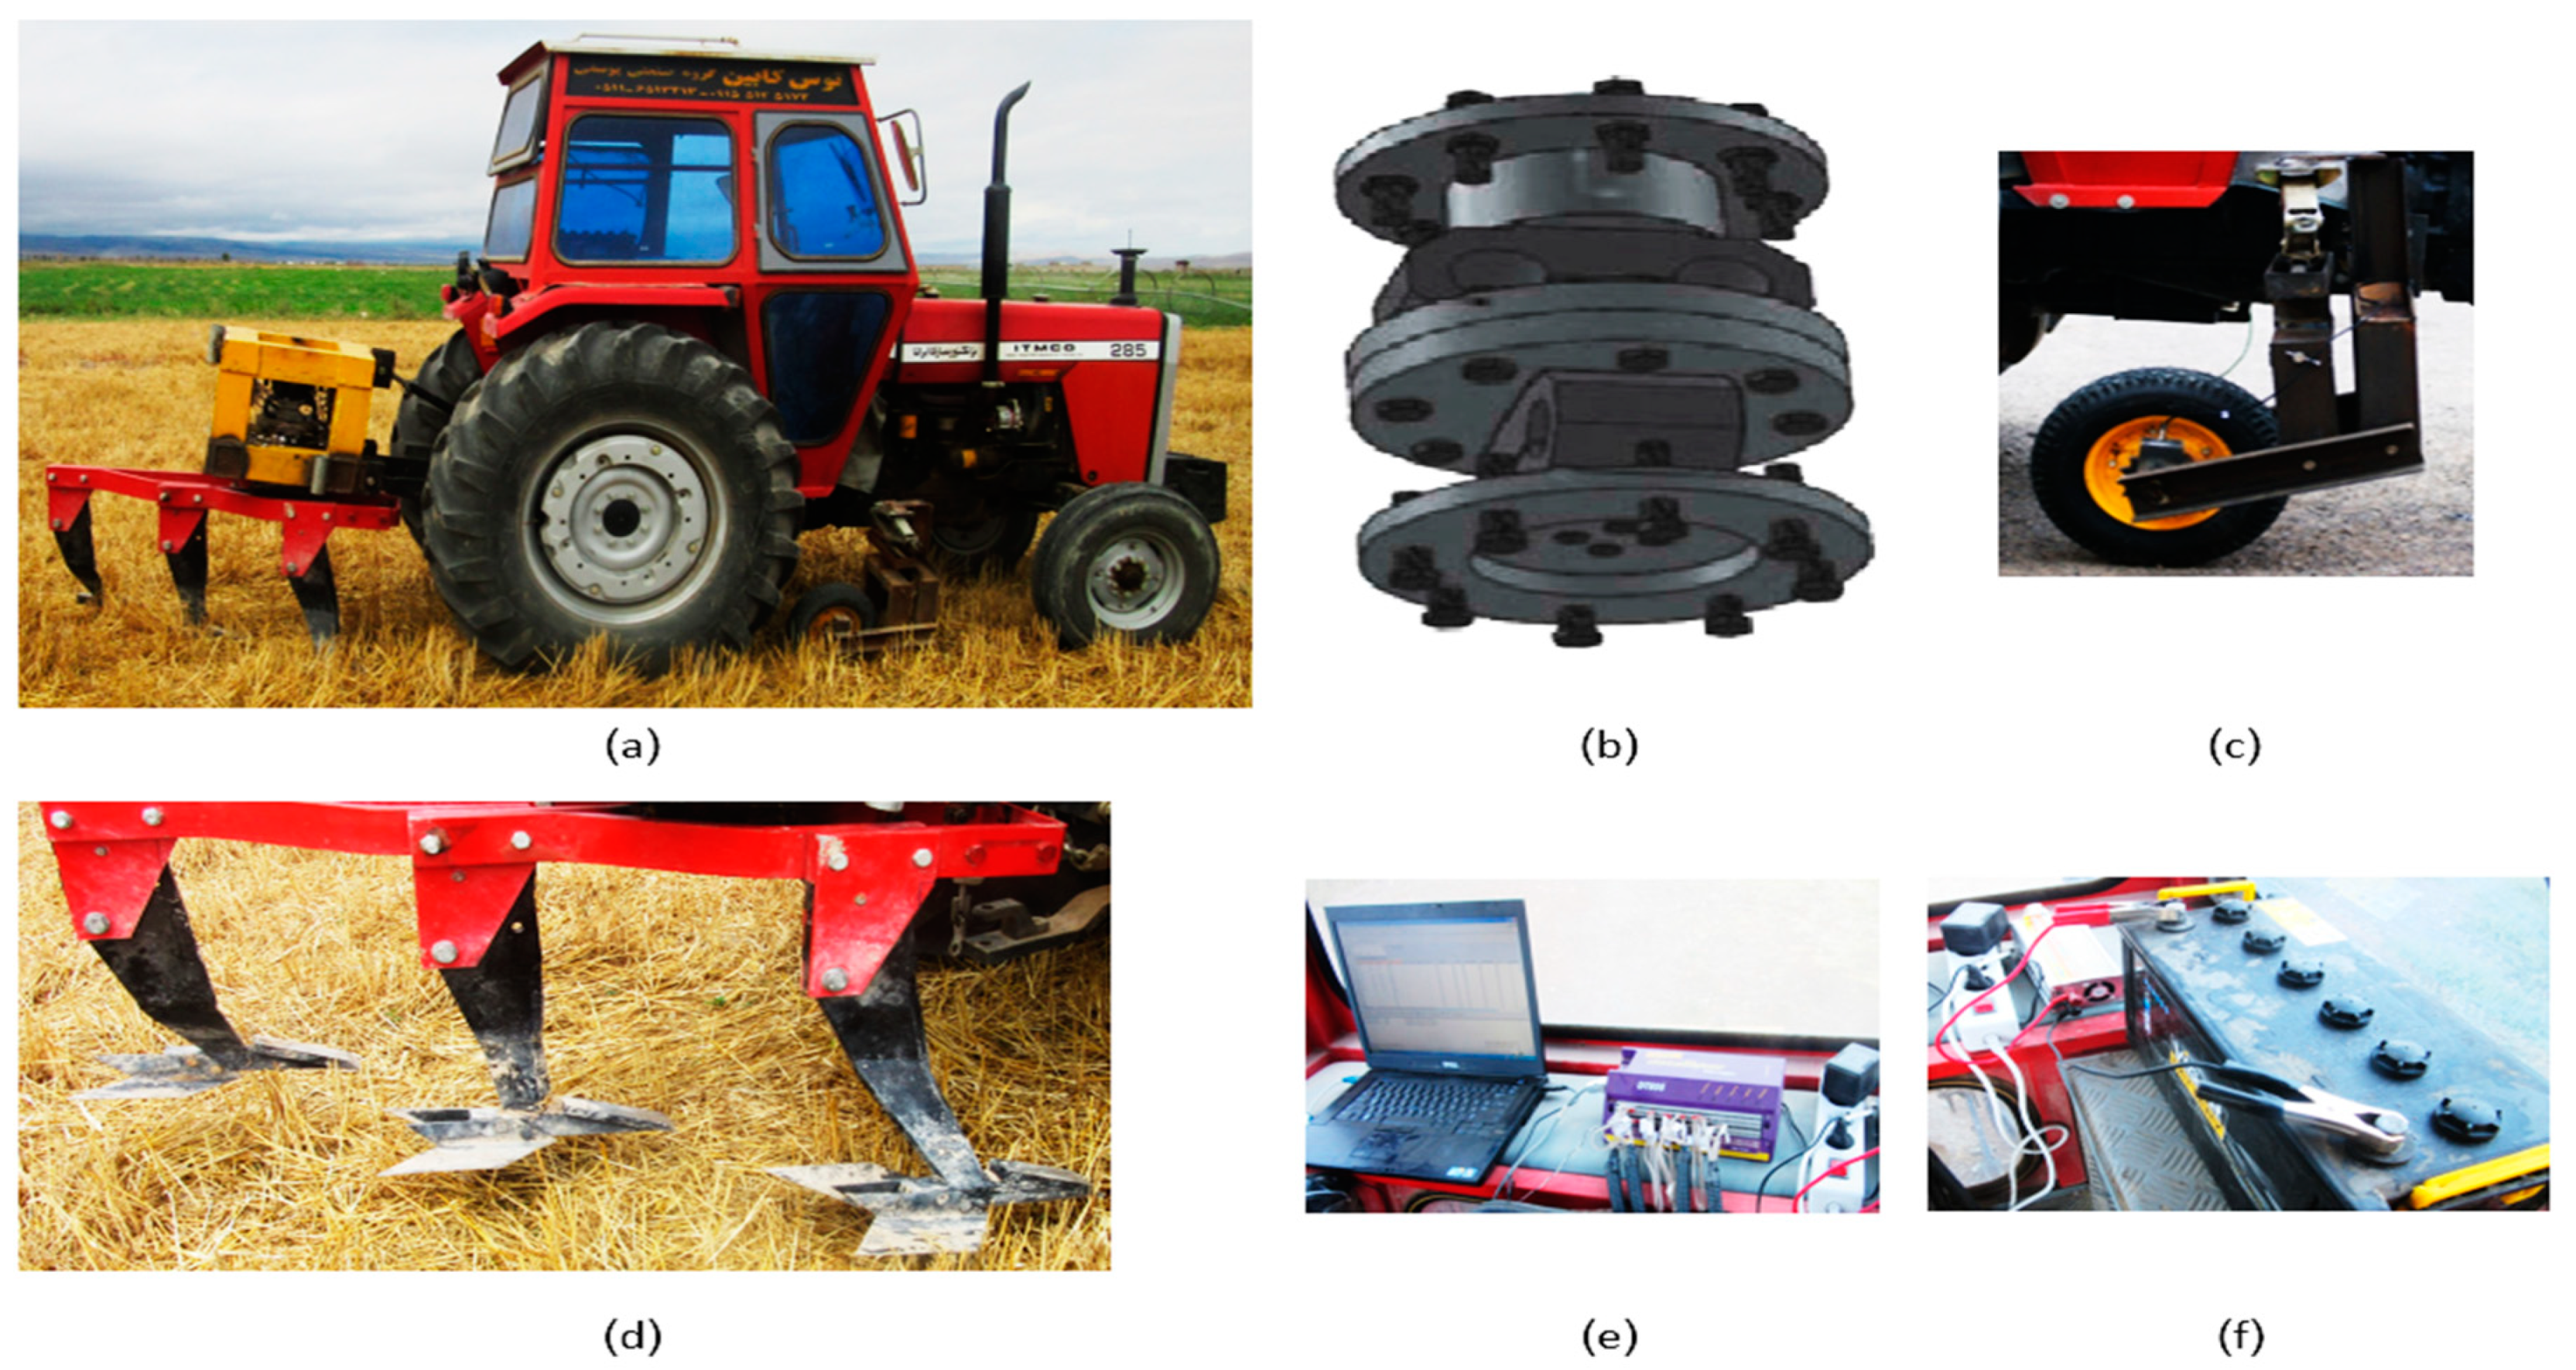
To measure the draft, vertical, and lateral forces acting on the tines of the para-plow and the moldboard plows by the soil, the three-point hitch dynamometer designed by Abbaspour-Gilandeh and Khanmaraki [
26] was used. It includes three octagonal load cells, strain gauges mounted on octagonal load cells and wires connected between the installed strain gauges, the data logger (DT800, Data Taker company, Australia), and the laptop, which are shown in
Figure 2. The data logger and laptop received their power from an extra battery in the cabin. Before the experiments, dynamometer calibration was performed on the field [
27]. Calibration showed a high correlation between draft (
= 0.98), vertical (
= 0.98), and lateral (
= 0.98) forces in kN and dynamometer output in µV.
After collecting the data, the statistical analysis of the obtained data was performed using SAS software (version 9.1, North Carolina, USA). A comparison of the means of the data was performed using Duncan’s test (p < 5%).
Designing the ANFIS Fuzzy Neural System
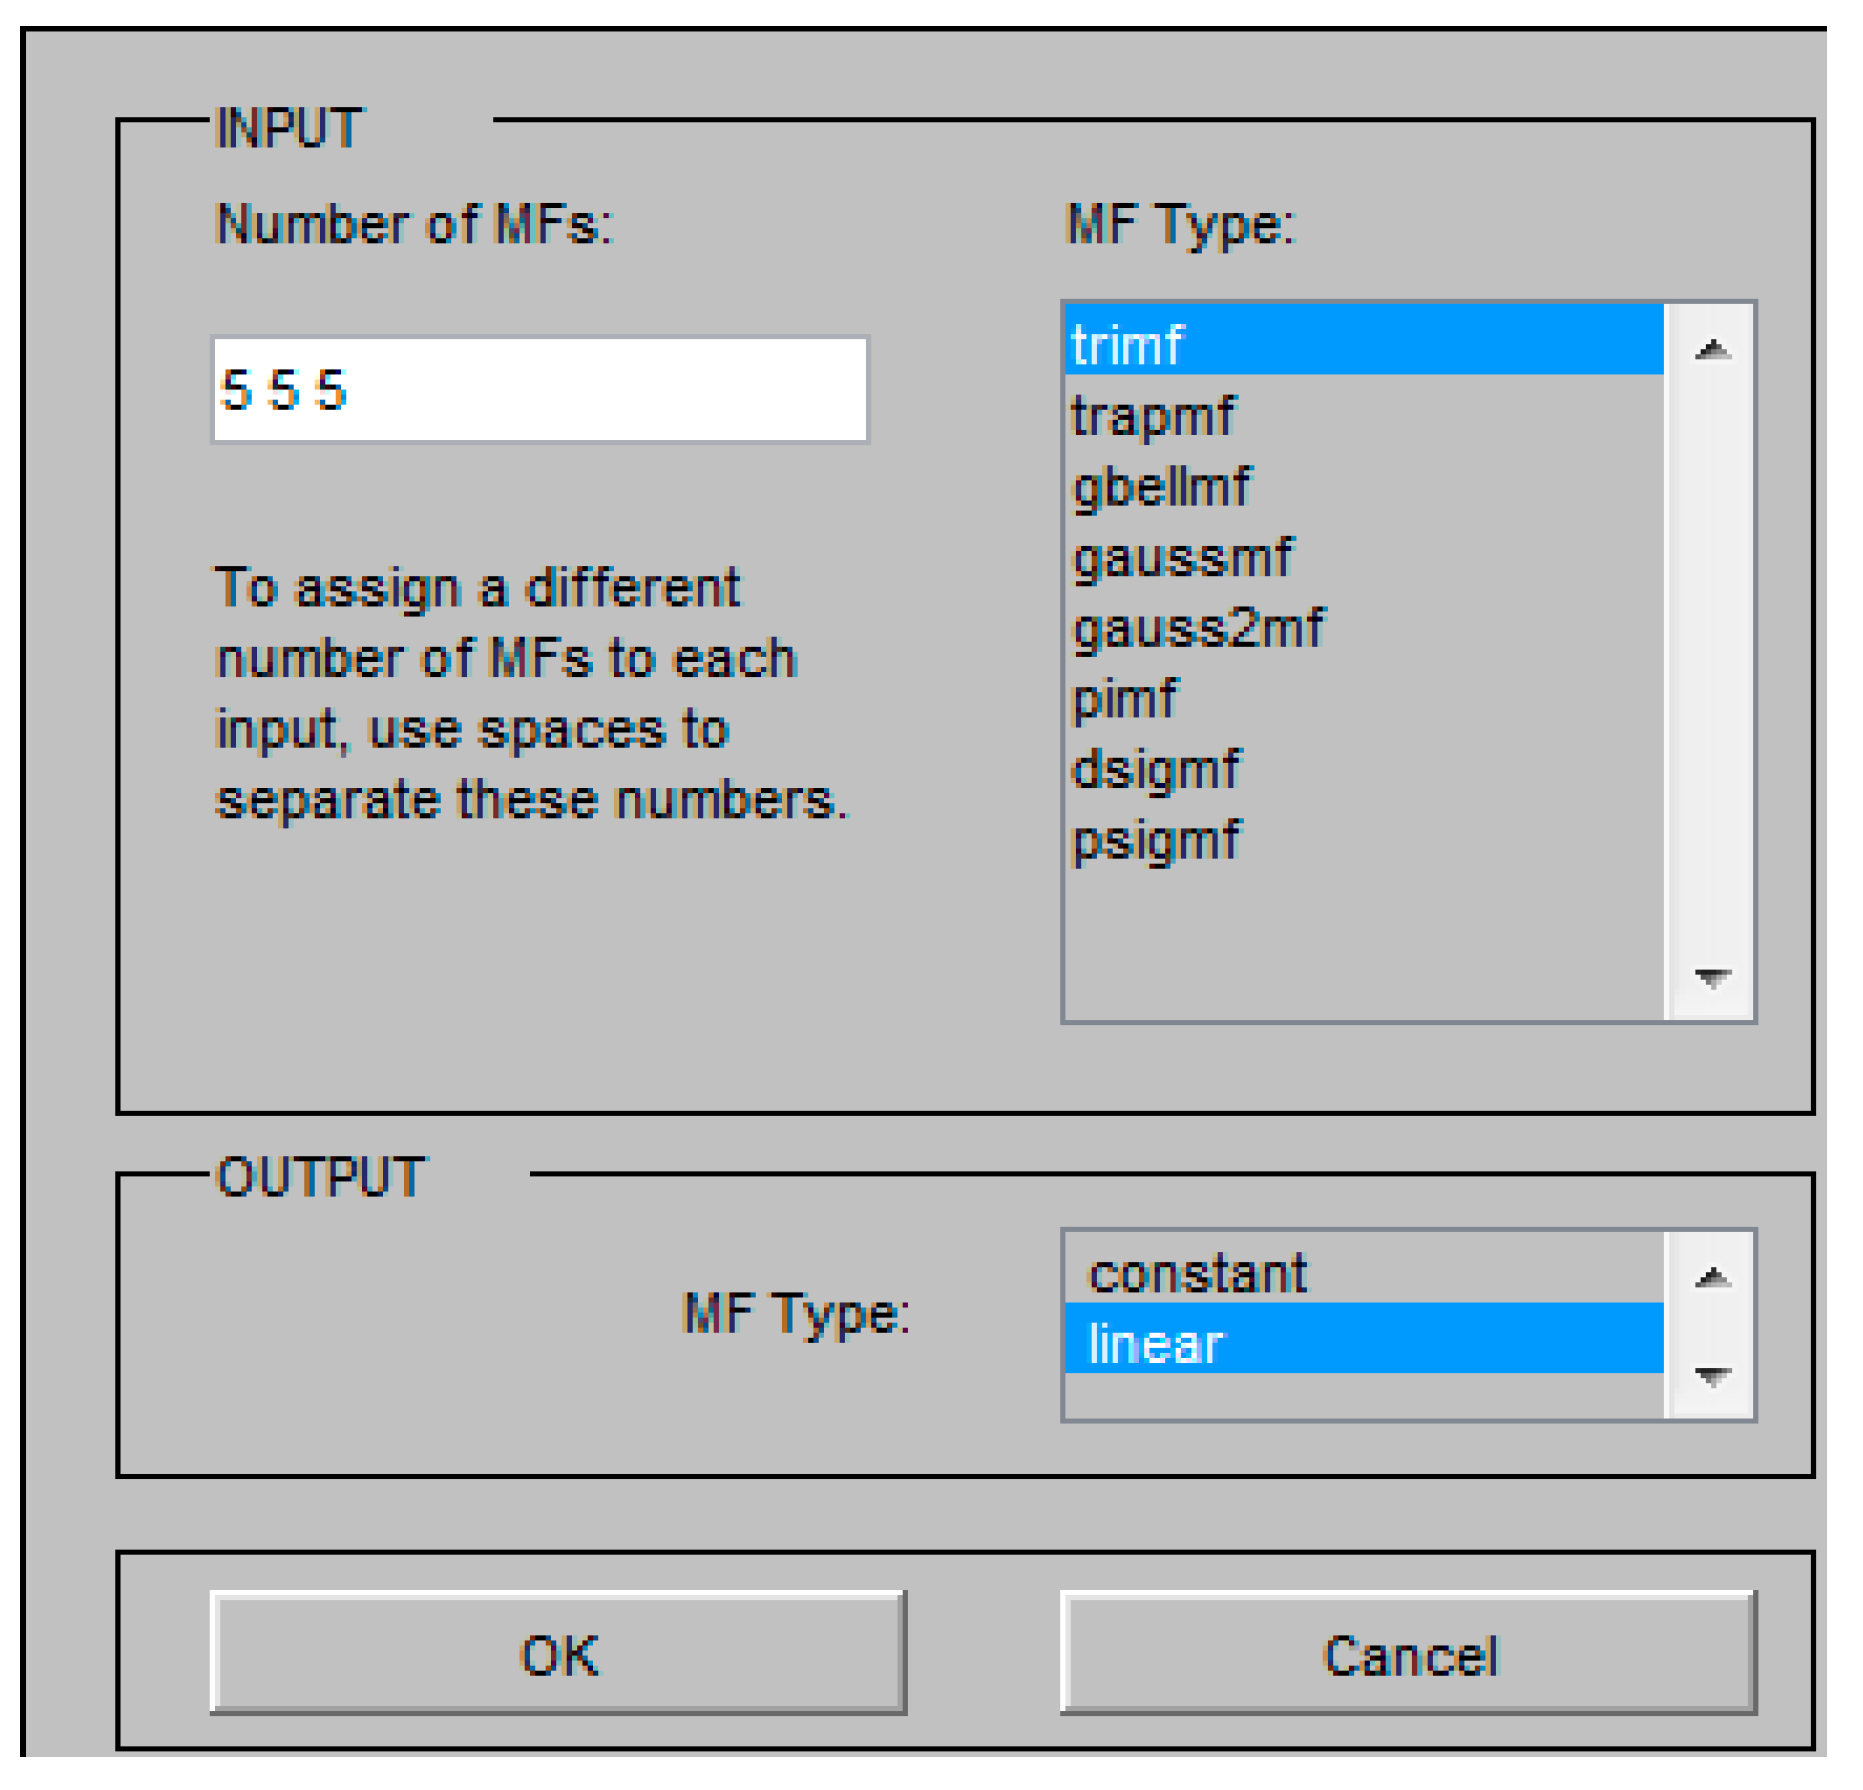
In this section, the three fuzzy neural models for predicting draft, vertical, and lateral forces acting on the implements in the soil under the influence of the three factors of velocity, working depth, and type of implement were assessed. Out of a total of 180 data obtained, 80% of the data were considered as training data and 20% of the data were considered as checking data. After importing data, the initial FIS (fuzzy inference system) structure had to be determined. Using the grid partitioning discretization method, the type and number of membership functions for input and output parameters were determined. In all models the same structure was used, and the employed partitioning structure used can be seen in
Figure 3.
As can be seen in
Figure 3, five membership functions were considered for all three input parameters of implement type, working speed, and working depth and the type of membership functions for the input parameters were selected as triangular membership function (trimf). The membership function type for the output parameter in the proposed models was linear. The hybrid optimization method, which is a combination of the least squares method and (gradient) descent backpropagation method, was used to train the ANFIS structure. The optimal error for the above models was considered to be zero. The number of training intervals was taken to be 30 intervals. Data training was stopped by achieving the required number of intervals or error level. From the training and validation of the ANFIS model, the error value was obtained and plotted and the output value from ANFIS was compared with the training and checking data.
3. Results and Discussion
Table 1 shows the results obtained from the analysis of the variance of the data related to the measurement of the draft, vertical, and lateral forces acting on different tillage implements. The coefficient of variation (CV) of the data was 0.888% for draft force, 2.5% for vertical force, and 5.59% for lateral force, where this value is appropriate and acceptable in terms of the number of treatments and field test conditions. According to
Table 2, it can be seen that the main impact of implement type, depth, and speed, individually and separately, on measured forces was significant at the probability level of 1% (
p < 0.01). Besides, the mutual effects of forward speed on working depth, type of tillage implement on forward speed, and type of tillage implement on working depth on measured forces were significant (
p < 0.01). The triple interaction effect of parameters on draft, vertical, and horizontal forces was significant, which is considered a desirable outcome and justifies the use of advanced modeling systems such as ANFIS.
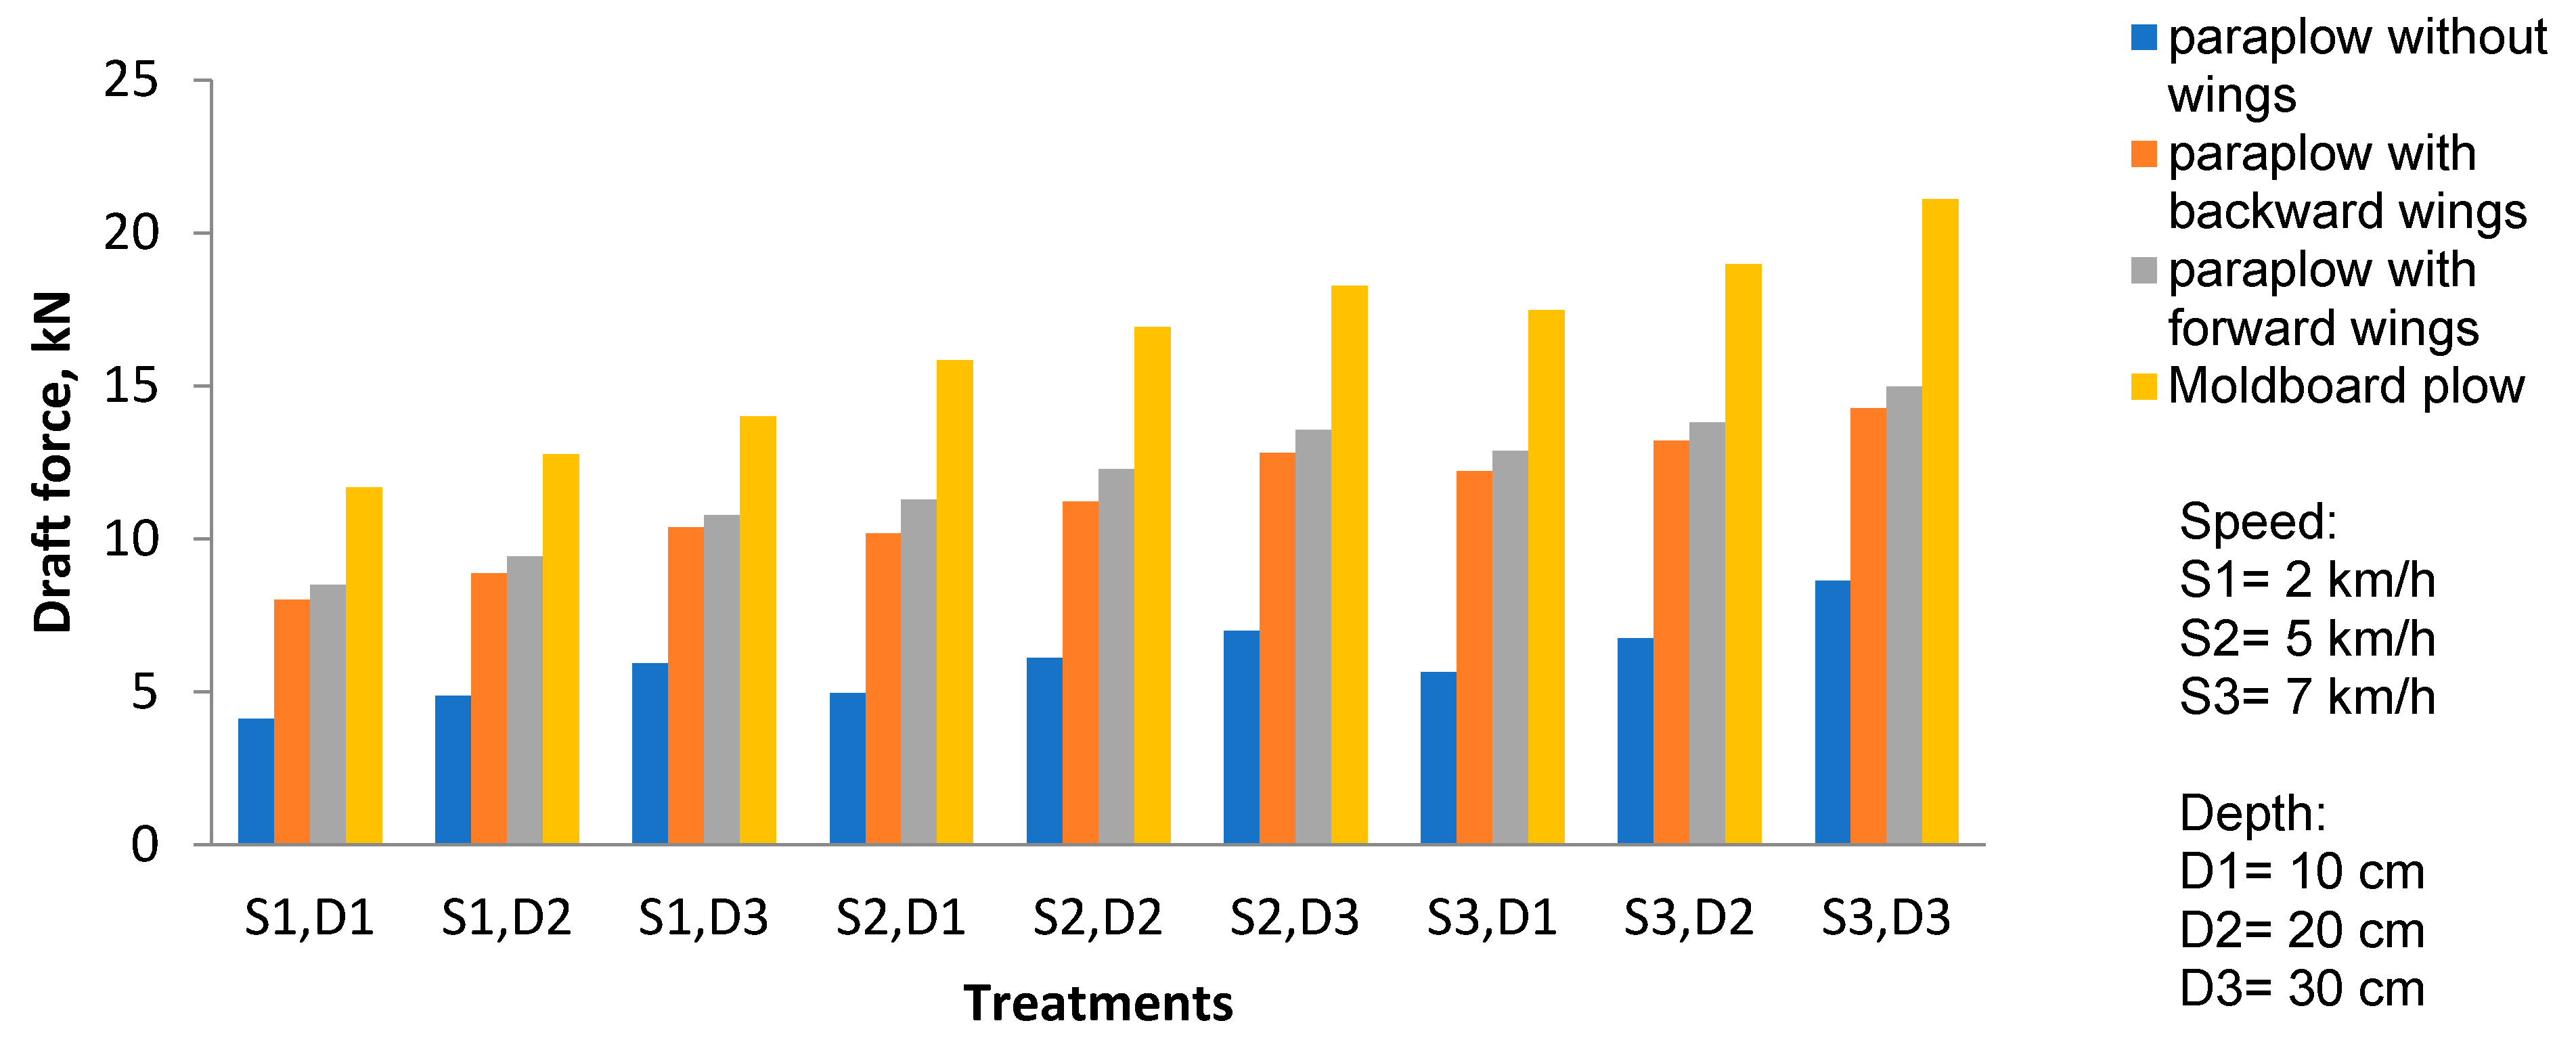
Figure 4 shows the variations of draft force (Fd) in different treatments. The results showed that the maximum draft force of 21.09 kN occurred for moldboard plow at a forward speed of 7 km/h and working depth of 30 cm. The least draft force of 4.11 kN was related to the para-plow without a wing, which was observed at a working depth of 10 cm and forward speed of 2 km/h. The results showed that with the increment of forward speed, the draft required force increased. As the working depth increased, the draft force for each of the tillage implements increased. The draft force increment, under increasing forward speed and working depth, was reported in the studies of many researchers [
10,
28,
29]. In all treatments, the draft force of the moldboard plow was higher compared to other implements. The draft force of the para-plow equipped with a backward-bent wing in all working speeds and depths was lower than para-plow equipped with backward-bent wings, which was predictable due to the shape of the wings and the higher interaction of wings with the soil in the para-plow equipped with forward-bent wings, and the results showed good consistency with the research by Askari et al. [
24]. The trend of the increase of draft force with the increase of working depth and forward speed occurred without sudden increase and linearly. This behavior of draft force variations was consistent with the report by Sharifat and Kushwaha [
30]. Also, by increasing the depth at the same speed, an increase in the draft force was observed in all treatments and for all implements, which was consistent with findings of Kirisci et al. [
12], Godwin et al. [
13], and Askari et al. [
15].
Figure 5 shows the effect of tillage type, forward speed, and working depth on the vertical resistance force. The highest vertical force of 2.82 kN was obtained using para-plow equipped with forward-bent wings, which occurred at forward speed of 7 km/h and working depth of 30 cm. Also, the least vertical force of 0.82 kN acted on the para-plow without wing at a speed of 2 km/h and working depth of 10 cm. For all implements, the increment in the vertical force happened with increasing working depth and forward speed. In the case of the moldboard plow, this increase occurred at a slower pace. However, at higher speeds, the increase in the vertical force acting on the moldboard plow showed a specific trend. Increasing the depth at the same speed led to larger increases in the vertical force, while this increase occurred with a slower slope with increasing speed at the same depth, which is consistent with the reports by Askari et al. [
24] and Kasisira and du Plessis [
31,
32]. The high vertical force in the para-plow equipped with forward-bent wings is an indication of the tendency of this implement to penetrate to the soil. This fact is also true for other types of para-plow (without wing and equipped with backward-bent wings). For this reason, in order to control the working depth of these implements, a depth control wheel was used to allow the implements to penetrate up to the desired depth. The need for using it was especially felt at high speeds, where the vertical force increased significantly.
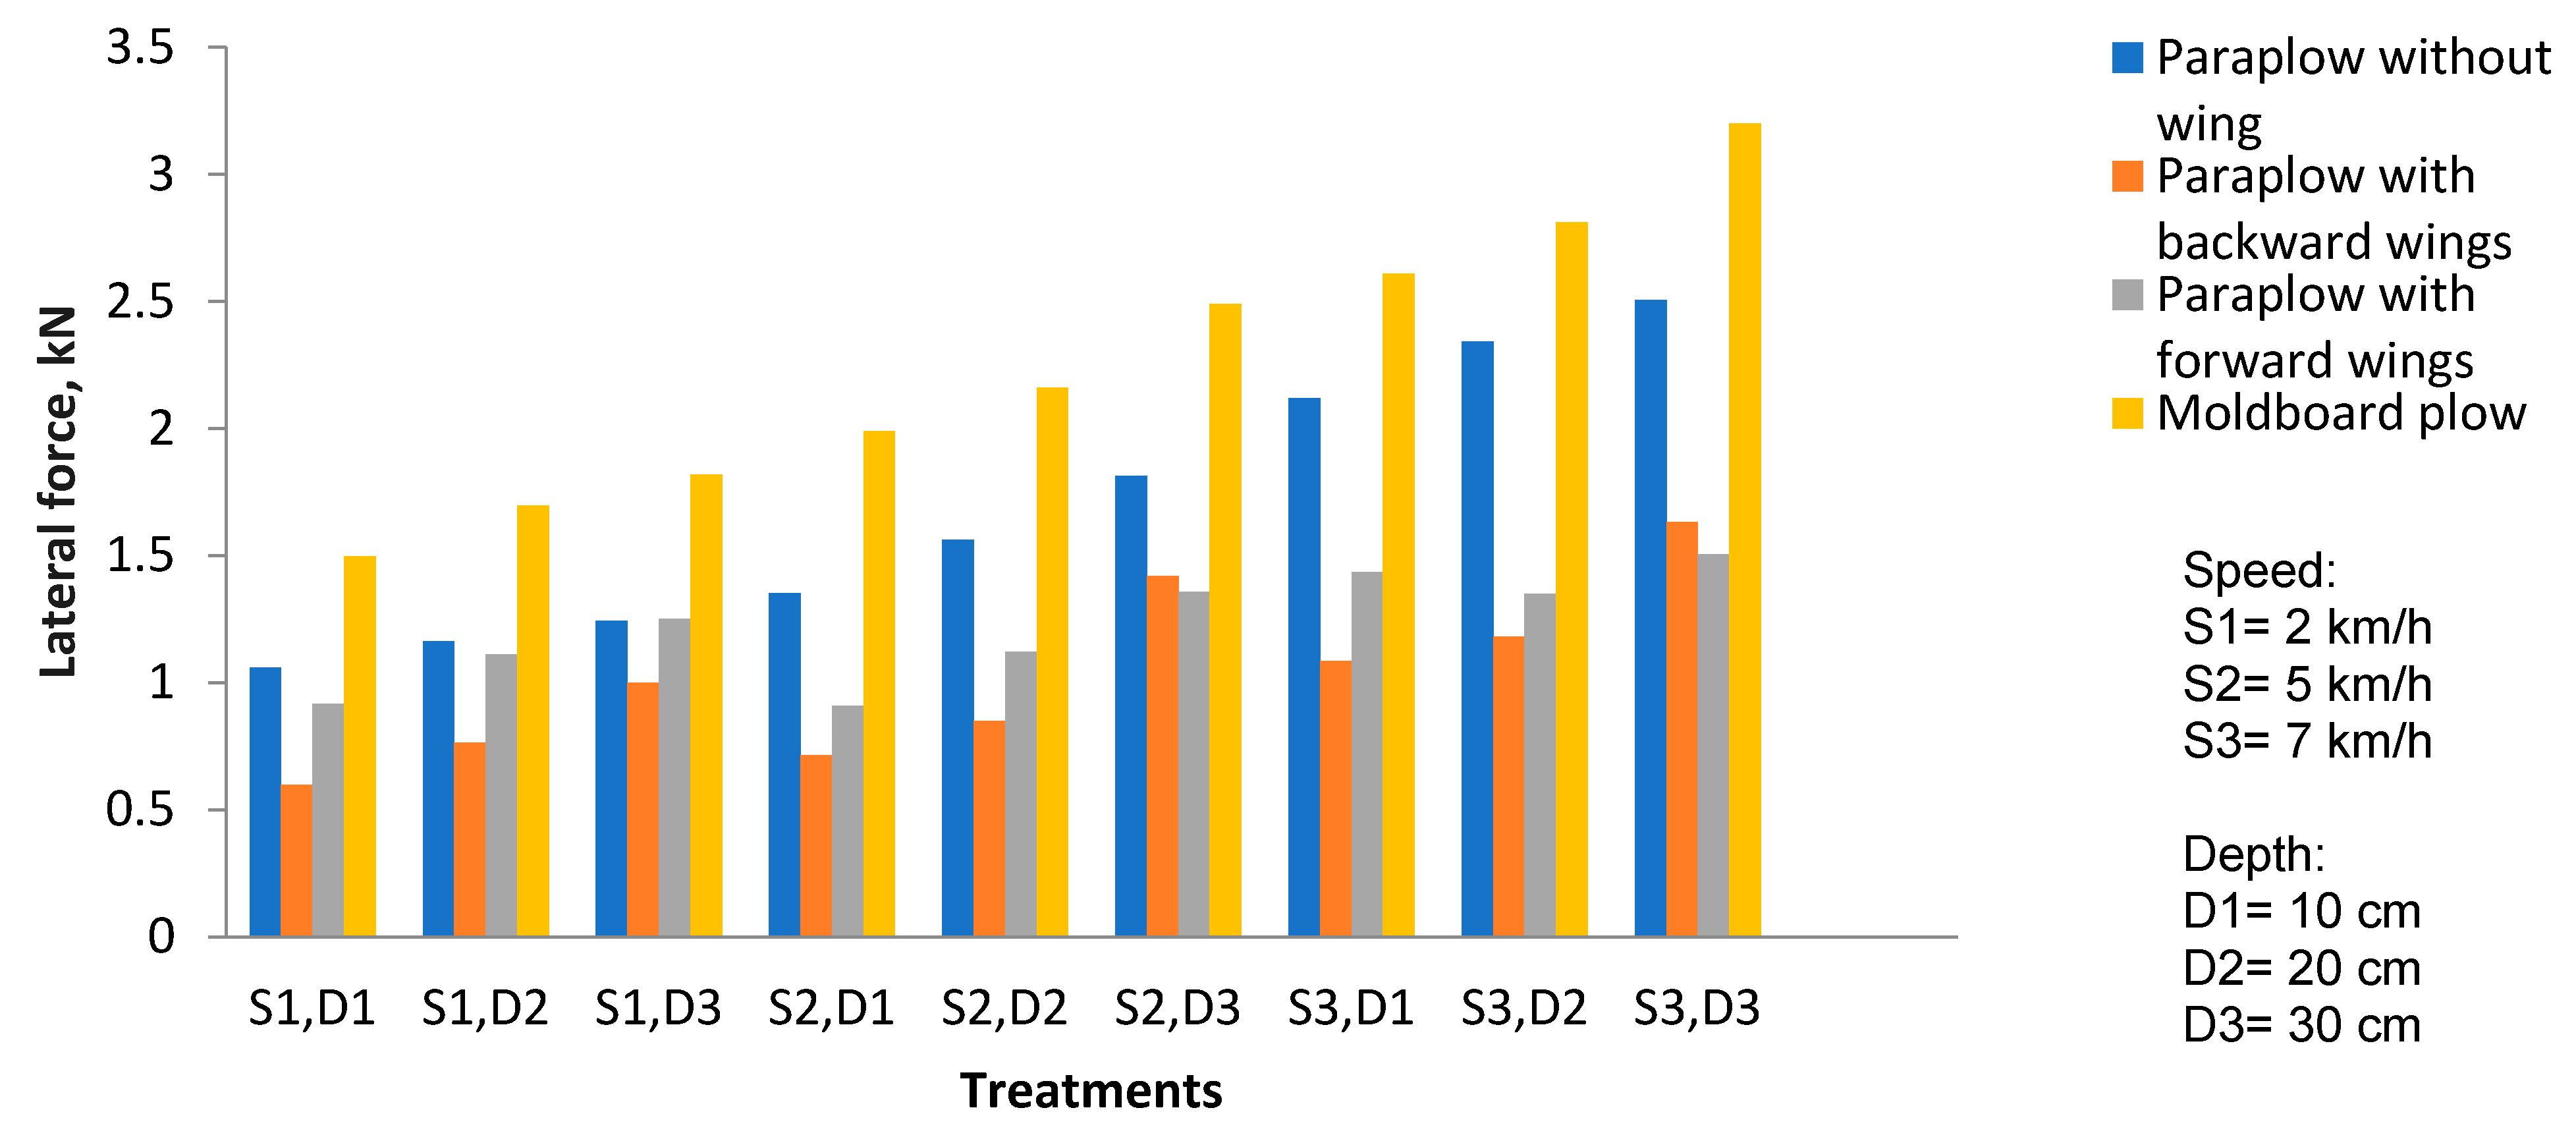
Figure 6 shows the effect of the tillage implement type, working speed, and working depth on the lateral forces. The highest lateral force of 3202 kN acted on the moldboard plow at a working depth of 30 cm and forward speed of 7 km/h, and the least lateral force of 0.598 kN occurred using para-plow equipped with backward-bent wings at a working depth of 10 cm and forward speed of 7 km/h. The increasing trend of the lateral force with the increase of working depth and forward speed was quite obvious, which is consistent with the report by Irshad Ali [
16]. The impact of adding wings to para-plow was significant, and greatly decreased the lateral forces and led to the greater balance of the para-plow. This fact is quite evident in the comparison of the lateral forces acting on the para-plow without wings and the para-plow equipped with wings (forward-bent and backward-bent). In most working conditions, para-plow with backward-bent wings showed lower lateral force compared to para-plow with forward-bent wings. The lateral force acting on the moldboard plow in different working conditions was almost twice as much as the lateral force acting the implements with wings. It happened due to the high volume of soil displaced by the plow, and it seemed that as the draft force increased, so did the lateral force acting on the implements.
Predicting Draft, Vertical, and Lateral Forces Acting on Implements Using ANFIS Model
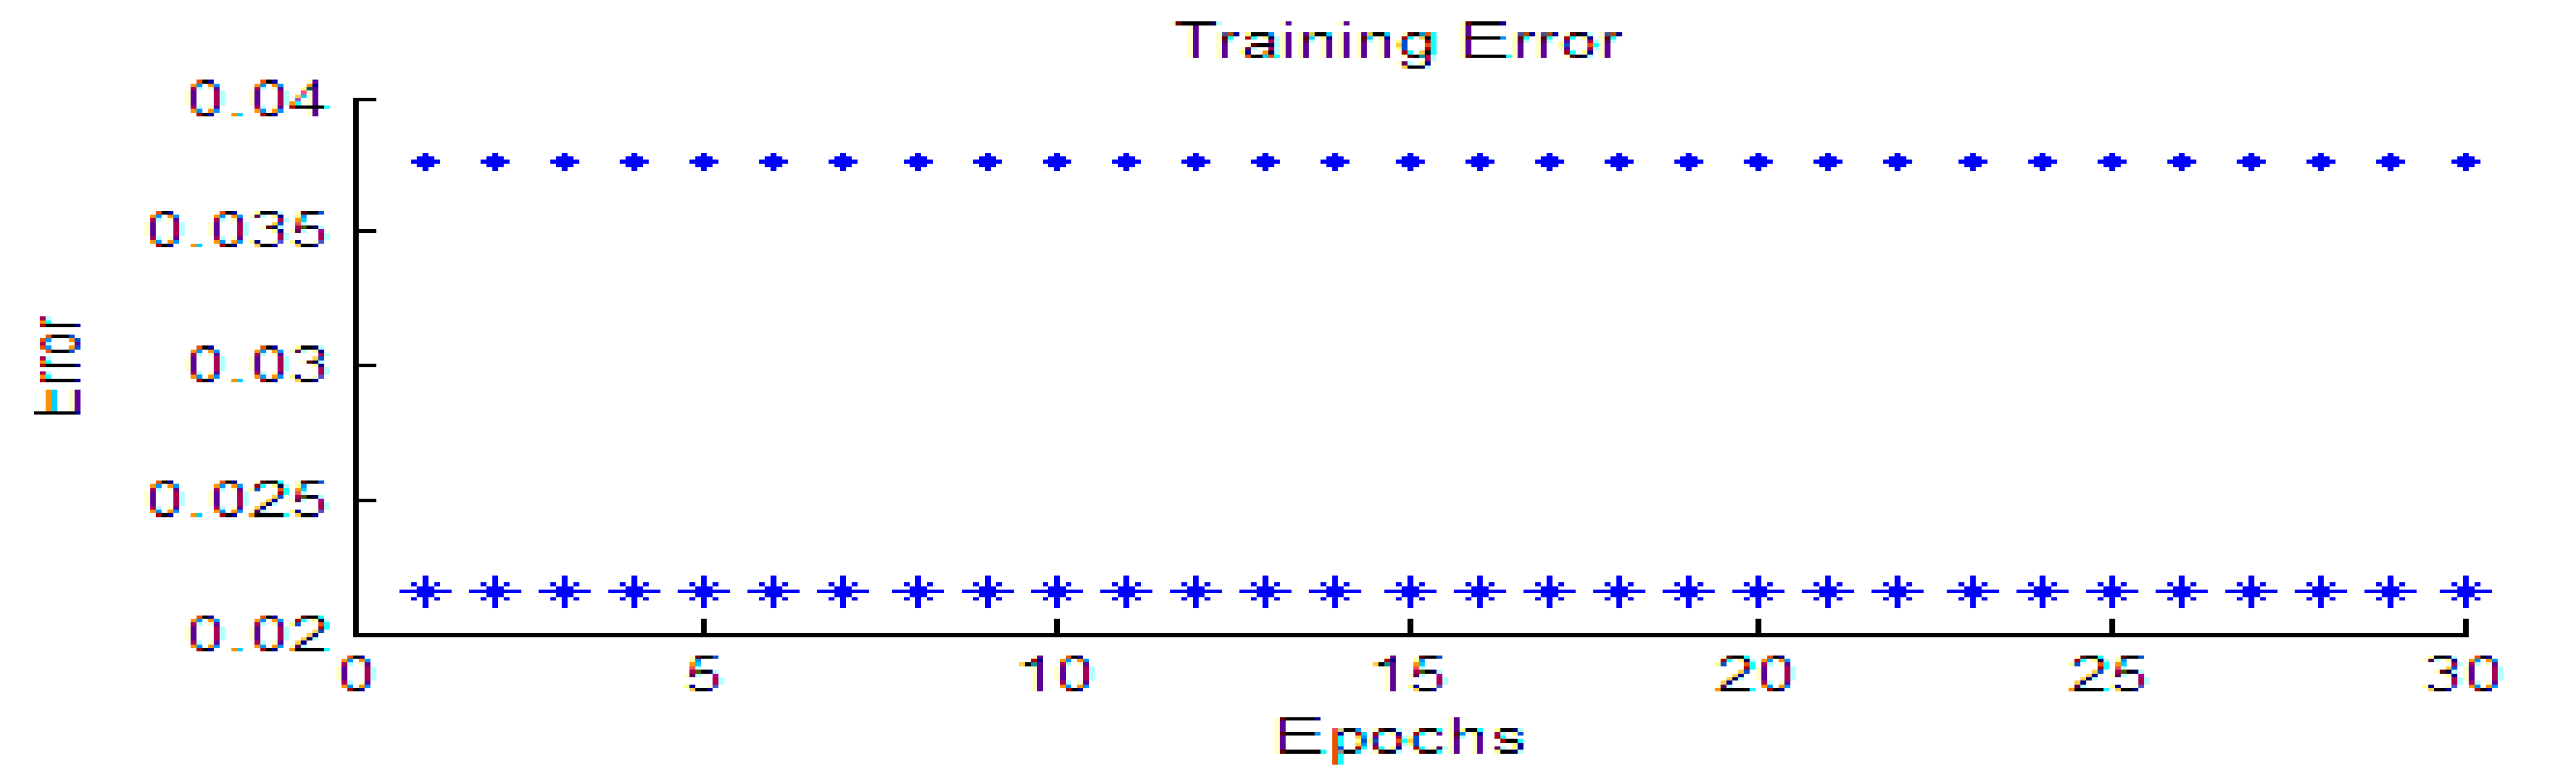
Figure 7 shows the relationship between the root mean square error (RMSE) and the optimization steps of training and checking data for draft force, where the error of the training data is marked with (*) and the error of the checking data is marked with (◊) symbol.
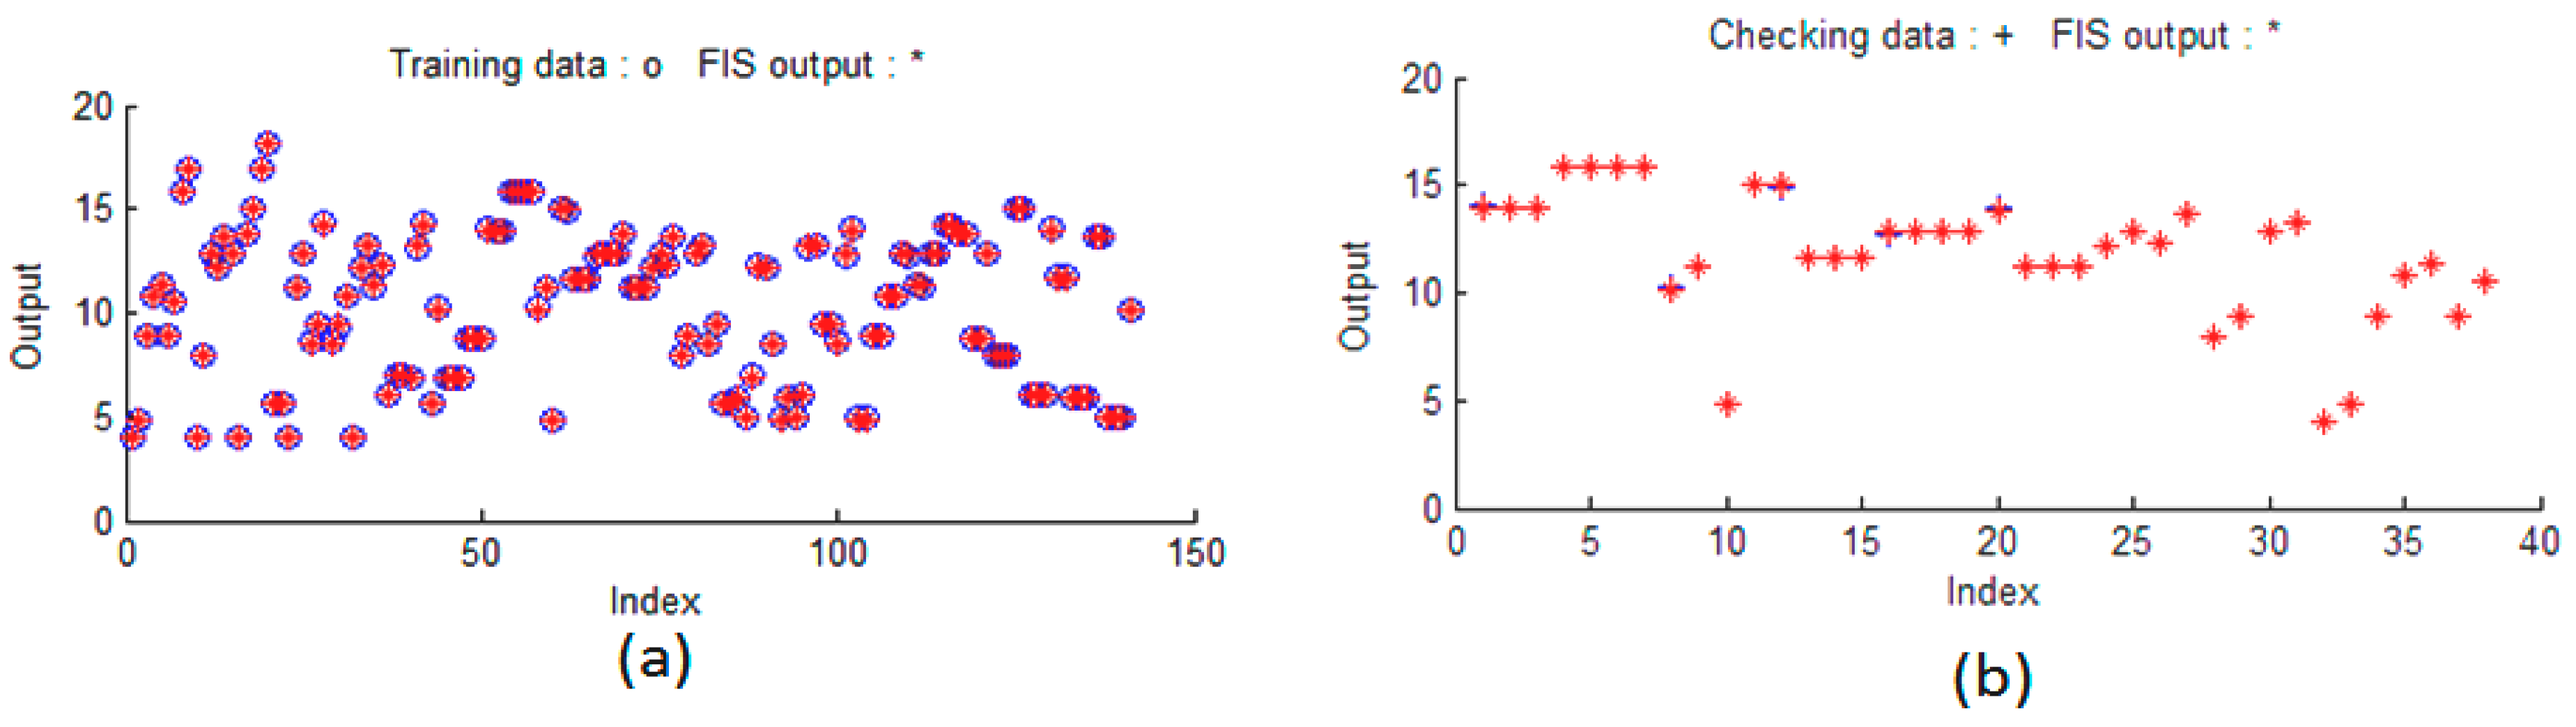
After training and validating the ANFIS model for different input parameters, the error values for the ANFIS model for the draft, vertical, and lateral forces were obtained equal to 0.376, 1.38, and 2.4, respectively. The output obtained from the ANFIS was compared with the training and checking data, and the results are shown in
Figure 8. In
Figure 8a, the training data are marked with (o) and the modeling data are marked with the (*) sign. In
Figure 8b, the validation data are marked with the (+) sign and the predictive data are marked with the (*) sign.
Table 3 presents the root mean square error for all three models, both for the training data and the validation data.
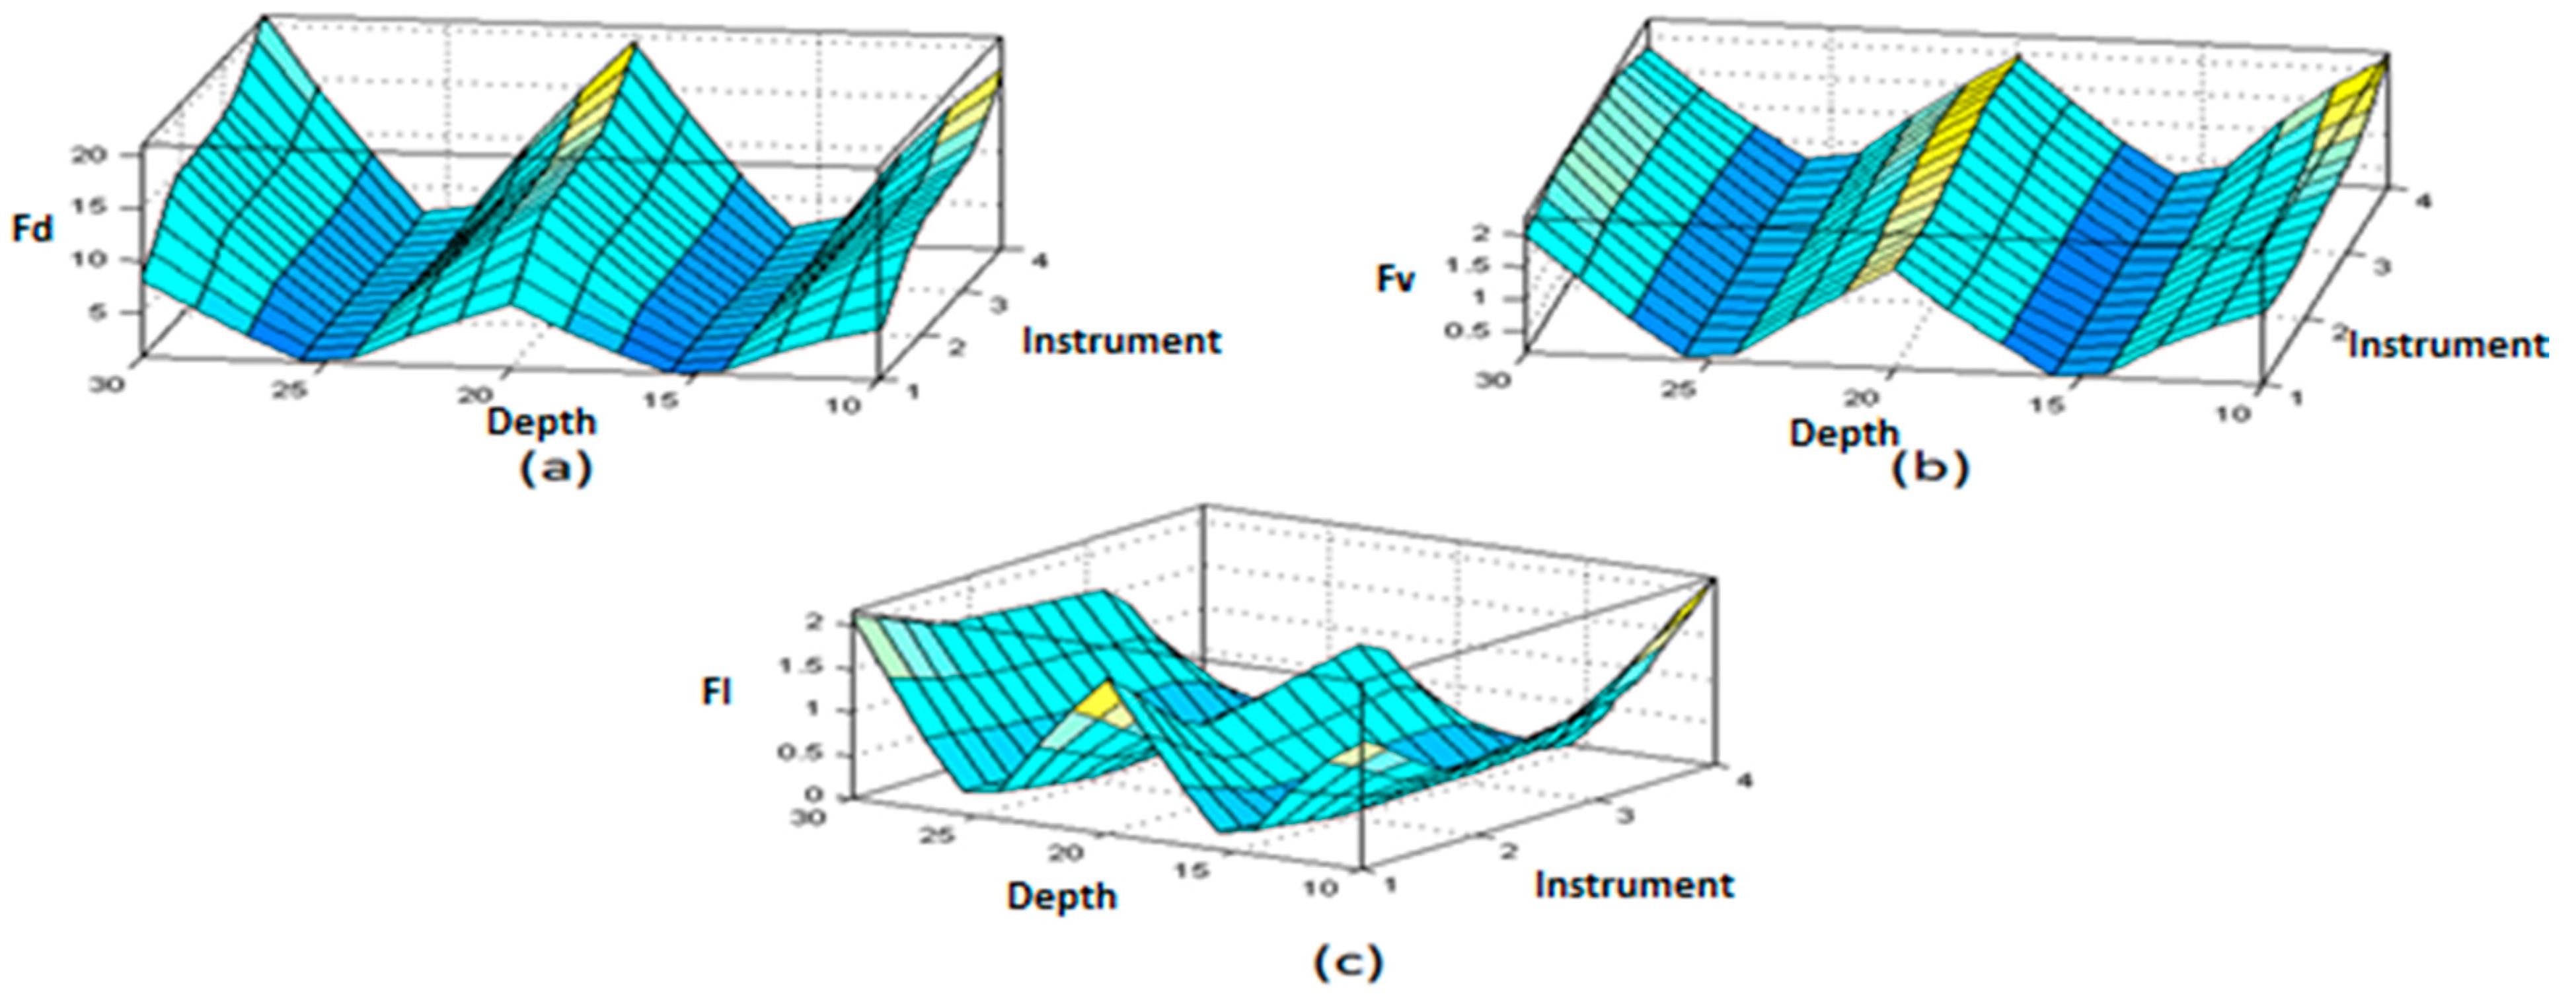
The output of the ANFIS system is presented in the two forms of surface graphs and rules. In the surface case, the output of the system was obtained in the form of three-dimensional graphs versus the input and output parameters.
Figure 9a shows the mutual effect of the type of implements and the working depth on the draft force. It was found that the highest draft force occurred for the moldboard plow at a working depth of 30 cm, and the least draft force was observed for para-plow without wings at a working depth of 10 cm. The draft force required for the para-plow equipped with a forward-bent wing was greater than the para-plow equipped with a backward-bent wing, which was true at different speeds and working depths.
Figure 9b,c also shows the mutual effect of the type of implements and the working depth on the measured vertical and lateral forces, respectively.
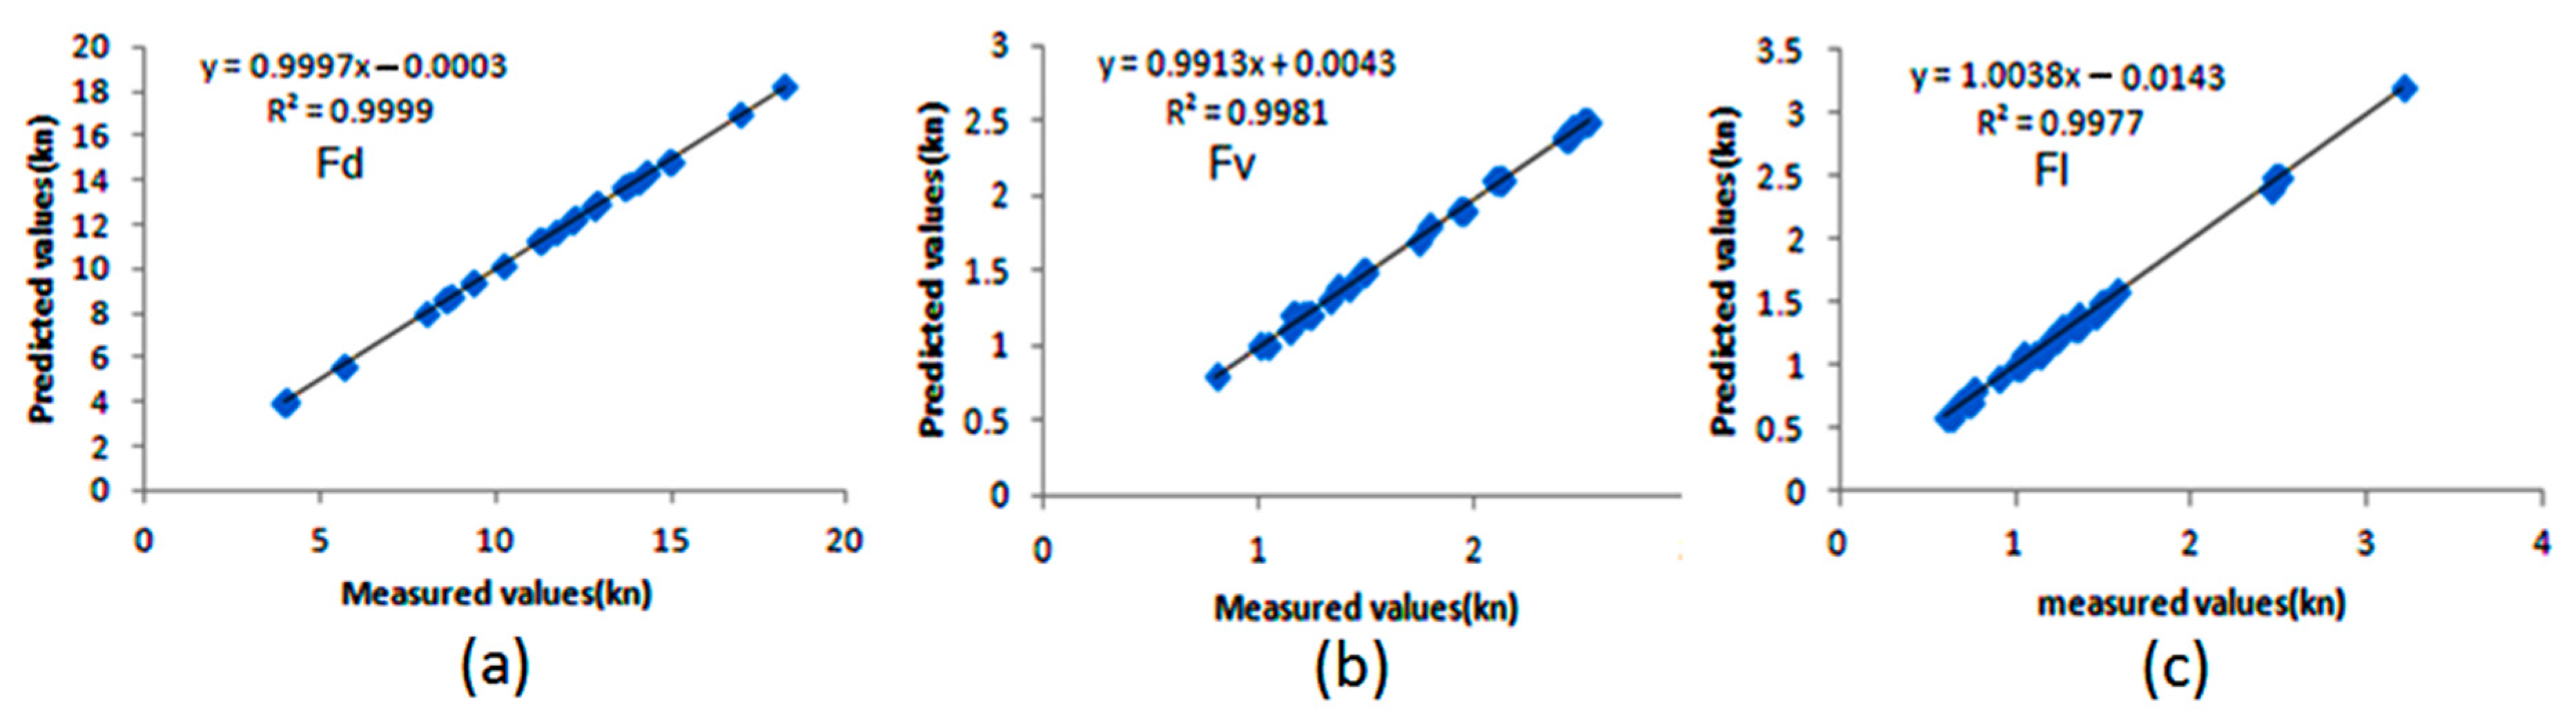
In order to determine the relationship between measured and predicted values in the presented models, a regression diagram was drawn and is shown in
Figure 10, which is an indication of a very high and acceptable coefficient of determination (
) for all three presented models.
Table 4 shows the characteristics of the models created and the evaluation of these models based on the root mean square, the relative error percentage, and the coefficient of determination (
) parameters. These results show a high accuracy compared to the neural network models presented for draft force by Roul et al. [
18], with a coefficient of determination of 0.934, and Akbarnia et al. [
20], with a mean relative error of 0.56. Also, a comparison of the results of ANFIS modeling with the neural network model of Pentoś and Pieczarka [
21], which was presented to predict the draft force using a neural network with the coefficient of determination of
= 0.945, indicates the high accuracy of ANFIS fuzzy neural systems.
4. Conclusions
In this research, the measurement of draft, vertical, and lateral forces acting on two tillage implements was studied at three forward speeds and three working depths. Modeling of the forces acting on the implements was also performed using the ANFIS fuzzy neural system. The results of the measurement of the forces showed that the main effects of the implements, the working depth, and the working speed each individually, on the measured forces, were significant. Also, the mutual and triple interaction effects of these parameters were found to be significant at a probability level of 1%. According to the obtained diagrams, it can be said that with the increment of the working speed and depth, the draft, vertical, and lateral forces increased. The highest draft force of 21.09 kN and lateral force of 3.2 kN was related to the moldboard plow, and the highest vertical force of 2.82 kN occurred in the case of para-plow equipped with forward-bent wings. The least draft force of 0.598 kN was observed in para-plow equipped with backward-bent wings. At all working speeds and depths, the lateral force acting on the para-plow without wing was almost twice as much as the force acting on the para-plows with wing, indicating the impact of adding the wing to the para-plow, which reduced the lateral force to a great extent and made the para-plow more balanced. Obtained data indicated that winged para-plow is a proper implement that can be used in tilling agricultural soils and showed a promising prospective in the future of primary tillage in terms of power saving.
In the continuation of this research, the modeling of draft, vertical, and lateral forces acting on the implements was performed using the effective parameters of the forward speed, the working depth, and the type of implements, using (ANFIS) fuzzy neural system. The prediction results showed the coefficient of determination () in all three models presented was above 0.99. The error rates for the models of the prediction of the draft, vertical, and lateral forces were obtained equal to 0.3756%, 1.385%, and 2.45%, respectively. The results showed that the (ANFIS) fuzzy neural system is a powerful tool for predicting the forces acting on the implements, and the data predicted by this model have very high accuracy.


 ,
, 


