Secondary Metabolite Differences between Naturally Grown and Conventional Coarse Green Tea


Abstract
1. Introduction
2. Materials and Methods
2.1. Metabolome Analysis
2.1.1. Metabolite Extraction
2.1.2. LC-MS Analysis of 2014–2017 Samples
- Empirical detection of compound peaks, calculation of accurate mass, calculation of compound peak intensity.
- Differentiation of simultaneous elution peaks with respect to the profile of adduct ion peaks, ionization mode, and natural 13C isotopic compound peaks.
- Matching between MS peaks and MS/MS data, calculation of 13C/12C isotope ratio with ion intensity in order to estimate C number in each compound, and estimation of ionization mode.
- Aggregation and sorting of compound peaks with respect to the elution time, accurate mass, and MS/MS patterns for all samples.
- Truncate the compound peaks with less than 2 times intensity of the mock sample.
2.1.3. LC-MS Analysis of 2018–2019 Samples
- Empirical detection of compound peaks, calculation of accurate mass, calculation of compound peak intensity
- Ionization status judgment
- Alignment of compound peaks
- Matching of calculated mean accurate mass with monoisotopic compounds in public database with the use of MF Searcher and derivation of a corresponding chemical formula
2.1.4. Integration of Metabolite Data of 2014–2019 Samples
2.1.5. Biological and Technical Replicate
2.2. Statistical Analysis
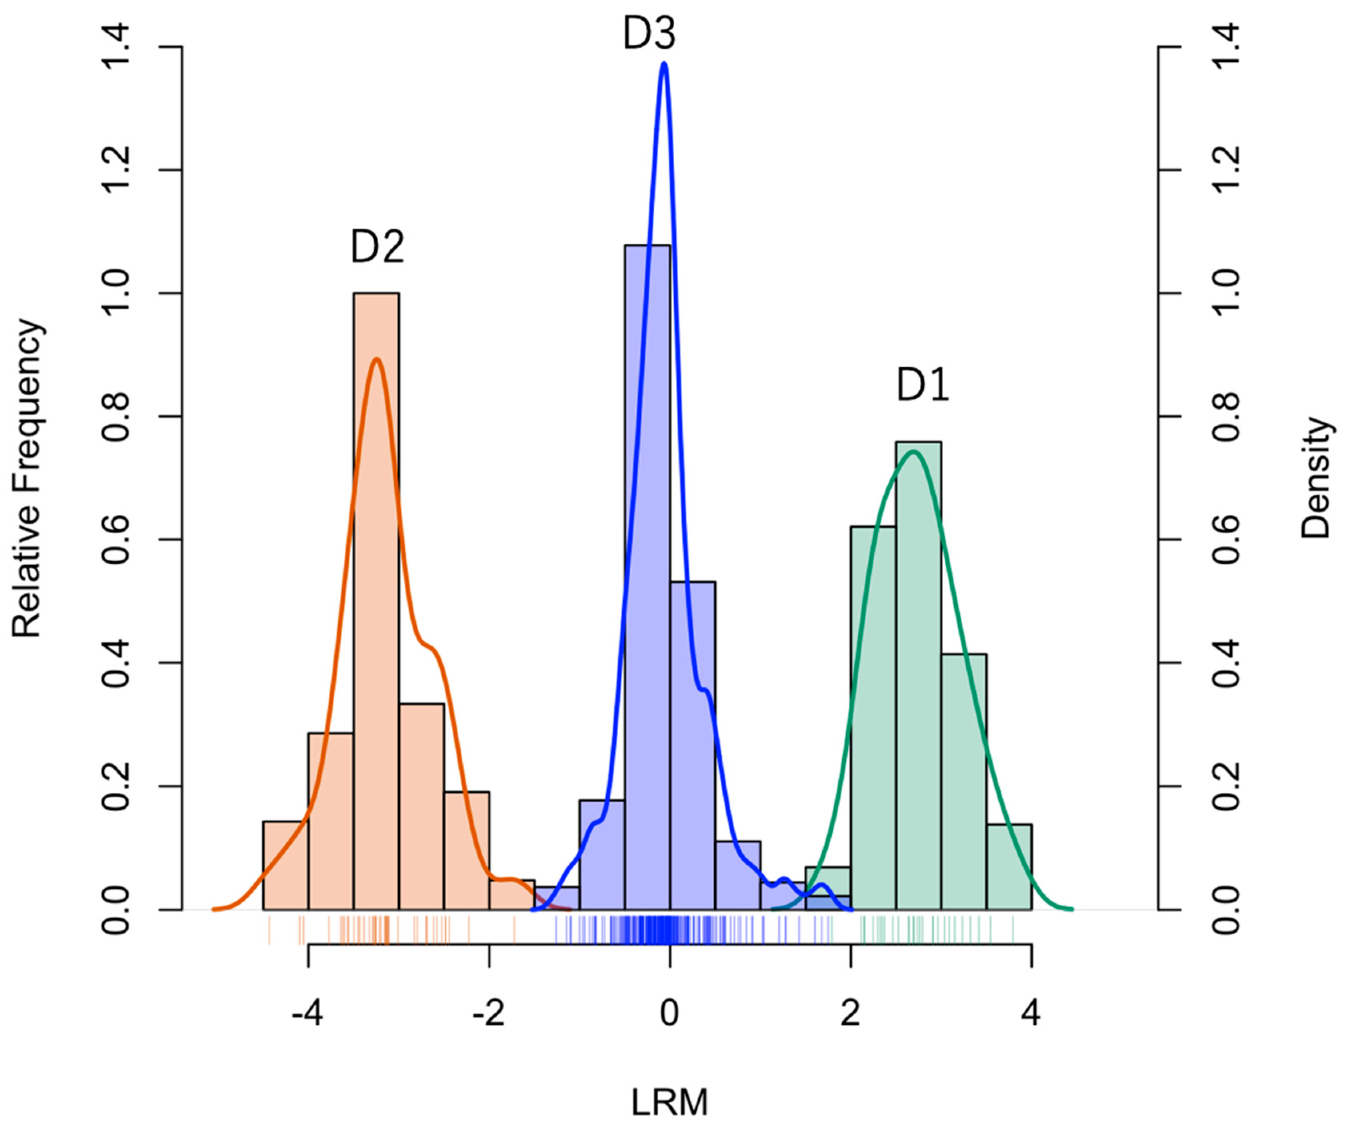
- D1:
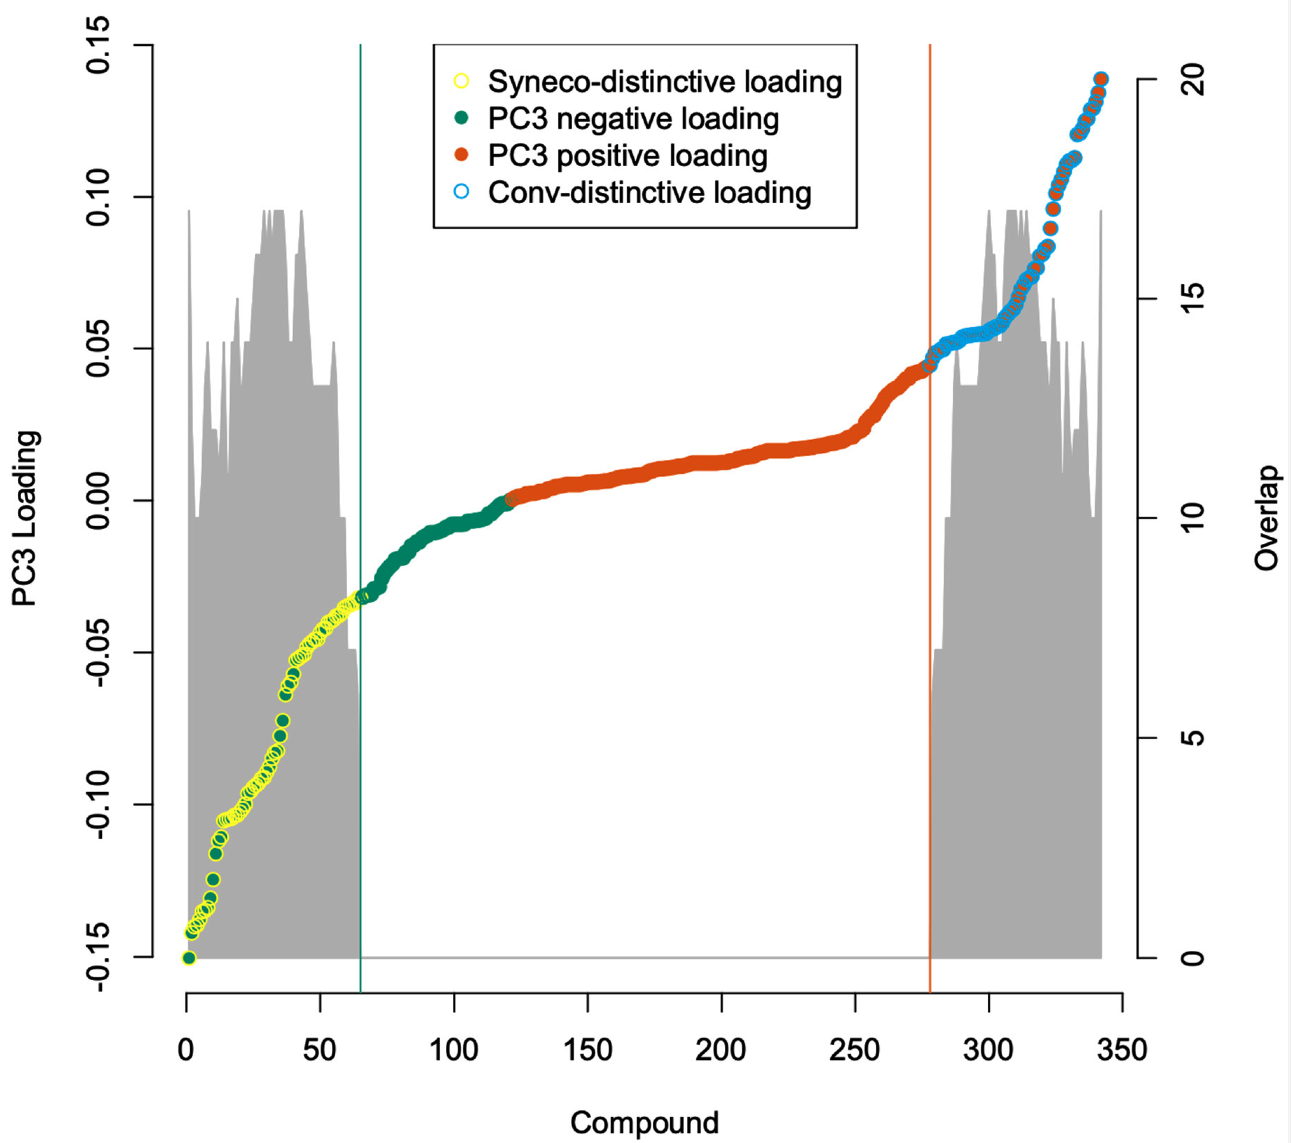
- Compounds expressed only in Syneco (hereafter Syneco-intrinsic compounds). The mean value of LRM is positive.
- D2:
- Compounds expressed only in Conv (hereafter Conv-intrinsic compounds). The mean value of LRM is negative.
- D3:
- Compounds expressed in both Syneco and Conv (hereafter the common compounds). The mean value of LRM can be either positive or negative)
2.3. Metabolome Categorization
3. Results
3.1. Metabolome Analysis
3.2. Statistical Analysis
3.3. Metabolome Categorization
4. Discussion
5. Conclusions
Supplementary Materials
Author Contributions
Funding
Acknowledgments
Conflicts of Interest
References
- Tilman, D.; Clark, M. Global diets link environmental sustainability and human health. Nature 2014, 515, 518–522. [Google Scholar] [CrossRef] [PubMed]
- Funabashi, M. Food components as markers linking health and environment: Statistical invariance analysis of in natura diet. Am. J. Biosci. Bioeng. 2015, 3, 183–196. [Google Scholar]
- Funabashi, M. Human augmentation of ecosystems: Objectives for food production and science by 2045. NPJ Sci. Food 2018, 2, 1–11. [Google Scholar] [CrossRef] [PubMed]
- Funabashi, M. Synecological Farming: Theoretical Foundation on Biodiversity Responses of Plant Communities. Plant Biotechnol. 2016, 33, 213–234. [Google Scholar] [CrossRef]
- Barnosky, A.D.; Matzke, N.; Tomiya, S.; Wogan, G.O.; Swartz, B.; Quental, T.B.; Marshall, C.; McGuire, J.L.; Lindsey, E.L.; Maguire, K.C.; et al. Has the Earth’s sixth mass extinction already arrived? Nature 2011, 471, 51–57. [Google Scholar] [CrossRef]
- Ceballos, G.; Ehrlich, P.R.; Raven, P.H. Vertebrates on the brink as indicators of biological annihilation and the sixth mass extinction. Proc. Natl. Acad. Sci. USA 2020, 117, 13596–13602. [Google Scholar] [CrossRef]
- Barnosky, A.D.; Hadly, E.A.; Bascompte, J.; Berlow, E.L.; Brown, J.H.; Fortelius, M.; Getz, W.M.; Harte, J.; Hastings, A.; Marquet, P.A.; et al. Approaching a state shift in Earth’s biosphere. Nature 2012, 486, 52–58. [Google Scholar] [CrossRef]
- WHO. Diet, Nutrition and the Prevention of Chronic Diseases; World Health Organization: Geneva, Switzerland, 2002. [Google Scholar]
- Tokoro, M. Open Systems Science: A Challenge to Open Systems Problems. In First Complex Systems Digital Campus World E-Conference 2015; Bourgine, P., Collet, P., Parrend, P., Eds.; Springer International Publishing: Cham, Switzerland, 2017; pp. 213–221. [Google Scholar]
- Huang, R.; McGrath, S.P.; Hirsch, P.R.; Clark, I.M.; Storkey, J.; Wu, L.; Zhou, J.; Liang, Y. Plant–microbe networks in soil are weakened by century-long use of inorganic fertilizers. Microb. Biotechnol. 2019, 12, 1464–1475. [Google Scholar] [CrossRef]
- Power, A.G. Ecosystem services and agriculture: Tradeoffs and synergies. Philos. Trans. R. Soc. Lond. B Biol. Sci. 2010, 365, 2959–2971. [Google Scholar] [CrossRef]
- Millennium Ecosystem Assessment. Ecosystems and human well-being-Synthesis: A report of the Millennium Ecosystem Assessment; Island Press: Washington, DC, USA, 2005. [Google Scholar]
- Daszak, P.; das Neves, C.; Amuasi, J.; Hayman, D.; Kuiken, T.; Roche, B.; Zambrana-Torrelio, C.; Buss, P.; Dundarova, H.; Feferholtz, Y.; et al. Workshop Report on Biodiversity and Pandemics of the Intergovernmental Platform on Biodiversity and Ecosystem Services; IPBES Secretariat: Bonn, Germany, 2020. [Google Scholar] [CrossRef]
- Dobson, A.P.; Pimm, S.L.; Hannah, L.; Kaufman, L.; Ahumada, J.A.; Ando, A.W.; Bernstein, A.; Busch, J.; Daszak, P.; Engelmann, J.; et al. Ecology and economics for pandemic prevention. Science 2020, 369, 379–381. [Google Scholar]
- Morand, S. Emerging diseases, livestock expansion and biodiversity loss are positively related at global scale. Biol. Conserv. 2020, 248, 108707. [Google Scholar] [CrossRef] [PubMed]
- Roossinck, M.J.; García-Arenal, F. Ecosystem simplification, biodiversity loss and plant virus emergence. Curr. Opin. Virol. 2015, 10, 56–62. [Google Scholar] [CrossRef] [PubMed]
- Sacristán, S.; Fraile, A.; García-Arenal, F. Population Dynamics of Cucumber mosaic virus in Melon Crops and in Weeds in Central Spain. Phytopathology 2004, 94, 992–998. [Google Scholar] [CrossRef] [PubMed][Green Version]
- Pongsiri, M.J.; Roman, J.; Ezenwa, V.O.; Goldberg, T.L.; Koren, H.S.; Newbold, S.C.; Ostfeld, R.S.; Pattanayak, S.K.; Salkeld, D.J. Biodiversity Loss Affects Global Disease Ecology. BioScience 2009, 59, 945–954. [Google Scholar] [CrossRef]
- Keesing, F.; Belden, L.K.; Daszak, P.; Dobson, A.; Harvell, C.D.; Holt, R.D.; Hudson, P.; Jolles, A.; Jones, K.E.; Mitchell, C.E.; et al. Impacts of biodiversity on the emergence and transmission of infectious diseases. Nature 2010, 468, 647–652. [Google Scholar] [CrossRef] [PubMed]
- Kanehisa, M.; Goto, S. KEGG: Kyoto Encyclopedia of Genes and Genomes. Nucleic Acids Res. 2000, 28, 27–30. [Google Scholar] [CrossRef]
- KEGG. Available online: https://www.genome.jp/kegg/ (accessed on 29 March 2020).
- Funabashi, M.; Hanappe, P.; Isozaki, T.; Maes, A.; Sasaki, T.; Steels, L.; Yoshida, K. Foundation of CS-DC e-laboratory: Open Systems Exploration for Ecosystems Leveraging. In First Complex Systems Digital Campus World E-Conference 2015; Bourgine, P., Collet, P., Parrend, P., Eds.; Springer International Publishing: Cham, Switzerland, 2017; pp. 351–374. [Google Scholar]
- Agilent. Available online: http://www.richrom.com/application/v2/public/upload/0/default/145.pdf (accessed on 29 March 2020).
- Thermo Fisher Scientific. Available online: https://www.thermoscientific.com/content/dam/tfs/ATG/CMD/CMD%20Marketing%20Material/MassSpectrometryCollateral/Brochures/BR30135_LTQOrbitrapXL_Brochure.pdf (accessed on 29 March 2020).
- Kessner, D.; Chambers, M.; Burke, R.; Agus, D.; Mallick, P. ProteoWizard: Open Source Software for Rapid Proteomics Tools Development. Bioinformatics 2008, 24, 2534–2536. [Google Scholar] [CrossRef]
- KOMICS. Available online: http://www.kazusa.or.jp/komics/ja/home-ja/news-ja/213-powerget-3-5-7.html (accessed on 29 March 2020).
- Sakurai, N.; Ara, T.; Kanaya, S.; Nakamura, Y.; Iijima, Y.; Enomoto, M.; Motegi, T.; Aoki, K.; Suzuki, H.; Shibata, D. An application of a relational database system for high-throughput prediction of elemental compositions from accurate mass values. Bioinformatics 2013, 29, 290–291. [Google Scholar] [CrossRef]
- Thermo Fisher Scientific. Available online: https://assets.thermofisher.com/TFS-Assets/CMD/brochures/BR-70133-LC-Dionex-UltiMate-3000-RSLC-BR70133-EN.pdf (accessed on 29 March 2020).
- Q Exactive. Available online: https://www.thermofisher.com/order/catalog/product/IQLAAEGAAPFALGMAZR (accessed on 29 March 2020).
- KOMICS. Available online: http://www.kazusa.or.jp/komics/en/tool-en/236-powergetbatch.html (accessed on 29 March 2020).
- Flavonoid Viewer. Available online: http://webs2.kazusa.or.jp/mfsearcher/flavonoidviewer/ (accessed on 29 March 2020).
- Brunner, E.; Munzel, U. The Nonparametric Behrens-Fisher Problem: Asymptotic Theory and a Small-Sample Approximation. Biom. J. 2000, 42, 17–25. [Google Scholar] [CrossRef]
- KEGG API. Available online: https://www.kegg.jp/kegg/rest/keggapi.html (accessed on 29 March 2020).
- KEGG BRITE. Available online: https://www.genome.jp/kegg/brite.html (accessed on 29 March 2020).
- KEGG PATHWAY. Available online: https://www.genome.jp/kegg/pathway.html (accessed on 29 March 2020).
- Funabashi, M. Synecological Farming for Mainstreaming Biodiversity in Smallholding Farms and Foods: Implication for Agriculture in India. Indian J. Plant Genet. Resour. 2017, 30, 99–114. [Google Scholar] [CrossRef]
- Rice, E.L. Allelopathy; Academic Press: New York, NY, USA, 1974. [Google Scholar]
- Middleton, E.J.R.; Kandaswami, C.; Theoharides, T.C. The effects of plant flavonoids on mammalian cells: Implications for inflammation, heart disease, and cancer. Pharmacol. Rev. 2000, 52, 673–751. [Google Scholar] [PubMed]
- Funabashi, M.; Ohta, K. Flavonoid-Rich Secondary Metabolites in naturally Grown Green Tea are Correlated with a Higher Shift of the Consumers’ Excise Level. J. Food Sci. Nutr. 2020, 6, 63. [Google Scholar] [CrossRef]
- Golisz, A.; Lata, B.; Gawronski, S.W.; Fujii, Y. Specific and total activities of the allelochemicals identified in Buckwheat. Weed Biol. Manag. 2007, 7, 164–171. [Google Scholar] [CrossRef]
- Yang, W.; Xu, X.; Li, Y.; Wang, Y.; Li, M.; Wang, Y.; Ding, X.; Chu, Z. Rutin-Mediated Priming of Plant Resistance to Three Bacterial Pathogens Initiating the Early SA Signal Pathway. PLoS ONE 2016, 11, e0146910. [Google Scholar] [CrossRef] [PubMed]
- Gross, R.L.; Newberne, P.M. Role of nutrition in immunologic function. Physiol. Rev. 1980, 60, 188–302. [Google Scholar] [CrossRef] [PubMed]
- Rail, L.C.; Meydani, S.N. Vitamin B6 and Immune Competence. Nutr. Rev. 1993, 51, 217–225. [Google Scholar] [CrossRef]
- Bello, M.D.G.; Knight, R.; Gilbert, J.A.; Blaser, M.J. Preserving microbial diversity. Science 2018, 362, 33–34. [Google Scholar] [CrossRef]
- Defois, C.; Ratel, J.; Garrait, G.; Denis, S.; Goff, O.L.; Talvas, J.; Mosoni, P.; Engel, E.; Peyret, P. Food Chemicals Disrupt Human Gut Microbiota Activity And Impact Intestinal Homeostasis As Revealed By In Vitro Systems. Sci. Rep. 2018, 8, 11006. [Google Scholar] [CrossRef]
- Clemente, J.C.; Pehrsson, E.C.; Blaser, M.J.; Sandhu, K.; Gao, Z.; Wang, B.; Magris, M.; Hidalgo, G.; Contreras, M.; Noya-Alarcón, Ó.; et al. The microbiome of uncontacted Amerindians. Sci. Adv. 2015, 1, e1500183. [Google Scholar] [CrossRef]
- Vudhivai, N.; Ali, A.; Pongpaew, P.; Changbumrung, S.; Vorasanta, S.; Kwanbujan, K.; Charoenlarp, P.; Migasena, P.; Schelp, F.P. Vitamin B1, B2 and B6 status of vegetarians. J. Med. Assoc. Thai. 1991, 74, 465–470. [Google Scholar]
- Douaud, G.; Refsum, H.; de Jager, C.A.; Jacoby, R.; Nichols, T.E.; Smith, S.M.; Smith, A.D. Preventing Alzheimer’s disease-related gray matter atrophy by B-vitamin treatment. Proc. Natl. Acad. Sci. USA 2013, 110, 9523–9528. [Google Scholar] [CrossRef] [PubMed]
- Bredesen, D.E.; Sharlin, K.; Jenkins, D.; Okuno, M.; Youngberg, W.; Cohen, S.H.; Stefani, A.; Brown, R.L.; Conger, S.; Tanio, C.; et al. Reversal of Cognitive Decline: 100 Patients. J. Alzheimers Dis. Parkinsonism 2018, 8, 450. [Google Scholar] [CrossRef]
- Shetty, P.; Youngberg, W. Clinical Lifestyle Medicine Strategies for Preventing and Reversing Memory Loss in Alzheimer’s. Am. J. Lifestyle Med. 2018, 12, 391–395. [Google Scholar] [CrossRef] [PubMed]
- Begum, N.; Qin, C.; Ahanger, M.A.; Raza, S.; Khan, M.I.; Ashraf, M.; Ahmed, N.; Zhang, L. Role of Arbuscular Mycorrhizal Fungi in Plant Growth Regulation: Implications in Abiotic Stress Tolerance. Front. Plant Sci. 2019, 10, 1068. [Google Scholar] [CrossRef] [PubMed]
- Liu, R.H. Health benefits of fruit and vegetables are from additive and synergistic combinations of phytochemicals. Am. J. Clin. Nutr. 2003, 78, 517S–520S. [Google Scholar] [CrossRef] [PubMed]
- Nishi, A.; Ohbuchi, K.; Kushida, H.; Matsumoto, T.; Lee, K.; Kuroki, H.; Nabeshima, S.; Shimobori, C.; Komokata, N.; Kanno, H.; et al. Deconstructing the traditional Japanese medicine “Kampo”: Compounds, metabolites and pharmacological profile of maoto, a remedy for flu-like symptoms. NPJ Syst. Biol. Appl. 2017, 3, 1–11. [Google Scholar] [CrossRef]


| Measurement | Parameters w.r.t. Sampling Year | ||||||
|---|---|---|---|---|---|---|---|
| Replicate | Method | 2014 | 2015 | 2016 | 2017 | 2018 | 2019 |
| Biological replicate | Plant-wise Area-wise | Averaged | Averaged | Averaged | Averaged | Averaged | Averaged |
| Product replicate | Teabag-wise | 3 | 3 | 3 | 3 | 3 | 3 |
| Technical replicate | Photospectrometry (absorbance error) | 3 (1/100–1/10,000) | 3 (1/100–1/10,000) | 3 (1/40–1/1000) | 3 (1/50–1/1000) | 3 (1/40–1/10,000) | 3 (1/100–1/10,000) |
| LC-MS (intensity error) | 1 (estimated CV: 10–20%) | 1 (estimated CV: 10–20%) | 1 (estimated CV: 10–20%) | 1 (estimated CV: 10–20%) | 3 (measured CV: 16.2%) | 3 (measured CV: 16.8%) | |
| HPLC | Agilent 1200 series | Ultimate 3000 RSLC | |||||
| Tea Sampling and Processing | Same protocol | ||||||
| Syneco | Conv | |||
|---|---|---|---|---|
| # Formulae | Uncertainty Score | # Formulae | Uncertainty Score | |
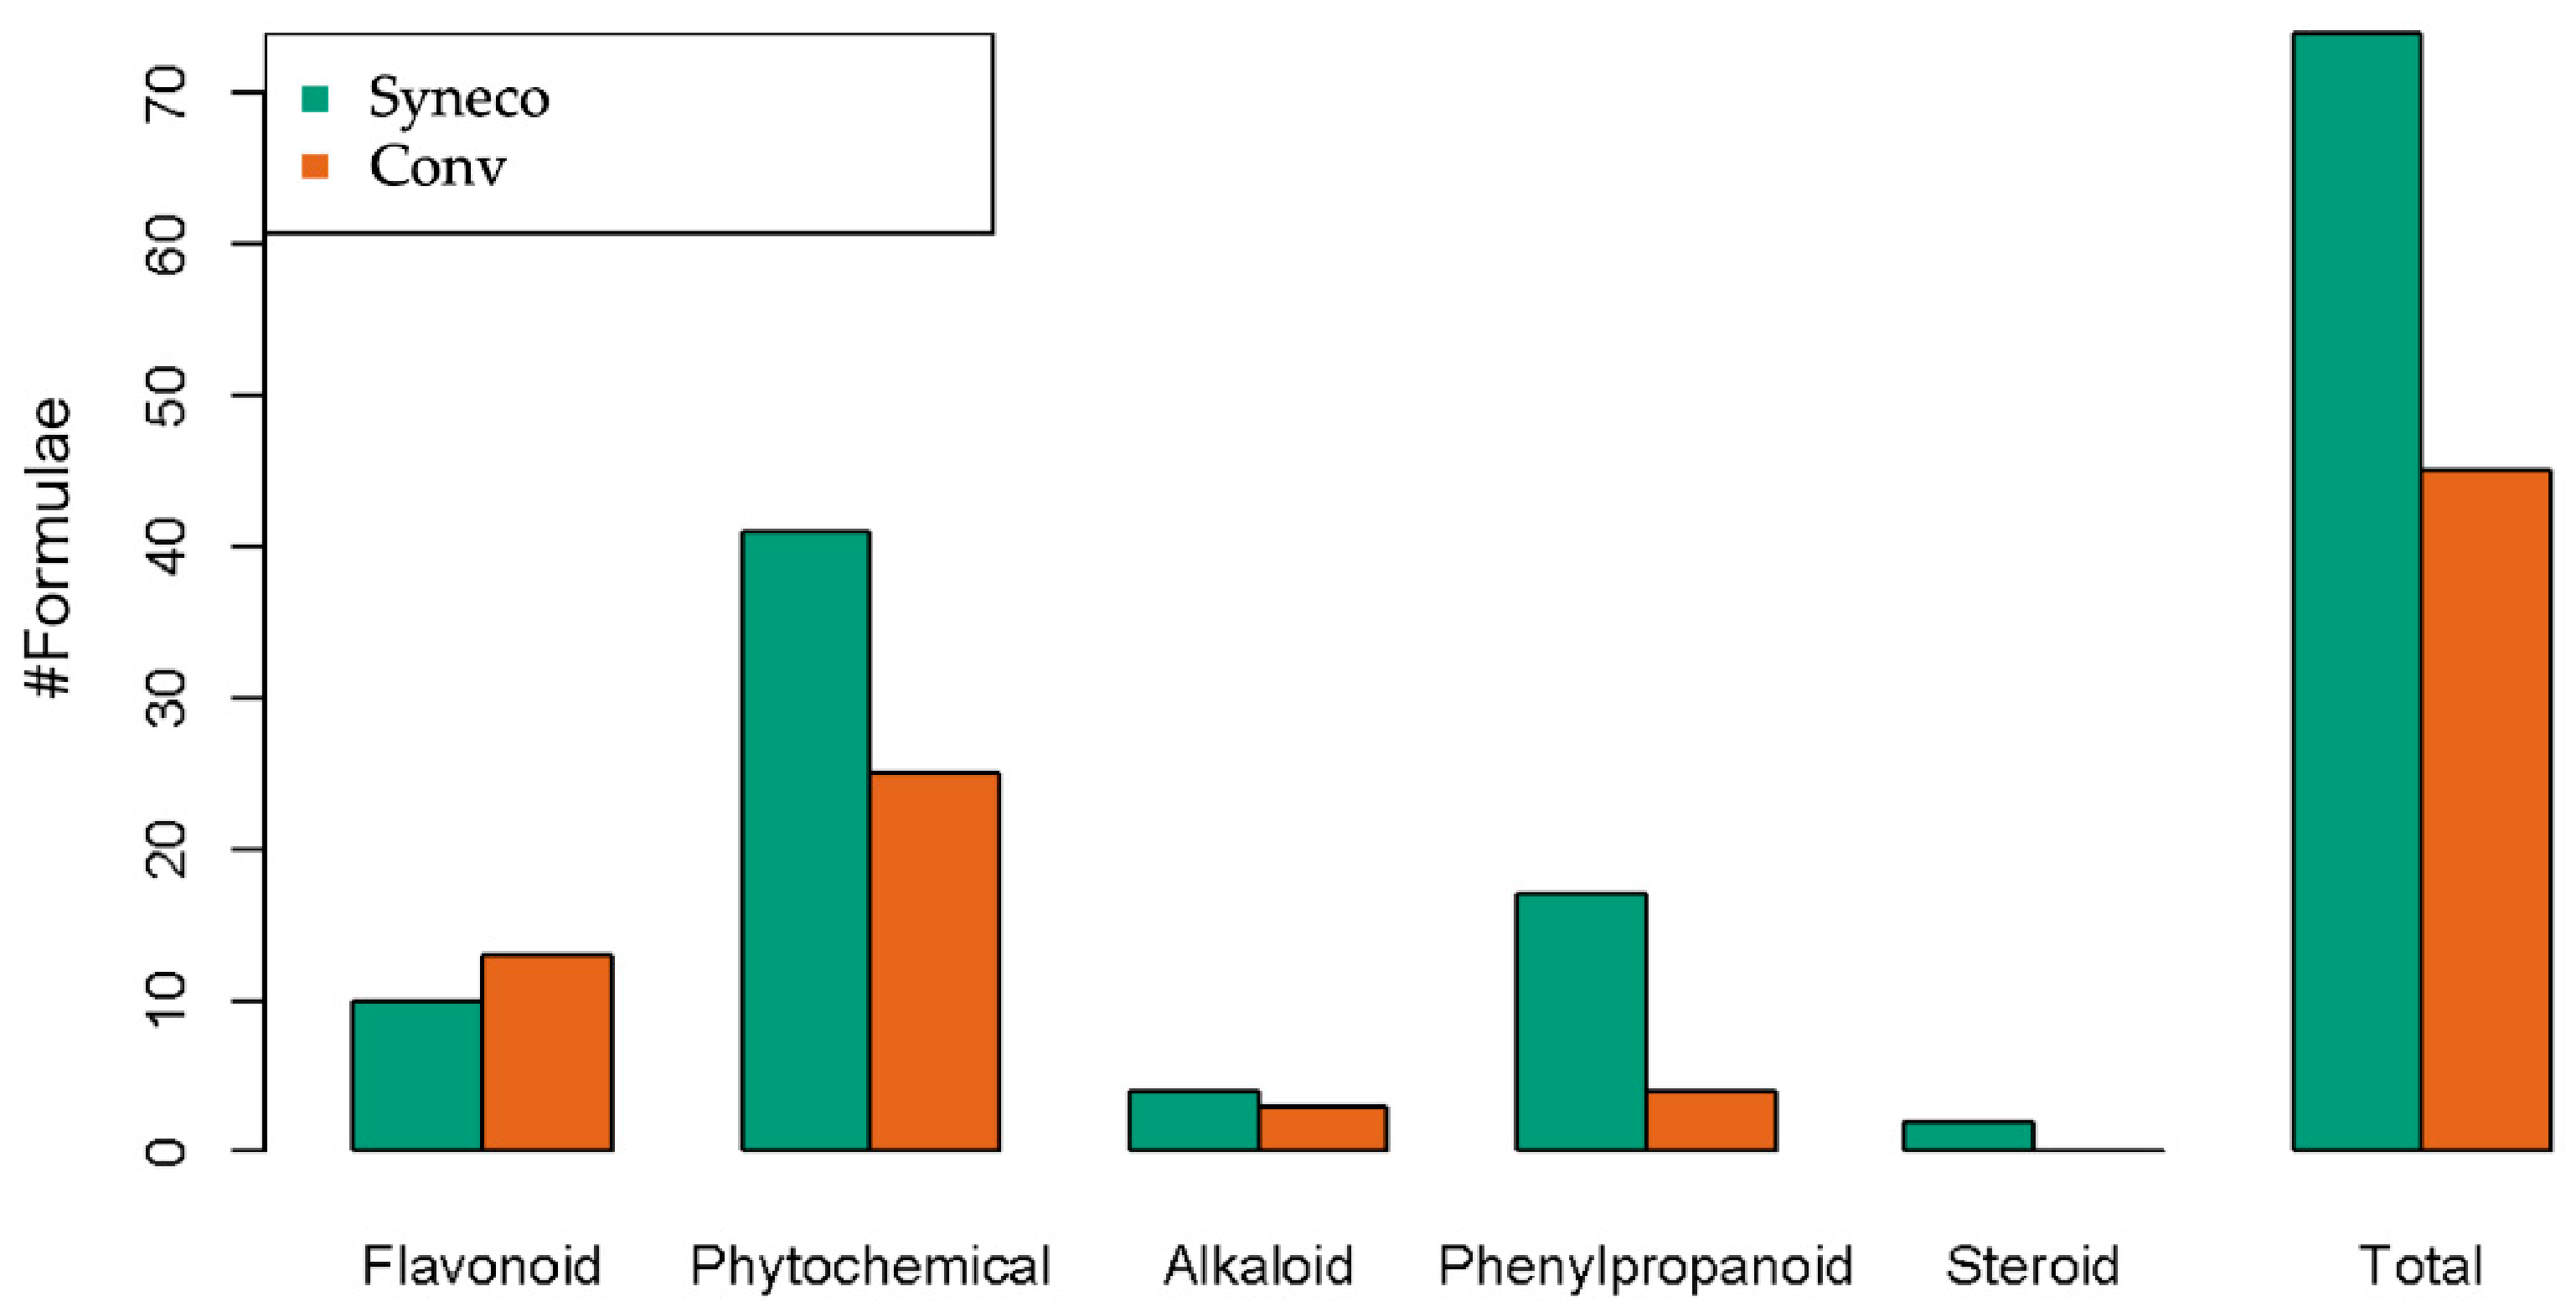
| Flavonoid | 10 | 4.075 | 13 | 6.751587 |
| Phytochemical | 41 | 15.98387 | 25 | 12.61299 |
| Alkaloid | 4 | 3.125 | 3 | 1.47619 |
| Phenylpropanoid | 17 | 3.904167 | 4 | 1.821429 |
| Steroid | 2 | 1.083333 | 0 | - |
| Total | 74 | 28.17137 | 45 | 22.662196 |
| Culture Condition | Syneco | Conv | ||||||
|---|---|---|---|---|---|---|---|---|
| Category | # Formulae | Uncertainty Score | # Formulae | Uncertainty Score | ||||
| All Categories | 152 | 39.32423687 | 226 | 56.47841953 | ||||
| 1. Metabolism | 147 | 38.19923687 | 168 | 42.42704868 | ||||
| 1.0 Global and overview maps | 57 | 15.5296398 | 56 | 17.70079175 | ||||
| map01100 | Metabolic pathways | 18 | 5.601724664 | 20 | 8.437734488 | |||
| map01110 | Biosynthesis of secondary metabolites | 21 | 5.025534188 | 17 | 5.276477178 | |||
| map01120 | Microbial metabolism in diverse environments | 9 | 2.84702381 | 5 | 1.382539683 | |||
| map01200 | Carbon metabolism | 1 | 1 | 1 | 0.071428571 | |||
| map01210 | 2-Oxocarboxylic acid metabolism | 2 | 0.333333333 | 6 | 1.166305916 | |||
| map01230 | Biosynthesis of amino acids | 1 | 0.166666667 | 6 | 1.166305916 | |||
| map01220 | Degradation of aromatic compounds | 5 | 0.555357143 | 1 | 0.2 | |||
| 1.1 Carbohydrate metabolism | 0 | 0 | 4 | 0.285714286 | ||||
| map00020 | Citrate cycle (TCA cycle) | 0 | 0 | 1 | 0.071428571 | |||
| map00040 | Pentose and glucuronate interconversions | 0 | 0 | 1 | 0.071428571 | |||
| map00053 | Ascorbate and aldarate metabolism | 0 | 0 | 1 | 0.071428571 | |||
| map00630 | Glyoxylate and dicarboxylate metabolism | 0 | 0 | 1 | 0.071428571 | |||
| 1.2 Energy metabolism | 2 | 1.125 | 2 | 0.182539683 | ||||
| map00720 | Carbon fixation pathways in prokaryotes | 1 | 1 | 1 | 0.071428571 | |||
| map00680 | Methane metabolism | 1 | 0.125 | 1 | 0.111111111 | |||
| 1.3 Lipid metabolism | 2 | 1.5 | 1 | 0.2 | ||||
| map00061 | Fatty acid biosynthesis | 1 | 0.5 | 0 | 0 | |||
| map00073 | Cutin, suberine and wax biosynthesis | 0 | 0 | 1 | 0.2 | |||
| map00140 | Steroid hormone biosynthesis | 1 | 1 | 0 | 0 | |||
| 1.4 Nucleotide metabolism | 0 | 0 | 2 | 0.666666667 | ||||
| map00230 | Purine metabolism | 0 | 0 | 2 | 0.666666667 | |||
| 1.5 Amino acid metabolism | 11 | 1.476190476 | 18 | 6.015151515 | ||||
| map00250 | Alanine, aspartate and glutamate metabolism | 0 | 0 | 1 | 0.071428571 | |||
| map00260 | Glycine, serine and threonine metabolism | 0 | 0 | 1 | 0.142857143 | |||
| map00270 | Cysteine and methionine metabolism | 0 | 0 | 1 | 1 | |||
| map00310 | Lysine degradation | 0 | 0 | 1 | 1 | |||
| map00220 | Arginine biosynthesis | 0 | 0 | 2 | 0.75 | |||
| map00330 | Arginine and proline metabolism | 0 | 0 | 2 | 1.25 | |||
| map00350 | Tyrosine metabolism | 5 | 0.580357143 | 2 | 0.611111111 | |||
| map00360 | Phenylalanine metabolism | 3 | 0.3125 | 2 | 0.202020202 | |||
| map00380 | Tryptophan metabolism | 1 | 0.25 | 3 | 0.642857143 | |||
| map00400 | Phenylalanine, tyrosine and tryptophan biosynthesis | 2 | 0.333333333 | 3 | 0.344877345 | |||
| 1.6 Metabolism of other amino acids | 0 | 0 | 4 | 1.702020202 | ||||
| map00410 | beta-Alanine metabolism | 0 | 0 | 1 | 1 | |||
| map00440 | Phosphonate and phosphinate metabolism | 0 | 0 | 1 | 0.5 | |||
| map00460 | Cyanoamino acid metabolism | 0 | 0 | 2 | 0.202020202 | |||
| 1.8 Metabolism of cofactors and vitamins | 4 | 2.666666667 | 3 | 1.222222222 | ||||
| map00730 | Thiamine metabolism | 0 | 0 | 1 | 0.111111111 | |||
| map00770 | Pantothenate and CoA biosynthesis | 0 | 0 | 1 | 1 | |||
| map00785 | Lipoic acid metabolism | 1 | 0.5 | 0 | 0 | |||
| map00790 | Folate biosynthesis | 1 | 1 | 0 | 0 | |||
| map00670 | One carbon pool by folate | 1 | 1 | 0 | 0 | |||
| map00130 | Ubiquinone and other terpenoid-quinone biosynthesis | 1 | 0.166666667 | 1 | 0.111111111 | |||
| 1.9 Metabolism of terpenoids and polyketides | 8 | 1.825213675 | 12 | 3.258363712 | ||||
| map00900 | Terpenoid backbone biosynthesis | 0 | 0 | 1 | 0.052631579 | |||
| map00902 | Monoterpenoid biosynthesis | 2 | 1.076923077 | 0 | 0 | |||
| map00909 | Sesquiterpenoid and triterpenoid biosynthesis | 1 | 0.011111111 | 2 | 0.14354067 | |||
| map00904 | Diterpenoid biosynthesis | 0 | 0 | 1 | 0.125 | |||
| map00981 | Insect hormone biosynthesis | 1 | 0.166666667 | 2 | 0.14354067 | |||
| map00908 | Zeatin biosynthesis | 0 | 0 | 1 | 1 | |||
| map00903 | Limonene and pinene degradation | 1 | 0.076923077 | 0 | 0 | |||
| map00281 | Geraniol degradation | 1 | 0.076923077 | 0 | 0 | |||
| map01059 | Biosynthesis of enediyne antibiotics | 1 | 0.25 | 1 | 0.111111111 | |||
| map01057 | Biosynthesis of type II polyketide products | 0 | 0 | 2 | 1.5 | |||
| map01053 | Biosynthesis of siderophore group nonribosomal peptides | 0 | 0 | 1 | 0.071428571 | |||
| map01055 | Biosynthesis of vancomycin group antibiotics | 1 | 0.166666667 | 1 | 0.111111111 | |||
| 1.10 Biosynthesis of other secondary metabolites | 33 | 9.054700855 | 36 | 6.420779221 | ||||
| map00232 | Caffeine metabolism | 1 | 1 | 0 | 0 | |||
| map00333 | Prodigiosin biosynthesis | 1 | 0.076923077 | 0 | 0 | |||
| map00940 | Phenylpropanoid biosynthesis | 8 | 1.2875 | 4 | 0.785353535 | |||
| map00945 | Stilbenoid, diarylheptanoid and gingerol biosynthesis | 0 | 0 | 2 | 0.583333333 | |||
| map00941 | Flavonoid biosynthesis | 5 | 1.625 | 6 | 1.242063492 | |||
| map00944 | Flavone and flavonol biosynthesis | 5 | 2.45 | 3 | 0.485714286 | |||
| map00942 | Anthocyanin biosynthesis | 0 | 0 | 1 | 0.5 | |||
| map00943 | Isoflavonoid biosynthesis | 1 | 0.125 | 3 | 0.325396825 | |||
| map00901 | Indole alkaloid biosynthesis | 0 | 0 | 1 | 0.142857143 | |||
| map00950 | Isoquinoline alkaloid biosynthesis | 3 | 0.354166667 | 1 | 0.111111111 | |||
| map00960 | Tropane, piperidine and pyridine alkaloid biosynthesis | 0 | 0 | 1 | 0.090909091 | |||
| map00232 | Caffeine metabolism | 1 | 1 | 0 | 0 | |||
| map00965 | Betalain biosynthesis | 0 | 0 | 1 | 0.111111111 | |||
| map00966 | Glucosinolate biosynthesis | 0 | 0 | 3 | 0.344877345 | |||
| map00332 | Carbapenem biosynthesis | 0 | 0 | 1 | 0.25 | |||
| map00261 | Monobactam biosynthesis | 1 | 0.166666667 | 1 | 0.111111111 | |||
| map00401 | Novobiocin biosynthesis | 2 | 0.416666667 | 1 | 0.111111111 | |||
| map00404 | Staurosporine biosynthesis | 0 | 0 | 1 | 0.142857143 | |||
| map00999 | Biosynthesis of various secondary metabolites—part 1 | 1 | 0.011111111 | 0 | 0 | |||
| map00998 | Biosynthesis of various secondary metabolites—part 2 | 4 | 0.541666667 | 5 | 1.011544012 | |||
| map00997 | Biosynthesis of various secondary metabolites—part 3 | 0 | 0 | 1 | 0.071428571 | |||
| 1.11 Xenobiotics biodegradation and metabolism | 14 | 1.802380952 | 7 | 1.520634921 | ||||
| map00627 | Aminobenzoate degradation | 0 | 0 | 1 | 0.5 | |||
| map00623 | Toluene degradation | 1 | 0.0625 | 0 | 0 | |||
| map00622 | Xylene degradation | 3 | 0.305357143 | 0 | 0 | |||
| map00633 | Nitrotoluene degradation | 1 | 0.166666667 | 0 | 0 | |||
| map00642 | Ethylbenzene degradation | 2 | 0.205357143 | 0 | 0 | |||
| map00643 | Styrene degradation | 1 | 0.0625 | 0 | 0 | |||
| map00363 | Bisphenol degradation | 1 | 0.0625 | 0 | 0 | |||
| map00626 | Naphthalene degradation | 3 | 0.354166667 | 1 | 0.2 | |||
| map00624 | Polycyclic aromatic hydrocarbon degradation | 1 | 0.083333333 | 2 | 0.311111111 | |||
| map00980 | Metabolism of xenobiotics by cytochrome P450 | 0 | 0 | 2 | 0.342857143 | |||
| map00982 | Drug metabolism—cytochrome P450 | 1 | 0.5 | 1 | 0.166666667 | |||
| 1.12 Chemical structure transformation maps | 16 | 3.219444441 | 23 | 3.252164502 | ||||
| map01060 | Biosynthesis of plant secondary metabolites | 4 | 0.854166667 | 5 | 1.416305916 | |||
| map01061 | Biosynthesis of phenylpropanoids | 6 | 1.416666667 | 6 | 0.737734488 | |||
| map01062 | Biosynthesis of terpenoids and steroids | 1 | 0.011111111 | 1 | 0.071428571 | |||
| map01063 | Biosynthesis of alkaloids derived from shikimate pathway | 3 | 0.354166667 | 4 | 0.416305916 | |||
| map01064 | Biosynthesis of alkaloids derived from ornithine, lysine and nicotinic acid | 1 | 0.08333333 | 2 | 0.162337662 | |||
| map01065 | Biosynthesis of alkaloids derived from histidine and purine | 0 | 0 | 1 | 0.071428571 | |||
| map01066 | Biosynthesis of alkaloids derived from terpenoid and polyketide | 1 | 0.5 | 1 | 0.071428571 | |||
| map01070 | Biosynthesis of plant hormones | 0 | 0 | 3 | 0.305194805 | |||
| 2. Genetic Information Processing | 0 | 0 | 3 | 0.344877345 | ||||
| 2.2 Translation | 0 | 0 | 3 | 0.344877345 | ||||
| map00970 | Aminoacyl-tRNA biosynthesis | 0 | 0 | 3 | 0.344877345 | |||
| 3. Environmental Information Processing | 2 | 0.208333333 | 9 | 2.662337662 | ||||
| 3.1 Membrane transport | 0 | 0 | 3 | 0.924242424 | ||||
| map02010 | ABC transporters | 0 | 0 | 3 | 0.924242424 | |||
| 3.2 Signal transduction | 1 | 0.083333333 | 5 | 1.404761905 | ||||
| map02020 | Two-component system | 0 | 0 | 1 | 0.071428571 | |||
| map04071 | Sphingolipid signaling pathway | 0 | 0 | 1 | 0.333333333 | |||
| map04024 | cAMP signaling pathway | 0 | 0 | 1 | 0.333333333 | |||
| map04022 | cGMP-PKG signaling pathway | 0 | 0 | 2 | 0.666666667 | |||
| map04152 | AMPK signaling pathway | 1 | 0.083333333 | 0 | 0 | |||
| 3.3 Signaling molecules and interaction | 1 | 0.125 | 1 | 0.333333333 | ||||
| map04080 | Neuroactive ligand-receptor interaction | 1 | 0.125 | 1 | 0.333333333 | |||
| 4. Cellular Processes | 0 | 0 | 1 | 0.333333333 | ||||
| 4.3 Cellular community—eukaryotes | 0 | 0 | 1 | 0.333333333 | ||||
| map04540 | Gap junction | 0 | 0 | 1 | 0.333333333 | |||
| 5. Organismal Systems | 3 | 0.791666667 | 31 | 8.173881674 | ||||
| 5.1 Immune system | 0 | 0 | 1 | 0.333333333 | ||||
| map04611 | Platelet activation | 0 | 0 | 1 | 0.333333333 | |||
| 5.2 Endocrine system | 0 | 0 | 9 | 2.293650794 | ||||
| map04922 | Glucagon signaling pathway | 0 | 0 | 1 | 0.071428571 | |||
| map04923 | Regulation of lipolysis in adipocytes | 0 | 0 | 2 | 0.666666667 | |||
| map04917 | Prolactin signaling pathway | 0 | 0 | 1 | 0.111111111 | |||
| map04921 | Oxytocin signaling pathway | 0 | 0 | 1 | 0.333333333 | |||
| map04916 | Melanogenesis | 0 | 0 | 1 | 0.111111111 | |||
| map04924 | Renin secretion | 0 | 0 | 2 | 0.666666667 | |||
| map04925 | Aldosterone synthesis and secretion | 0 | 0 | 1 | 0.333333333 | |||
| 5.3 Circulatory system | 0 | 0 | 2 | 0.666666667 | ||||
| map04270 | Vascular smooth muscle contraction | 0 | 0 | 2 | 0.666666667 | |||
| 5.4 Digestive system | 3 | 0.791666667 | 8 | 2.245310245 | ||||
| map04970 | Salivary secretion | 0 | 0 | 1 | 0.333333333 | |||
| map04976 | Bile secretion | 2 | 0.666666667 | 1 | 0.333333333 | |||
| map04974 | Protein digestion and absorption | 1 | 0.125 | 3 | 0.344877345 | |||
| map04977 | Vitamin digestion and absorption | 0 | 0 | 1 | 1 | |||
| map04978 | Mineral absorption | 0 | 0 | 2 | 0.233766234 | |||
| 5.6 Nervous system | 0 | 0 | 4 | 0.753968254 | ||||
| map04728 | Dopaminergic synapse | 0 | 0 | 1 | 0.111111111 | |||
| map04726 | Serotonergic synapse | 0 | 0 | 2 | 0.30952381 | |||
| map04730 | Long-term depression | 0 | 0 | 1 | 0.333333333 | |||
| 5.7 Sensory system | 0 | 0 | 4 | 1.071428571 | ||||
| map04744 | Phototransduction | 0 | 0 | 1 | 0.333333333 | |||
| map04744 | Phototransduction—fly | 0 | 0 | 1 | 0.333333333 | |||
| map04740 | Olfactory transduction | 0 | 0 | 1 | 0.333333333 | |||
| map04742 | Taste transduction | 0 | 0 | 1 | 0.071428571 | |||
| 5.8 Development and regeneration | 0 | 0 | 1 | 0.142857143 | ||||
| map04361 | Axon regeneration | 0 | 0 | 1 | 0.142857143 | |||
| 5.10 Environmental adaptation | 0 | 0 | 2 | 0.666666667 | ||||
| map04713 | Circadian entrainment | 0 | 0 | 1 | 0.333333333 | |||
| map04714 | Thermogenesis | 0 | 0 | 1 | 0.333333333 | |||
| 6. Human Diseases | 0 | 0 | 14 | 2.536940837 | ||||
| 6.1 Cancer: overview | 0 | 0 | 5 | 0.616305916 | ||||
| map05204 | Chemical carcinogenesis | 0 | 0 | 1 | 0.2 | |||
| map05230 | Central carbon metabolism in cancer | 0 | 0 | 4 | 0.416305916 | |||
| 6.4 Neurodegenerative disease | 0 | 0 | 2 | 0.444444444 | ||||
| map05012 | Parkinson disease | 0 | 0 | 2 | 0.444444444 | |||
| 6.5 Substance dependence | 0 | 0 | 5 | 1 | ||||
| map05030 | Cocaine addiction | 0 | 0 | 1 | 0.111111111 | |||
| map05031 | Amphetamine addiction | 0 | 0 | 1 | 0.111111111 | |||
| map05032 | Morphine addiction | 0 | 0 | 1 | 0.333333333 | |||
| map05034 | Alcoholism | 0 | 0 | 2 | 0.444444444 | |||
| 6.10 Infectious disease: parasitic | 0 | 0 | 2 | 0.476190476 | ||||
| map05143 | African trypanosomiasis | 0 | 0 | 2 | 0.476190476 | |||
| Category in KEGG PATHWAY | # Formulae | Magnitude Relationship | Scale | Test | Averaging | p-Value | ||
|---|---|---|---|---|---|---|---|---|
| 1. Metabolism | 199 | Syneco < Conv | Logarithmic | Brunner-Munzel | Formula | −0.047539 | ||
| 1.4 Nucleotide metabolism | 6 | Syneco < Conv | Linear | Brunner-Munzel | Formula | −0.047815 | ||
| 1.5 Amino acid metabolism | 56 | Syneco < Conv | Linear | Brunner-Munzel | Formula | −0.017334 | ||
| NA | −0.017518 | |||||||
| Logarithmic | Welch | NA | −0.018299 | |||||
| Brunner-Munzel | Formula | −0.010095 | ||||||
| NA | −0.017518 | |||||||
| map00300 Lysine biosynthesis | 7 | Syneco < Conv | Linear | Brunner-Munzel | Formula | −0.021277 | ||
| map00310 Lysine degradation | 7 | Syneco < Conv | Linear | Welch | NA | −0.007608 | ||
| Brunner-Munzel | Formula | −0.024978 | ||||||
| NA | −0.014387 | |||||||
| Logarithmic | Welch | Formula | −0.016583 | |||||
| NA | −0.01523 | |||||||
| Brunner-Munzel | Formula | −0.000144 | ||||||
| NA | −0.014387 | |||||||
| map00330 Arginine and proline metabolism | 8 | Syneco < Conv | Linear | Brunner-Munzel | Formula | −0.035047 | ||
| NA | −0.026784 | |||||||
| Logarithmic | Welch | NA | −0.026253 | |||||
| Brunner-Munzel | NA | −0.026784 | ||||||
| 1.6 Metabolism of other amino acids | 17 | Syneco < Conv | Linear | Brunner-Munzel | Formula | −0.048187 | ||
| 1.8 Metabolism of cofactors and vitamins | map00830 Retinol metabolism | 2 | Syneco < Conv | Linear | Welch | Formula | −0.004966 | |
| Logarithmic | Welch | Formula | −0.000541 | |||||
| 1.0 Global and overview maps | map01100 Metabolic pathways | 127 | Syneco < Conv | Logarithmic | Brunner-Munzel | Formula | −0.04356 | |
| Category in KEGG BRITE | # Formulae | Magnitude Relationship | Scale | Test | Averaging | p-Value | |||||
|---|---|---|---|---|---|---|---|---|---|---|---|
| Compounds and Reactions | Compounds (C numbers) | Phytochemical compounds [BR:br08003] | Terpenoids | Diterpenoids (C20) | Abietanes | 2 | Syneco < Conv | Linear | Welch | Formula | −0.004966483 |
| Logarithmic | Welch | Formula | −0.000540986 | ||||||||
| Sesquiterpenoids (C15) | Guaianolide | 3 | Syneco < Conv | Logarithmic | Welch | Formula | −0.042426416 | ||||
| Phenylpropanoids | Monolignols | Sinapate derivatives | 2 | Syneco > Conv | Linear | Welch | Formula | 0.02822976 | |||
| Syneco < Conv | Logarithmic | Welch | Formula | −0.032450817 | |||||||
| Glycosides [BR:br08021] | N-glycosides | 3 | Syneco < Conv | Linear | Welch | Formula | −0.042604306 | ||||
| Lipids [BR:br08002] | PR Prenol lipids | PR01 Isoprenoids | PR0109 Retinoids | 2 | Syneco < Conv | Linear | Welch | Formula | −0.004966483 | ||
| Logarithmic | Welch | Formula | −0.000540986 | ||||||||
| Drugs | Drug information (D numbers) | New drug approvals in Japan [br08318] | 4 | Syneco < Conv | Linear | Welch | NA | −0.039762524 | |||
| Brunner-Munzel | Formula | −0.002578598 | |||||||||
| NA | −0.019485081 | ||||||||||
| Logarithmic | Welch | Formula | −0.014647994 | ||||||||
| NA | −0.026673591 | ||||||||||
| Brunner-Munzel | NA | −0.019485081 | |||||||||
| Drugs with new active ingredients | 4 | Syneco < Conv | Linear | Welch | NA | −0.039762524 | |||||
| Brunner-Munzel | Formula | −0.002578598 | |||||||||
| NA | −0.019485081 | ||||||||||
| Logarithmic | Welch | Formula | −0.014647994 | ||||||||
| NA | −0.026673591 | ||||||||||
| Brunner-Munzel | NA | −0.019485081 | |||||||||
| Drug classifications (D numbers) | Anatomical Therapeutic Chemical (ATC) classification [BR:br08303] | M MUSCULO-SKELETAL SYSTEM | 2 | Syneco > Conv | Linear | Welch | NA | 0.049488163 | |||
| Logarithmic | Welch | Formula | 0.022529231 | ||||||||
| M01 ANTIINFLAMMATORY AND ANTIRHEUMATIC PRODUCTS | 2 | Syneco > Conv | Linear | Welch | NA | 0.049488163 | |||||
| Logarithmic | Welch | Formula | 0.022529231 | ||||||||
| M01A ANTIINFLAMMATORY AND ANTIRHEUMATIC PRODUCTS, NON-STEROIDS | 2 | Syneco > Conv | Linear | Welch | NA | 0.049488163 | |||||
| Logarithmic | Welch | Formula | 0.022529231 | ||||||||
Publisher’s Note: MDPI stays neutral with regard to jurisdictional claims in published maps and institutional affiliations. |
© 2020 by the authors. Licensee MDPI, Basel, Switzerland. This article is an open access article distributed under the terms and conditions of the Creative Commons Attribution (CC BY) license (http://creativecommons.org/licenses/by/4.0/).
Share and Cite
Ohta, K.; Kawaoka, T.; Funabashi, M. Secondary Metabolite Differences between Naturally Grown and Conventional Coarse Green Tea. Agriculture 2020, 10, 632. https://doi.org/10.3390/agriculture10120632
Ohta K, Kawaoka T, Funabashi M. Secondary Metabolite Differences between Naturally Grown and Conventional Coarse Green Tea. Agriculture. 2020; 10(12):632. https://doi.org/10.3390/agriculture10120632
Chicago/Turabian StyleOhta, Kousaku, Tatsuya Kawaoka, and Masatoshi Funabashi. 2020. "Secondary Metabolite Differences between Naturally Grown and Conventional Coarse Green Tea" Agriculture 10, no. 12: 632. https://doi.org/10.3390/agriculture10120632
APA StyleOhta, K., Kawaoka, T., & Funabashi, M. (2020). Secondary Metabolite Differences between Naturally Grown and Conventional Coarse Green Tea. Agriculture, 10(12), 632. https://doi.org/10.3390/agriculture10120632