Article

Chlorophyll Retention and High Photosynthetic Performance Contribute to Salinity Tolerance in Rice Carrying Drought Tolerance Quantitative Trait Loci (QTLs)

by
Noppawan Nounjan
1,
Wuttipong Mahakham
1,
Jonaliza L. Siangliw
2,
Theerayut Toojinda
2 and
Piyada Theerakulpisut
1,*
1
Salt-tolerant Rice Research Group, Department of Biology, Faculty of Science, Khon Kaen University, Nai Mueang, Mueang Khon Kaen, Khon Kaen 40002, Thailand
2
National Center for Genetic Engineering and Biotechnology, NSTDA, 113 Phahonyothin Rd. Khlong Nueng, Khlong Luang, Pathum Thani 12120, Thailand
*
Author to whom correspondence should be addressed.
Agriculture 2020, 10(12), 620; https://doi.org/10.3390/agriculture10120620
Submission received: 5 November 2020 / Revised: 1 December 2020 / Accepted: 9 December 2020 / Published: 10 December 2020
(This article belongs to the Section Crop Production)

Abstract

:
Jasmine rice (Oryza sativa L.), or Khao Dawk Mali 105 (KDML105), is sensitive to drought and salt stresses. In this study, two improved drought-tolerant chromosome segment substitution lines (CSSLs) of KDML105 (CSSL8-103 and CSSL8-106), which carry drought tolerance quantitative trait loci (QTLs) on chromosome 8, were evaluated for salt tolerance and were compared with KDML105 and the QTL donor DH103, their parents and the salt-tolerant genotype Pokkali. After being subjected to salt stress for 6 days, 3-week-old seedlings of Pokkali showed the highest salt tolerance. Parameters related to photosynthesis were less inhibited in both CSSLs and the donor DH103, while these parameters were more severely damaged in the recurrent parent KDML105. Albeit a high ratio of Na+/K+, CSSLs and DH103 showed similar or higher contents of soluble sugar and activity of superoxide dismutase (SOD; EC1.15.1.1) compared with Pokkali, indicating possible mechanisms of either tissue or osmotic tolerance in these plants. The expression of a putative gene Os08g41990 (aminotransferase), which is located in DT-QTL and is involved in chlorophyll biosynthesis, significantly decreased under salt stress in KDML105 and CSSL8-103, while no obvious change in the expression of this gene was observed in Pokkali, DH103 and CSSL8-106. This gene might play a role in maintaining chlorophyll content under stress conditions. Taken together, the results of this study indicate that DT-QTL could contribute to the enhancement of photosynthetic performance in CSSL lines, leading to changes in their physiological ability to tolerate salinity stress.

1. Introduction

Climate change and environmental problems, such as drought, high or low temperatures and soil salinity, cause low yields of crops, including rice, in arid and semiarid regions around the world. In Thailand, many parts of the country face drought problems which notably limit crop productivity. However, in the northeastern part of the country, drought is not the only restricting abiotic stress factor, as soil salinity is also an issue affecting crop production. Salt-affected areas in the northeast are formed through geochemical and anthropogenic processes and cover an area of 1.84 million ha, accounting for 18% of the agricultural land in this region [1].
As one of the top rice-exporting countries, rice is considered an important crop to Thailand’s economy, especially Khao Dawk Mali 105 (KDML105), or jasmine rice, which is well-known on the global market for its excellent appearance, texture and aroma. KDML105 is grown primarily in the northeast, where inland salt-affected soils reduce its productivity. Low production of KDML105 is observed when it is grown in soil with electrical conductivity (EC) of 8–16 dS m−1 [2]. To increase the productivity of the elite rice KDML105 in drought-prone and salt-affected areas, developing new stress-tolerant cultivars with a highly conserved genetic background of KDML105 represents an alternative strategy for sustainable agriculture. In a previous study, KDML105 (drought- and salt-sensitive) was used as a genetic background crossed with a drought-tolerant donor, the IR68586-F2-CA-31 line (DH103), by marker-assisted backcrossing to develop chromosome segment substitution lines (CSSLs) of KDML105 containing various segments of drought tolerance quantitative trait loci (DT-QTL) on chromosome 8. This CSSL population has been reported to show better drought tolerance than KDML105 [3].
The salt concentration in the water extracted from a saturated soil extract defines the salinity of the soil. Elevated salt concentrations in soil affect plant growth and metabolism, leading to reduced plant productivity or severe symptoms and death. Salt stress arises from the combination of osmotic and ion toxicity effects and oxidative stress. Salts in the soil water not only interfere with water uptake, resulting in slower growth, but also inhibit K+ uptake, leading to ion imbalance in plant cells [4]. Plants cope with negative effects from salt stress through many processes, such as faster activated signalling networks, selective exclusion of Na+, control of ion uptake and synthesis of compatible solutes for osmotic adjustment [5]. Plants are able to counteract osmotic stress by osmotic adjustment through the accumulation of organic solutes or compatible solutes (e.g., trehalose, glycerol, proline, glycine betaine, sucrose and glucose) [6]. Many studies have documented that plants accumulate many compatible solutes under water deficit, as well as under osmotic and salt stresses. For example, it has been reported that glycine betaine and proline are the main solutes, followed by sugars and free amino acids, that are involved in osmotic adjustment attributed to salt tolerance [7].
Salt stress induces reactive oxygen species (ROS) generation from a molecule of oxygen that receives electrons from a high energy level. An imbalance between ROS production and the scavenging defence system (enzymes and nonenzymatic molecules) results in oxidative stress [8]. The main sites for ROS production include chloroplasts, mitochondria and peroxisomes, which are highly oxidizing, metabolically active organelles [9]. ROS, such as hydrogen peroxide (H2O2), superoxide anion (O2•−) and singlet oxygen (1O2), damage essential macromolecules and plant metabolites. Several nonenzymatic antioxidants (glutathione and ascorbate) and antioxidant enzymes (superoxide dismutase, SOD or EC1.15.1.1, and catalase, CAT or EC1.11.1.6) are able to detoxify ROS [10]. Higher activity of antioxidant enzymes under NaCl treatments was observed in salt-tolerant rice genotypes than in salt-sensitive rice genotypes, resulting in better defence against the negative effects of salt stress [11]. This phenomenon is also observed in other plant species, such as wild barley and pepper, when they are exposed to abiotic stress [12,13].
Chlorophyll is usually degraded under salinity stress. Thus, this pigment has been used as one of the key criteria in evaluating the salt tolerance ability of many plant species [13,14,15]. Recently, our previous bioinformatics analysis found that a putative gene, Os08g41990, which is involved in chlorophyll biosynthesis (tetrapyrrole and porphyrin biosynthesis) and is located on the introgressed DT-QTL of some CSSL lines of KDML105, might have some significant functions in salt stress tolerance in rice [16]. Moreover, salt stress reduces CO2 fixation as a result of the decreased CO2 diffusion caused by stomatal closure [17]. Under this condition, electron flow continues, and excitation energy can be generated, leading to ROS production [9]. A comparison of photosynthesis intercellular CO2 concentration response (A/Ci) curves between salt-tolerant and salt-susceptible rice cultivars under salt stress revealed that the reduction in both carboxylation efficiency and the maximum photosynthetic CO2 fixation rate was more pronounced in the salt-susceptible cultivar than in the salt-tolerant cultivar [18]. Protecting photosynthesis components is also one of several essential mechanisms for drought tolerance [19]. Drought-tolerant genotypes often show higher levels of photosynthesis than do susceptible ones, which consequently leads to higher yield [20].
The mechanisms of drought and salt stress tolerance in plants are related and have overlapping signals [21]. The drought-tolerant introgressed CSSL lines developed by Kanjoo et al. [3] are suitable for research investigating the physiological responses to salt stress. The aim of this work was to investigate the physiological parameters and tolerance mechanisms in selected CSSL lines under salt stress and recovery. To address this objective, two CSSLs were evaluated for salt tolerance ability compared with their parental lines and standard salt tolerant genotype including an analysis of the expression of putative genes found in DT-QTL of CSSL lines, Os08g41990.

2. Materials and Methods

2.1. Plant Materials and Stress Treatment

CSSLs of KDML105, which are DT-QTL introgression lines designated CSSL8-103 and CSSL8-106, were used as plant materials (see Supplementary Figure S1 for the breeding scheme). CSSL8-103 and CSSL8-106 were selected because both have chromosome 8 DT-QTL introgression, but the length of the introgressed region was shorter in CSSL8-103 (Supplementary Figure S2). Their physiological responses under salt stress and after recovery were compared with those of the standard salt tolerant cultivar (Pokkali) and their parents (KDML105 and DH103). The experiment was performed in a greenhouse at the Faculty of Agriculture, Khon Kaen University, Thailand, under natural sunlight conditions. A randomized complete block design with 4 replications for each treatment was employed for the experimental design. Sixteen rice seedlings of each line/cultivar were randomly arranged in 10 × 8 holes (row × column) of Styrofoam with nylon net bottoms floating over 6 L of nutrient solution in each container. All rice lines/cultivars were germinated in distilled water for 3–4 days and were subsequently allowed to grow in nutrient solution [22]. The nutrient solution was renewed every 4 days, and the pH was maintained at 5.0–5.5 throughout the experiment. At 3 weeks of age, plants were divided into control (0 mM NaCl) and salt treatment (150 mM NaCl) groups. After 6 days of salt treatment, plants were allowed to recover for 4 days by replacing the nutrient solutions containing NaCl with fresh nutrient solutions. Fresh nutrient solution was also replaced in the control group. Rice plants were harvested twice: 6 days after the stress-treatment period and 4 days after the recovery period. The collected samples were stored at −80 °C and −20 °C for further analysis.

2.2. SPAD Measurement, Chlorophyll Content and Photosynthetic Parameters

Leaf greenness based on SPAD readings was determined on the youngest fully expanded leaf using a SPAD-502 chlorophyll meter (Konica Minolta Inc., Osaka, Japan). Chlorophyll content was estimated following the method described by Arnon [23]; 0.1 g leaf tissue was analysed. Photosynthetic parameters (net photosynthesis rate, PN; stomatal conductance, gs; transpiration rate, E; ratio between internal and ambient CO2 concentration, Ci/Ca) were measured on the youngest fully expanded leaves of the plants using a portable gas exchange analyser (LI-6400-XT, LI-COR, NE, USA) from 9:30–12:30 a.m. The net photosynthesis rate was determined under the conditions of a controlled leaf chamber temperature of 30 °C, CO2 concentration of 400 ppm and light intensity of 1500 µmol (photon) m−2 s−1. The maximum quantum efficiency of photosystem II (Fv/Fm) was measured after 7.00 p.m. using LI-6400-XT.

2.3. Analysis of the Expression of Genes Related to Chlorophyll Synthesis

Based on our previous bioinformatics (co-expression network) analysis, it was revealed that the DT-QTL segments introgressed into the CSSL8 population contained Os08g41990, a putative gene that encodes aminotransferase, which may contribute to salt stress tolerance in this CSSL8 rice population [16]. Thus, this study examined the expression level of this putative gene under salt stress. In addition, since the co-expression network of Os08g41990 was related to the chlorophyll biosynthetic pathway, three other chlorophyll biosynthetic genes, HEMA (glutamyl-tRNA reductase), GSA (glutamate 1-semialdehyde aminotransferase) and Os02g07230 (porphobilinogen deaminase), were also studied to understand their roles under salt stress.
Total RNA from 0.1 g leaves was isolated using the PureLink RNA Mini Kit (Thermo Fisher Scientific, Waltham, MA, USA). DNase treatment using RQ1 RNase-Free DNase (Promega, Madison, WI, USA) was performed to remove residual DNA. RNA was quantified by a UV–vis spectrophotometer (NanoDrop, Thermo Fisher Scientific). First-strand cDNA was synthesized from 1 μg RNA with a RevertAidTM First Strand cDNA Synthesis Kit (Fermentas, Vilnius, Lithuania) using 0.5 μg/μL oligo (dT)18 primers. Gene expression was analysed by qPCR with a LightCycler® 480 instrument (Roche). The 20-μL total reaction was analysed using a LightCycler® 480 SYBR Green I Master (Roche) containing first-strand cDNA (1:10) as a template and 0.1 μM specific primers (Supplementary Figure S3). Three biological replicates of each rice line/cultivar were performed under both control and stress conditions. The relative expression level of each gene was analysed using the 2−ΔΔCT CT method [24]. OsActin was used as an internal control.

2.4. Measurement of Osmotic Potential and Total Sugar

Young, fully expanded leaves of rice plants of each line/cultivar were collected and kept in plastic bags, placed immediately in liquid nitrogen, and then stored at −20 °C for osmolality analysis. Ten microlitres of the leaf sap was used to determine osmolality using an osmometer (Wescor Inc., Logan, UT, USA). Osmotic potential was calculated according to the method of Larkunthod et al. [25]. Total sugar was determined by the anthrone method using 0.1 g of leaf tissue [16].

2.5. Estimation of Electrolyte Leakage (EL), Malondialdehyde (MDA) and Hydrogen Peroxide (H2O2)

Electrolyte leakage (EL) was estimated following the method of Filek et al. [26]. Malondialdehyde (MDA) was measured by using the method described by Heath and Packer [27]. The method of Meisner and Gębicki [28] was used to measure hydrogen peroxide (H2O2).

2.6. Estimation of Electrolyte Leakage (EL), Malondialdehyde (MDA) and Hydrogen Peroxide (H2O2)

Crude enzyme was extracted from leaf samples (0.2 g) by homogenizing them with 10 mM of potassium phosphate buffer (pH 7.0) containing 4% polyvinyl pyrrolidone (PVP). After being spun at 4 °C for 15 min in a centrifuge, supernatants were immediately analysed to determine enzyme activity. Superoxide dismutase (SOD) and catalase (CAT) activities were estimated by following the method described previously by Nounjan and Theerakulpisut [29]. Protein content was measured by the Bradford method [30].

2.7. Growth Parameters and Ion Concentration

Plants were randomly selected from the control and salt stress groups in each replicate to measure dry weight (DW). DW was measured after the plants were incubated at 70 °C until the weight was stabilized. Dried roots and leaves were used to determine Na and K ions as described previously [16].

2.8. Statistical Analysis

The data were analysed with SPSS ver. 20 for statistical testing. The significance of the differences between the mean values was determined by Duncan’s multiple range tests (DMRT), considering p ≤ 0.05 to be significant. All data are presented as means ± SE.

3. Results

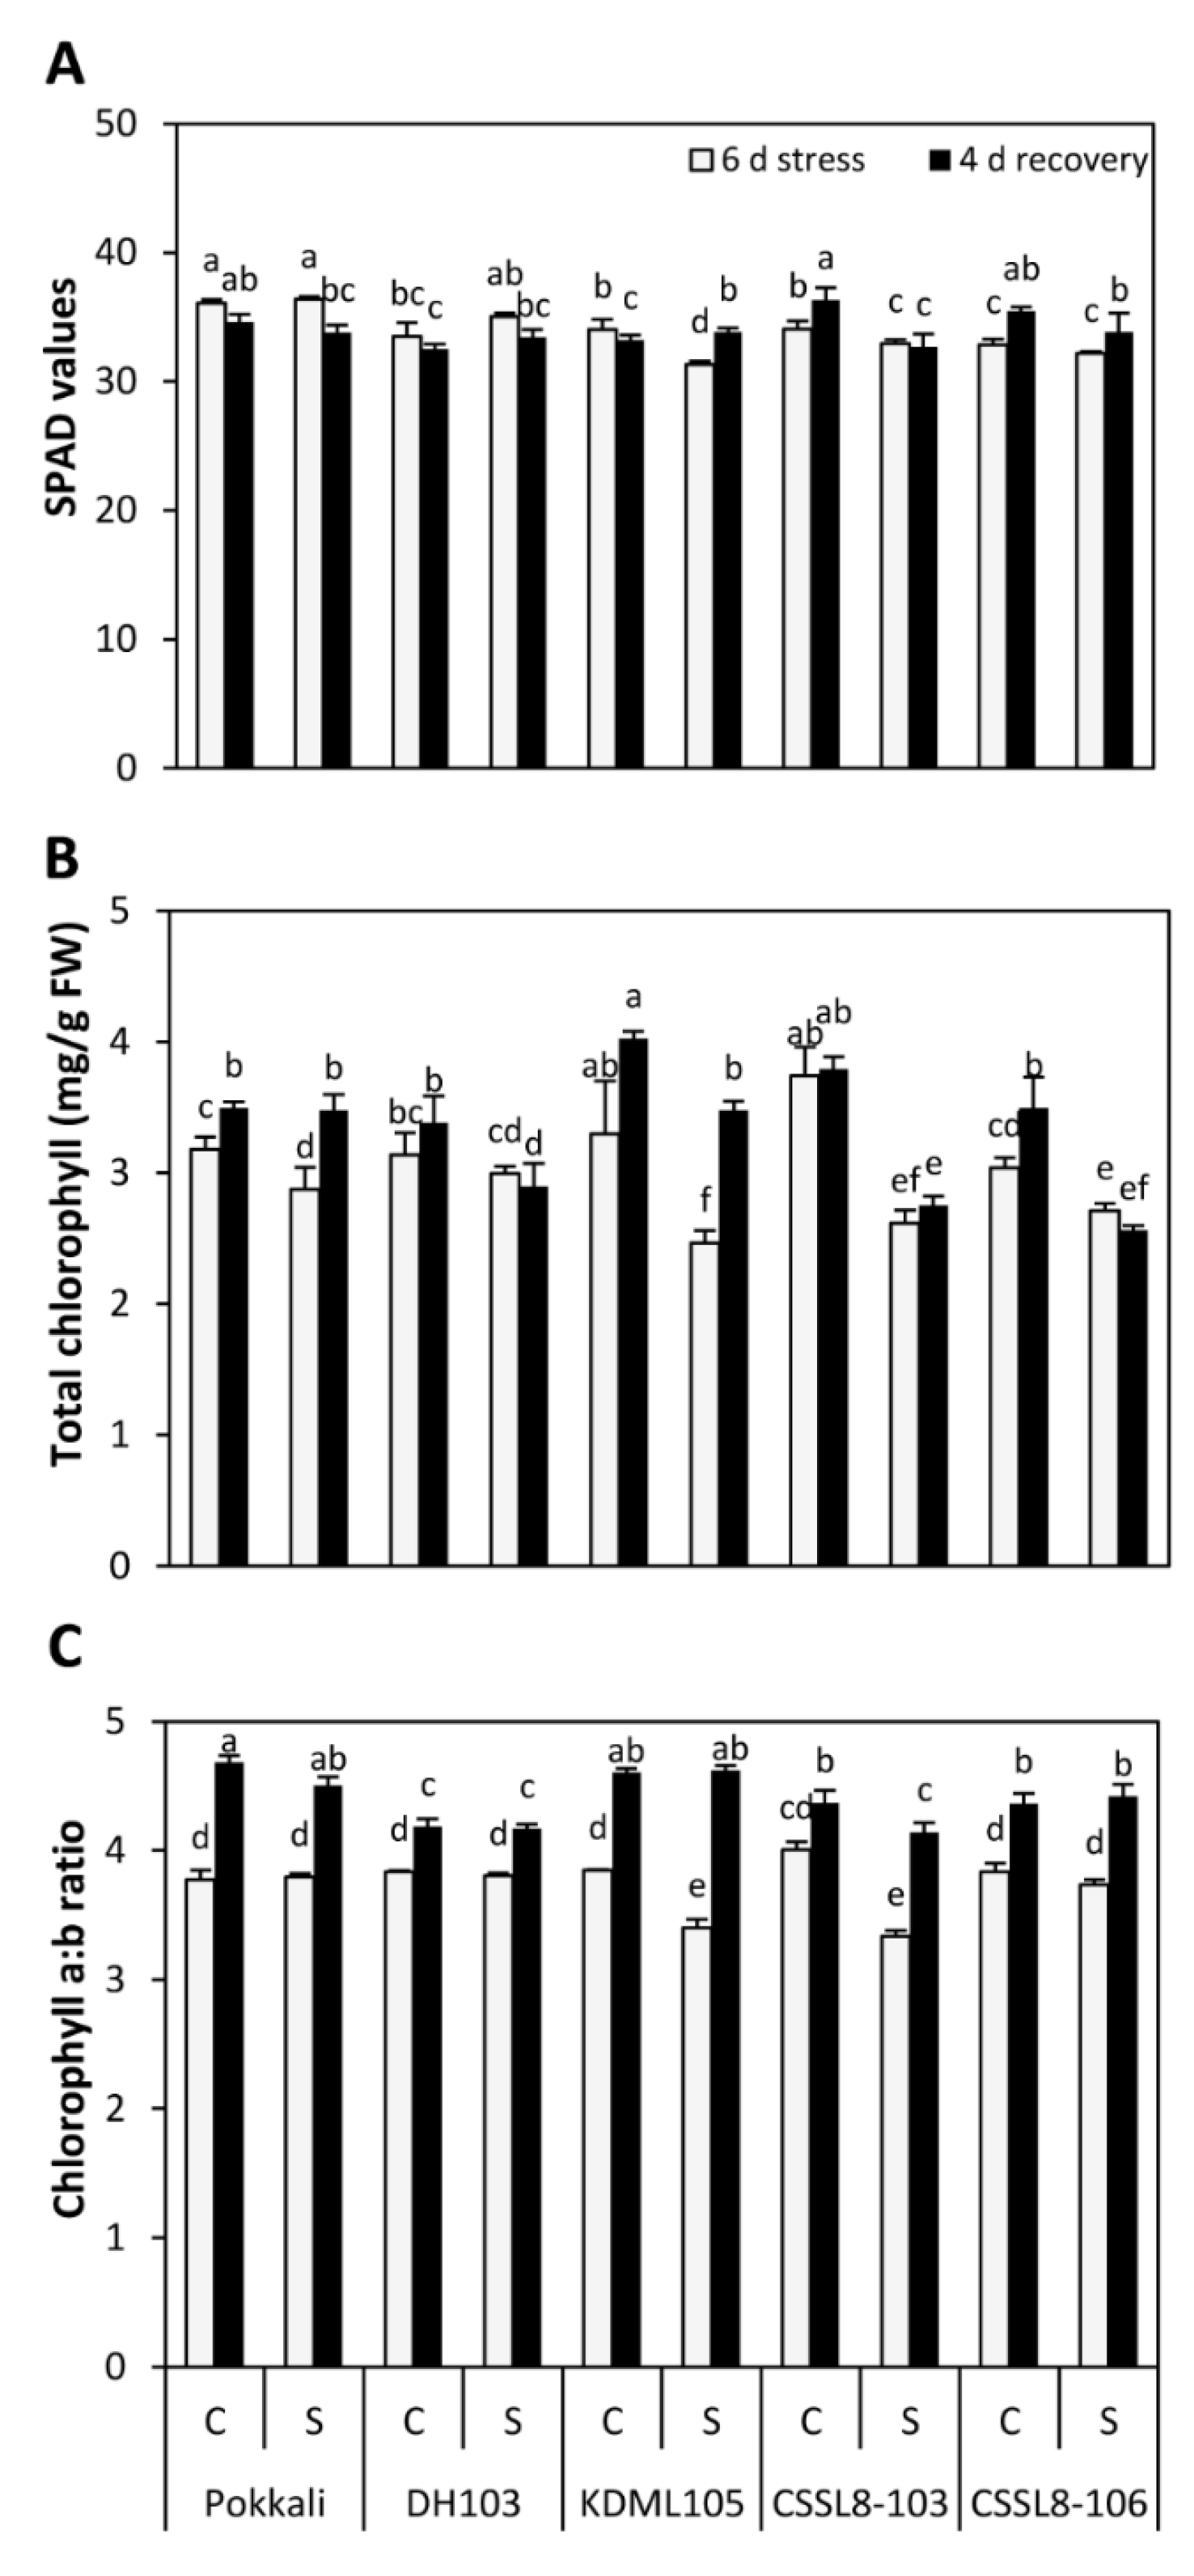
3.1. SPAD Values, Chlorophyll Content, Gene Expression and Photosynthetic Parameters under Salt Stress and Recovery Conditions

For SPAD values, Pokkali and CSSL8-106 showed no change in SPAD values under salt stress, whereas SPAD values observed from DH103 increased when NaCl was applied (Figure 1A). However, this increase between the control and salt treatment groups was not significant. Significant decreases in SPAD values were found in KDML105 and CSSL8-103 (decreases of 8 and 3%, respectively, compared to those of the control groups). After salt stress was removed, the SPAD values of Pokkali showed a significant decrease compared to those of other groups previously subjected to salt stress. For DH103 and CSSL8-103, the SPAD values did not change, while an increase in SPAD values was recorded in KDML105 (7%) and CSSL8-106 (5%) (Figure 1A). Salt stress induced a decline in total chlorophyll content in all rice lines/cultivars. Strong and significant reductions in total chlorophyll were observed in KDML105 (31%) and CSSL8-103 (30%), while slight but significant reductions were found in Pokkali (10%) and CSSL8-106 (11%). The 8% reduction found in DH103 was not significant (Figure 1B). After 4 days of recovery from stress, no significant differences in total chlorophyll content were observed among DH103 plants and both CSSL8 lines previously treated with NaCl. Notably, significant increases in chlorophyll content were observed after recovery in Pokkali (17%) and KDML105 plants (29%) (Figure 1B).
The chlorophyll a:b ratio was not significantly changed between non-stressed and salt-stressed Pokkali, DH103 and CSSL8-106, while the chlorophyll a:b ratio was significantly decreased in KDML105 and CSSL8-103 when the plants were treated with NaCl (the ratio decreased by 12 and 17%, respectively). After the recovery period, the chlorophyll a:b ratio in all plants was significantly increased compared to the salt-treated plants (the ratio increased by 16% in Pokkali, 9% in DH103, 26% in KDML105, 20% in CSSL8-103 and 16% in CSSL8-106) (Figure 1C).
The transcription levels of genes involved in the chlorophyll biosynthetic process, namely, HEMA, which encodes glutamyl-tRNA reductase (GTR; EC 1.2.1.70), GSA (glutamate 1-semialdehyde aminotransferase; EC 5.4.3.8), Os08g41990 (aminotransferase) and Os02g07230 (porphobilinogen deaminase; EC 4.3.1.8), were significantly down-regulated in response to salt stress. For Pokkali, a dramatic decrease in HEMA expression was observed, whereas no significant change in GSA, Os08g41990 and Os02g07230 expression levels was detected compared to untreated plants (Figure 2). A slight down-regulation or unchanged expression in Os08g41990 was also observed in DH103 and CSSL8-106 plants. Notably, those genes (Figure 2) were dramatically down-regulated in salt-stressed KDML105 and CSSL8-103. After the plants were allowed to recover for 4 days, plants previously treated with NaCl showed down-regulated expression levels of HEMA in Pokkali, KDML105 and CSSL8-106, whereas a marked up-regulation of HEMA expression was observed in CSSL8-103. For DH103, HEMA showed a slight up-regulation but was not significantly changed compared with the control plants (Figure 2A). Similar results were observed in the recovered leaves of Pokkali, KDML105 and CSSL8-106, which exhibited significant down-regulation of GSA expression levels while there was a relative decrease in the expression of GSA in DH103. CSSL8-103 did not show any significant decrease in GSA expression (Figure 2B). After recovery, the Os08g41990 expression level in Pokkali and KDML105 was down-regulated, while that in CSSL8-103 was strongly up-regulated (Figure 2C). The expression of Os02g07230 in the previously salt-treated plants was significantly increased in Pokkali and KDML105, whereas down-regulation of this gene was observed in both CSSL lines. Os02g07230 gene expression exhibited no noticeable change in DH103 (Figure 2D).
Under non-stress conditions, Pokkali and DH103 showed higher PN values (24.56 and 25.08 µmol(CO2) m−2 s−1, respectively) than other rice lines/cultivars, whereas the PN values in KDML105 (20.12 µmol(CO2) m−2 s−1) and both CSSL lines (21.42 and 20.72 µmol(CO2) m−2 s−1 for CSSL8-103 and CSSL8-106, respectively) were similar. When plants were exposed to NaCl for 6 days, the PN values in all rice lines/cultivars decreased by approximately 50–54%, except for KDML105, in which the PN values decreased 64% compared to those of the non-stressed groups (Figure 3A). However, the PN values increased after salt had been removed. The highest increase in the PN values after recovery was observed in KDML105 (68% increase compared to stressed-plants after 6 days of salt treatment) followed by CSSL8-106 (58%), Pokkali (55%), CSSL8-103 (51%) and DH103 (47%) (Figure 3A). When treated with NaCl for 6 days, the lowest gs value was found in KDML105 (0.066 mol (H2O) m−2 s−1 i.e., 84% reduction compared to those of the control group), while no significant differences were observed in other rice lines/cultivars (Figure 3B). After 4 days of recovery, for the control plants, the gs values of all lines/cultivars were significantly reduced. In contrast, the previously stressed plants were able to exhibit increased gs values compared with the salt-stressed plants (increased by 62, 60, 65, 56 and 51% in Pokkali, DH103, KDML105, CSSL8-103 and CSSL8-106, respectively) (Figure 3B). Salt stress also induced a decrease in E, and the level of E was severely decreased in KDML105 and CSSL8-103 (72–73%), whereas a 54% reduction was observed in Pokkali. When the nutrient solution was renewed after salt stress, E in KDML105 exhibited the highest percentage recovery (63%) (Figure 3C).
Lower Ci/Ca was noted in all lines/cultivars (except CSSL8-103) during NaCl treatment. During this period, the lowest decrease in Ci/Ca was detected in CSSL8-103 (6%) followed by KDML105 (19%), and their Ci/Ca remained relatively high, exhibiting values of 0.73 for CSSL-8-103 and 0.61 for KDML105 (Figure 3D). After the salt-stressed plants were recovered in nutrient solution without NaCl for 4 days, the Ci/Ca values of Pokkali, DH103 and CSSL8-106 were significantly increased by 15, 30 and 16%, respectively, compared with plants during the stress period. In contrast, the Ci/Ca of recovered plants of KDML105 and CSSL8-103 decreased further (Figure 3D). As shown in Figure 3E, a reduction in the Fv/Fm was detected in salt-stressed DH103 plants and both CSSL8 lines, while no change was observed in Pokkali and KDML105. When stressed plants were allowed to recover, Fv/Fm was significantly increased in DH103 and two CSSL8 lines compared with the values observed during stress.

3.2. Osmotic Potential and Sugar Content under Salt Stress and Recovery

Plants under non-stressed conditions had osmotic potential values ranging from −1.37 MPa (DH103) to −1.73 MPa (CSSL8-106). In response to 6 days of salt stress, the osmotic potential decreased significantly in all rice lines/cultivars (Figure 4A), with values ranging from −2.51 MPa (Pokkali) to −3.53 MPa (KDML105). The highest percentage reduction in osmotic potential was found in DH103 (58%) followed by KDML105 (50%), CSSL8-103 (47%), CSSL8-106 (43%) and Pokkali (32%). After recovery, the osmotic potential of all stressed rice lines/cultivars dramatically increased to levels comparable to those of the control groups. The highest percent increase was found in DH103 and CSSL8-103 (48 and 50%, respectively) (Figure 4A).
Sugar contents in control plants varied considerably, ranging from 246 (Pokkali) to 145 (KDML105) mg g−1 FW. Nevertheless, a significant enhancement in sugar content was found in all lines/cultivars after 6 days of salt-stress treatment (Figure 4B). DH103 and CSSL8-106 showed the highest increases (33 and 38%, respectively), whereas 14–17% increases were found in Pokkali, KDML105 and CSSL8-103. After 4 days of recovery from stress, the means of sugar content were decreased in both the control and stress groups. In this stage, the sugar contents of the Pokkali, DH103 and KDML1050 plants were not significantly different from those of their respective control plants, which had not experienced salt stress. In contrast, the sugar contents of both CSSL8 lines recovered from salt stress were lower than those of their corresponding control plants (Figure 4B).

3.3. Oxidative Stress Indicators and Antioxidant Enzyme Activities under Salt Stress and Recovery

Electrolyte leakage (EL) in the control plants was low, ranging from 1.71 to 4.72%, indicating good membrane integrity. When exposed to salt stress, EL increased markedly in all rice lines/cultivars. The highest EL was observed in KDML105 (27%) followed by CSSL8-103 (21.5%), which was in contrast to Pokkali, whose EL was the lowest (12%) (Figure 5A). After recovery, the adverse effect of salt was reduced, as demonstrated by the significant reduction in EL in all plants. However, for plants that had previously experienced salt stress, EL values were still higher than those of their corresponding controls (except for KDML105) (Figure 5A). Significant differences in malondialdehyde (MDA) levels between the control and salt treatment groups were observed in only KDML105 (18% increase), whereas no significant changes were observed in Pokkali, DH103 and both CSSL8 lines. After 4 days of recovery, MDA contents were similar to those under 6 days of salt stress (except for DH103) (Figure 5B). For hydrogen peroxide (H2O2), H2O2 content significantly increased with salt treatment in KDML105 and CSSL8-106 (17 and 22%, respectively, compared to those of the control plants). After salt stress was removed, H2O2 content considerably decreased, reaching similar levels (in DH103, KDML105 and CSSL8-103) as in the control plants, which had not experienced salt stress. However, Pokkali plants that were previously stressed and later recovered had lower H2O2 (13% decrease) than did the control plants, while the opposite case was observed in CSSL8-106 (26% increase) (Figure 5C).
Superoxide dismutase (SOD) activity was not affected by salt stress in Pokkali, DH103 and CSSL8-103, while significantly reduced activity was observed in KDML105 (23%) and CSSL8-106 (10%) (Figure 6A). After 4 days of recovery, SOD activity considerably increased by 34, 23, 41, 26 and 23% in Pokkali, DH103, KDM105, CSSL8-103 and CSSL8-106, respectively, compared to the levels observed during the stress period (Figure 6A). The SOD activity of the recovered plants was at similar levels to (DH103, KDML105, CSSL8-103 and CSSL-8-106) or higher than (Pokkali) those of the control plants that never experienced salt stress. Conversely, salt stress significantly increased catalase (CAT) activity in all rice lines/cultivars, except for CSSL8-106, which did not show noticeable changes. The highest increase was noted in Pokkali followed by DH103, KDML105 and CSSL8-103 (increased by 66, 48, 32 and 25%, respectively) (Figure 6B). After 4 days of recovery, significantly lower CAT activity was observed in Pokkali (36% reduction) and DH103 (34% reduction), while that of KDML105, CSSL8-103 and CSSL8-106 continued to increase or remained unchanged. The CAT activities in the recovered plants of Pokkali and both CSSLs were similar to those of the plants that had not experienced salt stress. In contrast, the CAT activities of DH103 and KDML105 plants recovered from stress were significantly lower than those of the control plants (Figure 6B).

3.4. Na+/K+ Ratio and Growth of Plants under Salt Stress

Under the control non-stressed conditions, no significant difference in the Na+/K+ ratio was observed in the roots and leaves in all rice lines/cultivars. When salt was applied, there was a significant increase in the Na+/K+ ratio (29–95-fold increase compared to that of the control) (Figure 7). DH103 showed the highest Na+/K+ ratio in both root and leaf tissues. In contrast, the lowest Na+/K+ ratios were found in Pokkali. In two CSSL8 lines, CSSL8-103 had a higher Na+/K+ ratio in roots than did CSSL8-106, while no significant differences in the Na+/K+ ratios in the leaves were observed between them. For KDML105, the Na+/K+ ratios in the roots and leaves increased 59-, and 81-fold, respectively, compared to those observed in the control groups (Figure 7). Although similar root Na+/K+ ratios among Pokkali, KDML105 and CSSL8-106 were observed, KDML105 and CSSL8-106 accumulated higher Na ions in roots than did Pokkali (Supplementary Figure S4).
After the recovery period, significantly lower root Na+/K+ ratio was observed in Pokkali (64% reduction), KDML105 (44% reduction) and CSSL8-106 (35% reduction), while that of DH103 and CSSL8-103 remained unchanged. In the leaves, Na+/K+ ratios in the recovered plants of Pokkali and DH103 remained the same as in the salt-stressed plants. For KDML105 and CSSL8-106, leaf Na+/K+ ratios significantly decreased (decrease of 24% and 42%, respectively), whereas a marked increase in Na+/K+ was noted in CSSL8-103 (increase of 57%) (Figure 7).
Growth reduction was observed in all rice lines/cultivars after exposure to NaCl. Compared with the controls, dry weight (DW) under salt stress was decreased by 46, 45, 44, 35 and 26% in KDML105, CSSL8-103, Pokkali, CSSL8-106 and DH103, respectively. However, plants were able to recover growth after the salt stress was removed. Compared with the DW observed after 6 days of salt stress, the DW of DH103 showed the highest percentage recovery (79%) followed by KDML105 (77%), Pokkali (56%), CSSL8-106 (47%) and CSSL8-103 (26%) (Figure 8).

4. Discussion

High levels of salinity activate chlorophyll degradation enzymes leading to a decline in chlorophyll content [31]. A reduction of chlorophyll via SPAD values occurred in KDML105 and CSSL8-103 plants treated with salt, whereas no significant change was observed in Pokkali, DH103 and CSSL8-106 (Figure 1A). This observation was generally consistent with the findings of many previous reports, which indicated that salt stress decreased SPAD values in plants [15,32]. For extracted leaf pigments, a significant decrease in total chlorophyll content was observed in all rice lines/cultivars. However, the greatest reduction was noted in KDML105 and CSSL8-103. Notably, a decrease in the chlorophyll a:b ratio is associated with a decrease in SPAD values and total chlorophyll, particularly in KDML105 and CSSL8-103 under salt stress (Figure 1B,C). Salt stress disintegrates the stacking of thylakoids, which reduces the chlorophyll a:b ratio [33]; this may be a reason behind the reduction in the chlorophyll a:b ratio in our study.
For gene expression analysis, the results indicated that the expression levels of HEMA in all rice lines/cultivars decreased under salt stress conditions, and down-regulation of this gene might also be related to the reduction in chlorophyll content (Figure 1B and Figure 2A). Under salt stress, no obvious change or a slight decrease in the expression of GSA, Os08g41990 and Os02g07230 was observed in Pokkali, DH103 and CSSL8-106, whereas more pronounced down-regulation occurred in KDML105 and CSSL8-103 (Figure 2B–D). The GSA gene encodes an aminotransferase enzyme that converts glutamate 1-semialdehyde (GSA) to δ-amino levulinic acid (ALA) [34]. Os08g41990 functions in tetrapyrrole and porphyrin biosynthesis, a crucial step in the chlorophyll synthesis process [16], and Os02g07230 (porphobilinogen deaminase) is involved in polymerizing molecules of porphobilinogen to produce a linear tetrapyrrole, 1-hydroxymethylbillane [35]. The decreased expression of GSA, Os08g41990 and Os02g07230 in KDML105 and CSSL8-103 compared with Pokkali, DH103 and CSSL8-106 suggests that these genotypes are more sensitive to salinity stress than are other studied genotypes. The study of Dalal and Tripathy [34] reported that reduced chlorophyll synthesis in stressed seedlings of rice was associated with the down-regulation of early intermediates of chlorophyll biosynthesis, i.e., GSA and ALA. Changes in levels of Os08g41990 expression were related to changes in chlorophyll content, which was slightly reduced in PK, DH103 and CSSL8-106, but significantly decreased in KDML105 and CSSL8-103 (Figure 1B and Figure 2C). It has been reported that tetrapyrrole is also involved in stimulating drought stress signalling and activating the ROS detoxification process under drought stress [36], and sustainability of porphyrin biosynthesis during drought stress is a prerequisite for plants to maintain photosynthesis [37]. Therefore, from these findings it could be implied that a higher expression of Os08g41990 is associated with salt stress tolerance. The stability of this gene under salt stress might relate to chlorophyll retention resulting in the maintenance of photosynthesis performance (Figure 1, Figure 2 and Figure 3). Moreover, the gene Os02g07230 can control the synthesis of photosynthetic pigment under stress conditions [38]. These findings suggest that the regulation of chlorophyll synthesis is important to confer salt tolerance on rice plants. After 4 days of recovery, the transcript levels of HEMA, GSA and Os08g41990 in previously salt-stressed plants were, in most cases, lower than those of control plants that were not subjected to stress (Figure 2). These lower gene expression levels were related to significantly lower total chlorophyll contents (Figure 1B), particularly in DH103, KDML105, CSSL8-103 and CSSL8-106. An exception was found in CSSL8-103, where transcripts of HEMA and Os08g41990 in the recovered salt-stressed plants were notably higher than those of the control plants at the same period (Figure 2A,C). However, the high expression in CSSL8-103 of these two genes, which encode the enzymes of earlier steps in the chlorophyll biosynthesis pathway, was not related to chlorophyll content, possibly due to the considerably lower expression of Os02g07230 (Figure 2D), which catalysed the first committed step in porphyrin biosynthesis [35]. It was reported that chlorophyll biosynthetic genes were down-regulated, while chlorophyll breakdown genes were up-regulated, during stress, and the reverse situation was observed during the recovery period [39,40]. Chlorophyll content resulted from complex functions of both genes (chlorophyll biosynthesis and degradation genes), and fluxes of pathway intermediates [34]. Thus, mechanisms regulating chlorophyll metabolic pathways during salt stress and after recovery warrant further study.
Photosynthesis is among the primary metabolic processes affected by salinity [41], and the salt tolerance level is highly correlated with the ability to maintain PN under stress [16,42]. In this study, it was evident that photosynthesis of KDML105 was most severely inhibited, and both CSSLs had significantly higher PN values and lower percent reduction (Figure 3A). In all genotypes investigated, reduced PN was closely associated with a reduction in gs (Figure 3A,B), suggesting that PN was primarily limited by stomatal closure (stomatal factors), thus restricting CO2 supply to the Calvin cycle. In addition, PN under salt stress is also limited by non-stomatal factors, which are indicated by intercellular CO2 concentration (Ci) or the ratio between Ci/Ca in relation to gs [43]. Higher Ci/Ca values in KDML105 and CSSL8-103 under stress, compared to the other genotypes, indicated that photosynthesis of these genotypes suffered from stronger non-stomatal limitations [42]. Non-stomatal limitation factors can slow photosynthesis under salt stress by reducing mesophyll conductance [44] and altering ATP production, leading to a shortage in supply of ribulose bisphosphate (RuBP) [45] and reduced activities of the key enzymes of CO2 fixation [46]. It was obvious that Fv/Fm was decreased in DH103 and both CSSL lines, whereas Fv/Fm was unaffected when plants were exposed to NaCl in Pokkali and KDML105 (Figure 3E). This result indicates that salt stress did not threaten the PSII photochemical apparatus in Pokkali and KDML105. In the recovery period, all photosynthetic parameters in previously salt-treated groups were higher than those of stressed plants. At this time point, Pokkali still showed the highest value in PN. Interestingly, the highest recovery percentage was found in KDML105. It has been reported that the rapid recovery of the photosynthetic rate is related to the stability of PSII and PSI [47]. In this study, salt-stressed Pokkali and KDML105 were able to maintain their Fv/Fm values, suggesting that no irreversible damage to the PSII apparatus occurred during salt stress. These findings may imply that the durability of PSII might play a vital role in enhancing the photosynthesis process after recovery from stress. Chlorophylls are essential pigments for photosynthesis and energy absorption. These factors could promote photosynthesis leading to the enhanced growth of plants after recovery (Figure 1, Figure 3 and Figure 8).
In plant cells, maintaining low osmotic potential caused by a high accumulation of osmolytes, compatible solutes and non-compatible solutes is a process of osmoregulation or osmotic adjustment that is important for the protection and survival of plants under abiotic stress conditions [6,48]. In the present study, plants exhibited low osmotic potential under salt treatment. The lowest osmotic potential was found in the recurrent parent KDML105, while the salt-tolerant Pokkali had the highest osmotic potential. The osmotic potential values of DH103 and both CSSLs were intermediate between those cultivars (Figure 4A). Since Pokkali, which is the salt-tolerant genotype, exhibited high osmotic potential in contrast to the salt-susceptible genotype KDML105, it is probable that osmoregulation or osmotic adjustment is not the main mechanism contributing to salt tolerance in Pokkali. Although the highest sugar content was observed in Pokkali receiving salt treatment, high osmotic potential was observed in this cultivar. In contrast, KDML105 exhibited low sugar accumulated under salt stress, but this cultivar had low osmotic potential (Figure 4B). High sugar accumulation in plants in response to salt stress has generally been reported in salt-resistant genotypes in many plant species [7,49]. However, it has also been reported that sugar metabolites do not correlate with the maintenance of osmotic potential in plants under salt stress conditions [50]. After salt stress was removed, osmotic potential was increased and sugar content was decreased in all rice lines/cultivars, suggesting that plants could recover to normal growth conditions.
High lipid peroxidation (indicated by MDA) caused by ROS resulted in cellular and membrane damage (indicated by EL). In the present study, increasing EL was found in all rice lines/cultivars under salt stress. KDML105 displayed the highest EL under salt stress. Other lines/cultivars had lower EL than KDML105 (Figure 5A). Similarly, a significant increase in MDA was found only in KDML105 under salt stress treatment, whereas no significant change was noted in all other rice lines/cultivars (Figure 5B). This finding indicated that membrane damage due to salt stress was most pronounced in KDML105, and the two CSSLs were more resistant than KDML105. The less severe membrane injury in CSSLs, as well as Pokkali and DH103, could be attributable to higher sugar accumulation in those plants under salt stress (Figure 4B). It was evident that sugar acts as an osmo-protectant and plays a crucial role in protecting membrane integrity during cell dehydration [51]. Thus, the higher sugar contents observed in CSSLs could be attributed to physiological mechanisms in which salt-tolerant rice plants adapt to protect themselves from cellular damage caused by salt stress.
In this study, higher H2O2 levels were noted in KDML105 and CSSL8-106, while no changes in H2O2 levels were observed in Pokkali, DH103 and CSSL8-103 (Figure 5C). As CAT is a key enzyme used to detoxify H2O2 into H2O and O2 [10], the elevated H2O2 levels observed in KDML105 and CSSL8-106 could be linked to their relatively low activity of CAT compared to other tolerant cultivars (Pokkali and DH103) (Figure 6B). Although high production of H2O2 and low activity of CAT were found in CSSL8-106, membrane injury of this rice line was less strongly affected than its recurrent parent, KDML105 (Figure 5A,B), suggesting that CSSL8-106 had other antioxidant defense mechanisms to protect against membrane damage from elevated ROS (H2O2). After recovery, SOD and CAT activities significantly increased, whereas H2O2 levels appeared to decrease, presumably because salt-induced ROS generation had been removed and the equilibrium between ROS generation and antioxidant machinery was re-established [8]. Increasing antioxidant enzymes, especially SOD, might result from the high production of ROS in chloroplasts during the enhanced photosynthesis process, as high PN values were observed in all rice lines/cultivars after the plants had recovered from stress (Figure 3A). Tripathy and Oelmüller [9] reported that aerobic metabolic activity, such as respiration and photosynthesis, caused ROS production.
Ion exclusion is a major salt tolerance mechanism in plants that serves to decrease Na+ and Cl uptake [4]. The higher Na+/K+ ratios were observed in the root rather than the leaf tissues (Figure 7). It was evident that salt-tolerant cultivars were imposing Na+ uptake at the roots while preserving more K+ throughout their tissues and translocating less Na+ to the shoots and leaves [52]. This process is clearly seen in the salt-tolerant genotype Pokkali (Figure 7 and Supplementary Figure S4), indicating efficient ion exclusion ability in this cultivar. Conversely, when salt was applied, DH103 accumulated the highest Na+, resulting in the highest Na+/K+ ratios being observed in this line. This finding indicates less ability to maintain ion homeostasis in the drought-tolerant donor DH103 (Figure 7 and Supplementary Figure S4). For CSSL8-103, the plants absorbed the highest Na+ in roots, similar to DH103. However, the Na+ content in leaf tissues was lower than that of DH103. In addition, the Na+/K+ ratio in this line was lower than that of DH103, suggesting better ion homeostasis regulation (Figure 7 and Supplementary Figure S4). Although no significant differences in leaf Na+/K+ ratios were detected among both CSSL lines and KDML105 (Figure 7B), salt-exposed CSSLs showed better growth than KDML105 (Figure 8). The superior salt tolerance ability of these lines is probably due to tissue tolerance mechanisms. Ion exclusion, osmotic stress tolerance and tissue tolerance are important mechanisms for salt tolerance in crop plants [53]. Moreover, Na ion content is not the only key factor which confers salt stress tolerance, because there are numerous physiological responses and tolerance levels among rice genotypes that accumulate the same level of Na ions [54].
A significant decrease in plant growth was observed in all rice lines/cultivars under salt stress conditions. However, the highest dry weight (DW) was found in the salt-tolerant genotype Pokkali, even though the percentage of reduction was higher than that in salt-stressed CSSL8-106 lines and DH103. The DW under stress of CSSL8-103 and CSSL8-106 was higher than that of parental KDML105 plants (Figure 8). These results suggested that both CSSL lines showed better growth than KDML105. The percentage reduction of DW in DH103 was the lowest, albeit the lowest DW compared to other lines/cultivars. This finding indicated that a drought-tolerant donor (DH103) showed higher tolerance to salt stress than did the recurrent parent, KDML105. Previous reports supported that salt-tolerant cultivars had fewer symptoms from salt stress than did salt-sensitive cultivars, leading to better growth performance [14,31,55].
When plants were allowed to recover from salt stress, the growth of all rice lines/cultivars significantly increased. The QTL donor DH103 showed the highest growth recovery percentage, followed by the recurrent parent KDML105, the salt-tolerant cultivar Pokkali, CSSL8-106 and CSSL8-103 (Figure 8). Growth recovery relies on physio-morphological adaptation, i.e., cell cycle activity, cell expansion and cell wall extensibility [56]. The high growth recovery of DH103 may be due to fewer negative impacts from salt stress. For KDML105, high growth recovery may result from the ability to maintain PSII during the stress period (Figure 3E), and the high efficiency of chlorophyll production at the recovery stage (Figure 1B), leading to a greater increase in photosynthesis rates (Figure 3A). In addition, KDML105 had lower Na+/K+ ratios in roots and leaves during recovery compared to those during stress (Figure 7). The growth recovery percentage of both CSSLs was lower than their recurrent parent, KDML105. This may be because the PSII system of both CSSLs was considerably more damaged during stress, and they were not able to produce more chlorophyll during the recovery period (Figure 1B and Figure 3E). Notably, CSSL8-103 had the lowest growth recovery percentage. This phenomenon could be caused by excessive Na+ uptake in roots and significantly reduced K+ uptake (Supplementary Figure S4). During the stress period, the roots of CSSL8-103 might have been seriously affected and may consequently have had less capacity to resume functions during the recovery period (Na+/K+ ratio remained high in the recovery period, Figure 7). The mechanisms responsible for recovery growth depend largely on root growth involving an increase in cell wall extensibility due to increased expansin activity and the recovery of cell cycle activity associated with the recovery of hormone signalling regulation [56]. In Pokkali, which is salt tolerant, the plants were able to retain relatively high biomass during the stress period; hence, this cultivar showed a lower percentage recovery than DH103 and KDML105. Moreover, the Na+/K+ ratio in roots of Pokkali after recovery was lower than that during the stress period (Figure 7).
The salt stress responses of CSSLs were clearly associated with chlorophyll- and photosynthesis-related parameters. However, CSSL8-103 and CSSL8-106, which are studied in the present work, displayed different physiological performances under salinity stress. This difference may be observed because different DT-QTL segments introgressed in their genome. Based on our previous reports, it can be summarized that CSSL with DT-QTLs in the RM3480 region tended to have higher salt tolerance than other lines [16,57]. Thus, CSSL8-106, which has a DT-QTL segment in the RM3480 region, performed better under salt stress than did CSSL8-103 (Supplementary Figure S2). It is evidenced that specific QTLs could be associated with stress-related phenotypes in crop plants [58]. Although CSSLs had lower capacity to tolerate salt stress than the salt-tolerant genotype Pokkali, both CSSLs showed several physiological responses indicative of higher tolerance over their genetic background, KDML105, during exposure to salt treatment. Therefore, these improved lines could be feasible candidate plant materials for genomic regions governing leaf greenness and photosynthetic traits to develop salt- and drought-tolerance jasmine rice (KDML105). Under natural conditions, drought or soil salinity can occur temporarily. Ideal crop plants should possess not only high tolerance during stress periods but also good capacity to resume growth after recovery. Therefore, new and improved cultivars with a KDML105 genetic background will exhibit stronger tolerance to drought and salt stress and will rapidly recover from stress symptoms.

5. Conclusions

There are many ways for plants to adapt to salinity stress. It was revealed that two lines of CSSLs, which were introgressed with DT-QTL from the donor plant DH103, showed physiological superiority (photosynthesis performance, ROS scavenging ability, less membrane damage and higher sugar) under salt stress conditions compared with their recurrent parent KDML105. Among the two CSSLs, CSSL8-106 was superior to CSSL8-103 especially in its lower reduction in chlorophyll content associated with the higher expression of chlorophyll biosynthesis genes. Although KDML105 was severely affected during the stress period, it showed better recovery compared to the CSSL lines. Better recovery ability may result from the ability to maintain photosynthetic machinery in PSII during the stress period and higher chlorophyll production during recovery. These findings may pave the way for further work attempting to improve the drought and salt tolerance of KDML105 rice and CSSL lines; in particular, CSSL8-106 is a line that may be used for gene dissection in breeding programs in the future. Moreover, Os08g41990, a gene in the chlorophyll biosynthesis pathway located on the introgressed QTL, might play a role in maintaining chlorophyll content under stress. It may be interesting to study the function of this putative gene in greater detail to further characterize its role in protecting plants from environmental stress.

Supplementary Materials

The following are available online at https://www.mdpi.com/2077-0472/10/12/620/s1, Figure S1: CSSL rice breeding scheme, Figure S2: genotype data of CSSLs; Figure S3: Primer list; Figure S4: Na and K ions in different tissues during stress and after recovery period.

Author Contributions

Conceptualization, N.N., W.M. and P.T.; methodology, N.N. and W.M.; validation, P.T.; formal analysis, N.N.; investigation, N.N.; resources, W.M., J.L.S. and T.T.; data curation, N.N.; writing—original draft preparation, N.N.; writing—review and editing, N.N., W.M., J.L.S., T.T. and P.T.; supervision, P.T., J.L.S. and T.T.; project administration, P.T.; funding acquisition, W.M. and P.T. All authors have read and agreed to the published version of the manuscript.

Funding

This research was funded by Research Affairs Khon Kaen University, grant number 61004703 and the scholarship under the Postdoctoral Program from Research Affairs and Graduate School, Khon Kaen University (58331).

Acknowledgments

The authors would like to thank Faculty of Agriculture, Khon Kaen University for kindly providing the greenhouse space, and also Viphot Kanjoo, University of Phayao, Thailand for providing the genotype data of the CSSL rice lines.

Conflicts of Interest

The authors declare no conflict of interest.

References

  1. Pongwichian, P. Agronomic Management of Saline Soil in Agricultural Lands of Thailand. Ph.D. Thesis, College of Bioresources Science, Nihon University, Tokio, Japan, 2016. [Google Scholar]
  2. Vanavichit, A.; Kamolsukyeunyong, W.; Siangliw, M.; Siangliw, J.L.; Traprab, S.; Ruengphayak, S.; Chaichoompu, E.; Saensuk, C.; Phuvanartnarubal, E.; Toojinda, T.; et al. Thai Hom Mali Rice: Origin and breeding for subsistence rainfed lowland rice system. Rice 2018, 11, 20. [Google Scholar] [CrossRef] [Green Version]
  3. Kanjoo, V.; Punyawaew, K.; Siangliw, J.L.; Jearakongman, S.; Vanavichit, A.; Toojinda, T. Evaluation of agronomic traits in chromosome segment substitution lines of KDML105 containing drought tolerance QTL under drought stress. Rice Sci. 2012, 19, 117–124. [Google Scholar] [CrossRef]
  4. Parihar, P.; Singh, S.; Singh, R.; Singh, V.P.; Prasad, S.M. Effect of salinity stress on plants and its tolerance strategies: A review. Environ. Sci. Pollut. Res. 2015, 22, 4056–4075. [Google Scholar] [CrossRef]
  5. Reddy, I.N.B.L.; Kim, B.-K.; Yoon, I.-S.; Kim, K.H.; Kwon, T.R. Salt tolerance in rice: Focus on mechanisms and approaches. Rice Sci. 2017, 24, 123–144. [Google Scholar] [CrossRef]
  6. Zivcak, M.; Brestic, M.; Sytar, O. Chapter 5 Osmotic adjustment and plant adaptation to drought stress. In Drought Stress Tolerance in Plants; Hossainh, M.A., Wani, S.H., Bhattacharjee, S., Burritt, D.J., Tran, L.S.P., Eds.; Springer International Publishing: Cham, Switzerland, 2016; Volume 1, pp. 105–143. [Google Scholar]
  7. Hajlaoui, H.; El Ayeb, N.; Garrec, J.P.; Denden, M. Differential effects of salt stress on osmotic adjustment and solutes allocation on the basis of root and leaf tissue senescence of two silage maize (Zea mays L.) varieties. Ind. Crops Prod. 2010, 31, 122–130. [Google Scholar] [CrossRef]
  8. Miller, G.; Suzuki, N.; Ciftci-Yilmaz, S.; Mittler, R. Reactive oxygen species homeostasis and signalling during drought and salinity stresses. Plant Cell Environ. 2010, 33, 453–637. [Google Scholar] [CrossRef]
  9. Tripathy, B.C.; Oelmüller, R. Reactive oxygen species generation and signaling in plants. Plant Signal. Behav. 2012, 7, 1621–1633. [Google Scholar] [CrossRef]
  10. Ahanger, M.A.; Tomar, N.S.; Tittal, M.; Argal, S.; Agarwal, R.M. Plant growth under water/salt stress: ROS production; antioxidants and significance of added potassium under such conditions. Physiol. Mol. Biol. Plants 2017, 23, 731–744. [Google Scholar] [CrossRef]
  11. Kibria, M.G.; Hossain, M.; Murata, Y.; Hoque Md, A. Antioxidant defense mechanisms of salinity tolerance in rice genotypes. Rice Sci. 2017, 24, 155–162. [Google Scholar] [CrossRef]
  12. Ahmed, I.M.; Nadira, U.A.; Bibi, N.; Cao, F.; He, X.; Zhang, G.; Wu, F. Secondary metabolism and antioxidants are involved in the tolerance to drought and salinity, separately and combined, in Tibetan wild barley. Environ. Exp. Bot. 2015, 111, 1–12. [Google Scholar] [CrossRef]
  13. Hand, M.J.; Taffouo, V.D.; Nouck, A.E.; Nyemene, K.P.; Tonfack, B.; Meguekam, T.L.; Youmbi, E. Effects of salt stress on plant growth, nutrient partitioning, chlorophyll content, Leaf relative water content, accumulation of osmolytes and antioxidant compounds in pepper (Capsicum annuum L.) cultivars. Not. Bot. Horti Agrobo. 2017, 45, 481–490. [Google Scholar] [CrossRef] [Green Version]
  14. Kanawapee, N.; Sanitchon, J.; Lontom, W.; Theerakulpisut, P. Evaluation of salt tolerance at the seedling stage in rice genotypes by growth performance, ion accumulation, proline and chlorophyll content. Plant Soil 2012, 358, 235–249. [Google Scholar] [CrossRef]
  15. Mahlooji, M.; Seyed Sharifi, R.; Razmjoo, J.; Sabzalian, M.R.; Sedghi, M. Effect of salt stress on photosynthesis and physiological parameters of three contrasting barley genotypes. Photosynthetica 2018, 56, 549–556. [Google Scholar] [CrossRef]
  16. Nounjan, N.; Chansongkrow, P.; Charoensawan, V.; Siangliw, J.L.; Toojinda, T.; Chadchawan, S.; Theerakulpisut, P. High performance of photosynthesis and osmotic adjustment are associated with salt tolerance ability in rice carrying drought tolerance QTL: Physiological and co-expression network analysis. Front. Plant Sci. 2018, 6, 1135. [Google Scholar] [CrossRef]
  17. Heuer, B. Chapter 40: Photosynthetic carbon metabolism of crops under salt stress. In Handbook of Photosynthesis, 2nd ed.; Pessarakli, M., Ed.; Taylor and Francis Group: Boca Raton, FL, USA, 2005; pp. 1–14. [Google Scholar]
  18. Ueda, A.; Yahagi, H.; Fujikawa, Y.; Nagaoka, T.; Esaka, M.; Calcaño, M.; González, M.M.; Martich, J.D.H.; Saneoka, H. Comparative physiological analysis of salinity tolerance in rice. Soil Sci. Plant Nutri. 2013, 59, 896–903. [Google Scholar] [CrossRef]
  19. Killi, D.; Haworth, M. Diffusive and metabolic constraints to photosynthesis in quinoa during drought and salt stress. Plants 2017, 6, 49. [Google Scholar] [CrossRef] [Green Version]
  20. Khan, F.; Upreti, P.; Singh, R.; Shukla, P.K.; Shirke, P.A. Physiological performance of two contrasting rice varieties under water stress. Physiol. Mol. Biol. Plants 2017, 23, 85–97. [Google Scholar] [CrossRef] [Green Version]
  21. Zhu, J.K. Abiotic stress signaling and responses in plants. Cell 2016, 167, 313–324. [Google Scholar] [CrossRef] [Green Version]
  22. Yoshida, S.; Forno, D.A.; Cock, J.H.; Gomez, K.A. Laboratory Manual for Physiological Studies of Rice; International Rice Research Institute: Los Banos, Philippines, 1976. [Google Scholar]
  23. Arnon, D.T. Copper enzyme in isolated chloroplasts polyphenoloxidase in Beta vulgari. Plant Physiol. 1949, 24, 1–15. [Google Scholar] [CrossRef] [Green Version]
  24. Livak, K.J.; Schmittgen, T.D. Analysis of relative gene expression data using real-time quantitative PCR and the 2(-Delta Delta C(T)) method. Methods 2001, 25, 402–408. [Google Scholar] [CrossRef]
  25. Larkunthod, P.; Nounjan, N.; Siangliw, J.L.; Toojinda, T.; Sanitchon, J.; Jongdee, B.; Theerakulpisut, P. Physiological responses under drought stress of improved drought-tolerant rice lines and their parents. Not. Bot. Horti Agrobo. 2018, 46, 679–687. [Google Scholar] [CrossRef] [Green Version]
  26. Filek, M.; Walas, S.; Mrowiec, H.; Rudolphy-SkÓrska, E.; Sieprawska, A.; Biesaga-Kościelniak, J. Membrane permeability and micro- and macroelement accumulation in spring wheat cultivars during the short-term effect of salinity-and PEG-induced water stress. Acta Physiol. Plant. 2012, 34, 985–995. [Google Scholar] [CrossRef] [Green Version]
  27. Heath, R.L.; Packer, L. Photoperoxidation in isolated chloroplasts. I. Kinetics and stoichiometry of fatty acid peroxidation. Arch. Biochem. Biophys. 1968, 125, 189–198. [Google Scholar] [CrossRef]
  28. Meisner, P.; Gębicki, J.L. Determination of hydroperoxides in aqueous solutions containing surfactants by the ferrous oxidation-xylenol orange method. Acta Biochim. Pol. 2009, 56, 523–527. [Google Scholar] [CrossRef]
  29. Nounjan, N.; Theerakulpisut, P. Effects of exogenous proline and trehalose on physiological responses in rice seedlings during salt-stress and after recovery. Plant Soil Environ. 2012, 58, 309–315. [Google Scholar] [CrossRef] [Green Version]
  30. Bradford, M.A. Rapid and sensitive method for the quantitation of microgram quantities of protein utilizing the principle of protein-dye binding. Anal. Biochem. 1976, 72, 248–254. [Google Scholar] [CrossRef]
  31. Kordrostami, M.; Rabiei, B.; Kumleh, H.H. Biochemical, physiological and molecular evaluation of rice cultivars differing in salt tolerance at the seedling stage. Physiol. Mol. Biol. Plants 2017, 23, 529–544. [Google Scholar] [CrossRef]
  32. Shah, S.H.; Houborg, R.; McCabe, M.F. Response of chlorophyll, carotenoid and SPAD-502 measurement to salinity and nutrient stress in wheat (Triticum aestivum L.). Agronomy 2017, 7, 61. [Google Scholar] [CrossRef] [Green Version]
  33. Shu, S.; Guo, S.R.; Sun, J.; Yuan, L.Y. Effects of salt stress on the structure and function of the photosynthetic apparatus in Cucumis sativus and its protection by exogenous putrescine. Physiol. Plant. 2012, 146, 285–296. [Google Scholar] [CrossRef]
  34. Dalal, V.K.; Tripathy, B.C. Modulation of chlorophyll biosynthesis by water stress in rice seedlings during chloroplast biogenesis. Plant Cell Environ. 2012, 35, 1685–1703. [Google Scholar] [CrossRef]
  35. Tanaka, R.; Tanaka, A. Tetrapyrrole biosynthesis in higher plants. Annu. Rev. Plant Biol. 2007, 58, 321–346. [Google Scholar] [CrossRef] [PubMed]
  36. Nagahatenna, D.S.; Langridge, P.; Whitford, R. Tetrapyrrole-based drought stress signalling. Plant Biotechnol. J. 2015, 13, 447–459. [Google Scholar] [CrossRef] [PubMed] [Green Version]
  37. Phung, T.H.; Jung, J.H.I.; Park, H.; Kim, J.G.; Back, K.; Jung, S. Porphyrin biosynthesis control under water stress: Sustained porphyrin status correlates with drought tolerance in transgenic rice. Plant Physiol. 2011, 157, 1746–1764. [Google Scholar] [CrossRef] [PubMed] [Green Version]
  38. Cornah, J.E.; Terry, M.J.; Smith, A.G. Green or red: What stops the traffic in the tetrapyrrole pathway? Trends Plant Sci. 2003, 8, 224–230. [Google Scholar] [CrossRef]
  39. Liu, X.; Li, L.; Li, M.; Su, L.; Lian, S.; Zhang, B.; Li, X.; Ge, K.; Li, L. AhGLK1 affects chlorophyll biosynthesis and photosynthesis in peanut leaves during recovery from drought. Sci. Rep. 2018, 8, 2250. [Google Scholar] [CrossRef] [PubMed] [Green Version]
  40. Gan, L.; Han, L.; Yin, S.; Jiang, Y. Chlorophyll metabolism and gene expression in response to submergence stress and subsequent recovery in perennial ryegrass accessions differing in growth habits. J. Plant Physiol. 2020, 251, 153195. [Google Scholar] [CrossRef]
  41. Chaves, M.M.; Flexas, J.; Pinheiro, C. Photosynthesis under drought and salt stress: Regulation mechanisms from whole plant to cell. Anal. Bot. 2009, 103, 551–560. [Google Scholar] [CrossRef] [Green Version]
  42. Liu, Y.; Du, H.; Wang, K. Differential photosynthetic responses to salinity stress between two perennial grass species contrasting in Salinity tolerance. HortScience 2011, 46, 311–316. [Google Scholar] [CrossRef] [Green Version]
  43. Dadkhah, A. Effect of salinity on growth and leaf photosynthesis of two sugar beet (Beta vulgaris L.) cultivars. J. Agric. Sci. Technol. 2011, 13, 1001–1012. [Google Scholar]
  44. Wang, X.; Wang, W.; Huang, J.; Peng, S.; Xiong, D. Diffusional conductance to CO2 is the key limitation to photosynthesis in salt-stressed leaves of rice (Oryza sativa). Physiol. Plant. 2018, 163, 45–58. [Google Scholar] [CrossRef] [Green Version]
  45. Lawlor, D.W.; Tezara, W. Causes of decreased photosynthetic rate and metabolic capacity in water-deficient leaf cells: A critical evaluation of mechanisms and integration of processes. Ann. Bot. 2009, 103, 561–579. [Google Scholar] [CrossRef] [PubMed] [Green Version]
  46. Varonea, L.; Ribas-Carbob, M.; Cardonac, C.; Galléb, A.; Medranob, H.; Gratania, L.; Flexasb, J. Stomatal and non-stomatal limitations to photosynthesis in seedlings and saplings of mediterranean species pre-conditioned and aged in nurseries: Different response to water stress. Environ. Exp. Bot. 2012, 75, 235–247. [Google Scholar] [CrossRef]
  47. Yi, X.P.; Zhang, Y.L.; Yao, H.S.; Luo, H.H.; Gou, L.; Chow, W.S.; Zhang, W.F. Rapid recovery of photosynthetic rate following soil water deficit and re-watering in cotton plants (Gossypium herbaceum L.) is related to the stability of the photosystems. J. Plant Physiol. 2016, 194, 23–34. [Google Scholar] [CrossRef] [PubMed]
  48. Chen, Z.; Cuin, T.A.; Zhou, M.; Twomey, A.; Naidu, B.P.; Shabala, S. Compatible solute accumulation and stress-mitigating effects in barley genotypes contrasting in their salt tolerance. J. Exp. Bot. 2007, 58, 4245–4255. [Google Scholar] [CrossRef] [Green Version]
  49. Sui, N.; Yang, Z.; Liu, M.; Wang, B. Identification and transcriptomic profiling of genes involved in increasing sugar content during salt stress in sweet sorghum leaves. BMC Genom. 2015, 16, 534. [Google Scholar] [CrossRef] [Green Version]
  50. Darko, E.; Gierczik, K.; Hudák, O.; Forgó, P.; Pál, M.; Türkösi, E.; Kovács, V.; Dulai, S.; Majláth, I.; Molnár, I.; et al. Differing metabolic responses to salt stress in wheat-barley addition lines containing different 7H chromosomal fragments. PLoS ONE 2017, 12, 0174170. [Google Scholar] [CrossRef] [Green Version]
  51. Sami, F.; Yusuf, M.; Faizan, M.; Faraz, A.; Hayat, S. Role of sugars under abiotic stress. Plant Physiol. Biochem. 2016, 109, 54–61. [Google Scholar] [CrossRef]
  52. Kavitha, P.G.; Miller, A.J.; Mathew, M.K.; Maathuis, F.J. Rice cultivars with differing salt tolerance contain similar cation channels in their root cells. J. Exp. Bot. 2012, 63, 3289–3296. [Google Scholar] [CrossRef] [Green Version]
  53. Roy, S.J.; Negrão, S.; Tester, M. Salt resistant crop plants. Curr. Opin. Biotech. 2014, 26, 115–124. [Google Scholar] [CrossRef]
  54. Pires, I.S.; Negrão, S.; Oliveira, M.M.; Purugganan, M.D. Comprehensive phenotypic analysis of rice (Oryza sativa) response to salinity stress. Physiol. Plant. 2015, 155, 43–54. [Google Scholar] [CrossRef] [Green Version]
  55. Lu, K.; Ding, W.; Zha, S.; Jiang, D. Salt-induced difference between Glycine cyrtoloba and G. max in anti-oxidative ability and K+ vs. Na+ selective accumulation. Crop J. 2016, 4, 129–138. [Google Scholar] [CrossRef] [Green Version]
  56. Julkowska, M.M.; Testerink, C. Tuning plant signaling and growth to survive salt. Trends Plant Sci. 2015, 20, 586–594. [Google Scholar] [CrossRef] [Green Version]
  57. Nounjan, N.; Siangliw, J.L.; Toojinda, T.; Chadchawan, S.; Theerakulpisut, P. Salt-responsive mechanisms in chromosome segment substitution linesof rice (Oryza sativa L. cv. KDML105). Plant Physiol. Biochem. 2016, 103, 96–105. [Google Scholar] [CrossRef] [PubMed]
  58. Liseron-Monfils, C.; Ware, D. Revealing gene regulation and associations through biological networks. Curr. Plant Biol. 2015, 3, 30–39. [Google Scholar] [CrossRef] [Green Version]
Figure 1. Photosynthetic pigments (A) SPAD values, (B) total chlorophyll content and chlorophyll a:b ratio (C) of rice plants under control and salt stress for 6 days (light gray bars) and after recovery for 4 days (black bars). C, control; S, salt stress. Pokkali, standard salt tolerant; DH103, drought tolerance quantitative trait loci (DT-QTL) donor; KDML105, recurrent parent; CSSL8-103 and CSSL8-106, improved lines. Values are means of four replications ± SE. Different letters indicate a significant difference in the means of each group (p ≤ 0.05).
Agriculture 10 00620 g001
Figure 2. Expression of genes involved in chlorophyll synthesis (A) HEMA, (B) GSA, (C) Os08g41990, (D) Os02g07230 of rice plants under control and salt stress for 6 days (light gray bars) and after recovery for 4 days (black bars). The histogram shows relative abundance of mRNA for each gene and each treatment after normalization with OsActin. C, control; S, salt stress. For a description of the genotypes, see Figure 1. The asterisk shown in each bar indicates statistically significant difference in gene expression (p ≤ 0.05) between control and salt stress in each period. All relative expression of each gene was normalized to the control condition in the same period.
Agriculture 10 00620 g002
Figure 3. Photosynthetic parameters (A) PN, (B) gs, (C) E, (D) Ci/Ca and (E) Fv/Fm of rice plants under control and salt stress for 6 days (light gray bars) and after recovery for 4 days (black bars). C, control; S, salt stress. For description of genotypes, see Figure 1. Values are means of four replications ± SE. Different letters indicate a significant difference in the means of each group (p ≤ 0.05).
Agriculture 10 00620 g003
Figure 4. (A) Osmotic potential and (B) total sugar content of rice plants under control and salt stress for 6 days (light gray bars) and after recovery for 4 days (black bars). C, control; S, salt stress. For a description of the genotypes, see Figure 1. Values are means of four replications ± SE. Different letters indicate a significant difference in the means of each group (p ≤ 0.05).
Agriculture 10 00620 g004
Figure 5. (A) Electrolyte leakage, (B) Malondialdehyde (MDA) content and (C) H2O2 content of rice plants under control and salt stress for 6 days (light gray bars) and after recovery for 4 days (black bars). C, control; S, salt stress. For description of genotypes, see Figure 1. Values are means of four replications ± SE. Different letters indicate a significant difference in the means of each group (p ≤ 0.05).
Agriculture 10 00620 g005
Figure 6. Antioxidant enzyme activities (A) Superoxide dismutase (SOD) and (B) Catalase (CAT) of rice plants under control and salt stress for 6 days (light gray bars) and after recovery for 4 days (black bars). C, control; S, salt stress. For a description of the genotypes, see Figure 1. Values are means of four replications ± SE. Different letters indicate a significant difference in the means of each group (p ≤ 0.05).
Agriculture 10 00620 g006
Figure 7. Na+/K+ ratio in (A) roots and (B) leaves of rice plants under control and salt stress for 6 days (light gray bars) and after recovery for 4 days (black bars). C, control; S, salt stress. For a description of the genotypes, see Figure 1. Values are means of four replications ± SE. Different letters indicate a significant difference in the means of each group (p ≤ 0.05).
Agriculture 10 00620 g007
Figure 8. Dry weight (DW) of rice plants under control and salt stress for 6 days (light gray bars) and after recovery for 4 days (black bars). C, control; S, salt stress. For a description of the genotypes, see Figure 1. Values are means of four replications ± SE. Different letters indicate a significant difference in the means of each group (p ≤ 0.05).
Agriculture 10 00620 g008
Publisher’s Note: MDPI stays neutral with regard to jurisdictional claims in published maps and institutional affiliations.

