Insular Cell Integrity Markers Linked to Weight Concern in Anorexia Nervosa—An MR-Spectroscopy Study

 , ,
, ,
Abstract
1. Introduction
Rationale of our Study
2. Methods and Materials
2.1. Participants
2.2. Ethics Statement
2.3. Psychometric Assessment
2.4. Procedure Before Scanning
2.5. Data Acquisition and Processing
2.6. Statistical Analyses
3. Results
3.1. Demographic and Psychometric Data
3.2. MRS
4. Discussion
4.1. Comparison to Earlier MRS Studies
4.2. Possible Implications of the Findings: Beyond Density, Volume, and Integrity Effects
4.3. Limitations
5. Summary
Supplementary Materials
Author Contributions
Funding
Acknowledgments
Conflicts of Interest
References
- Roux, H.; Chapelon, E.; Godart, N. Epidemiology of anorexia nervosa: A review. Encephale 2013, 39, 85–93. [Google Scholar] [CrossRef] [PubMed]
- Smink, F.R.E.; van Hoeken, D.; Hoek, H.W. Epidemiology of Eating Disorders: Incidence, Prevalence and Mortality Rates. Curr. Psychiatry Rep. 2012, 14, 406–414. [Google Scholar] [CrossRef] [PubMed]
- Swanson, S.A.; Crow, S.J.; Le Grange, D.; Swendsen, J.; Merikangas, K.R. Prevalence and correlates of eating disorders in adolescents. Results from the national comorbidity survey replication adolescent supplement. Arch. Gen. Psychiatry 2011, 68, 714–723. [Google Scholar] [CrossRef] [PubMed]
- Arcelus, J.; Mitchell, A.J.; Wales, J.; Nielsen, S. Mortality rates in patients with anorexia nervosa and other eating disorders. A meta-analysis of 36 studies. Arch. Gen. Psychiatry 2011, 68, 724–731. [Google Scholar] [CrossRef]
- Sullivan, P.F. Mortality in anorexia nervosa. Am. J. Psychiatry 1995, 152, 1073–1074. [Google Scholar]
- Birken, D.L.; Oldendorf, W.H. N-Acetyl-L-Aspartic acid: A literature review of a compound prominent in 1H-NMR spectroscopic studies of brain. Neurosci. Biobehav. Rev. 1989, 13, 23–31. [Google Scholar] [CrossRef]
- Baslow, M.H. Evidence supporting a role for N-acetyl-l-aspartate as a molecular water pump in myelinated neurons in the central nervous system: An analytical review. Neurochem. Int. 2002, 40, 295–300. [Google Scholar] [CrossRef]
- Bhakoo, K.K.; Pearce, D. In Vitro Expression of N-Acetyl Aspartate by Oligodendrocytes. J. Neurochem. 2000, 74, 254–262. [Google Scholar] [CrossRef]
- Blasel, S.; Pilatus, U.; Magerkurth, J.; Stauffenberg, M. von; Vronski, D.; Mueller, M.; Woeckel, L.; Hattingen, E. Metabolic gray matter changes of adolescents with anorexia nervosa in combined MR proton and phosphorus spectroscopy. Neuroradiology 2012, 54, 753–764. [Google Scholar] [CrossRef]
- Castro-Fornieles, J.; Bargalló, N.; Lázaro, L.; Andrés, S.; Falcon, C.; Plana, M.T.; Junqué, C. Adolescent anorexia nervosa: Cross-sectional and follow-up frontal gray matter disturbances detected with proton magnetic resonance spectroscopy. J. Psychiatr. Res. 2007, 41, 952–958. [Google Scholar] [CrossRef]
- Hentschel, J.; Möckel, R.; Schlemmer, H.P.; Markus, A.; Göpel, C.; Gückel, F.; Köpke, J.; Georgi, M.; Schmidt, M.H. 1H-MR spectroscopy in anorexia nervosa: The characteristic differences between patients and healthy subjects. ROFO Fortschr. Geb. Rontgenstr. Nuklearmed. 1999, 170, 284–289. [Google Scholar] [CrossRef] [PubMed]
- Joos, A.A.B.; Perlov, E.; Büchert, M.; Hartmann, A.; Saum, B.; Glauche, V.; Freyer, T.; Weber-Fahr, W.; Zeeck, A.; Tebartz van Elst, L. Magnetic resonance spectroscopy of the anterior cingulate cortex in eating disorders. Psychiatry Res. Neuroimag. 2011, 191, 196–200. [Google Scholar] [CrossRef] [PubMed]
- Schlemmer, H.P.; Möckel, R.; Marcus, A.; Hentschel, F.; Göpel, C.; Becker, G.; Köpke, J.; Gückel, F.; Schmidt, M.H.; Georgi, M. Proton magnetic resonance spectroscopy in acute, juvenile anorexia nervosa. Psychiatry Res. 1998, 82, 171–179. [Google Scholar] [CrossRef]
- Braitenberg, V.; Schüz, A. Cortical Architectonics. In Cortex: Statistics and Geometry of Neuronal Connectivity; Springer: Berlin/Heidelberg, Germany, 1998; pp. 135–137. ISBN 978-3-662-03735-5. [Google Scholar]
- Hasler, G.; Veen, J.W.; van der Tumonis, T.; Meyers, N.; Shen, J.; Drevets, W.C. Reduced Prefrontal Glutamate/Glutamine and γ-Aminobutyric Acid Levels in Major Depression Determined Using Proton Magnetic Resonance Spectroscopy. Arch. Gen. Psychiatry 2007, 64, 193–200. [Google Scholar] [CrossRef] [PubMed]
- Naaijen, J.; Lythgoe, D.J.; Amiri, H.; Buitelaar, J.K.; Glennon, J.C. Fronto-striatal glutamatergic compounds in compulsive and impulsive syndromes: A review of magnetic resonance spectroscopy studies. Neurosci. Biobehav. Rev. 2015, 52, 74–88. [Google Scholar] [CrossRef]
- Pollack, M.H.; Jensen, J.E.; Simon, N.M.; Kaufman, R.E.; Renshaw, P.F. High-field MRS study of GABA, glutamate and glutamine in social anxiety disorder: Response to treatment with levetiracetam. Prog. Neuropsychopharmacol. Biol. Psychiatry 2008, 32, 739–743. [Google Scholar] [CrossRef]
- Yüksel, C.; Öngür, D. Magnetic resonance spectroscopy studies of glutamate-related abnormalities in mood disorders. Biol. Psychiatry 2010, 68, 785–794. [Google Scholar] [CrossRef]
- Macrez, R.; Stys, P.K.; Vivien, D.; Lipton, S.A.; Docagne, F. Mechanisms of glutamate toxicity in multiple sclerosis: Biomarker and therapeutic opportunities. Lancet Neurol. 2016, 15, 1089–1102. [Google Scholar] [CrossRef]
- Bartha, R.; Williamson, P.C.; Drost, D.J.; Malla, A.; Carr, T.J.; Cortese, L.; Canaran, G.; Rylett, R.J.; Neufeld, R.W.J. Measurement of Glutamate and Glutamine in the Medial Prefrontal Cortex of Never-Treated Schizophrenic Patients and Healthy Controls by Proton Magnetic Resonance Spectroscopy. Arch. Gen. Psychiatry 1997, 54, 959–965. [Google Scholar] [CrossRef]
- Ohrmann, P.; Kersting, A.; Suslow, T.; Lalee-Mentzel, J.; Donges, U.-S.; Fiebich, M.; Arolt, V.; Heindel, W.; Pfleiderer, B. Proton magnetic resonance spectroscopy in anorexia nervosa: Correlations with cognition. Neuroreport 2004, 15, 549–553. [Google Scholar] [CrossRef]
- Godlewska, B.R.; Pike, A.; Sharpley, A.L.; Ayton, A.; Park, R.J.; Cowen, P.J.; Emir, U.E. Brain glutamate in anorexia nervosa: A magnetic resonance spectroscopy case control study at 7 Tesla. Psychopharmacology 2017, 234, 421–426. [Google Scholar] [CrossRef] [PubMed]
- Plitman, E.; de la Fuente-Sandoval, C.; Reyes-Madrigal, F.; Chavez, S.; Gómez-Cruz, G.; León-Ortiz, P.; Graff-Guerrero, A. Elevated Myo-Inositol, Choline, and Glutamate Levels in the Associative Striatum of Antipsychotic-Naive Patients With First-Episode Psychosis: A Proton Magnetic Resonance Spectroscopy Study With Implications for Glial Dysfunction. Schizophr. Bull. 2015, 42, 415–424. [Google Scholar] [CrossRef] [PubMed]
- Baek, H.-M.; Chen, J.-H.; Nalcioglu, O.; Su, M.-Y. Choline as a Biomarker for Cell Proliferation: Do the Results from Proton MR Spectroscopy Show Difference between HER2/neu Positive and Negative Breast Cancers? Int. J. Cancer J. Int. Cancer 2008, 123, 1219–1221. [Google Scholar] [CrossRef][Green Version]
- Castro-Fornieles, J.; Garcia, A.I.; Lazaro, L.; Andrés-Perpiñá, S.; Falcón, C.; Plana, M.T.; Bargallo, N. Prefrontal brain metabolites in short-term weight-recovered adolescent anorexia nervosa patients. Prog. Neuropsychopharmacol. Biol. Psychiatry 2010, 34, 1049–1053. [Google Scholar] [CrossRef] [PubMed]
- Wyss, M.; Kaddurah-Daouk, R. Creatine and Creatinine Metabolism. Physiol. Rev. 2000, 80, 1107–1213. [Google Scholar] [CrossRef]
- Soares, D.P.; Law, M. Magnetic resonance spectroscopy of the brain: Review of metabolites and clinical applications. Clin. Radiol. 2009, 64, 12–21. [Google Scholar] [CrossRef]
- Roser, W.; Bubl, R.; Buergin, D.; Seelig, J.; Radue, E.W.; Rost, B. Metabolic changes in the brain of patients with anorexia and bulimia nervosa as detected by proton magnetic resonance spectroscopy. Int. J. Eat. Disord. 1999, 26, 119–136. [Google Scholar] [CrossRef]
- Kato, T.; Shioiri, T.; Murashita, J.; Inubushi, T. Phosphorus-31 magnetic resonance spectroscopic observations in 4 cases with anorexia nervosa. Prog. Neuropsychopharmacol. Biol. Psychiatry 1997, 21, 719–724. [Google Scholar] [CrossRef]
- Möckel, R.; Schlemmer, H.P.; Gückel, F.; Göpel, C.; Becker, G.; Köpke, J.; Hentschel, F.; Schmidt, M.; Georgi, M. 1H-MR spectroscopy in anorexia nervosa: Reversible cerebral metabolic changes. ROFO Fortschr. Geb. Rontgenstr. Nuklearmed. 1999, 170, 371–377. [Google Scholar] [CrossRef]
- Rzanny, R.; Freesmeyer, D.; Reichenbach, J.R.; Mentzel, H.J.; Pfleiderer, S.O.R.; Klemm, S.; Gerhard, U.J.; Blanz, B.; Kaiser, W.A. 31P-MR spectroscopy of the brain in patients with anorexia nervosa: Characteristic differences in the spectra between patients and healthy control subjects. ROFO Fortschr. Geb. Rontgenstr. Nuklearmed. 2003, 175, 75–82. [Google Scholar] [CrossRef]
- Grzelak, P.; Gajewicz, W.; Wyszogrodzka-Kucharska, A.; Rotkiewicz, A.; Stefańczyk, L.; Góraj, B.; Rabe-Jabłońska, J. Brain metabolism alterations in patients with anorexia nervosa observed in 1H-MRS. Psychiatr. Pol. 2005, 39, 761–771. [Google Scholar] [PubMed]
- Bomba, M.; Riva, A.; Morzenti, S.; Grimaldi, M.; Neri, F.; Nacinovich, R. Global and regional brain volumes normalization in weight-recovered adolescents with anorexia nervosa: Preliminary findings of a longitudinal voxel-based morphometry study. Neuropsychiatr. Dis. Treat. 2015, 11, 637–645. [Google Scholar] [CrossRef] [PubMed]
- Brooks, S.J.; Barker, G.J.; O’Daly, O.G.; Brammer, M.; Williams, S.C.; Benedict, C.; Schiöth, H.B.; Treasure, J.; Campbell, I.C. Restraint of appetite and reduced regional brain volumes in anorexia nervosa: A voxel-based morphometric study. BMC Psychiatry 2011, 11, 179. [Google Scholar] [CrossRef] [PubMed]
- Frank, G.K.W.; Shott, M.E.; Hagman, J.O.; Yang, T.T. Localized Brain Volume and White Matter Integrity Alterations in Adolescent Anorexia Nervosa. J. Am. Acad. Child Adolesc. Psychiatry 2013, 52, 1066–1075. [Google Scholar] [CrossRef] [PubMed]
- Friederich, H.-C.; Walther, S.; Bendszus, M.; Biller, A.; Thomann, P.; Zeigermann, S.; Katus, T.; Brunner, R.; Zastrow, A.; Herzog, W. Grey matter abnormalities within cortico-limbic-striatal circuits in acute and weight-restored anorexia nervosa patients. NeuroImage 2012, 59, 1106–1113. [Google Scholar] [CrossRef] [PubMed]
- Wagner, A.; Greer, P.; Bailer, U.F.; Frank, G.K.; Henry, S.E.; Putnam, K.; Meltzer, C.C.; Ziolko, S.K.; Hoge, J.; McConaha, C.; et al. Normal Brain Tissue Volumes after Long-Term Recovery in Anorexia and Bulimia Nervosa. Biol. Psychiatry 2006, 59, 291–293. [Google Scholar] [CrossRef] [PubMed]
- Kerr, K.L.; Moseman, S.E.; Avery, J.A.; Bodurka, J.; Zucker, N.L.; Simmons, W.K. Altered Insula Activity during Visceral Interoception in Weight-Restored Patients with Anorexia Nervosa. Neuropsychopharmacology 2016, 41, 521–528. [Google Scholar] [CrossRef]
- Kim, K.R.; Ku, J.; Lee, J.-H.; Lee, H.; Jung, Y.-C. Functional and effective connectivity of anterior insula in anorexia nervosa and bulimia nervosa. Neurosci. Lett. 2012, 521, 152–157. [Google Scholar] [CrossRef]
- Oberndorfer, T.; Simmons, A.; McCurdy, D.; Strigo, I.; Matthews, S.; Yang, T.; Irvine, Z.; Kaye, W. Greater anterior insula activation during anticipation of food images in women recovered from anorexia nervosa versus controls. Psychiatry Res. Neuroimag. 2013, 214, 132–141. [Google Scholar] [CrossRef][Green Version]
- Strigo, I.A.; Matthews, S.C.; Simmons, A.N.; Oberndorfer, T.; Klabunde, M.; Reinhardt, L.E.; Kaye, W.H. Altered insula activation during pain anticipation in individuals recovered from anorexia nervosa: Evidence of interoceptive dysregulation. Int. J. Eat. Disord. 2013, 46, 23–33. [Google Scholar] [CrossRef]
- Nunn, K.; Frampton, I.; Gordon, I.; Lask, B. The fault is not in her parents but in her insula—A neurobiological hypothesis of anorexia nervosa. Eur. Eat. Disord. Rev. J. Eat. Disord. Assoc. 2008, 16, 355–360. [Google Scholar] [CrossRef] [PubMed]
- Nunn, K.; Frampton, I.; Fuglset, T.S.; Törzsök-Sonnevend, M.; Lask, B. Anorexia nervosa and the insula. Med. Hypotheses 2011, 76, 353–357. [Google Scholar] [CrossRef]
- Craig, A.D.B. How do you feel now? The anterior insula and human awareness. Nat. Rev. Neurosci. 2009, 10, 59–70. [Google Scholar] [CrossRef] [PubMed]
- Craig, A.D. Interoception: The sense of the physiological condition of the body. Curr. Opin. Neurobiol. 2003, 13, 500–505. [Google Scholar] [CrossRef]
- Paulus, M.P.; Stein, M.B. An insular view of anxiety. Biol. Psychiatry 2006, 60, 383–387. [Google Scholar] [CrossRef]
- Mazzola, L.; Royet, J.-P.; Catenoix, H.; Montavont, A.; Isnard, J.; Mauguière, F. Gustatory and olfactory responses to stimulation of the human insula. Ann. Neurol. 2017, 82, 360–370. [Google Scholar] [CrossRef]
- Small, D.M. Taste representation in the human insula. Brain Struct. Funct. 2010, 214, 551–561. [Google Scholar] [CrossRef]
- Haase, L.; Cerf-Ducastel, B.; Murphy, C. Cortical activation in response to pure taste stimuli during the physiological states of hunger and satiety. NeuroImage 2009, 44, 1008–1021. [Google Scholar] [CrossRef]
- Pujol, J.; Blanco-Hinojo, L.; Coronas, R.; Esteba-Castillo, S.; Rigla, M.; Martínez-Vilavella, G.; Deus, J.; Novell, R.; Caixàs, A. Mapping the sequence of brain events in response to disgusting food: Brain Response to Disgusting Food. Hum. Brain Mapp. 2018, 39, 369–380. [Google Scholar] [CrossRef]
- Critchley, H.D.; Harrison, N.A. Visceral Influences on Brain and Behavior. Neuron 2013, 77, 624–638. [Google Scholar] [CrossRef]
- Kaye, W.H.; Fudge, J.L.; Paulus, M. New insights into symptoms and neurocircuit function of anorexia nervosa. Nat. Rev. Neurosci. 2009, 10, 573–584. [Google Scholar] [CrossRef] [PubMed]
- Fydrich, T.; Renneberg, B.; Schmitz, B.; Wittchen, H.U. SKID-II. Strukturiertes Klinisches Interview für DSM-IV. Achse II: Persönlichkeitsstörungen, Interviewheft; Hogrefe: Gottingen, Germany, 1997. [Google Scholar]
- Wittchen, H.U.; Zaudig, M.; Fydrich, T. SKID. Strukturiertes Klinisches Interview für DSM-IV. Achse I und II, Handanweisung; Hogrefe: Gottingen, Germany, 1997. [Google Scholar]
- American Psychiatric Association. The Diagnostic and Statistical Manual of Mental Disorders: DSM 5; American Psychiatric Publishing: Arlington, TX, USA, 2013. [Google Scholar]
- Couturier, J.; Lock, J. What is remission in adolescent anorexia nervosa? A review of various conceptualizations and quantitative analysis. Int. J. Eat. Disord. 2006, 39, 175–183. [Google Scholar] [CrossRef] [PubMed]
- Hilbert, A.; Tuschen-Caffier, B.; Karwautz, A.; Niederhofer, H.; Munsch, S. Eating Disorder Examination-Questionnaire. Diagnostica 2007, 53, 144–154. [Google Scholar] [CrossRef]
- Hilbert, A.; Tuschen-Caffier, B.; Ohms, M. Eating Disorder Examination: Deutschsprachige Version des strukturierten Essstörungsinterviews. Diagnostica 2004, 50, 98–106. [Google Scholar] [CrossRef]
- Garner, D.M. Eating Disorder Inventory-2; Psychological Assessment Resources: Odessa, TX, USA, 1991. [Google Scholar]
- Meermann, R.; Napierski, C.; Schulenkorf, E. Eating Disorder Inventory (German Version); Walter de Gruyter: Berlin, Germany, 1987. [Google Scholar]
- Hautzinger, M.; Keller, F.; Kühner, C. Beck Depressions-Inventar (BDI-II); Harcourt Test Services: Frankfurt, Germany, 2006. [Google Scholar]
- Beck, A.T.; Steer, R.A. Beck Depression Inventory; The Psychological Corporation: San Antonio, TX, USA, 1987. [Google Scholar]
- Herzberg, P.; Goldschmidt, S.; Heinrichs, N. Beck Depressions-Inventar (BDI-II). Revis. Rep. Psychol. 2008, 33, 301–302. [Google Scholar]
- Provencher, S.W. Estimation of metabolite concentrations from localized in vivo proton NMR spectra. Magn. Reason. Med. 1993, 30, 672–679. [Google Scholar] [CrossRef]
- Provencher, S.W. Automatic quantitation of localized in vivo 1H spectra with LCModel. NMR Biomed. 2001, 14, 260–264. [Google Scholar] [CrossRef]
- Endres, D.; Perlov, E.; Maier, S.; Feige, B.; Nickel, K.; Goll, P.; Bubl, E.; Lange, T.; Glauche, V.; Graf, E.; et al. Normal Neurochemistry in the Prefrontal and Cerebellar Brain of Adults with Attention-Deficit Hyperactivity Disorder. Front. Behav. Neurosci. 2015, 9, 242. [Google Scholar] [CrossRef]
- Friston, K.J. Statistical Parametric Mapping: The Analysis of Functional Brain Images; Elsevier: Amsterdam, The Netherlands, 2008. [Google Scholar]
- R Core Team. R: A Language and Environment for Statistical Computing; R Foundation for Statistical Computing: Vienna, Austria, 2016. [Google Scholar]
- Todorov, V.; Filzmoser, P. Robust statistic for the one-way MANOVA. Comput. Stat. Data Anal. 2010, 54, 37–48. [Google Scholar] [CrossRef]
- Todorov, V.; Filzmoser, P. An Object-Oriented Framework for Robust Multivariate Analysis. J. Stat. Softw. 2009. [Google Scholar] [CrossRef]
- Wilcox, R.R. Introduction to Robust Estimation and Hypothesis Testing; Academic Press: Cambridge, MA, USA, 2011. [Google Scholar]
- Schoenbrodt, F.; Wilcox, R. WRS2: Wilcox Robust Estimation and Testing; Version 0.9; R Core Team: Vienna, Austria, 2017. [Google Scholar]
- Wilcox, R.R.; Tian, T.S. Measuring effect size: A robust heteroscedastic approach for two or more groups. J. Appl. Stat. 2011, 38, 1359–1368. [Google Scholar] [CrossRef]
- Benjamini, Y.; Hochberg, Y. Controlling the False Discovery Rate: A Practical and Powerful Approach to Multiple Testing. J. R. Stat. Soc. Ser. B Methodol. 1995, 57, 289–300. [Google Scholar] [CrossRef]
- Bang, L.; Rø, Ø.; Endestad, T. Normal gray matter volumes in women recovered from anorexia nervosa: A voxel-based morphometry study. BMC Psychiatry 2016, 16, 144. [Google Scholar] [CrossRef] [PubMed]
- Fuglset, T.S.; Endestad, T.; Hilland, E.; Bang, L.; Tamnes, C.K.; Landrø, N.I.; Rø, Ø. Brain volumes and regional cortical thickness in young females with anorexia nervosa. BMC Psychiatry 2016, 16, 404. [Google Scholar] [CrossRef] [PubMed]
- King, J.A.; Geisler, D.; Ritschel, F.; Boehm, I.; Seidel, M.; Roschinski, B.; Soltwedel, L.; Zwipp, J.; Pfuhl, G.; Marxen, M.; et al. Global cortical thinning in acute anorexia nervosa normalizes following long-term weight restoration. Biol. Psychiatry 2015, 77, 624–632. [Google Scholar] [CrossRef]
- Nickel, K.; Joos, A.; Elst, L.T.; van Matthis, J.; Holovics, L.; Endres, D.; Zeeck, A.; Hartmann, A.; Tüscher, O.; Maier, S. Recovery of cortical volume and thickness after remission from acute anorexia nervosa. Int. J. Eat. Disord. 2018, 51, 1056–1069. [Google Scholar] [CrossRef]
- Lavagnino, L.; Amianto, F.; Mwangi, B.; D’Agata, F.; Spalatro, A.; Zunta Soares, G.B.; Daga, G.A.; Mortara, P.; Fassino, S.; Soares, J.C. The relationship between cortical thickness and body mass index differs between women with anorexia nervosa and healthy controls. Psychiatry Res. Neuroimag. 2016, 248, 105–109. [Google Scholar] [CrossRef]
- Yan, H.-D.; Ishihara, K.; Serikawa, T.; Sasa, M. Activation by N-Acetyl-l-Aspartate of Acutely Dissociated Hippocampal Neurons in Rats via Metabotropic Glutamate Receptors. Epilepsia 2003, 44, 1153–1159. [Google Scholar] [CrossRef]
- Reiner, A.; Levitz, J. Glutamatergic Signaling in the Central Nervous System: Ionotropic and Metabotropic Receptors in Concert. Neuron 2018, 98, 1080–1098. [Google Scholar] [CrossRef]
- Hogeveen, J.; Bird, G.; Chau, A.; Krueger, F.; Grafman, J. Acquired alexithymia following damage to the anterior insula. Neuropsychologia 2016, 82, 142–148. [Google Scholar] [CrossRef]
- Lázaro, L.; Andrés, S.; Calvo, A.; Cullell, C.; Moreno, E.; Plana, M.T.; Falcón, C.; Bargalló, N.; Castro-Fornieles, J. Normal gray and white matter volume after weight restoration in adolescents with anorexia nervosa. Int. J. Eat. Disord. 2013, 46, 841–848. [Google Scholar] [CrossRef] [PubMed]
- Maier, S.; Schneider, K.; Stark, C.; Zeeck, A.; Tebartz van Elst, L.; Holovics, L.; Hartmann, A.; Lahmann, C.; Domschke, K.; Nickel, K.; et al. Fear Network Unresponsiveness in Women with Anorexia Nervosa. Psychother. Psychosom. 2018. [Google Scholar] [CrossRef] [PubMed]
- Leppanen, J.; Cardi, V.; Paloyelis, Y.; Simmons, A.; Tchanturia, K.; Treasure, J. Blunted neural response to implicit negative facial affect in anorexia nervosa. Biol. Psychol. 2017, 128, 105–111. [Google Scholar] [CrossRef] [PubMed]
- Croarkin, P.E.; Thomas, M.A.; Port, J.D.; Baruth, J.M.; Choi, D.-S.; Abulseoud, O.A.; Frye, M.A. N-acetylaspartate normalization in bipolar depression after lamotrigine treatment. Bipolar Disord. 2015, 17, 450–457. [Google Scholar] [CrossRef]
- Bang, L.; Treasure, J.; Rø, Ø.; Joos, A. Advancing our understanding of the neurobiology of anorexia nervosa: Translation into treatment. J. Eat. Disord. 2017, 5, 38. [Google Scholar] [CrossRef]


| Author | Patient Collective | Age | Sex | Patients/Controls | MR Method | Target Region | Results |
|---|---|---|---|---|---|---|---|
| Kato et al. (1997) [29] | AN (3 comorbid BN) | 18–32 | female | 4 (2 longitudinal)/13 | Localized 31P (TE = 20 ms) 1.5T | Frontal lobe | PDE/P total + decreasing after gaining weight |
| Schlemmer et al. (1998) [13] * | AN | 16 ± 1.9 | female | 10/17 | 1H SVS STEAM (TE = 50 ms) 1.5T | (1) Thalamus (2) parieto-occipital WM | (1) Cho/Cr+, NAA/Cho− |
| Möckel et al. (1999) [30] * | AN | 15.7 ± 1.7 | female | 22/17 (11 longitudinal) | 1H SVS STEAM (TE = 50 ms) 1.5T | (1) Thalamus (2) parieto-occiptal WM | Both: Cho/Cr+ normalization with recovery |
| Hentschel et al. (1999) [11] * | AN | 15.7 ± 1.7 | female | 15/17 | 1H SVS STEAM (TE = 50 ms) 1.5T | (1) Thalamus (2) parieto-occiptal WM | (1) Cho/Cr+ NAA/Cr+ |
| Roser et al. (1999) [28] | AN and BN | 10–28 | 19 female 1 male | 20/15 | 1H SVS STEAM (TE = 20 ms) 1.5T | (1) Frontal white matter (2) occipital gray matter, (3) cerebellum | (1) mI/Cr− lipid/Cr− (2) lipid/Cr− (3) all metabolites + except lipids |
| Rzanny et al. (2003) [31] | AN | 12–20 | female | 10/10 | Localized 31P (TE = 16 ms) 1.5T | Frontal lobe | PDE/P total− |
| Ohrmann et al. (2004) [21] | AN | 22.7 ± 3.8 | female | 10/12 | 1H SVS STEAM (TE = 20 ms) 1.5T | (1) Rostral ACC (2) dlPFC | (1) Glx− (2) Cr−, mI− |
| Grzelak et al. (2005) [32] | AN | 16–22 | female | 10/10 | 1H SVS STEAM (TE = 20 ms) 1.5T | Parietal WM, parietal GM | WM: lipid− |
| Castro-Fornieles et al. (2007) [10] | AN | 11–17 | female | 12/12 | 1H SVS PRESS (TE = 35 ms) 1.5T | Frontal grey matter | NAA−, Glx−, ml− 7 months follow-up NAA+ |
| Castro-Fornieles et al. (2010) [25] | AN vs. short-term recovered | 13–18 | female | 32/20 | 1H SVS PRESS (TE = 35 ms) 1.5T | prefrontal | Cho+, Cr+ |
| Joos et al. (2011) [12] | 10 BN 7AN | 24.8 ± 4.9 | female | 17/14 | 1H SVS PRESS (TE = 30 ms) 3T | ACC | No difference: NAA, Cho, Cr, mI, Glu, Glx |
| Blasel et al. (2012) [9] | AN | 14.4 ± 1.9 | female | 21/29 | 1H SVS PRESS (TE = 30 ms) 31P (TE = 2.3 ms) 3T | centrum semiovale (including ACC) | GM: Glx+, NAA+, Cr+, Cho+, lipid catabolites− |
| Godlewska et al. (2017) [22] | AN | 18–41 | female | 13/12 | 1H SVS STEAM (TE = 11 ms) 7T | ACC, occipital cortex and putamen | Glu− in all areas mI− in ACC and occipital lobe |
| Anorexia (n = 32) | Recovered (n = 21) | Healthy Controls (n = 33) | ANOVA | Post hoc t-Test Tukey-Kramer * | ||||
|---|---|---|---|---|---|---|---|---|
| Mean | SD | Mean | SD | Mean | SD | (d.f.; F; p) | ||
| Age (Years) | 23.7 | 4.2 | 27.6 | 5.2 | 23.2 | 3.4 | 2, 83; 5.8, 0.004 * | REC > AN, HC |
| Current BMI (kg/m2) | 16.2 | 1.3 | 20.6 | 1.3 | 22.1 | 2.4 | 2, 83; 91.0; <0.001 * | HC > REC > AN |
| Lowest-Lifetime BMI (kg/m2) | 14.8 | 1.4 | 15.1 | 2.2 | - | - | 2, 49; 0.5; 0.5 | - |
| Calorie Intake at Breakfast (kcal) | 135.9 | 161.9 | 297.7 | 128.1 | 399.3 | 86.4 | 2, 83; 23.7; <0.001 * | HC, RE > AN |
| EDE Total Score | 3.2 | 1.2 | 0.6 | 0.4 | 0.4 | 0.3 | 2, 83; 119.9; <0.001 * | AN > REC, HC |
| EDE Restraint | 3.4 | 1.4 | 0.5 | 0.7 | 0.4 | 0.5 | 2, 79; 90.2; <0.001 * | AN > REC, HC |
| EDE Eating Concern | 2.6 | 1.5 | 0.1 | 0.2 | 0.0 | 0.1 | 2, 79; 76.3; <0.001 * | AN > REC, HC |
| EDE Weight Concern | 3.1 | 1.4 | 0.7 | 0.5 | 0.4 | 0.3 | 2, 79; 76.4; <0.001 * | AN > REC, HC |
| EDE Shape Concern | 3.5 | 1.4 | 0.8 | 0.7 | 0.6 | 0.5 | 2, 79; 88.1, <0.001 * | AN > REC, HC |
| EDI- Total Score | 61.8 | 9.9 | 47.2 | 5.1 | 44.1 | 2.8 | 2, 83; 61.4; <0.001* | AN > REC, HC |
| Duration of Illness (Years) | 6.4 | 3.9 | 6.1 | 5.4 | - | - | 2, 46; 0.6; 0.5 | - |
| SIAB III | 7.4 | 4.8 | 4.5 | 5.5 | 2.7 | 3.2 | 2, 83; 9.1; <0.001 * | AN > REC, HC |
| BDI-II | 21.7 | 9.7 | 6.5 | 6.1 | 1.6 | 2.3 | 2, 83; 75.6; <0.001 * | AN > REC, HC |
| MWTB | 27.9 | 5.2 | 29.2 | 4.8 | 28.3 | 4.8 | 2, 83; 0.5; 0.6 | - |
| Partial GM Volume ** | 0.59 | 0.1 | 0.63 | 0.1 | 0.59 | 0.1 | 2,83; 2.3, 0.112 | - |
| Partial WM Volume ** | 0.30 | 0.1 | 0.27 | 0.1 | 0.32 | 0.1 | 2,83; 2.1, 0.134 | - |
| Partial CSF Volume ** | 0.11 | 0.0 | 0.11 | 0.1 | 0.10 | 0.0 | 2,83; 1.6, 0.202 | - |
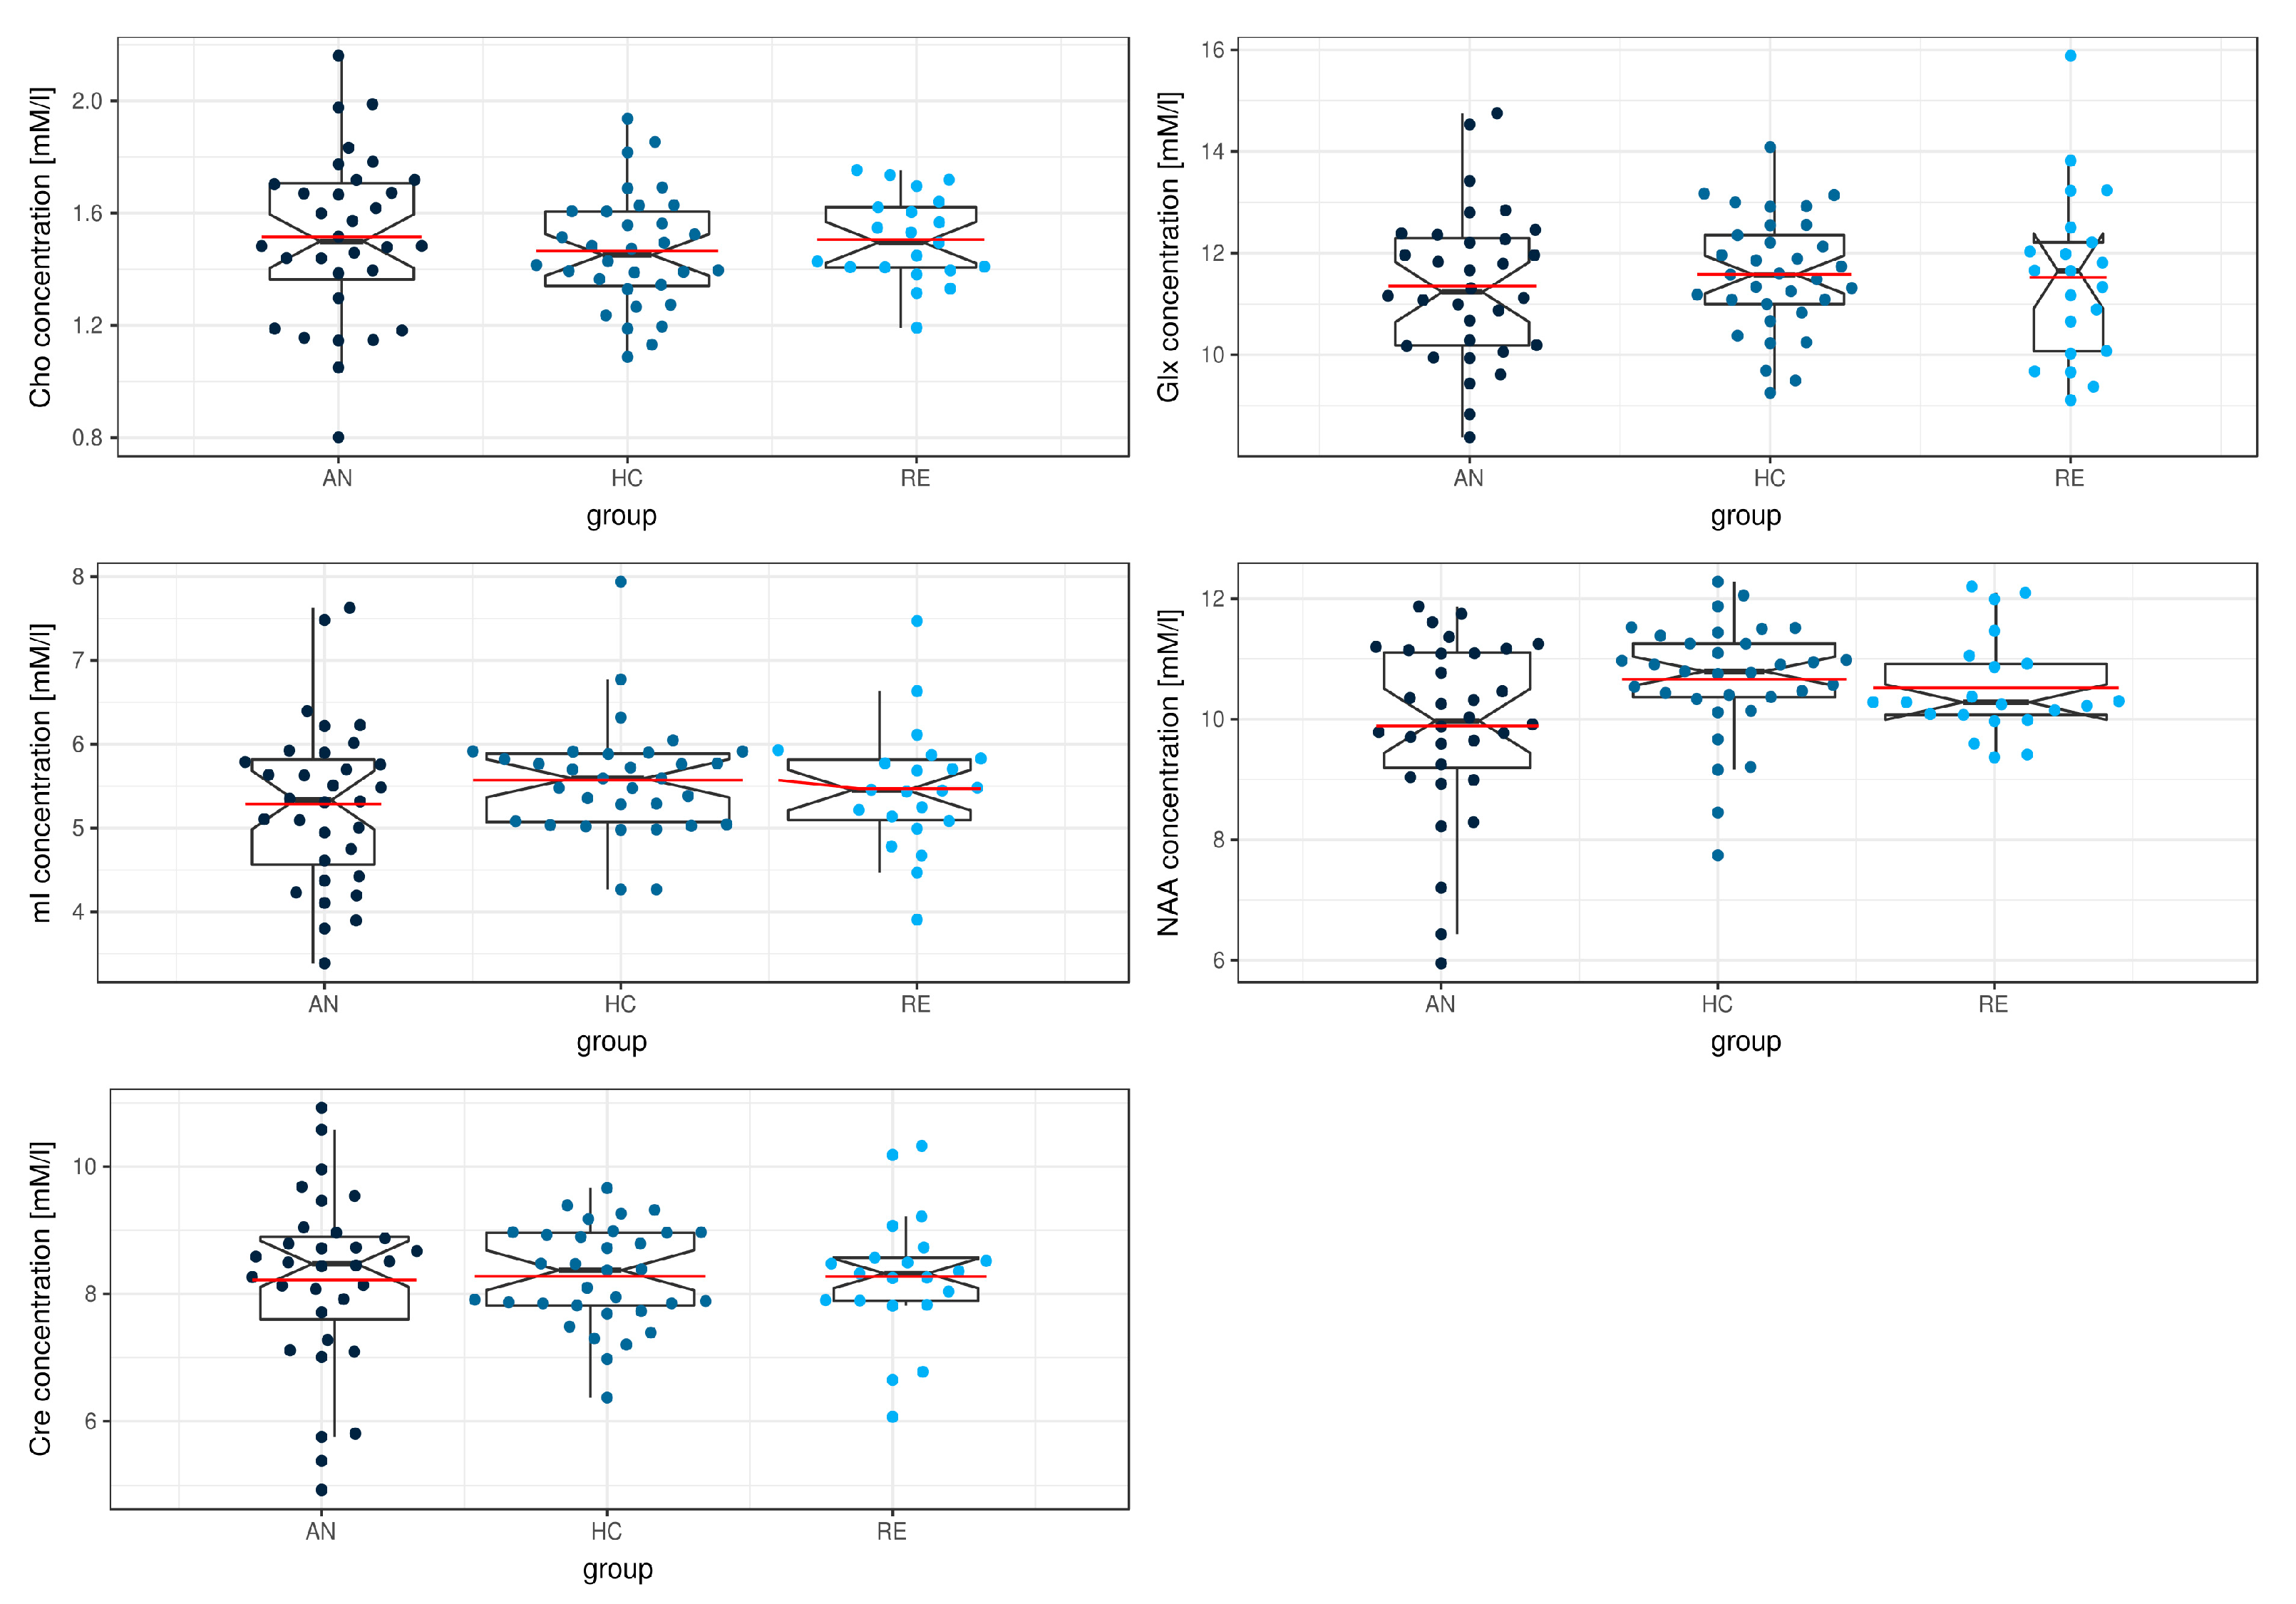
| Metabolite | ANOVA | Post-Hoc Lincon |
|---|---|---|
| Cho | F (2.32) = 0.53; p = 0.593; ξ = 0.17 | - |
| mI | F (2.31) = 1.06; p = 0.360; ξ = 0.22 | - |
| NAA | F (2.31) = 3.76; p = 0.034 *; ξ = 0.36 | AN < HC |
| Glx | F (2.28) = 0.39; p = 0.678; ξ = 0.11 | - |
| Cre | F (2.33) = 0.04; p = 0.963; ξ = 0.11 | - |
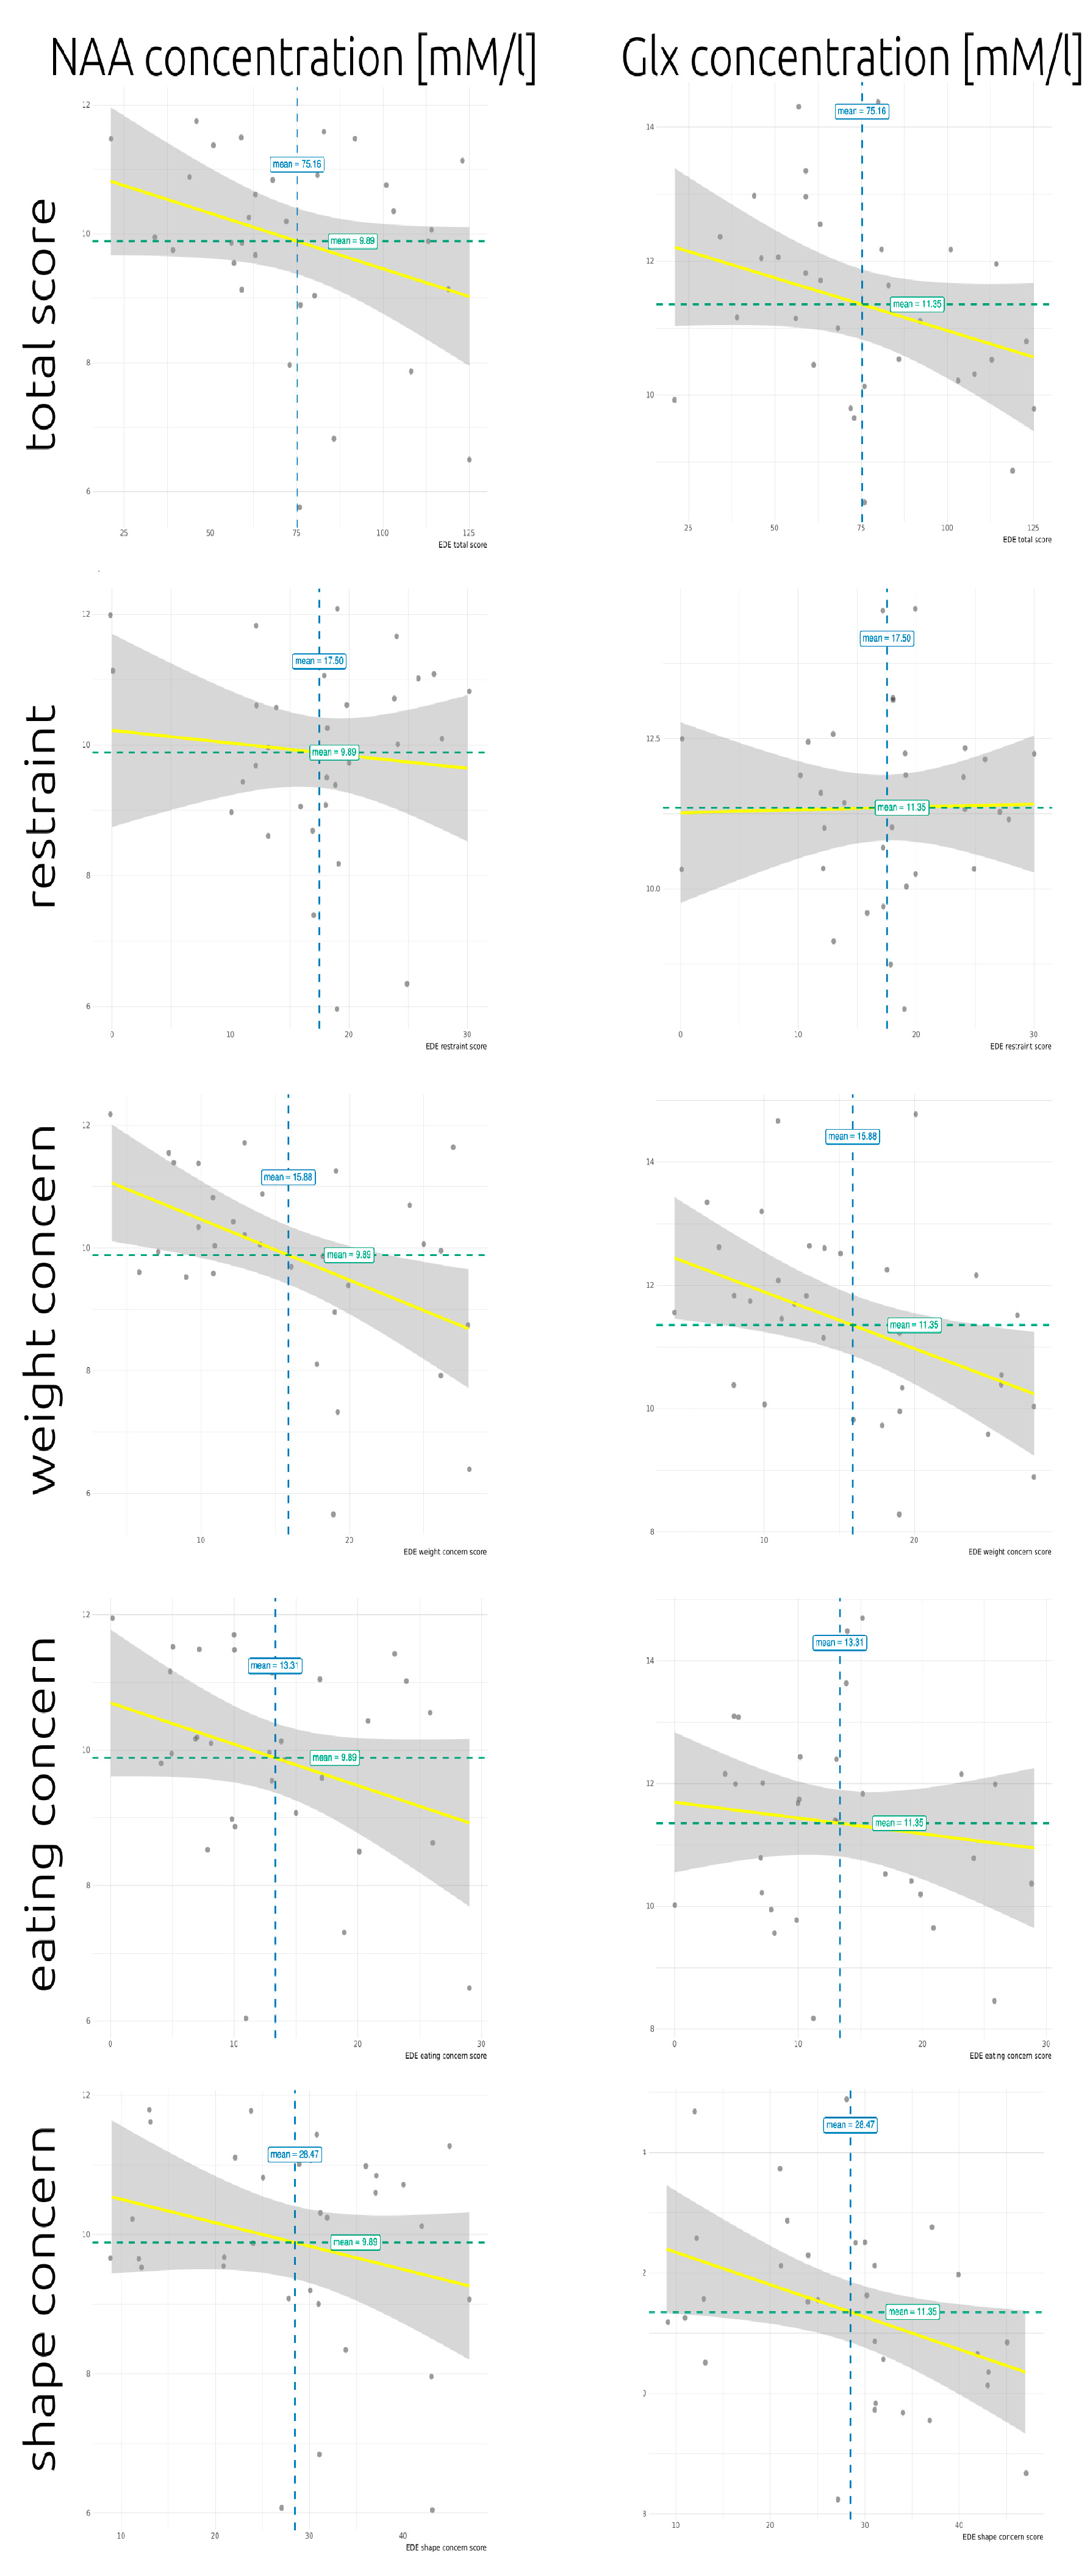
| Metabolite | Total Score | Restrain | Eating Concern | Weight Concern | Shape Concern |
|---|---|---|---|---|---|
| Cho | r = −0.09 p = 0.643 pFDR = 0.804 | r = −0.18 p = 0.315 pFDR = 0.525 | r = −0.09 p = 0.636 pFDR = 0.655 | r = −0.17 p = 0.365 pFDR = 0.457 | r = −0.12 p = 0.510 pFDR = 0.616 |
| mI | r = 0.03 p = 0.868 pFDR = 0.868 | r = 0.31 p = 0.080 pFDR = 0.398 | r = 0.08 p = 0.655 pFDR = 0.655 | r = −0.06 p = 0.733 pFDR = 0.733 | r = −0.09 p = 0.616 pFDR = 0.616 |
| NAA | r = −0.28 p = 0.120 pFDR = 0.300 | r = −0.06 p = 0.745 pFDR = 0.849 | r = −0.25 p = 0.174 pFDR = 0.655 | r = −0.46 p = 0.008* pFDR = 0.020 | r = −0.25 p = 0.171 pFDR = 0.322 |
| Glx | r = −0.33 p = 0.061 pFDR = 0.300 | r = −0.04 p = 0.849 pFDR = 0.849 | r = −0.16 p = 0.377 pFDR = 0.655 | r = −0.48 p = 0.005 * pFDR = 0.020 | r = −0.40 p = 0.025 * pFDR = 0.126 |
| Cre | r = −0.15 p = 0.423 pFDR = 0.705 | r = −0.23 p = 0.215 pFDR = 0.525 | r = −0.13 p = 0.489 pFDR = 0.655 | r = −0.25 p = 0.169 pFDR = 0.281 | r = −0.23 p = 0.193 pFDR = 0.322 |
© 2020 by the authors. Licensee MDPI, Basel, Switzerland. This article is an open access article distributed under the terms and conditions of the Creative Commons Attribution (CC BY) license (http://creativecommons.org/licenses/by/4.0/).
Share and Cite
Maier, S.; Nickel, K.; Perlov, E.; Kukies, A.; Zeeck, A.; Tebartz van Elst, L.; Endres, D.; Spieler, D.; Holovics, L.; Hartmann, A.; et al. Insular Cell Integrity Markers Linked to Weight Concern in Anorexia Nervosa—An MR-Spectroscopy Study. J. Clin. Med. 2020, 9, 1292. https://doi.org/10.3390/jcm9051292
Maier S, Nickel K, Perlov E, Kukies A, Zeeck A, Tebartz van Elst L, Endres D, Spieler D, Holovics L, Hartmann A, et al. Insular Cell Integrity Markers Linked to Weight Concern in Anorexia Nervosa—An MR-Spectroscopy Study. Journal of Clinical Medicine. 2020; 9(5):1292. https://doi.org/10.3390/jcm9051292
Chicago/Turabian StyleMaier, Simon, Kathrin Nickel, Evgeniy Perlov, Alina Kukies, Almut Zeeck, Ludger Tebartz van Elst, Dominique Endres, Derek Spieler, Lukas Holovics, Armin Hartmann, and et al. 2020. "Insular Cell Integrity Markers Linked to Weight Concern in Anorexia Nervosa—An MR-Spectroscopy Study" Journal of Clinical Medicine 9, no. 5: 1292. https://doi.org/10.3390/jcm9051292
APA StyleMaier, S., Nickel, K., Perlov, E., Kukies, A., Zeeck, A., Tebartz van Elst, L., Endres, D., Spieler, D., Holovics, L., Hartmann, A., Dacko, M., Lange, T., & Joos, A. (2020). Insular Cell Integrity Markers Linked to Weight Concern in Anorexia Nervosa—An MR-Spectroscopy Study. Journal of Clinical Medicine, 9(5), 1292. https://doi.org/10.3390/jcm9051292