Tc-99m TRODAT-1 SPECT is a Potential Biomarker for Restless Leg Syndrome in Patients with End-Stage Renal Disease

 ,
,
Abstract
1. Introduction
2. Materials and Methods
2.1. Ethics
2.2. Study Design
2.3. Demographic Data, Biochemical and Hematologic Results
2.4. Urinary Heavy Metal Analysis
2.5. Statistics
3. Results
4. Discussion
Author Contributions
Acknowledgments
Conflicts of Interest
References
- Inker, L.A.; Astor, B.C.; Fox, C.H.; Isakova, T.; Lash, J.P.; Peralta, C.A.; Kurella Tamura, M.; Feldman, H.I. KDOQI US commentary on the 2012 KDIGO clinical practice guideline for the evaluation and management of CKD. Am. J. Kidney Dis. 2014, 63, 713–735. [Google Scholar] [CrossRef] [PubMed]
- Zoccali, C.; Vanholder, R.; Massy, Z.A.; Ortiz, A.; Sarafidis, P.; Dekker, F.W.; Fliser, D.; Fouque, D.; Heine, G.H.; Jager, K.J.; et al. The systemic nature of CKD. Nat. Rev. Nephrol. 2017, 13, 344–358. [Google Scholar] [CrossRef]
- Jabbari, B.; Vaziri, N.D. The nature, consequences, and management of neurological disorders in chronic kidney disease. Hemodial. Int. 2018, 22, 150–160. [Google Scholar] [CrossRef] [PubMed]
- Allen, R.P.; Picchietti, D.L.; Garcia-Borreguero, D.; Ondo, W.G.; Walters, A.S.; Winkelman, J.W.; Zucconi, M.; Ferri, R.; Trenkwalder, C.; Lee, H.B. Restless legs syndrome/Willis–Ekbom disease diagnostic criteria: Updated International Restless Legs Syndrome Study Group (IRLSSG) consensus criteria—History, rationale, description, and significance. Sleep Med. 2014, 15, 860–873. [Google Scholar] [CrossRef]
- Trenkwalder, C.; Allen, R.; Hogl, B.; Paulus, W.; Winkelmann, J. Restless legs syndrome associated with major diseases: A systematic review and new concept. Neurology 2016, 86, 1336–1343. [Google Scholar] [CrossRef]
- Gade, K.; Blaschke, S.; Rodenbeck, A.; Becker, A.; Anderson-Schmidt, H.; Cohrs, S. Uremic restless legs syndrome (RLS) and sleep quality in patients with end-stage renal disease on hemodialysis: Potential role of homocysteine and parathyroid hormone. Kidney Blood Press. Res. 2013, 37, 458–463. [Google Scholar] [CrossRef]
- Gigli, G.L.; Adorati, M.; Dolso, P.; Piani, A.; Valente, M.; Brotini, S.; Budai, R. Restless legs syndrome in end-stage renal disease. Sleep Med. 2004, 5, 309–315. [Google Scholar] [CrossRef]
- Gkizlis, V.; Giannaki, C.D.; Karatzaferi, C.; Hadjigeorgiou, G.M.; Mihas, C.; Koutedakis, Y.; Stefanidis, I.; Sakkas, G.K. Uremic versus idiopathic restless legs syndrome: Impact on aspects related to quality of life. ASAIO J. 2012, 58, 607–611. [Google Scholar] [CrossRef]
- Rizzo, G.; Li, X.; Galantucci, S.; Filippi, M.; Cho, Y.W. Brain imaging and networks in restless legs syndrome. Sleep Med. 2017, 31, 39–48. [Google Scholar] [CrossRef]
- Michaud, M.; Soucy, J.P.; Chabli, A.; Lavigne, G.; Montplaisir, J. SPECT imaging of striatal pre- and postsynaptic dopaminergic status in restless legs syndrome with periodic leg movements in sleep. J. Neurol. 2002, 249, 164–170. [Google Scholar] [CrossRef]
- Jimenez-Jimenez, F.J.; Alonso-Navarro, H.; Garcia-Martin, E.; Agundez, J.A.G. Neurochemical features of idiopathic restless legs syndrome. Sleep Med. Rev. 2019, 45, 70–87. [Google Scholar] [CrossRef]
- Bao, S.Y.; Wu, J.C.; Luo, W.F.; Fang, P.; Liu, Z.L.; Tang, J. Imaging of dopamine transporters with technetium-99m TRODAT-1 and single photon emission computed tomography. J. Neuroimaging 2000, 10, 200–203. [Google Scholar] [CrossRef]
- Kung, H.F.; Kung, M.P.; Choi, S.R. Radiopharmaceuticals for single-photon emission computed tomography brain imaging. Semin. Nucl. Med. 2003, 33, 2–13. [Google Scholar] [CrossRef] [PubMed]
- Lin, C.C.; Fan, Y.M.; Lin, G.Y.; Yang, F.C.; Cheng, C.A.; Lu, K.C.; Lin, J.C.; Lee, J.T. 99mTc-TRODAT-1 SPECT as a Potential Neuroimaging Biomarker in Patients With Restless Legs Syndrome. Clin. Nucl. Med. 2016, 41, e14–e17. [Google Scholar] [CrossRef] [PubMed]
- Allen, R.P.; Picchietti, D.; Hening, W.A.; Trenkwalder, C.; Walters, A.S.; Montplaisi, J. Restless legs syndrome: Diagnostic criteria, special considerations, and epidemiology: A report from the restless legs syndrome diagnosis and epidemiology workshop at the National Institutes of Health. Sleep Med. 2003, 4, 101–119. [Google Scholar] [CrossRef]
- Huang, W.S.; Chiang, Y.H.; Lin, J.C.; Chou, Y.H.; Cheng, C.Y.; Liu, R.S. Crossover study of (99m)Tc-TRODAT-1 SPECT and (18)F-FDOPA PET in Parkinson’s disease patients. J. Nucl. Med. 2003, 44, 999–1005. [Google Scholar] [PubMed]
- Huang, Y.C.; Ning, H.C.; Chen, S.S.; Lin, C.N.; Wang, I.K.; Weng, S.M.; Weng, C.H.; Hsu, C.W.; Huang, W.H.; Lu, J.J.; et al. Survey of urinary nickel in peritoneal dialysis patients. Oncotarget 2017, 8, 60469–60478. [Google Scholar] [CrossRef]
- Kim, H.; Kim, I.J.; Kim, S.J.; Song, S.H.; Pak, K.; Kim, K. Quantification of Tc-99m-ethyl cysteinate dimer brain single photon emission computed tomography images using statistical probabilistic brain atlas in depressive end-stage renal disease patients: Correlation with disease severity and symptom factors. Neural Regen. Res. 2012, 7, 2151. [Google Scholar] [CrossRef]
- Turjanski, N.; Lees, A.J.; Brooks, D.J. Striatal dopaminergic function in restless legs syndrome: 18F-dopa and 11C-raclopride PET studies. Neurology 1999, 52, 932–937. [Google Scholar] [CrossRef]
- Ruottinen, H.M.; Partinen, M.; Hublin, C.; Bergman, J.; Haaparanta, M.; Solin, O.; Rinne, J.O. An FDOPA PET study in patients with periodic limb movement disorder and restless legs syndrome. Neurology 2000, 54, 502–504. [Google Scholar] [CrossRef]
- Wang, I.K.; Lin, C.L.; Wu, Y.Y.; Chou, C.Y.; Lin, S.Y.; Liu, J.H.; Yen, T.H.; Huang, C.C.; Sung, F.C. Increased risk of Parkinson’s disease in patients with end-stage renal disease: A retrospective cohort study. Neuroepidemiology 2014, 42, 204–210. [Google Scholar] [CrossRef]
- Baba, Y.; Higuchi, M.A.; Fukuyama, K.; Abe, H.; Uehara, Y.; Inoue, T.; Yamada, T. Effect of chronic kidney disease on excessive daytime sleepiness in Parkinson disease. Eur. J. Neurol. 2011, 18, 1299–1303. [Google Scholar] [CrossRef] [PubMed]
- Deng, Q.; Zhou, X.; Chen, J.; Pan, M.; Gao, H.; Zhou, J.; Wang, D.; Chen, Q.; Zhang, X.; Wang, Q.; et al. Lower hemoglobin levels in patients with parkinson’s disease are associated with disease severity and iron metabolism. Brain Res. 2017, 1655, 145–151. [Google Scholar] [CrossRef] [PubMed]
- Hong, C.T.; Huang, Y.H.; Liu, H.Y.; Chiou, H.Y.; Chan, L.; Chien, L.N. Newly Diagnosed Anemia Increases Risk of Parkinson’s disease: A Population-Based Cohort Study. Sci. Rep. 2016, 6, 29651. [Google Scholar] [CrossRef]
- Roberts, K.M.; Fitzpatrick, P.F. Mechanisms of tryptophan and tyrosine hydroxylase. IUBMB Life 2013, 65, 350–357. [Google Scholar] [CrossRef] [PubMed]
- Babitt, J.L.; Lin, H.Y. Mechanisms of anemia in CKD. J. Am. Soc. Nephrol. 2012, 23, 1631–1634. [Google Scholar] [CrossRef] [PubMed]
- Johansen, J.L.; Sager, T.N.; Lotharius, J.; Witten, L.; Mork, A.; Egebjerg, J.; Thirstrup, K. HIF prolyl hydroxylase inhibition increases cell viability and potentiates dopamine release in dopaminergic cells. J. Neurochem. 2010, 115, 209–219. [Google Scholar] [CrossRef] [PubMed]
- Rambod, M.; Kovesdy, C.P.; Kalantar-Zadeh, K. Combined high serum ferritin and low iron saturation in hemodialysis patients: The role of inflammation. Clin. J. Am. Soc. Nephrol. 2008, 3, 1691–1701. [Google Scholar] [CrossRef]
- Babitt, J.L.; Lin, H.Y. Molecular mechanisms of hepcidin regulation: Implications for the anemia of CKD. Am. J. Kidney Dis. 2010, 55, 726–741. [Google Scholar] [CrossRef]
- London, G.M. Arterial Stiffness in Chronic Kidney Disease and End-Stage Renal Disease. Blood Purif. 2018, 45, 154–158. [Google Scholar] [CrossRef]
- Zanoli, L.; Lentini, P.; Briet, M.; Castellino, P.; House, A.A.; London, G.M.; Malatino, L.; McCullough, P.A.; Mikhailidis, D.P.; Boutouyrie, P. Arterial Stiffness in the Heart Disease of CKD. J. Am. Soc. Nephrol. 2019, 30, 918–928. [Google Scholar] [CrossRef]
- Hou, Y.C.; Lu, C.L.; Lu, K.C. Mineral bone disorders in chronic kidney disease. Nephrology 2018, 23, 88–94. [Google Scholar] [CrossRef] [PubMed]
- Tanaka, M.; Komaba, H.; Fukagawa, M. Emerging Association between Parathyroid Hormone and Anemia in Hemodialysis Patients. Ther. Apheresis Dial. 2018, 22, 242–245. [Google Scholar] [CrossRef] [PubMed]
- De Rosa, A.; Rinaldi, C.; Tucci, T.; Pappatà, S.; Rossi, F.; Morra, V.B.; Faggiano, A.; Colao, A.; De Michele, G. Co-existence of primary hyperparathyroidism and Parkinson’s disease in three patients: An incidental finding? Parkinsonism Relat. Disord. 2011, 17, 771–773. [Google Scholar] [CrossRef]
- An, H.X.; Jin, Z.F.; Ge, X.F.; Wu, J.; Chen, C.; Zhang, F.M.; Qu, W.; Liu, X.G.; Liu, S.Y. Parathyroid hormone(1-34)-induced apoptosis in neuronal rat PC12 cells: Implications for neurotoxicity. Pathol. Res. Pract. 2010, 206, 821–827. [Google Scholar] [CrossRef]
- Tonelli, M.; Wiebe, N.; Hemmelgarn, B.; Klarenbach, S.; Field, C.; Manns, B.; Thadhani, R.; Gill, J. Alberta Kidney Disease Network Trace elements in hemodialysis patients: A systematic review and meta-analysis. BMC Med. 2009, 7, 25. [Google Scholar] [CrossRef]
- Zima, T.; Tesar, V.; Mestek, O.; Nemecek, K. Trace elements in end-stage renal disease. 2. Clinical implication of trace elements. Blood Purif. 1999, 17, 187–198. [Google Scholar] [CrossRef]
- Scheiber, I.F.; Bruha, R.; Dusek, P. Pathogenesis of Wilson disease. Handb. Clin. Neurol. 2017, 142, 43–55. [Google Scholar] [CrossRef]
- Malavolta, M.; Giacconi, R.; Piacenza, F.; Santarelli, L.; Cipriano, C.; Costarelli, L.; Tesei, S.; Pierpaoli, S.; Basso, A.; Galeazzi, R.; et al. Plasma copper/zinc ratio: An inflammatory/nutritional biomarker as predictor of all-cause mortality in elderly population. Biogerontology 2010, 11, 309–319. [Google Scholar] [CrossRef]
- Kernan, K.F.; Carcillo, J.A. Hyperferritinemia and inflammation. Int. Immunol. 2017, 29, 401–409. [Google Scholar] [CrossRef]
- Mozley, P.D.; Stubbs, J.B.; Plössl, K.; Dresel, S.H.; Barraclough, E.D.; Alavi, A.; Araujo, L.I.; Kung, H.F. Biodistribution and dosimetry of TRODAT-1: A technetium-99m tropane for imaging dopamine transporters. J. Nucl. Med. 1998, 39, 2069–2076. [Google Scholar] [PubMed]


| Control Group (n = 13) | ESRD without RLS (n = 8) | ESRD with RLS (n = 11) | |||||
|---|---|---|---|---|---|---|---|
| Number | Percentage | Number | Percentage | Number | Percentage | p Value | |
| Age | 38.85 | 17.58 | 65.25 | 12.79 | 57.90 | 8.99 | 0.001 * |
| Male | 7 | 53.85 | 7 | 87.5 | 6 | 60 | 0.275 |
| Diabetes mellitus | 0 | 0 | 4 | 50 | 5 | 50 | 0.01 * |
| Medication | |||||||
| ACEi/ARB | 0 | 0 | 1 | 12.5 | 1 | 10 | 0.329 |
| Calcium channel blocker | 0 | 0 | 2 | 25 | 1 | 10 | 0.088 |
| Beta-blocker | 0 | 0 | 2 | 25 | 1 | 10 | 0.088 |
| Statin | 0 | 0 | 0 | 0 | 1 | 10 | 0.276 |
| DPP4 inhibitor | 0 | 0 | 0 | 0 | 1 | 10 | 0.276 |
| Control Group | ESRD without RLS | ESRD with RLS | |||||
|---|---|---|---|---|---|---|---|
| Mean | SD | Mean | SD | Mean | SD | p Value | |
| White blood cell count (/mL | 7855.38 | 1773.38 | 5783.75 | 1265.03 | 7849.00 | 2435.08 | 0.045 * |
| Hemoglobin (g/dL) | 14.63 | 0.73 | 11.11 | 0.93 | 10.91 | 0.82 | 0 * |
| Platelet count (×103/dL) | 264.38 | 54.21 | 164.50 | 57.15 | 197.91 | 48.37 | 0.001 * |
| MCV | 84.58 | 3.08 | 92.20 | 4.66 | 90.03 | 4.64 | 0.001 * |
| Blood urea nitrogen (U/dL) | 14.92 | 4.86 | 75.75 | 24.41 | 73.64 | 27.43 | 0 * |
| Creatinine (mg/dL | 0.87 | 0.21 | 9.99 | 2.22 | 9.45 | 4.12 | 0 * |
| Glomerular filtration rate (mL/min) | 97.71 | 29.20 | 5.69 | 1.51 | 8.94 | 10.80 | 0 * |
| Calcium (mg/dL) | 9.18 | 0.47 | 9.26 | 0.76 | 9.07 | 1.17 | 0.881 |
| Phosphorous(mg/dL) | 3.94 | 0.86 | 5.92 | 1.34 | 6.39 | 2.21 | 0.002 * |
| Sodium (mEg/L) | 138.67 | 2.08 | 138.00 | 2.45 | 137.33 | 2.35 | 0.672 |
| Potassium (mEq/L) | 4.07 | 0.24 | 4.74 | 0.53 | 4.80 | 0.85 | 0.129 |
| Triglyceride | 128.75 | 60.63 | 99.29 | 51.57 | 127.57 | 66.97 | 0.584 |
| GOT | 61.17 | 36.20 | 40.63 | 57.74 | 21.56 | 8.55 | 0.18 |
| GPT | 33.50 | 30.41 | 16.00 | 3.74 | 21.11 | 13.82 | 0.237 |
| uric acid (mg/dL) | 5.80 | 1.36 | 6.68 | 1.93 | 7.54 | 1.87 | 0.186 |
| Ferritin (ng/mL) | 156.11 | 117.52 | 273.31 | 236.69 | 314.82 | 147.12 | 0.093 |
| intact parathyroid hormone (pg/L) | 52.97 | 22.51 | 463.85 | 542.66 | 311.73 | 215.06 | 0.027 * |
| Transferrin binding capacity (%) | 28.71 | 11.00 | 26.13 | 7.35 | 27.41 | 7.24 | 0.825 |
| HbA1c (%) | 5.70 | 0.53 | 6.56 | 1.79 | 7.25 | 1.59 | 0.358 |
| Control Group | ESRD without RLS | ESRD with RLS | |||||
|---|---|---|---|---|---|---|---|
| Mean | SD | Mean | SD | Mean | SD | p Value | |
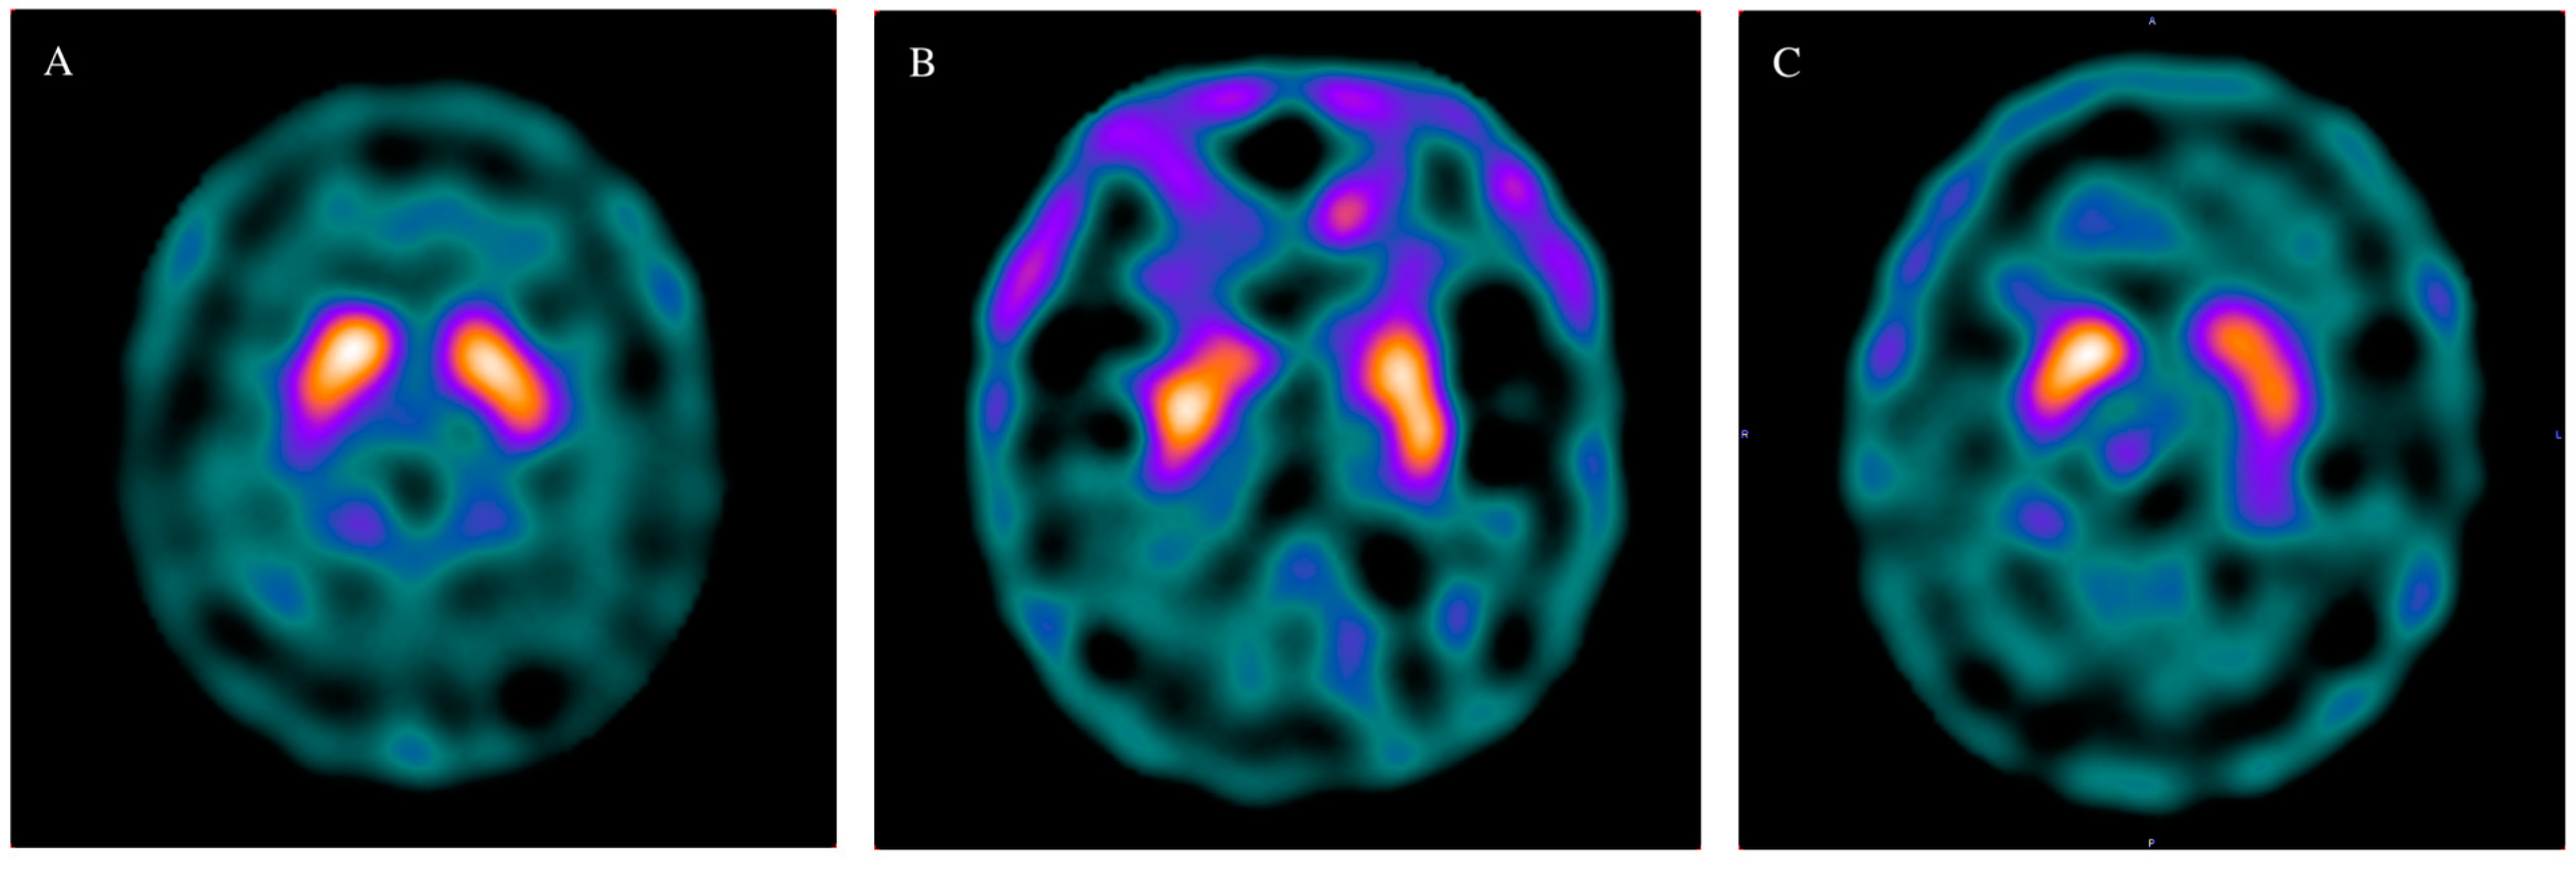
| Caudate, Right | 1.47 | 0.30 | 1.24 | 0.24 | 1.08 | 0.36 | 0.022 * |
| Caudate, Left | 1.46 | 0.30 | 1.32 | 0.22 | 1.11 | 0.43 | 0.078 |
| Putamen Right | 1.33 | 0.25 | 1.18 | 0.22 | 1.01 | 0.39 | 0.064 |
| Putamen Left | 1.35 | 0.31 | 1.20 | 0.18 | 1.01 | 0.41 | 0.071 |
| Basal ganglion, Right | 1.40 | 0.27 | 1.21 | 0.22 | 1.04 | 0.36 | 0.011 * |
| Basal ganglion, left | 1.41 | 0.30 | 1.26 | 0.20 | 1.06 | 0.41 | 0.065 |
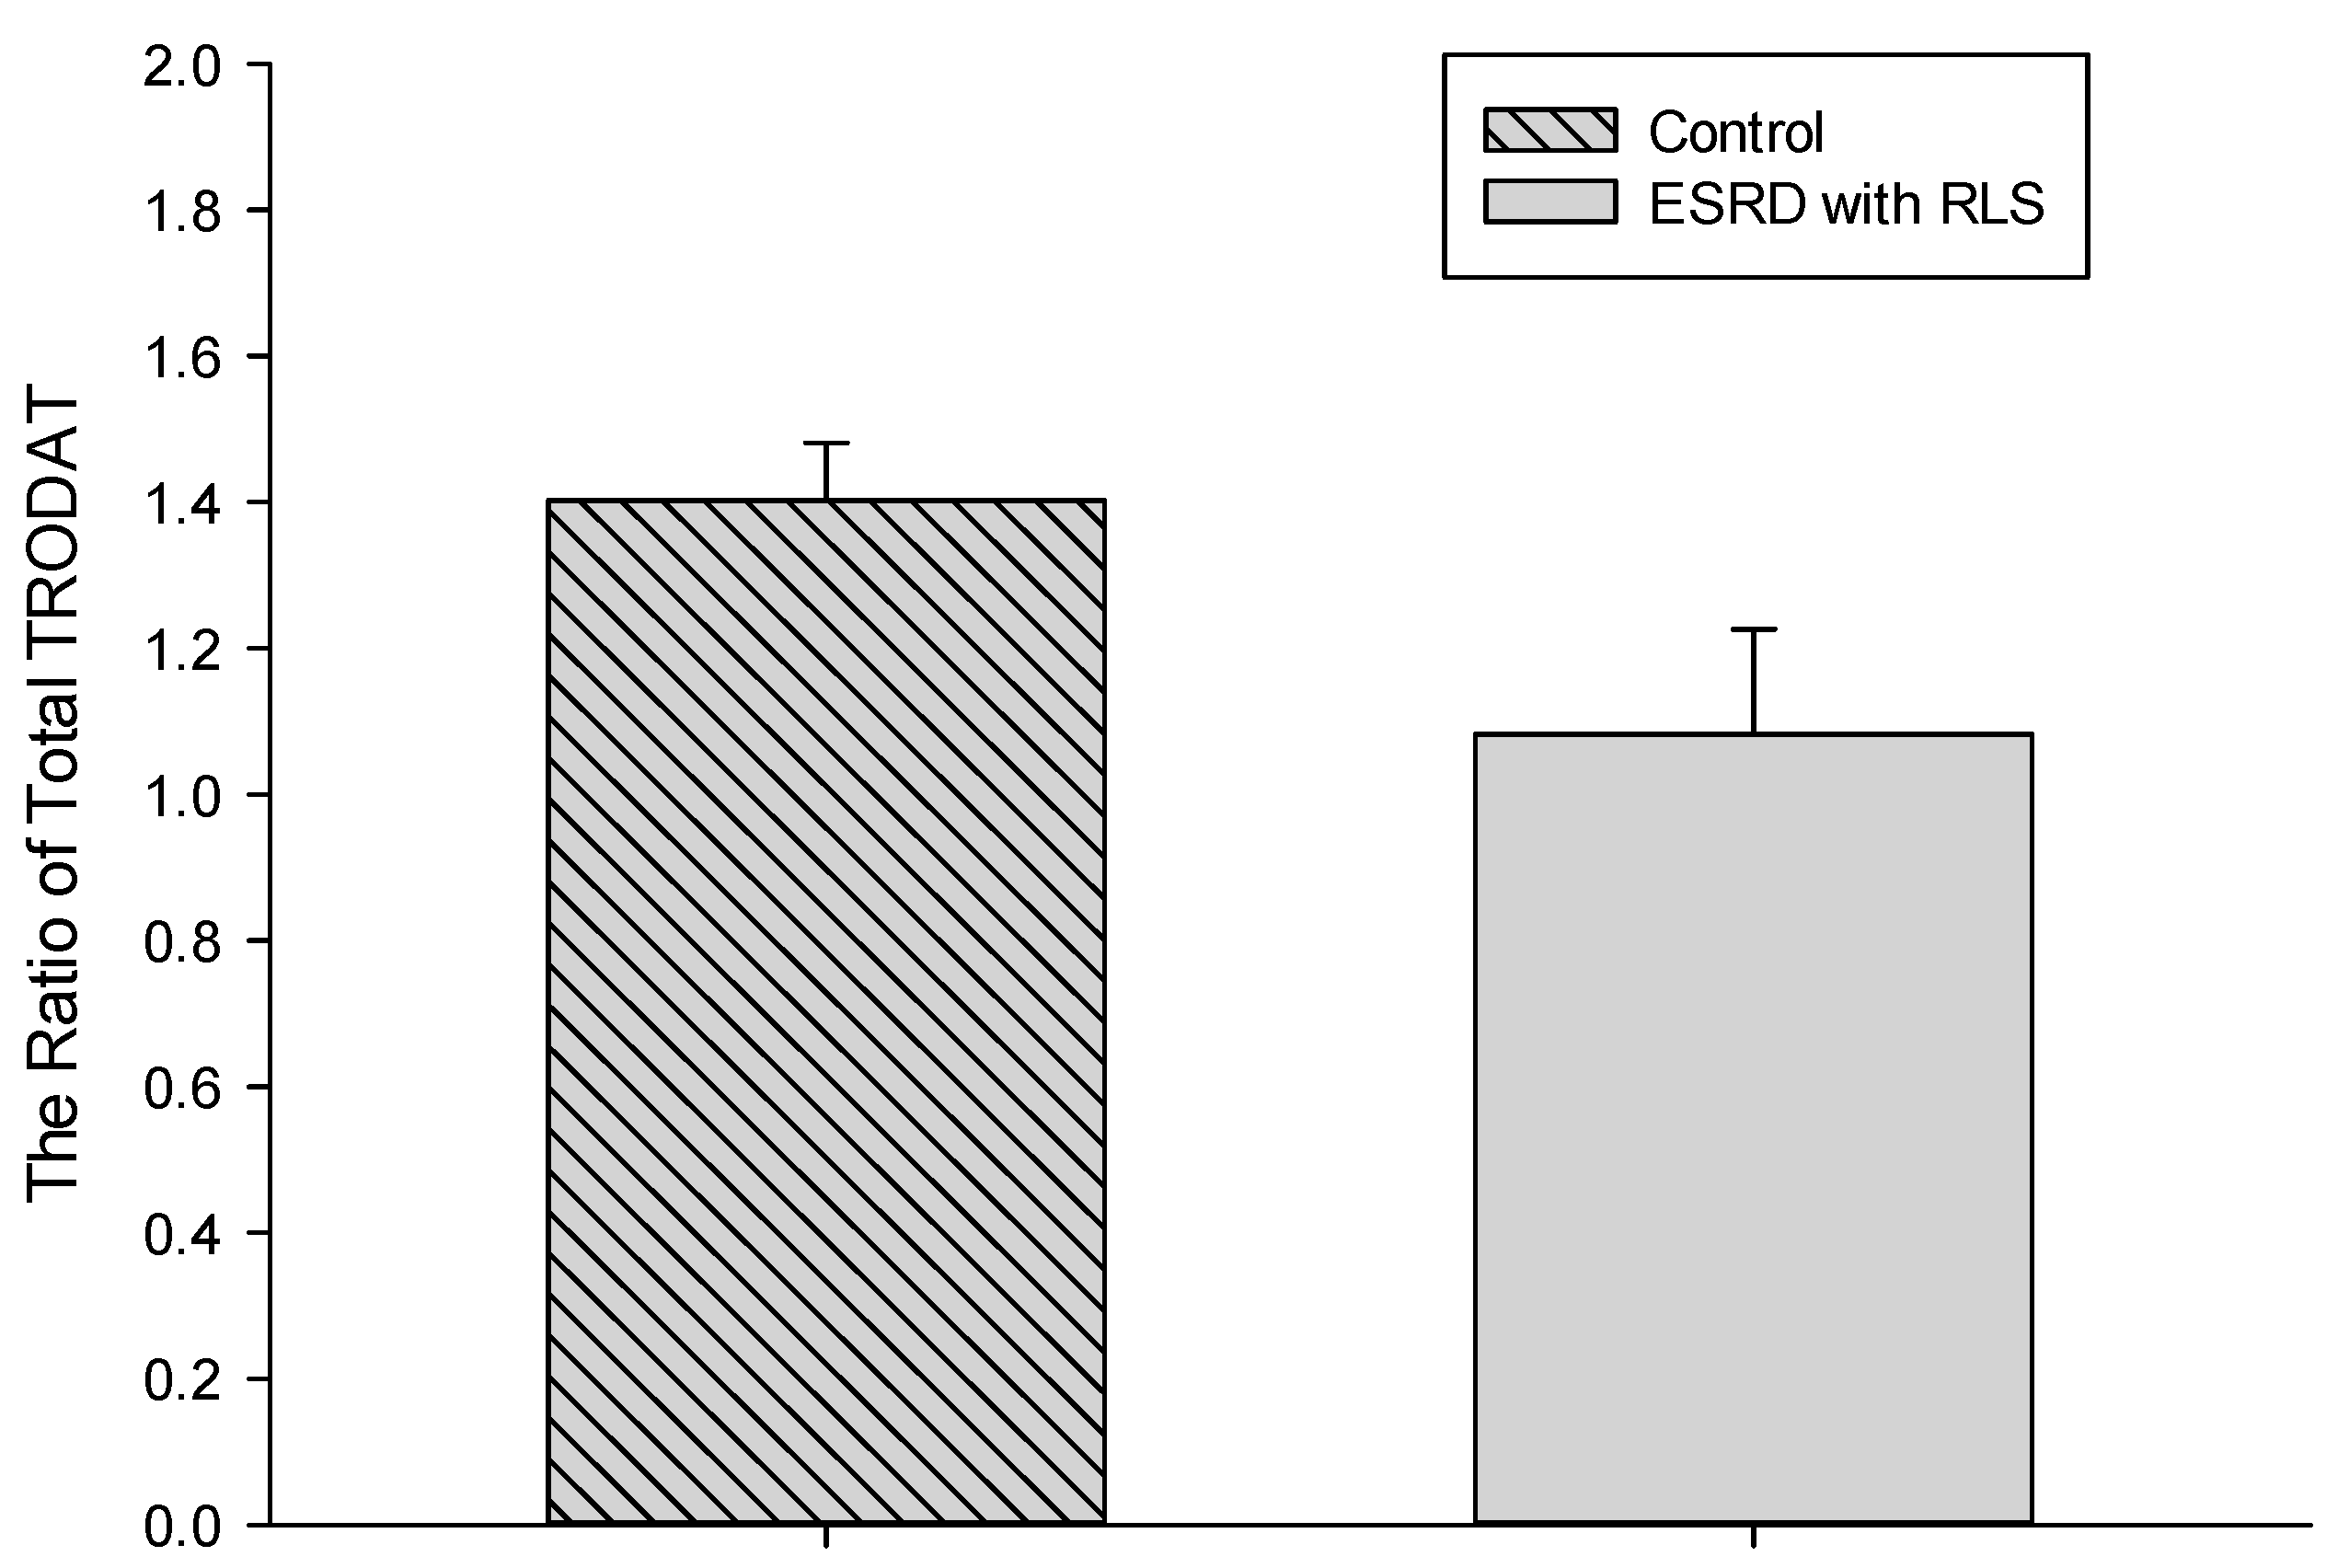
| Total ratio | 1.40 | 0.28 | 1.24 | 0.20 | 1.05 | 0.38 | 0.046 * |
| Control Group | ESRD with RLS | Normal Value | ||||
|---|---|---|---|---|---|---|
| Mean | SD | Mean | SD | p Value | ||
| Cu (μg/dL) | 1.67 | 1.02 | 4.41 | 1.92 | ≤8 | 0.001 * |
| Zn (μg/dL) | 45.53 | 29.92 | 16.45 | 21.92 | 15–120 | 0.033 * |
| Cu-to-Zn ratio | 0.04 | 0.21 | 0.60 | 0.57 | 0.004 * | |
| Mn (μg/L) | <1.00 | 0.00 | 0.93 | 0.24 | ≤7.9 | 0.448 |
| Ni (μg/L) | 2.65 | 1.71 | 3.21 | 1.97 | ≤5.2 | 0.51 |
| Pb (μg/L) | 0.88 | 0.47 | 0.60 | 0.04 | ≤23 | 0.086 |
| Cd (μg/L) | 0.74 | 0.52 | 0.33 | 0.05 | ≤2.6 | 0.11 |
| As (μg/g creatinine) | 31.63 | 18.43 | 46.23 | 49.52 | <100 | 0.061 |
| Hg (μg/L) | 0.40 | 0.20 | 0.97 | 1.84 | ≤10 | 0.775 |
| Coefficient of Correlation | p Value | |
|---|---|---|
| BUN | −0.488 | 0.021 * |
| Creatinine | −0.492 | 0.02 * |
| eGFR | 0.525 | 0.007 * |
| Hemoglobin | 0.531 | 0.011 * |
| Intact parathyroid hormone | −0.577 | 0.015 * |
| Ferritin | −0.464 | 0.039 * |
© 2020 by the authors. Licensee MDPI, Basel, Switzerland. This article is an open access article distributed under the terms and conditions of the Creative Commons Attribution (CC BY) license (http://creativecommons.org/licenses/by/4.0/).
Share and Cite
Hou, Y.-C.; Fan, Y.-M.; Huang, Y.-C.; Chen, R.-M.; Wang, C.-H.; Lin, Y.-T.; Yen, T.-H.; Lu, K.-C.; Lin, Y.-F. Tc-99m TRODAT-1 SPECT is a Potential Biomarker for Restless Leg Syndrome in Patients with End-Stage Renal Disease. J. Clin. Med. 2020, 9, 889. https://doi.org/10.3390/jcm9030889
Hou Y-C, Fan Y-M, Huang Y-C, Chen R-M, Wang C-H, Lin Y-T, Yen T-H, Lu K-C, Lin Y-F. Tc-99m TRODAT-1 SPECT is a Potential Biomarker for Restless Leg Syndrome in Patients with End-Stage Renal Disease. Journal of Clinical Medicine. 2020; 9(3):889. https://doi.org/10.3390/jcm9030889
Chicago/Turabian StyleHou, Yi-Chou, Yu-Ming Fan, Ya-Ching Huang, Ruei-Ming Chen, Cheng-Hsu Wang, Yi-Te Lin, Tzung-Hai Yen, Kuo-Cheng Lu, and Yuh-Feng Lin. 2020. "Tc-99m TRODAT-1 SPECT is a Potential Biomarker for Restless Leg Syndrome in Patients with End-Stage Renal Disease" Journal of Clinical Medicine 9, no. 3: 889. https://doi.org/10.3390/jcm9030889
APA StyleHou, Y.-C., Fan, Y.-M., Huang, Y.-C., Chen, R.-M., Wang, C.-H., Lin, Y.-T., Yen, T.-H., Lu, K.-C., & Lin, Y.-F. (2020). Tc-99m TRODAT-1 SPECT is a Potential Biomarker for Restless Leg Syndrome in Patients with End-Stage Renal Disease. Journal of Clinical Medicine, 9(3), 889. https://doi.org/10.3390/jcm9030889