Optimal Examination Sites for Periodontal Disease Evaluation: Applying the Item Response Theory Graded Response Model

 ,
,  ,
,  ,
,  ,
,  , , , and
Abstract
1. Introduction
2. Materials and Methods
2.1. Study Design
2.1.1. Setting
2.1.2. Diagnosis
2.1.3. Patients
2.2. Research Data
2.3. Statistical Analysis
2.3.1. IRT Modeling
2.3.2. Model Evaluation
2.4. Ethical Approval
3. Results
3.1. Descriptive Statistics of the Subjects Participated in this Study
3.2. Optimal Site Selection by IRT Modeling
3.3. Model Evaluation
3.3.1. Evaluation of Selected Sites
3.3.2. Model Evaluation
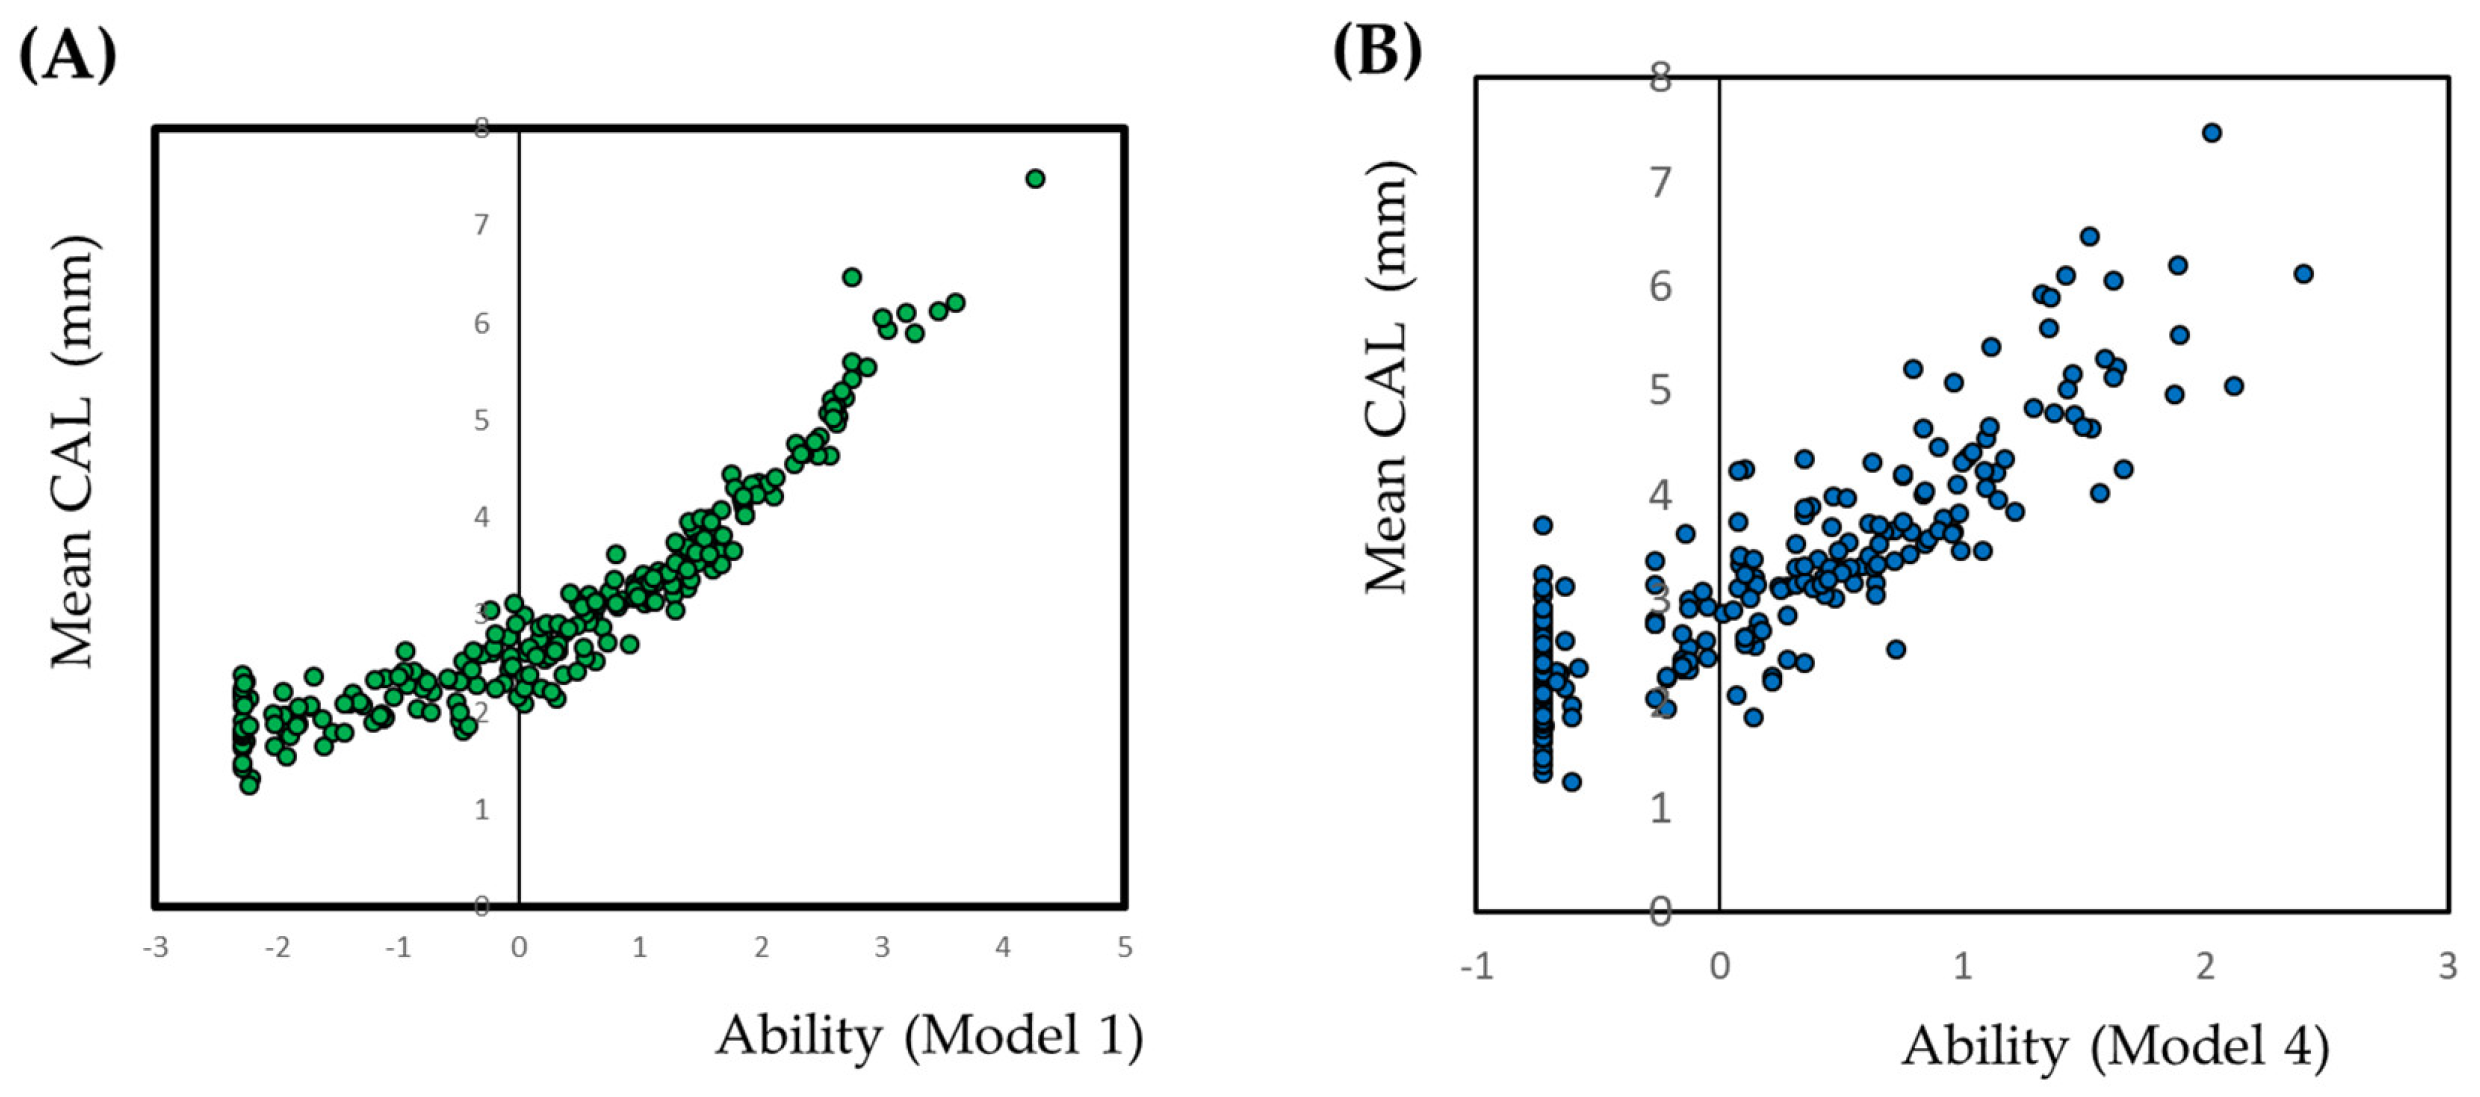
3.4. Application of the CAL Model for Diagnosis of Periodontal Disease
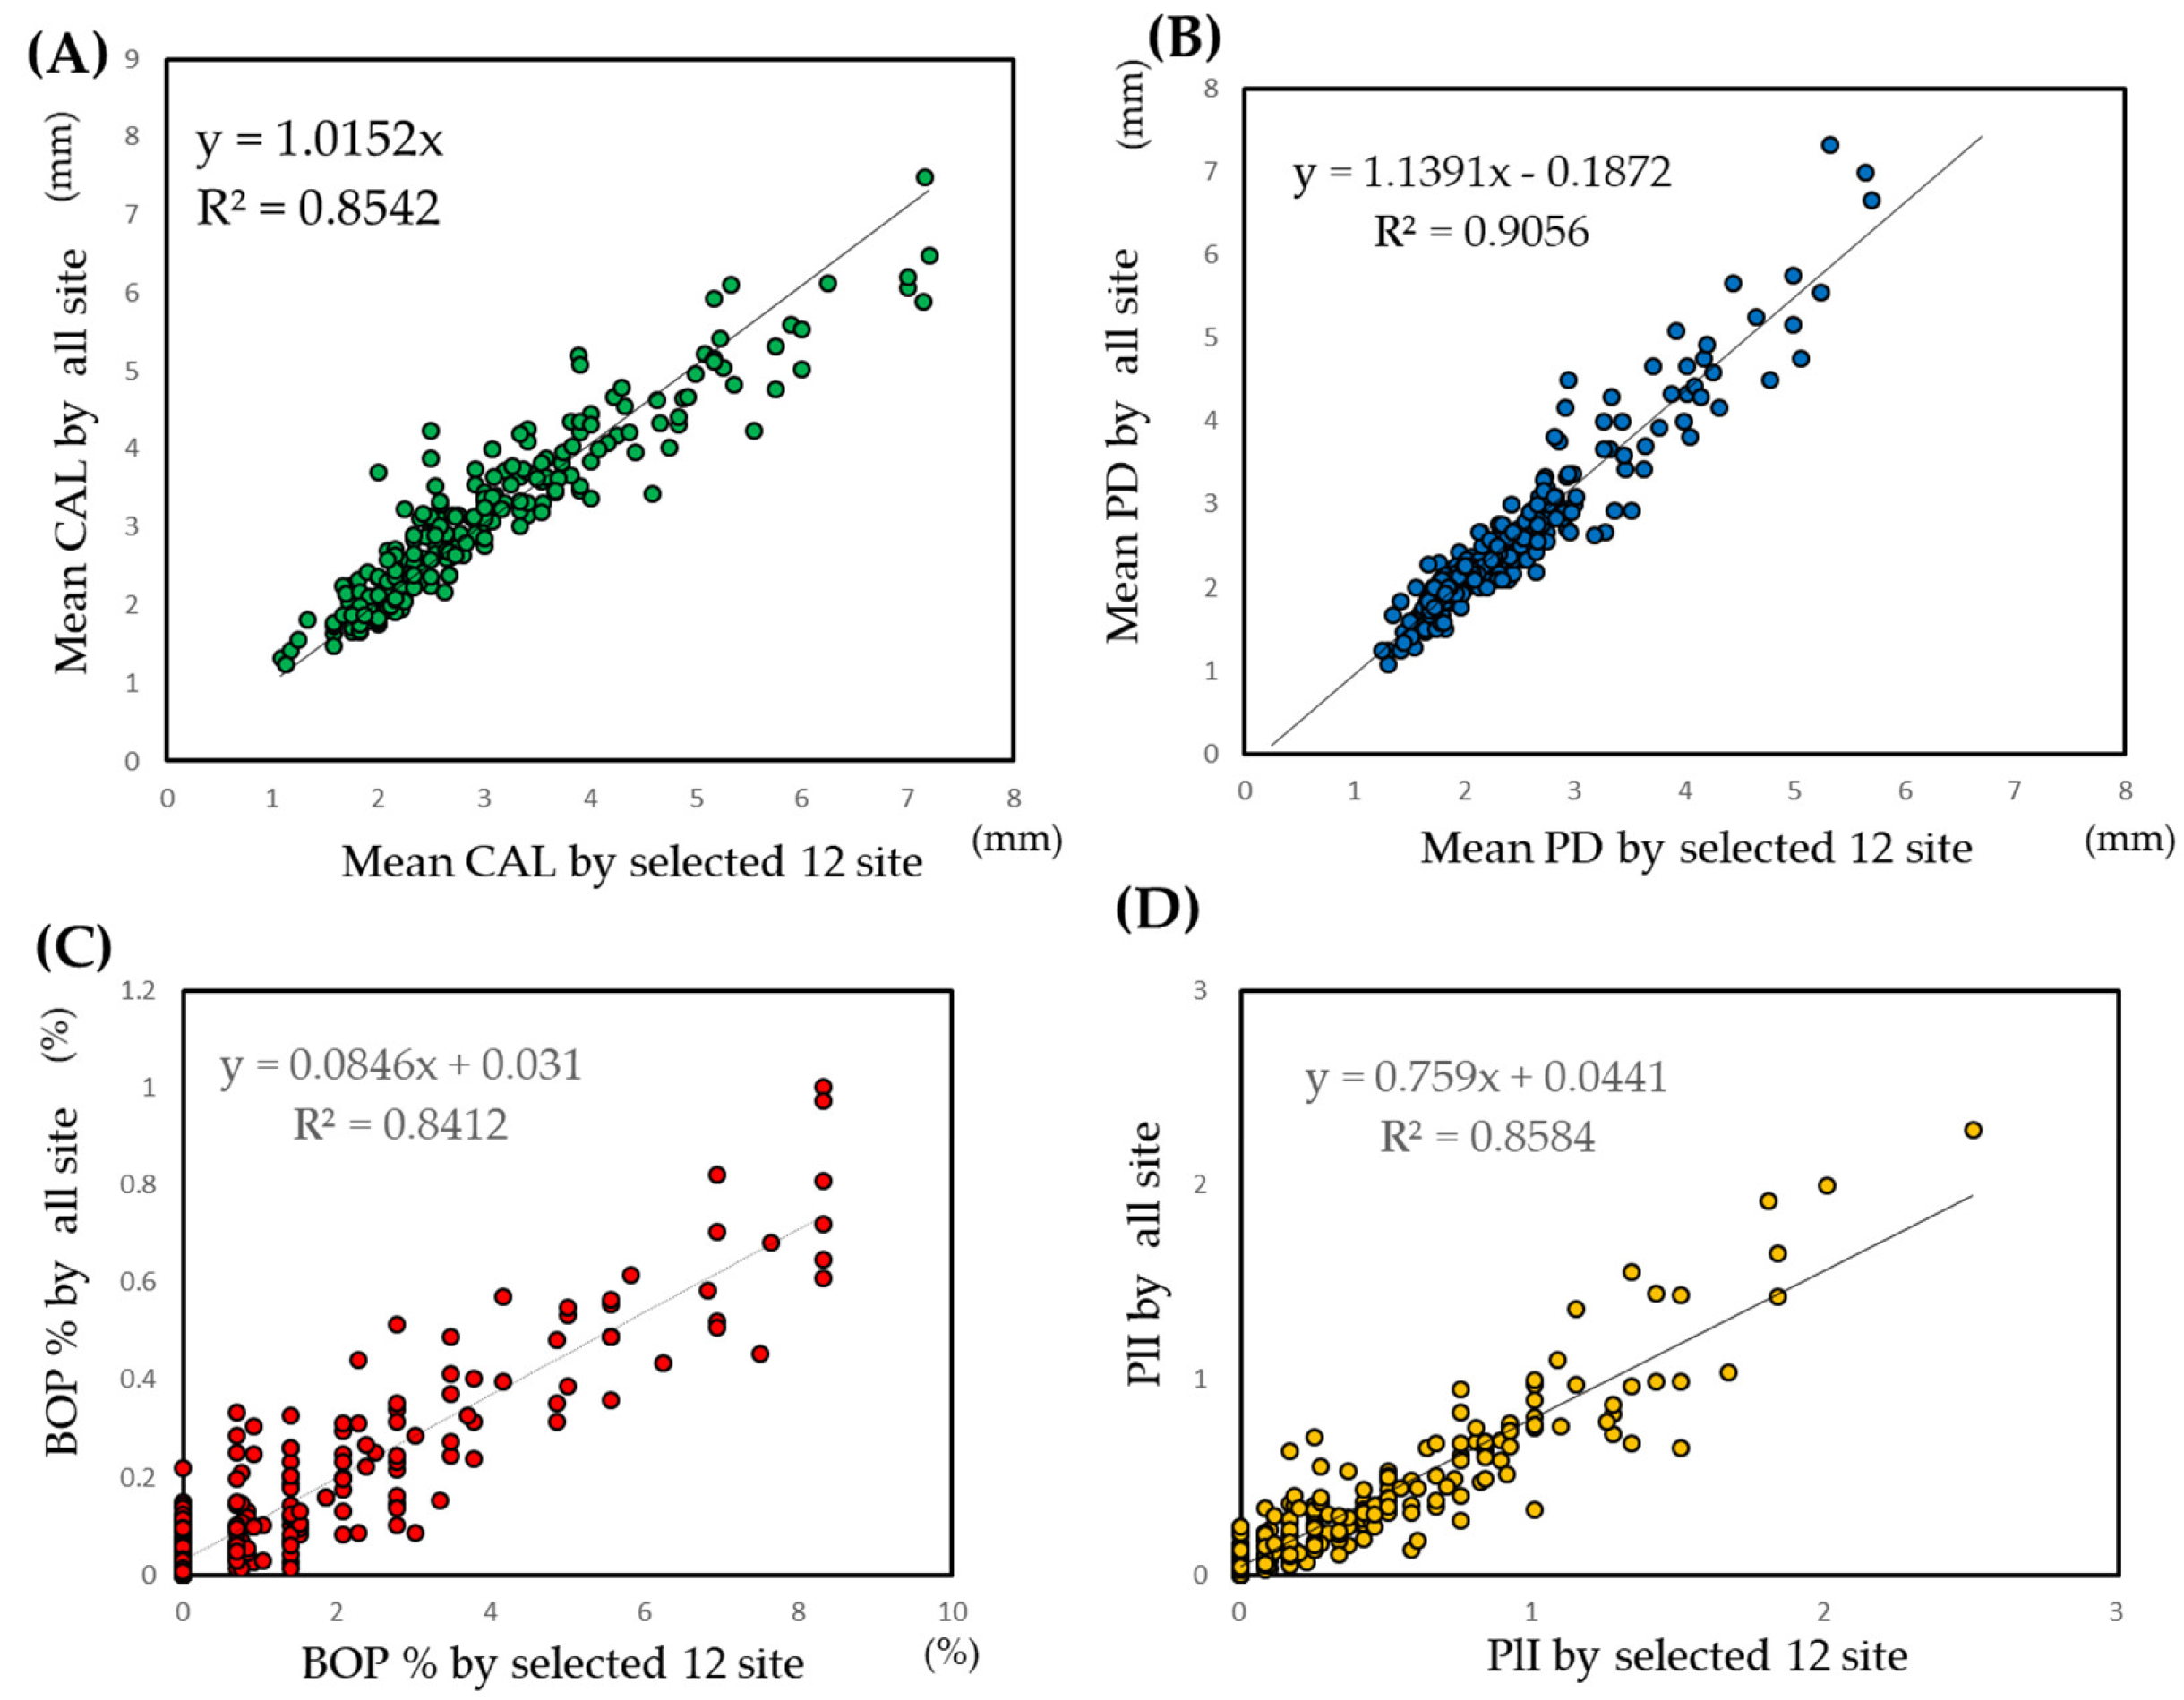
3.5. Prediction of Conventional Periodontal Indices by the CAL Model
3.6. Model Evaluation by Prevalence, Severity, and Extent
4. Discussion
5. Conclusions
Supplementary Materials
Author Contributions
Funding
Acknowledgments
Conflicts of Interest
Appendix A

| Institution | Name of the Ethics Committee | Reference Number |
|---|---|---|
| Niigata University | The regional ethical committee of the Faculty of Dentistry, Niigata University | 20-R17-08-06 |
| Keio University | Keio University School of Medicine, Ethics Committee | 20080096 |
| Hokkaido University | Institutional Review Board for Clinical Research of Hokkaido University Hospital | 008-0113 |
| Ohu University | Ohu University Research Ethics Committee | 52 |
| School of life Dentistry at Niigata, The Nippon Dental University | The Ethical Review Committee of The Nippon Dental University School of Life Dentistry at Niigata | 151 |
| Tokyo Dental College | Ethics Committee of Tokyo Dental College | 208 |
| Bunkyo-Dori Dental Clinic | The regional ethical committee of the Faculty of Dentistry, Niigata University | 20-R17-08-06 |
| Nihon University School of Dentistry at Matsudo | Ethics Committee in Nihon University School of Dentistry at Matsudo | EC 08-014 |
| Tokyo Medical and Dental University | Dental Research Ethics Committee of Tokyo Medical and Dental University | 660 |
| Nihon University School of Dentistry | Ethical Committee of Nihon University School of Dentistry | EP08D016 |
| School of Life Dentistry at Tokyo, The Nippon Dental University | The Institutional Review Board of Nippon Dental University. | 2-1-22 |
| Matsumoto Dental University | The Ethics Committee of Matsumoto Dental University | 0090 |
| Aichi Gakuin University | Ethics Committee: Aichi Gakuin University, School of Dentistry | 158 |
| Osaka Dental University | the Ethics Committee of Osaka Dental University | 80712 |
| Kyushu University | Ethical Committee of Kyushu University Faculty of Dental Science | 20-11 |
| Nagasaki University | The Ethics Committee, Nagasaki University Graduate School of Biomedical Sciences | 0846-2 |
| Kagoshima University | Ethical Committee of Kagoshima University Medical and Dental Hospital. | 20-58 |
Appendix B
| Maxilla | Mandibular | Ability | ||||
|---|---|---|---|---|---|---|
| 5 | 4 | 3 | 2 | 1 | 4 | |
| Palatal | Palatal | Palatal | Palatal | Palatal | Lingual | |
| Medial | Distal | Medial | Central | Distal | Medial | |
| 1 | 1 | 1 | 1 | 1 | 1 | −0.932 |
| 1 | 1 | 1 | 1 | 1 | 2 | −0.442 |
| 1 | 1 | 1 | 1 | 2 | 1 | −0.223 |
| 1 | 1 | 1 | 1 | 2 | 2 | 0.052 |
| 1 | 1 | 1 | 1 | 3 | 2 | 0.159 |
| 1 | 1 | 1 | 2 | 1 | 1 | 0.16 |
| 1 | 1 | 2 | 1 | 1 | 1 | −0.013 |
| 1 | 1 | 2 | 1 | 1 | 2 | 0.21 |
| 1 | 1 | 2 | 1 | 2 | 1 | 0.321 |
| 1 | 1 | 3 | 1 | 1 | 1 | 0.108 |
| 1 | 1 | 3 | 3 | 2 | 2 | 1.315 |
| 1 | 2 | 1 | 1 | 1 | 1 | −0.506 |
| 1 | 2 | 1 | 1 | 1 | 2 | −0.156 |
| 1 | 2 | 1 | 1 | 1 | 3 | −0.066 |
| 1 | 2 | 1 | 1 | 2 | 1 | 0.009 |
| 1 | 2 | 2 | 1 | 1 | 3 | 0.434 |
| 1 | 2 | 2 | 1 | 2 | 2 | 0.575 |
| 1 | 2 | 2 | 1 | 3 | 1 | 0.566 |
| 1 | 2 | 2 | 2 | 2 | 1 | 0.828 |
| 1 | 3 | 1 | 1 | 2 | 2 | 0.293 |
| 1 | 3 | 2 | 2 | 2 | 1 | 0.887 |
| 2 | 1 | 1 | 1 | 1 | 1 | −0.306 |
| 2 | 1 | 1 | 1 | 1 | 2 | −0.008 |
| 2 | 1 | 1 | 1 | 2 | 1 | 0.135 |
| 2 | 1 | 1 | 2 | 2 | 1 | 0.65 |
| 2 | 1 | 2 | 1 | 1 | 1 | 0.28 |
| 2 | 1 | 2 | 1 | 1 | 3 | 0.522 |
| 2 | 1 | 2 | 2 | 2 | 3 | 1.038 |
| 2 | 1 | 2 | 3 | 3 | 2 | 1.334 |
| 2 | 1 | 3 | 1 | 1 | 1 | 0.468 |
| 2 | 1 | 3 | 1 | 3 | 1 | 0.887 |
| 2 | 2 | 1 | 1 | 1 | 1 | −0.053 |
| 2 | 2 | 1 | 1 | 1 | 2 | 0.176 |
| 2 | 2 | 1 | 1 | 1 | 3 | 0.262 |
| 2 | 2 | 1 | 1 | 2 | 2 | 0.449 |
| 2 | 2 | 1 | 1 | 2 | 3 | 0.53 |
| 2 | 2 | 1 | 2 | 1 | 1 | 0.542 |
| 2 | 2 | 2 | 1 | 1 | 1 | 0.411 |
| 2 | 2 | 2 | 1 | 1 | 2 | 0.549 |
| 2 | 2 | 2 | 1 | 2 | 2 | 0.727 |
| 2 | 2 | 2 | 1 | 3 | 2 | 0.847 |
| 2 | 2 | 2 | 2 | 2 | 2 | 1.027 |
| 2 | 2 | 2 | 2 | 3 | 3 | 1.228 |
| 2 | 2 | 2 | 3 | 2 | 1 | 1.121 |
| 2 | 2 | 3 | 1 | 1 | 1 | 0.613 |
| 2 | 2 | 3 | 2 | 2 | 2 | 1.229 |
| 2 | 2 | 3 | 2 | 2 | 3 | 1.31 |
| 2 | 2 | 3 | 2 | 3 | 2 | 1.373 |
| 2 | 3 | 1 | 1 | 1 | 1 | 0.023 |
| 2 | 3 | 1 | 1 | 1 | 3 | 0.339 |
| 2 | 3 | 2 | 1 | 2 | 1 | 0.68 |
| 2 | 3 | 2 | 1 | 2 | 2 | 0.785 |
| 2 | 3 | 2 | 1 | 3 | 3 | 0.991 |
| 2 | 3 | 2 | 2 | 2 | 2 | 1.083 |
| 2 | 3 | 2 | 2 | 3 | 2 | 1.213 |
| 2 | 3 | 3 | 1 | 2 | 3 | 1.081 |
| 2 | 3 | 3 | 1 | 3 | 1 | 1.048 |
| 2 | 3 | 3 | 2 | 1 | 1 | 1.097 |
| 2 | 3 | 3 | 2 | 2 | 3 | 1.38 |
| 2 | 3 | 3 | 3 | 2 | 3 | 1.701 |
| 3 | 1 | 1 | 1 | 2 | 3 | 0.61 |
| 3 | 1 | 1 | 1 | 3 | 2 | 0.663 |
| 3 | 1 | 3 | 3 | 3 | 3 | 1.979 |
| 3 | 2 | 1 | 1 | 1 | 2 | 0.393 |
| 3 | 2 | 2 | 1 | 2 | 1 | 0.773 |
| 3 | 2 | 2 | 1 | 2 | 2 | 0.868 |
| 3 | 2 | 2 | 1 | 3 | 2 | 0.995 |
| 3 | 2 | 2 | 2 | 3 | 1 | 1.209 |
| 3 | 2 | 2 | 3 | 3 | 3 | 1.684 |
| 3 | 2 | 3 | 2 | 1 | 1 | 1.181 |
| 3 | 2 | 3 | 2 | 3 | 2 | 1.521 |
| 3 | 2 | 3 | 3 | 3 | 1 | 1.801 |
| 3 | 2 | 3 | 3 | 3 | 3 | 2.042 |
| 3 | 3 | 1 | 1 | 1 | 2 | 0.468 |
| 3 | 3 | 2 | 1 | 2 | 2 | 0.927 |
| 3 | 3 | 2 | 2 | 1 | 3 | 1.185 |
| 3 | 3 | 2 | 2 | 2 | 1 | 1.137 |
| 3 | 3 | 2 | 2 | 3 | 3 | 1.442 |
| 3 | 3 | 2 | 3 | 2 | 2 | 1.475 |
| 3 | 3 | 2 | 3 | 3 | 2 | 1.664 |
| 3 | 3 | 3 | 1 | 2 | 3 | 1.243 |
| 3 | 3 | 3 | 1 | 3 | 1 | 1.222 |
| 3 | 3 | 3 | 2 | 1 | 3 | 1.439 |
| 3 | 3 | 3 | 2 | 2 | 1 | 1.362 |
| 3 | 3 | 3 | 2 | 2 | 3 | 1.53 |
| 3 | 3 | 3 | 3 | 2 | 3 | 1.9 |
| 3 | 3 | 3 | 3 | 3 | 2 | 2.012 |
| 3 | 3 | 3 | 3 | 3 | 3 | 2.228 |
References
- Nomura, Y.; Morozumi, T.; Nakagawa, T.; Sugaya, T.; Kawanami, M.; Suzuki, F.; Takahashi, K.; Abe, Y.; Sato, S.; Makino-Oi, A.; et al. Site-level progression of periodontal disease during a follow-up period. PLoS ONE 2017, 12, e0188670. [Google Scholar] [CrossRef] [PubMed]
- Socransky, S.S.; Haffajee, A.D. The nature of periodontal diseases. Ann. Periodontol. 1997, 2, 3–10. [Google Scholar] [CrossRef] [PubMed]
- Sharma, P.; Cockwell, P.; Dietrich, T.; Ferro, C.; Ives, N.; Chapple, I.L.C. Influence of successful periodontal intervention in renal disease (INSPIRED): Study protocol for a randomized controlled pilot clinical trial. Trials 2017, 18, 535. [Google Scholar] [CrossRef] [PubMed]
- Cho, Y.; Kim, H.Y. Analysis of periodontal data using mixed effects models. J. Periodontal. Implant. Sci. 2015, 45, 2–7. [Google Scholar] [CrossRef] [PubMed]
- Botelho, J.; Machado, V.; Proença, L.; Mendes, J.J. The 2018 periodontitis case definition improves accuracy performance of full-mouth partial diagnostic protocols. Sci. Rep. 2020, 10, 7093. [Google Scholar] [CrossRef] [PubMed]
- Ramfjord, S.P. The Periodontal Disease Index (PDI). J. Periodontol. 1967, 38, S602–S610. [Google Scholar] [CrossRef]
- Wang, W.J.; Liu, C.Y.; Liu, D.Z.; Lee, C.J. Survey of periodontal disease among workers in Tianjin using Ramfjord’s Periodontal Disease Index (PDI). Community Dent. Oral Epidemiol. 1987, 15, 98–99. [Google Scholar] [CrossRef] [PubMed]
- Cutress, T.W.; Hunter, P.B.; Hoskins, D.I. Comparison of the Periodontal Index (PI) and Community Periodontal Index of Treatment Needs (CPITN). Community Dent. Oral Epidemiol. 1986, 14, 39–42. [Google Scholar] [CrossRef]
- Ainamo, J.; Barmes, D.; Beagrie, G.; Cutress, T.; Martin, J.; Infirri, S.J. Development of the World Health Organization (WHO) community periodontal index of treatment needs (CPITN). Int. Dent. J. 1982, 32, 281–291. [Google Scholar]
- Dunning, J.M.; Leach, L.B. Gingival-bone count: A method for epidemiological study of periodontal disease. J. Dent. Res. 1960, 39, 506–513. [Google Scholar] [CrossRef]
- Massler, M. The P-M-A index for the assessment of gingivitis. J. Periodontol. 1967, 38, S592–S601. [Google Scholar] [CrossRef] [PubMed]
- Löe, H. The Gingival Index, the Plaque Index and the Retention Index Systems. J. Periodontol. 1967, 38, S610–S616. [Google Scholar] [CrossRef]
- Edelen, M.O.; Reeve, B.B. Applying item response theory (IRT) modeling to questionnaire development; evaluation; and refinement. Qual. Life Res. 2007, 16, 5–18. [Google Scholar] [CrossRef] [PubMed]
- Thomas, M.L. Advances in applications of item response theory to clinical assessment. Psychol. Assess. 2019, 12, 1442–1455. [Google Scholar] [CrossRef]
- Reise, S.P.; Waller, N.G. Item response theory and clinical measurement. Annu. Rev. Clin. Psychol. 2009, 5, 27–48. [Google Scholar] [CrossRef]
- Nomura, Y.; Otsuka, R.; Wint, W.Y.; Okada, A.; Hasegawa, R.; Hanada, N. Tooth-Level Analysis of Dental Caries in Primary Dentition in Myanmar Children. Int. J. Environ. Res. Public Health 2020, 17, 7613. [Google Scholar] [CrossRef]
- Nomura, Y.; Maung, K.; Khine, E.M.K.; Sint, K.M.; Lin, M.P.; Myint, M.K.W.; Aung, T.; Sogabe, K.; Otsuka, R.; Okada, A.; et al. Prevalence of dental caries in 5- and 6-year-old Myanmar children. Int. J. Dent. 2019, 2019, 5948379. [Google Scholar] [CrossRef]
- Donovan, N.J.; Rosenbek, J.C.; Ketterson, T.U.; Velozo, C.A. Adding meaning to measurement: Initial rasch analysis of the ASHA FACS social communication subtest. Aphasiology 2006, 20, 362–373. [Google Scholar] [CrossRef]
- Cordier, R.; Joosten, A.; Clavé, P.; Schindler, A.; Bülow, M.; Demir, N.; Arslan, S.S.; Speyer, R. Evaluating the psychometric properties of the eating assessment tool (EAT-10) using rasch analysis. Dysphagia 2017, 32, 250–260. [Google Scholar] [CrossRef]
- Prenovost, K.M.; Fihn, S.D.; Maciejewski, M.L.; Nelson, K.; Vijan, S.; Rosland, A.M. Using item response theory with health system data to identify latent groups of patients with multiple health conditions. PLoS ONE 2018, 13, e0206915. [Google Scholar] [CrossRef]
- Morozumi, T.; Nakagawa, T.; Nomura, Y.; Sugaya, T.; Kawanami, M.; Suzuki, F.; Takahashi, K.; Abe, Y.; Sato, S.; Makino-Oi, A.; et al. Salivary pathogen and serum antibody to assess the progression of chronic periodontitis: A 24-mo prospective multicenter cohort study. J. Periodontal. Res. 2016, 51, 768–778. [Google Scholar] [CrossRef] [PubMed]
- Kakuta, E.; Nomura, Y.; Morozumi, T.; Nakagawa, T.; Nakamura, T.; Noguchi, K.; Yoshimura, A.; Hara, Y.; Fujise, O.; Nishimura, F.; et al. Assessing the progression of chronic periodontitis using subgingival pathogen levels: A 24-month prospective multicenter cohort study. BMC Oral Health 2017, 17, 46. [Google Scholar] [CrossRef] [PubMed][Green Version]
- Krebs, K.A.; Clem, D.S., 3rd. American Academy of Periodontology, Guidelines for the management of patients with periodontal diseases. J. Periodontol. 2006, 77, 1607–1611. [Google Scholar] [CrossRef] [PubMed]
- Eke, P.I.; Page, R.C.; Wei, L.; Evans, G.T.; Genco, R.J. Update of the case definitions for population-based surveillance of periodontitis. J. Periodontol. 2012, 83, 1449–1454. [Google Scholar] [CrossRef]
- Yang, R.; Donaldson, G.W.; Edelman, L.S.; Cloyes, K.G.; Sanders, N.A.; Pepper, G.A. Fear of older adult falling questionnaire for caregivers (FOAFQ-CG): Evidence from content validity and item-response theory graded-response modelling. J. Adv. Nurs. 2020, 76, 2768–2780. [Google Scholar] [CrossRef]
- Khazaal, Y.; Breivik, K.; Billieux, J.; Zullino, D.; Thorens, G.; Achab, S.; Gmel, G.; Chatton, A. Game addiction scale assessment through a nationally representative sample of young adult men: Item response heory graded-response modeling. J. Med. Internet Res. 2018, 20, e10058. [Google Scholar] [CrossRef]
- Rizopoulos, D. An R package for latent variable modelling and item response theory analyses. J. Stat. Softw. 2006, 17, 1–25. [Google Scholar] [CrossRef]
- Molenaar, D.; Dolan, C.V.; Boeck, P.D. The Heteroscedastic graded response model with a skewed latent trait: Testing statistical and substantive hypotheses related to skewed item category functions. Psychometrika 2012, 77, 455–478. [Google Scholar] [CrossRef]
- Kang, H.A.; Su, Y.H.; Chang, H.H. A note on monotonicity of item response functions for ordered polytomous item response theory models. Br. J. Math. Stat. Psychol. 2018, 71, 523–535. [Google Scholar] [CrossRef]
- Nomura, Y.; Okada, A.; Kakuta, E.; Otsuka, R.; Saito, H.; Maekawa, H.; Daikoku, H.; Hanada, N.; Sato, T. Workforce and Contents of Home Dental Care in Japanese Insurance System. Int. J. Dent. 2020, 2020, 7316796. [Google Scholar] [CrossRef]
- Nomura, Y.; Kakuta, E.; Okada, A.; Yamamoto, Y.; Tomonari, H.; Hosoya, N.; Hanada, N.; Yoshida, N.; Takei, N. Prioritization of the Skills to Be Mastered for the Daily Jobs of Japanese Dental Hygienists. Int. J. Dent. 2020, 2020, 4297646. [Google Scholar] [CrossRef] [PubMed]
- Nomura, Y.; Kakuta, E.; Okada, A.; Otsuka, R.; Shimada, M.; Tomizawa, Y.; Taguchi, C.; Arikawa, K.; Daikoku, H.; Sato, T.; et al. Effects of self-assessed chewing ability, tooth loss and serum albumin on mortality in 80-year-old individuals: A 20-year follow-up study. BMC Oral Health. 2020, 20, 122. [Google Scholar] [CrossRef] [PubMed]
- Nomura, Y.; Tsutsumi, I.; Nagasaki, M.; Tsuda, H.; Koga, F.; Kashima, N.; Uraguchi, M.; Okada, A.; Kakuta, E.; Hanada, N. Supplied Food Consistency and Oral Functions of Institutionalized Elderly. Int. J. Dent. 2020, 2020, 3463056. [Google Scholar] [CrossRef] [PubMed]
- Nomura, Y.; Matsuyama, T.; Fukai, K.; Okada, A.; Ida, M.; Yamauchi, N.; Hanamura, H.; Yabuki, Y.; Watanabe, K.; Sugawara, M.; et al. PRECEDE-PROCEED model based questionnaire and saliva tests for oral health checkup in adult. J. Oral Sci. 2019, 61, 544–548. [Google Scholar] [CrossRef] [PubMed]
- Zheng, B.; Agresti, A. Summarizing the predictive power of a generalized linear model. Stat. Med. 2000, 19, 1771–1781. [Google Scholar] [CrossRef]
- Nomura, Y.; Okada, A.; Kakuta, E.; Gunji, T.; Kajiura, S.; Hanada, N. A new screening method for periodontitis: An alternative to the community periodontal index. BMC Oral Health 2016, 16, 64. [Google Scholar] [CrossRef]
- Kudo, C.; Naruishi, K.; Maeda, H.; Abiko, Y.; Hino, T.; Iwata, M.; Mitsuhashi, C.; Murakami, S.; Nagasawa, T.; Nagata, T.; et al. Assessment of use of plasma/serum IgG test to screen for periodontitis. J. Dent. Res. 2012, 91, 1190–1195. [Google Scholar] [CrossRef]
- Kingman, A.; Susin, C.; Albandar, J.M. Effect of partial recording protocols on severity estimates of periodontal disease. J. Clin. Periodontol. 2008, 35, 659–667. [Google Scholar] [CrossRef]
- Susin, C.; Kingman, A.; Albandar, J.M. Effect of partial recording protocols on estimates of prevalence of periodontal disease. J. Periodontol. 2005, 76, 262–267. [Google Scholar] [CrossRef]
- Tran, D.T.; Gay, I.; Du, X.L.; Fu, Y.; Bebermeyer, R.D.; Neumann, A.S.; Streckfus, C.; Chan, W.; Walji, M.F. Assessing periodontitis in populations: A systematic review of the validity of partial-mouth examination protocols. J. Clin. Periodontol. 2013, 40, 1064–1071. [Google Scholar] [CrossRef]
- World Health Organization. Oral Health Surveys Basic Methods, 4th ed.; World Health Organization: Geneva, Switzerland, 1997; p. 39. [Google Scholar]
- World Health Organization. Oral Health Surveys Basic Methods, 5th ed.; World Health Organization: Geneva, Switzerland, 2013; pp. 47–49. [Google Scholar]
- Ministry of Health, Labour and Welfare Japan. Survey of Dental Diseases. Available online: https://www.mhlw.go.jp/toukei/list/62-28.html (accessed on 1 September 2020).
- Okada, A.; Nomura, Y.; Sogabe, K.; Oku, H.; Gillbreath, S.A.; Hino, F.; Hayashi, H.; Yoshino, H.; Utsunomiya, H.; Suzuki, K.; et al. Comparison of salivary hemoglobin measurements for periodontitis screening. J. Oral Sci. 2017, 59, 63–69. [Google Scholar] [CrossRef] [PubMed]
- Kakuta, E.; Nomura, Y.; Naono, Y.; Koresawa, K.; Shimizu, K.; Hanada, N. Correlation between health-care costs and salivary tests. Int. Dent. J. 2013, 63, 249–253. [Google Scholar] [CrossRef] [PubMed]
- Nomura, Y.; Shimada, Y.; Hanada, N.; Numabe, Y.; Kamoi, K.; Sato, T.; Gomi, K.; Arai, T.; Inagaki, K.; Fukuda, M.; et al. Salivary biomarkers for predicting the progression of chronic periodontitis. Arch. Oral Biol. 2012, 57, 413–420. [Google Scholar] [CrossRef] [PubMed]
- Nomura, Y.; Okada, A.; Tamaki, Y.; Miura, H. Salivary Levels of Hemoglobin for Screening Periodontal Disease: A Systematic Review. Int. J. Dent. 2018, 2018, 2541204. [Google Scholar] [CrossRef]
- Nomura, Y.; Tamaki, Y.; Tanaka, T.; Arakawa, H.; Tsurumoto, A.; Kirimura, K.; Sato, T.; Hanada, N.; Kamoi, K. Screening of periodontitis with salivary enzyme tests. J. Oral Sci. 2006, 48, 177–183. [Google Scholar] [CrossRef]
- Chatzopoulos, G.S.; Tsalikis, L.; Konstantinidis, A.; Kotsakis, G.A. A two-domain self-report measure of periodontal disease has good accuracy for periodontitis screening in dental school outpatients. J. Periodontol. 2016, 87, 1165–1173. [Google Scholar] [CrossRef]
- Wright, N.M.; Cheng, B.; Tafreshi, S.N.; Lamster, I.B. A simple self-report health assessment questionnaire to identify oral diseases. Int. Dent. J. 2018, 68, 428–432. [Google Scholar] [CrossRef]
- Preianò, M.; Savino, R.; Villella, C.; Pelaia, C.; Terracciano, R. Gingival crevicular fluid peptidome profiling in healthy and in periodontal diseases. Int. J. Mol. Sci. 2020, 21, 5270. [Google Scholar] [CrossRef]
- Kingman, A.; Albandar, J.M. Methodological aspects of epidemiological studies of periodontal diseases. Periodontology 2002, 29, 11–30. [Google Scholar] [CrossRef]
- Vettore, M.V.; de Lamarca, G.A.; Leao, A.T.; Sheiham, A.; do Leal, M.C. Partial recording protocols for periodontal disease assessment in epidemiological surveys. Cademos Saude Publica 2007, 23, 33–42. [Google Scholar] [CrossRef]
- Benigeri, M.; Brodeur, J.M.; Payette, M.; Charbonneau, A.; Ismail, A.I. Community periodontal index of treatment needs and prevalence of periodontal conditions. J. Clin. Periodontol. 2000, 27, 308–312. [Google Scholar] [CrossRef] [PubMed]
- Newman, M.G.; Takei, H.H.; Klokkevod, P.R.; Carranza, F.A. Clinical risk assessment. In Carranza’s Clinical Periodontology; Elsevier Saunders: Philadelphia, PA, USA, 2012; pp. 370–372. [Google Scholar]


| Maxilla | Mandibular | AIC | BIC | ||||||
|---|---|---|---|---|---|---|---|---|---|
| 2nd Premolar | 1st Premolar | Canine | Lateral Incisor | Central Incisor | 1st Premolar | ||||
| Palatal | Palatal | Palatal | Palatal | Palatal | Lingual | ||||
| Medial | Distal | Medial | Central | Distal | Medial | ||||
| CAL | Extrmt1 | 0.28 | 0.45 | 0.65 | 1.13 | 0.75 | 0.53 | 1796.06 | 1859.73 |
| Extrmt2 | 1.28 | 1.24 | 1.31 | 1.59 | 1.38 | 1.57 | |||
| Discrimination | 3.07 | 3.42 | 4.51 | 4.83 | 3.16 | 2.03 | |||
| Item information | 5.47 | 5.92 | 7.97 | 7.93 | 5.02 | 3.27 | |||
| PD | Extrmt1 | 0.72 | 0.88 | 0.96 | 1.35 | 1.01 | 1.03 | 1198.73 | 1262.41 |
| Extrmt2 | 1.46 | 1.48 | 1.39 | 1.79 | 1.45 | 1.63 | |||
| Discrimination | 3.89 | 3.38 | 4.89 | 4.63 | 3.90 | 3.39 | |||
| Item information | 6.82 | 5.37 | 7.87 | 7.41 | 5.94 | 5.40 | |||
| BOP | Extrmt1 | 1.30 | 1.22 | 1.56 | 1.45 | 1.63 | 1.95 | 686.60 | 729.04 |
| Discrimination | 3.70 | 7.71 | 2.93 | 16.96 | 2.48 | 2.09 | |||
| Item information | 3.70 | 7.62 | 2.93 | 16.65 | 2.48 | 2.09 | |||
| PlI | Extrmt1 | 0.38 | 0.47 | 0.35 | 0.27 | 0.47 | 0.82 | 1965.74 | 2029.41 |
| Extrmt2 | 1.85 | 1.70 | 1.65 | 1.81 | 1.96 | 2.03 | |||
| Discrimination | 2.78 | 3.85 | 3.86 | 2.66 | 2.14 | 2.19 | |||
| Item information | 5.25 | 7.44 | 7.50 | 5.03 | 3.85 | 3.76 | |||
| Tooth Mobility | Extrmt1 | 0.87 | 0.77 | 1.22 | 0.69 | 0.72 | 1.19 | 1445.90 | 1509.57 |
| Extrmt2 | 1.90 | 1.85 | 2.21 | 1.79 | 1.99 | 2.56 | |||
| Discrimination | 2.41 | 2.53 | 2.98 | 3.81 | 3.23 | 2.07 | |||
| Item information | 4.06 | 4.39 | 5.28 | 7.24 | 6.11 | 3.62 | |||
| Cutoff Point | Sensitivity | Specificity | AUR | ||
|---|---|---|---|---|---|
| Mean CAL | >3 mm | −0.190 | 0.832 | 0.852 | 0.922 |
| >3.5 mm | 0.193 | 0.865 | 0.878 | 0.939 | |
| >4 mm | 0.546 | 0.891 | 0.885 | 0.960 | |
| >4.5 mm | 1.033 | 0.929 | 0.929 | 0.978 | |
| >5 mm | 1.082 | 0.895 | 0.911 | 0.977 | |
| Mean PD | >3 mm | 0.703 | 0.897 | 0.912 | 0.974 |
| >3.5 mm | 0.891 | 0.926 | 0.930 | 0.983 | |
| >4 mm | 1.202 | 0.947 | 0.949 | 0.985 | |
| >4.5 mm | 1.391 | 1.000 | 0.971 | 0.989 | |
| >5 mm | 1.548 | 1.000 | 0.984 | 0.992 | |
| BOP | >2.5% | −0.097 | 0.453 | 0.913 | 0.671 |
| >5% | −0.097 | 0.388 | 0.939 | 0.698 | |
| >10% | −0.097 | 0.571 | 0.886 | 0.755 | |
| >20% | −0.097 | 0.687 | 0.834 | 0.804 | |
| >25% | −0.097 | 0.765 | 0.813 | 0.847 | |
| PlI | >10 | −0.141 | 0.849 | 0.829 | 0.890 |
| >20 | 0.313 | 0.838 | 0.839 | 0.915 | |
| >30 | 0.540 | 0.824 | 0.822 | 0.915 | |
| >40 | 0.695 | 0.831 | 0.776 | 0.924 | |
| >50 | 0.710 | 0.825 | 0.838 | 0.912 | |
| Diagnosis | Moderate Periodontitis | Severe Periodontitis | ||||||
|---|---|---|---|---|---|---|---|---|
| Cutoff | Sensitivity | Specificity | AUR | Cutoff | Sensitivity | Specificity | AUR | |
| CAL mean (12 sites) | 2.20 | 0.82 | 0.88 | 0.91 | 2.65 | 0.75 | 0.72 | 0.85 |
| CAL mean (All sites) | 2.21 | 0.91 | 0.92 | 0.96 | 3.04 | 0.78 | 0.78 | 0.88 |
| CAL ability (6 value) | −0.72 | 0.71 | 0.88 | 0.82 | −0.47 | 0.86 | 0.62 | 0.83 |
| CAL ability (12 sites) | −0.79 | 0.79 | 0.79 | 0.87 | 0.05 | 0.81 | 0.81 | 0.87 |
| CPI | 2 | 0.84 | 0.92 | 0.88 | 4 | 0.81 | 0.94 | 0.91 |
| Cutoff | Sensitivity | Specificity | AUR | Cutoff | Sensitivity | Specificity | AUR | Cutoff | Sensitivity | Specificity | AUR | |
|---|---|---|---|---|---|---|---|---|---|---|---|---|
| Mean CAL | Mean CAL > 3.5 mm | Mean CAL > 4 mm | Mean CAL > 4.5 mm | |||||||||
| CAL mean (12 sites) | 3.04 | 0.92 | 0.90 | 0.96 | 3.52 | 0.91 | 0.91 | 0.98 | 3.95 | 0.93 | 0.94 | 0.99 |
| CAL ability (6 values) | 0.16 | 0.89 | 0.88 | 0.95 | 0.55 | 0.89 | 0.88 | 0.96 | 1.03 | 0.93 | 0.93 | 0.98 |
| CAL ability (12 site) | 0.35 | 0.89 | 0.90 | 0.96 | 0.69 | 0.93 | 0.93 | 0.97 | 0.90 | 0.93 | 0.93 | 0.99 |
| CPI | 4 | 0.72 | 0.77 | 0.77 | 2 | 0.96 | 0.36 | 0.81 | 4 | 0.86 | 0.69 | 0.78 |
| Mean PD | Mean PD > 3.5 mm | Mean PD > 4 mm | Mean PD > 5 mm | |||||||||
| CAL mean (12 sites) | 3.90 | 0.08 | 0.11 | 0.96 | 4.13 | 0.95 | 0.92 | 0.97 | 5.04 | 1.00 | 0.96 | 0.99 |
| CAL ability (6 values) | 4.03 | 0.89 | 0.91 | 0.97 | 0.99 | 0.89 | 0.89 | 0.96 | 1.44 | 1.00 | 0.96 | 0.99 |
| CAL ability (12 sites) | 0.70 | 0.85 | 0.87 | 0.95 | 0.89 | 0.89 | 0.89 | 0.96 | 1.20 | 1.00 | 0.93 | 0.98 |
| CPI | 4 | 1.00 | 0.71 | 0.85 | 4 | 1.00 | 0.68 | 0.84 | 4 | 1.00 | 0.65 | 0.82 |
| PD mean (12 sites) | 0.68 | 0.89 | 0.86 | 0.95 | 3.78 | 1.00 | 0.95 | 0.99 | 4.46 | 1.00 | 0.97 | 0.99 |
| BOP | BOP > 10% | BOP > 20% | BOP > 30% | |||||||||
| CAL mean (12 sites) | 2.65 | 0.64 | 0.65 | 0.71 | 2.96 | 0.76 | 0.75 | 0.83 | 3.26 | 0.82 | 0.80 | 0.89 |
| CAL ability (6 values) | −0.26 | 0.65 | 0.62 | 0.69 | 0.12 | 0.74 | 0.77 | 0.80 | 0.46 | 0.77 | 0.82 | 0.86 |
| CAL ability (12 sites) | 0.03 | 0.63 | 0.66 | 0.67 | 0.31 | 0.74 | 0.75 | 0.80 | 0.60 | 0.75 | 0.85 | 0.85 |
| CPI | 4 | 0.59 | 0.79 | 0.72 | 4 | 0.75 | 0.76 | 0.80 | 4 | 0.84 | 0.72 | 0.81 |
| BOP% mean (12 sites) | 0.73 | 0.84 | 0.87 | 0.91 | 1.97 | 0.81 | 0.94 | 0.95 | 2.18 | 0.91 | 0.92 | 0.97 |
Publisher’s Note: MDPI stays neutral with regard to jurisdictional claims in published maps and institutional affiliations. |
© 2020 by the authors. Licensee MDPI, Basel, Switzerland. This article is an open access article distributed under the terms and conditions of the Creative Commons Attribution (CC BY) license (http://creativecommons.org/licenses/by/4.0/).
Share and Cite
Nomura, Y.; Morozumi, T.; Fukuda, M.; Hanada, N.; Kakuta, E.; Kobayashi, H.; Minabe, M.; Nakamura, T.; Nakayama, Y.; Nishimura, F.; et al. Optimal Examination Sites for Periodontal Disease Evaluation: Applying the Item Response Theory Graded Response Model. J. Clin. Med. 2020, 9, 3754. https://doi.org/10.3390/jcm9113754
Nomura Y, Morozumi T, Fukuda M, Hanada N, Kakuta E, Kobayashi H, Minabe M, Nakamura T, Nakayama Y, Nishimura F, et al. Optimal Examination Sites for Periodontal Disease Evaluation: Applying the Item Response Theory Graded Response Model. Journal of Clinical Medicine. 2020; 9(11):3754. https://doi.org/10.3390/jcm9113754
Chicago/Turabian StyleNomura, Yoshiaki, Toshiya Morozumi, Mitsuo Fukuda, Nobuhiro Hanada, Erika Kakuta, Hiroaki Kobayashi, Masato Minabe, Toshiaki Nakamura, Yohei Nakayama, Fusanori Nishimura, and et al. 2020. "Optimal Examination Sites for Periodontal Disease Evaluation: Applying the Item Response Theory Graded Response Model" Journal of Clinical Medicine 9, no. 11: 3754. https://doi.org/10.3390/jcm9113754
APA StyleNomura, Y., Morozumi, T., Fukuda, M., Hanada, N., Kakuta, E., Kobayashi, H., Minabe, M., Nakamura, T., Nakayama, Y., Nishimura, F., Noguchi, K., Numabe, Y., Ogata, Y., Saito, A., Sato, S., Sekino, S., Sugano, N., Sugaya, T., Suzuki, F., ... Nakagawa, T. (2020). Optimal Examination Sites for Periodontal Disease Evaluation: Applying the Item Response Theory Graded Response Model. Journal of Clinical Medicine, 9(11), 3754. https://doi.org/10.3390/jcm9113754