Diagnostic Utility of Selected Serum Dementia Biomarkers: Amyloid β-40, Amyloid β-42, Tau Protein, and YKL-40: A Review


Abstract
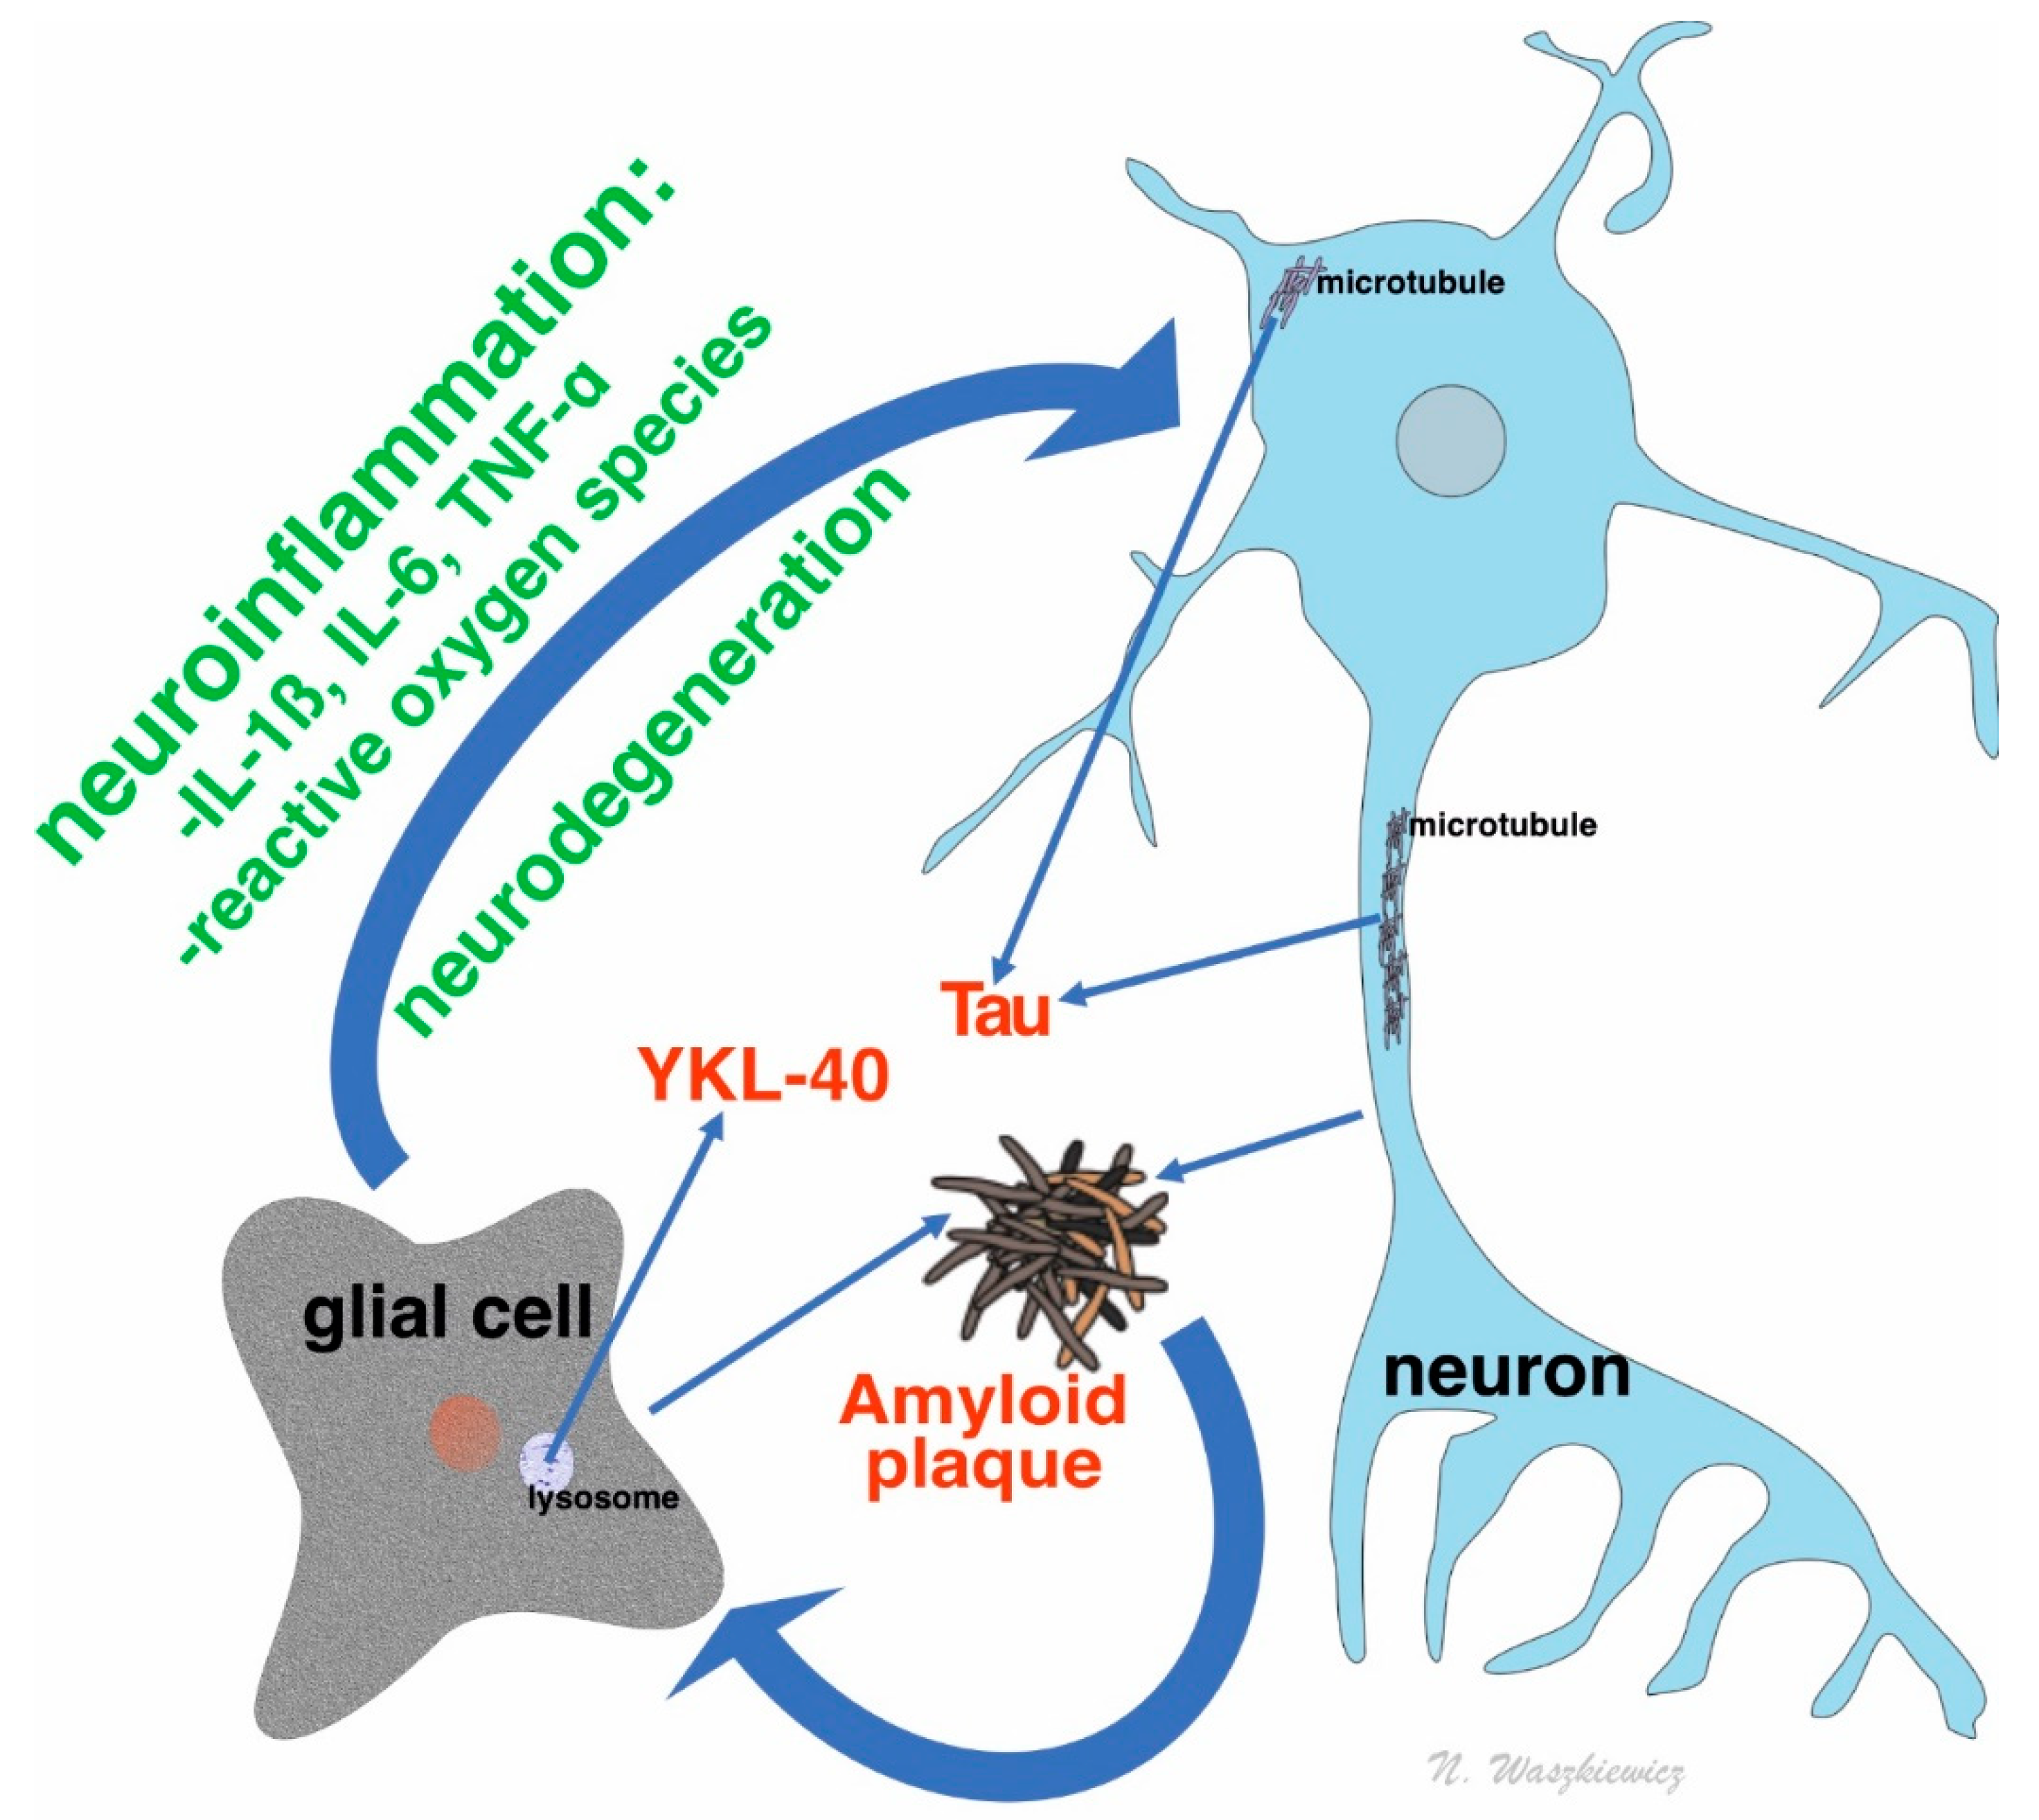
1. Introduction
1.1. Dementia
1.2. Amyloid Beta and Its Role in Dementia Process
1.3. Tau Protein and Its Role in Dementia
- Resulting from the loss of its physiological properties:
- Axonal transport disturbance;
- Actin cytoskeleton abnormalities leading to increased susceptibility of the cell to oxidative stress;
- Disturbed structure and function of mitochondria, disrupting their metabolism and increasing susceptibility to oxidative stress, which leads to the death of the cell.
- Resulting from the toxic effect of the abnormal isoform:
1.4. YKL-40: An Inflammatory Marker in Dementia
- connective tissue repair process, i.e., connective tissue growth stimulation, bonding and fibrillogenesis of collagen, modulating of inflammatory cytokines impact on fibroblasts;
- stimulation of epithelial cells migration;
- modulation, adhesion, and migration of vascular smooth muscle cells;
- stimulation of alveoli macrophages to metalloproteinases and chemokines secretion;
- increase in auxiliary lymphocytes Th2 response caused by antigens;
- regulation of oxidative stress response;
- regulation of apoptosis process (i.e., prevention of epithelial cells apoptosis);
- stimulation of M2 macrophages differentiation;
1.5. Practical Aspects of Using Dementia Biomarkers
- predictive biomarkers for estimating disease in the preclinical stage, and for estimating clinical prognosis;
- diagnostic biomarkers in precise differential diagnosis;
- biomarkers for healing response and assessing the effectiveness of therapy;
- surrogate markers for estimating the influence of therapeutic intervention on selected pathophysiological processes;
- trait markers, strictly tied to disease characteristics (e.g., mutations);
- condition markers (e.g., enzymes) for monitoring progression of disease [22].
2. Experimental Section
3. Results
3.1. Amyloid Markers Aβ40, Aβ42, and Aβ40/42 Ratio
3.2. Tau Protein
3.3. Amyloid Markers and Total Tau Protein Combinations
3.4. YKL-40
- Craig-Schapiro et al. found a statistically relevant increase in YKL-40 concentration in serum with disease progress which corresponded with results from CSF [45].
- Choi et al. suggested that YKL-40 could be highly useful in the diagnostic of MCI progression to mild AD. This was supported by the highest marker increase among these groups and the correlation of acquired results with patient functioning, measured by the CDR scale at this stage of disease progression diagnosis [127]. The results of this study do not clearly reinforce the prognostic value of YKL-40 in serum, but they suggest its diagnostic usability in combination with other markers (Aβ42, tau, and p-tau) [124].
- Grewal et al. examined women with amnestic MCI subtype from various ethnicity groups. Statistically significant concentration differences of YKL-40 among subgroups were identified only in the Latin American group. In addition, other measured biomarkers showed the differences of sensitivity among ethnic groups [93]. Amnestic type MCI is a state highly predisposing to AD, contrary to non-amnestic types which are the bases for developing other dementias. The results of prospective studies show that, every year, dementia is developed in 10–15% of patients with MCI [128].
- Surendranathan et al. did not shown any statistically significant YKL-40 concentration differences between patients with DLB and a control group [125].
- Villar-Pique et al. did not obtain any statistically relevant differences between AD patients and a control group. The acquired results were significantly divergent across groups. Among the tested groups, highly increased YKL-40 concentrations were observed in patients with CJD (p < 0.001) and to a lesser degree in patients with LBD (p < 0.05). The authors hypothesized that the crucial factor influencing the concentration of the marker in peripheral blood may be the damage level of the blood-brain barrier in the course of primary disease [126].
4. Discussion
Author Contributions
Funding
Conflicts of Interest
References
- Alzheimer’s Association. 2018 Alzheimer’s Disease Facts and Figures. Alzheimers Dement. 2018, 14, 367–429. [Google Scholar] [CrossRef]
- Katsnelson, A.; De Strooper, B.; Zoghbi, H.Y. Neurodegeneration: From cellular concepts to clinical applications. Sci. Transl. Med. 2016, 8, 364ps18. [Google Scholar] [CrossRef] [PubMed]
- Smith, E.E. Cerebral amyloid angiopathy as a cause of neurodegeneration. J. Neurochem. 2018, 144, 651–658. [Google Scholar] [CrossRef] [PubMed]
- Dichev, V.; Kazakova, M.; Sarafian, V. YKL-40 and neuron-specific enolase in neurodegeneration and neuroinflammation [published online ahead of print, 2020 Feb 11]. Rev. Neurosci. 2020. [Google Scholar] [CrossRef]
- O’Brien, J.T.; Thomas, A. Vascular dementia. Lancet 2015, 386, 1698–1706. [Google Scholar] [CrossRef]
- Cheng, C.; Huang, C.L.; Tsai, C.J.; Chou, P.H.; Lin, C.C.; Chang, C.K. Alcohol-related dementia: A systemic review of epidemiological studies. Psychosomatics 2017, 58, 331–342. [Google Scholar] [CrossRef]
- Fernando, M.S.; Ince, P.G.; MRC Cognitive Function and Ageing Neuropathology Study Group. Vascular pathologies and cognition in a population-based cohort of elderly people. J. Neurol. Sci. 2004, 226, 13–17. [Google Scholar] [CrossRef]
- Schneider, J.A.; Arvanitakis, Z.; Bang, W.; Bennett, D.A. Mixed brain pathologies account for most dementia cases in community-dwelling older persons. Neurology 2007, 69, 2197–2204. [Google Scholar] [CrossRef]
- Rambaran, R.N.; Serpell, L.C. Amyloid fibrils: Abnormal protein assembly. Prion 2008, 2, 112–117. [Google Scholar] [CrossRef]
- Puig, K.L.; Combs, C.K. Expression and function of APP and its metabolites outside the central nervous system. Exp. Gerontol. 2013, 48, 608–611. [Google Scholar] [CrossRef]
- van der Kant, R.; Goldstein, L.S. Cellular functions of the amyloid precursor protein from development to dementia. Dev. Cell 2015, 32, 502–515. [Google Scholar] [CrossRef]
- Bekris, L.M.; Yu, C.E.; Bird, T.D.; Tsuang, D.W. Genetics of Alzheimer disease. J. Geriatr. Psychiatry Neurol. 2010, 23, 213–227. [Google Scholar] [CrossRef] [PubMed]
- Nigam, S.M.; Xu, S.; Kritikou, J.S.; Marosi, K.; Brodin, L.; Mattson, M.P. Exercise and BDNF reduce Aβ production by enhancing α-secretase processing of APP. J. Neurochem. 2017, 142, 286–296. [Google Scholar] [CrossRef] [PubMed]
- Duncan, R.S.; Song, B.; Koulen, P. Presenilins as drug targets for Alzheimer’s disease-recent insights from cell biology and electrophysiology as novel opportunities in drug development. Int. J. Mol. Sci. 2018, 19, 1621. [Google Scholar] [CrossRef] [PubMed]
- Molinuevo, J.L.; Ayton, S.; Batrla, R.; Bednar, M.M.; Bittner, T.; Cummings, J.; Fagan, A.M.; Hampel, H.; Mielke, M.M.; O’bryant, S.; et al. Current state of Alzheimer’s fluid biomarkers. Acta Neuropathol. 2018, 136, 821–853. [Google Scholar] [CrossRef]
- Wang, R.; Wang, S.; Malter, J.S.; Wang, D.S. Effects of HNE-modification induced by Abeta on neprilysin expression and activity in SH-SY5Y cells. J. Neurochem. 2009, 108, 1072–1082. [Google Scholar] [CrossRef] [PubMed]
- Butterfield, D.; Mattson, M. Apolipoprotein E and oxidative stress in brain with relevance to Alzheimer’s disease. Neurobiol. Dis. 2020, 138, 104795. [Google Scholar] [CrossRef]
- Gwon, A.R.; Park, J.S.; Arumugam, T.V.; Kwon, Y.K.; Chan, S.L.; Kim, S.H.; Baik, S.H.; Yang, S.; Yun, Y.K.; Kim, S.; et al. Oxidative lipid modification of nicastrin enhances amyloidogenic γ-secretase activity in Alzheimer’s disease. Aging Cell 2012, 11, 559–568. [Google Scholar] [CrossRef]
- Fan, L.; Mao, C.; Hu, X.; Zhang, S.; Yang, Z.; Hu, Z.; Sun, H.; Fan, Y.; Dong, Y.; Yang, J.; et al. New insights into the pathogenesis of Alzheimer’s disease. Front. Neurol. 2020, 10, 1312. [Google Scholar] [CrossRef]
- Puzzo, D.; Argyrousi, E.K.; Staniszewski, A.; Zhang, H.; Calcagno, E.; Zuccarello, E.; Acquarone, E.; Fa’, M.; Puma, D.D.L.; Grassi, C.; et al. Tau is not necessary for amyloid-beta-induced synaptic and memory impairments. J. Clin. Investig. 2020, 130, 4831–4844. [Google Scholar] [CrossRef]
- Ossenkoppele, R.; Jansen, W.J.; Rabinovici, G.D.; Knol, D.L.; van der Flier, W.M.; van Berckel, B.N.M.; Scheltens, P.; Visser, P.J. Prevalence of amyloid PET positivity in dementia syndromes: A meta-analysis. JAMA 2015, 313, 1939–1949. [Google Scholar] [CrossRef] [PubMed]
- Lewczuk, P.; Riederer, P.; O’Bryant, S.E.; Verbeek, M.M.; Dubois, B.; Visser, P.J.; Jellinger, K.A.; Engelborghs, S.; Ramirez, A.; Parnetti, L.; et al. Cerebrospinal fluid and blood biomarkers for neurodegenerative dementias: An update of the Consensus of the Task Force on Biological Markers in Psychiatry of the World Federation of Societies of Biological Psychiatry. World J. Biol. Psychiatry 2018, 19, 244–328. [Google Scholar] [CrossRef] [PubMed]
- Jin, W.S.; Bu, X.L.; Liu, Y.H.; Shen, L.L.; Zhuang, Z.Q.; Jiao, S.S.; Zhu, C.; Wang, Q.H.; Zhou, H.D.; Zhang, T.; et al. Plasma amyloid-beta levels in patients with different types of cancer. Neurotox. Res. 2017, 31, 283–288. [Google Scholar] [CrossRef]
- Gronewold, J.; Klafki, H.W.; Baldelli, E.; Kaltwasser, B.; Seidel, U.K.; Todica, O.; Volsek, M.; Haussmann, U.; Wiltfang, J.; Kribben, A.; et al. Factors responsible for plasma β-amyloid accumulation in chronic kidney disease. Mol. Neurobiol. 2016, 53, 3136–3145. [Google Scholar] [CrossRef]
- Wang, Y.R.; Wang, Q.H.; Zhang, T.; Liu, Y.H.; Yao, X.Q.; Zeng, F.; Li, J.; Zhou, F.Y.; Wang, L.; Yan, J.C.; et al. Associations between hepatic functions and plasma amyloid-beta levels-implications for the capacity of liver in peripheral amyloid-beta clearance. Mol. Neurobiol. 2017, 54, 2338–2344. [Google Scholar] [CrossRef] [PubMed]
- Chojdak-Łukasiewicz, J.; Małodobra-Mazur, M.; Zimny, A.; Noga, L.; Paradowski, B. Plasma tau protein and Aβ42 level as markers of cognitive impairment in patients with Parkinson’s disease. Adv. Clin. Exp. Med. Off. Organ Wroc. Med Univ. 2020, 29, 115–121. [Google Scholar] [CrossRef] [PubMed]
- Lee, Y.H.; Martin, J.M.; Maple, R.L.; Tharp, W.G.; Pratley, R.E. Plasma amyloid-beta peptide levels correlate with adipocyte amyloid precursor protein gene expression in obese individuals. Neuroendocrinology 2009, 90, 383–390. [Google Scholar] [CrossRef]
- Startin, C.M.; Ashton, N.J.; Hamburg, S.; Hithersay, R.; Wiseman, F.K.; Mok, K.Y.; Hardy, J.; Lleó, A.; Lovestone, S.; Parnetti, L. Plasma biomarkers for amyloid, tau, and cytokines in Down syndrome and sporadic Alzheimer’s disease. Alzheimers Res. Ther. 2019, 11, 26. [Google Scholar] [CrossRef]
- Yasuda, S.; Baba, H.; Maeshima, H.; Shimano, T.; Inoue, M.; Ichikawa, T.; Shukuzawa, H.; Suzuku, T.; Arai, H. Serum levels and mutual correlations of amyloid β in patients with depression. Geriatr. Gerontol. Int. 2020, 20, 125–129. [Google Scholar] [CrossRef]
- Zhang, S.; Huang, S.Y.; An, X.B.; Zeng, L.; Ai, J. Medical histories of control subjects influence the biomarker potential of plasma Aβ in Alzheimer’s disease: A meta-analysis. J. Mol. Neurosci. 2020, 70, 861–870. [Google Scholar] [CrossRef]
- Zhang, C.C.; Xing, A.; Tan, M.S.; Tan, L.; Yu, J.T. The role of MAPT in neurodegenerative diseases: Genetics, mechanisms and therapy. Mol. Neurobiol. 2016, 53, 4893–4904. [Google Scholar] [CrossRef] [PubMed]
- Castellani, R.J.; Perry, G. Tau Biology, Tauopathy, Traumatic Brain Injury, and Diagnostic Challenges. J. Alzheimers Dis. 2019, 67, 447–467. [Google Scholar] [CrossRef] [PubMed]
- Wu, X.L.; Piña-Crespo, J.; Zhang, Y.W.; Chen, X.C.; Xu, H.X. Tau-mediated neurodegeneration and potential implications in diagnosis and treatment of Alzheimer’s disease. Chin. Med. J. 2017, 130, 2978–2990. [Google Scholar] [CrossRef]
- Tapia-Rojas, C.; Cabezas-Opazo, F.; Deaton, C.A.; Vergara, E.H.; Johnson, G.V.W.; Quintanilla, R.A. It’s all about tau. Prog. Neurobiol. 2019, 175, 54–76. [Google Scholar] [CrossRef]
- Barthélemy, N.R.; Horie, K.; Sato, C.; Bateman, R.J. Blood plasma phosphorylated-tau isoforms track CNS change in Alzheimer’s disease. J. Exp. Med. 2020, 217, e20200861. [Google Scholar] [CrossRef]
- Irwin, D.J. Tauopathies as clinicopathological entities. Parkinsonism Relat. Disord. 2016, 22 (Suppl. 1), S29–S33. [Google Scholar] [CrossRef]
- Llorens, F.; Villar-Piqué, A.; Candelise, N.; Ferrer, I.; Zerr, I. Tau protein as a biological fluid biomarker in neurodegenerative dementias. In Cognitive Disorders; Foyaca Sibat, H., Ed.; IntechOpen: London, UK, 2019. [Google Scholar] [CrossRef]
- Bateman, R.J.; Barthélemy, N.R.; Horie, K. Another step forward in blood-based diagnostics for Alzheimer’s disease. Nat. Med. 2020, 26, 314–316. [Google Scholar] [CrossRef] [PubMed]
- Mielke, M.M.; Hagen, C.E.; Xu, J.; Chai, X.; Vemuri, P.; Lowe, V.J.; Airey, D.C.; Knopman, D.S.; Roberts, R.O.; Machulda, M.M. Plasma phospho-tau181 increases with Alzheimer’s disease clinical severity and is associated with tau- and amyloid-positron emission tomography. Alzheimers Dement. 2018, 14, 989–997. [Google Scholar] [CrossRef]
- Park, J.C.; Han, S.H.; Yi, D.; Byun, M.S.; Lee, J.H.; Jang, S.; Ko, K.; Jeon, S.Y.; Lee, Y.S.; Kim, Y.K.; et al. Plasma tau/amyloid-β1-42 ratio predicts brain tau deposition and neurodegeneration in Alzheimer’s disease. Brain 2019, 142, 771–786. [Google Scholar] [CrossRef]
- Calsolaro, V.; Edison, P. Neuroinflammation in Alzheimer’s disease: Current evidence and future directions. Alzheimers Dement. 2016, 12, 719–732. [Google Scholar] [CrossRef]
- Di Rosa, M.; Malaguarnera, L. Chitinase 3 like-1: An emerging molecule involved in diabetes and diabetic complications. Pathobiology 2016, 83, 228–242. [Google Scholar] [CrossRef] [PubMed]
- Yeo, I.J.; Lee, C.K.; Han, S.B.; Yun, J.; Hong, J.T. Roles of chitinase 3-like 1 in the development of cancer, neurodegenerative diseases, and inflammatory diseases. Pharmacol. Ther. 2019, 203, 107394. [Google Scholar] [CrossRef] [PubMed]
- Prakash, M.; Bodas, M.; Prakash, D.; Nawani, N.; Khetmalas, M.; Mandal, A.; Eriksson, C. Diverse pathological implications of YKL-40: Answers may lie in ‘outside-in’ signaling. Cell Signal. 2013, 25, 1567–1573. [Google Scholar] [CrossRef] [PubMed]
- Craig-Schapiro, R.; Perrin, R.J.; Roe, C.M.; Xiong, C.; Carter, D.; Cairns, N.J.; Mintun, M.A.; Peskind, E.R.; Li, G.; Galasko, D.R. YKL-40: A novel prognostic fluid biomarker for preclinical Alzheimer’s disease. Biol. Psychiatry 2010, 68, 903–912. [Google Scholar] [CrossRef]
- Llorens, F.; Thüne, K.; Tahir, W.; Kanata, E.; Diaz-Lucena, D.; Xanthopoulos, K.; Kovatsi, E.; Pleschka, C.; Garcia-Esparcia, P.; Schmitz, M.; et al. YKL-40 in the brain and cerebrospinal fluid of neurodegenerative dementias. Mol. Neurodegener. 2017, 12, 83. [Google Scholar] [CrossRef] [PubMed]
- Gispert, J.D.; Monté, G.C.; Suárez-Calvet, M.; Falcon, C.; Tucholka, A.; Rojas, S.; Rami, L.; Sánchez-Valle, R.; Lladó, A.; Kleinberger, G. The APOE ε4 genotype modulates CSF YKL-40 levels and their structural brain correlates in the continuum of Alzheimer’s disease but not those of sTREM2. Alzheimers Dement. 2016, 6, 50–59. [Google Scholar] [CrossRef] [PubMed]
- Choi, J.Y.; Yeo, I.J.; Kim, K.C.; Choi, W.R.; Jung, J.K.; Han, S.B.; Hong, J.T. K284-6111 prevents the amyloid beta-induced neuroinflammation and impairment of recognition memory through inhibition of NF-κB-mediated CHI3L1 expression. J. Neuroinflamm. 2018, 15, 224. [Google Scholar] [CrossRef]
- Akboğa, M.K.; Yalçın, R.; Şahinarslan, A.; Yılmaz Demirtaş, C.; Paşaoğlu, H.; Abacı, A. Increased serum YKL-40 level is associated with the presence and severity of metabolic syndrome. Anatol. J. Cardiol. 2016, 16, 953–958. [Google Scholar] [CrossRef] [PubMed]
- Jin, Y.; Cao, J.N.; Wang, C.X.; Feng, Q.T.; Ye, X.H.; Xu, X.; Yang, C.J. High serum YKL-40 level positively correlates with coronary artery disease. Biomark. Med. 2017, 11, 133–139. [Google Scholar] [CrossRef] [PubMed]
- Marott, S.C.; Benn, M.; Johansen, J.S.; Jensen, G.B.; Tybjærg-Hansen, A.; Nordestgaard, B.G. YKL-40 levels and atrial fibrillation in the general population. Int. J. Cardiol. 2013, 167, 1354–1359. [Google Scholar] [CrossRef]
- Mutlu, L.C.; Tülübaş, F.; Alp, R.; Kaplan, G.; Yildiz, Z.D.; Gürel, A. Serum YKL-40 level is correlated with apnea hypopnea index in patients with obstructive sleep apnea sindrome. Eur. Rev. Med. Pharmacol. Sci. 2017, 21, 4161–4166. [Google Scholar] [PubMed]
- Xu, T.; Zhong, C.; Wang, A.; Gou, Z.; Bu, X.; Zhou, Y.; Tian, Y.; HuangFu, X.; Zhu, Z.; Zhang, Y. YKL-40 is a novel biomarker for predicting hypertension incidence among prehypertensive subjects: A population-based nested case-control study in China. Clin. Chim. Acta 2017, 472, 146–150. [Google Scholar] [CrossRef] [PubMed]
- Park, H.Y.; Jun, C.D.; Jeon, S.J.; Choi, S.S.; Kim, H.R.; Choi, D.B.; Kwak, S.; Lee, H.S.; Cheong, J.S.; So, H.S. Serum YKL-40 levels correlate with infarct volume, stroke severity, and functional outcome in acute ischemic stroke patients. PLoS ONE 2012, 7, e51722. [Google Scholar] [CrossRef] [PubMed]
- Sanfilippo, C.; Longo, A.; Lazzara, F.; Cambria, D.; Distefano, G.; Palumbo, M.; Cantarella, A.; Malaguarnera, L.; Di Rosa, M. CHI3L1 and CHI3L2 overexpression in motor cortex and spinal cord of sALS patients. Mol. Cell. Neurosci. 2017, 85, 162–169. [Google Scholar] [CrossRef] [PubMed]
- Chung, C.; Tallerico, T.; Seeman, P. Schizophrenia hippocampus has elevated expression of chondrex glycoprotein gene. Synapse 2003, 50, 29–34. [Google Scholar] [CrossRef]
- Rymo, I.; Kern, S.; Bjerke, M.; Zetterberg, H.; Marlow, T.; Blennow, K.; Gudmundsson, P.; Skoog, I.; Waern, M. CSF YKL-40 and GAP-43 are related to suicidal ideation in older women. Acta Psychiatr. Scand. 2017, 135, 351–357. [Google Scholar] [CrossRef] [PubMed]
- Querol-Vilaseca, M.; Colom-Cadena, M.; Pegueroles, J.; San Martín-Paniello, C.; Clarimon, J.; Belbin, O.; Fortea, J.; Lleó, A. YKL-40 (Chitinase 3-like I) is expressed in a subset of astrocytes in Alzheimer’s disease and other tauopathies. J. Neuroinflamm. 2017, 14, 118. [Google Scholar] [CrossRef]
- Isgren, A.; Sellgren, C.; Ekman, C.J.; Holmén-Larsson, J.; Blennow, K.; Zetterberg, H.; Jakobson, J.; Landén, M. Markers of neuroinflammation and neuronal injury in bipolar disorder: Relation to prospective clinical outcomes. Brain Behav. Immun. 2017, 65, 195–201. [Google Scholar] [CrossRef]
- Keshavan, A.; Heslegrave, A.; Zetterberg, H.; Schott, J.M. Blood biomarkers for Alzheimer’s disease: Much promise, cautious progress. Mol. Diagn. Ther. 2017, 21, 13–22. [Google Scholar] [CrossRef]
- Hampel, H.; O’Bryant, S.E.; Molinuevo, J.L.; Zetterberg, H.; Masters, C.L.; Lista, S.; Kiddle, S.J.; Batrla, R.; Blennow, K. Blood-based biomarkers for Alzheimer disease: Mapping the road to the clinic. Nat. Rev. Neurol. 2018, 14, 639–652. [Google Scholar] [CrossRef]
- Olsson, B.; Lautner, R.; Andreasson, U.; Öhrfelt, A.; Portelius, E.; Bjerke, M.; Hölttä, M.; Rosén, C.; Olsson, C.; Strobel, G.; et al. CSF and blood biomarkers for the diagnosis of Alzheimer’s disease: A systematic review and meta-analysis. Lancet Neurol. 2016, 15, 673–684. [Google Scholar] [CrossRef]
- Thijssen, E.H.; La Joie, R.; Wolf, A.; Strom, A.; Wang, P.; Iacarrino, L.; Bourakova, V.; Cobigo, Y.; Heuer, H.; Spina, S.; et al. Diagnostic value of plasma phosphorylated tau181 in Alzheimer’s disease and frontotemporal lobar degeneration. Nat. Med. 2020, 26, 387–397. [Google Scholar] [CrossRef] [PubMed]
- Blennow, K.; Zetterberg, H. Biomarkers for Alzheimer’s disease: Current status and prospects for the future (Review). J. Intern. Med. 2018, 284, 643–663. [Google Scholar] [CrossRef] [PubMed]
- Bibl, M.; Esselmann, H.; Mollenhauer, B.; Weniger, G.; Welge, V.; Liess, M.; Lewczuk, P.; Otto, M.; Schulz, J.B.; Trenkwalder, C.; et al. Blood-based neurochemical diagnosis of vascular dementia: A pilot study. J. Neurochem. 2007, 103, 467–474. [Google Scholar] [CrossRef]
- Kim, K.; Kim, M.J.; Kim, D.W.; Kim, S.Y.; Park, S.; Park, C.B. Clinically accurate diagnosis of Alzheimer’s disease via multiplexed sensing of core biomarkers in human plasma. Nat. Commun. 2020, 11, 119. [Google Scholar] [CrossRef]
- Mehta, P.D.; Pirttilä, T.; Mehta, S.P.; Sersen, E.A.; Aisen, P.S.; Wisniewski, H.M. Plasma and cerebrospinal fluid levels of amyloid beta proteins 1-40 and 1-42 in Alzheimer disease. Arch. Neurol. 2000, 57, 100–105. [Google Scholar] [CrossRef]
- Sobów, T.; Flirski, M.; Kłoszewska, I.; Liberski, P.P. Plasma levels of Aβ peptides are altered in amnestic mild cognitive impairment but not in Alzheimer’s disease. Acta Neurobiol. Exp. 2005, 65, 117–124. [Google Scholar]
- Pesaresi, M.; Lovati, C.; Bertora, P.; Mailland, E.; Galimberti, D.; Scarpini, E.; Quadri, P.; Forloni, G.; Mariani, C. Plasma levels of beta-amyloid (1-42) in Alzheimer’s disease and mild cognitive impairment. Neurobiol. Aging 2006, 27, 904–905. [Google Scholar] [CrossRef]
- Fagan, A.M.; Roe, C.M.; Xiong, C.; Mintun, M.A.; Morris, J.C.; Holtzman, D.M. Cerebrospinal fluid tau/beta-amyloid(42) ratio as a prediction of cognitive decline in nondemented older adults. Arch. Neurol. 2007, 64, 343–349. [Google Scholar] [CrossRef]
- Abdullah, L.; Paris, D.; Luis, C.; Quadros, A.; Parrish, J.; Valdes, L.; Keegan, A.P.; Mathura, V.; Crawford, F.; Mullan, M. The influence of diagnosis, intra- and inter-person variability on serum and plasma Abeta levels. Neurosci. Lett. 2007, 428, 53–58. [Google Scholar] [CrossRef]
- Baranowska-Bik, A.; Bik, W.; Wolinska-Witort, E.; Martynska, L.; Chmielowska, M.; Barcikowska, M.; Baranowska, B. Plasma beta amyloid and cytokine profile in women with Alzheimer’s disease. Neuroendocrinol. Lett. 2008, 29, 75–79. [Google Scholar] [PubMed]
- Xu, W.; Kawarabayashi, T.; Matsubara, E.; Deguchi, K.; Murakami, T.; Harigaya, Y.; Ikeda, M.; Amari, M.; Kuwano, R.; Abe, K.; et al. Plasma antibodies to Abeta40 and Abeta42 in patients with Alzheimer’s disease and normal controls. Brain Res. 2008, 1219, 169–179. [Google Scholar] [CrossRef] [PubMed]
- Ait-ghezala, G.; Abdullah, L.; Volmar, C.H.; Paris, D.; Luis, C.A.; Quadros, A.; Mouzon, B.; Mullan, M.A.; Keegan, A.P.; Parrish, J.; et al. Diagnostic utility of APOE, soluble CD40, CD40L, and Abeta1-40 levels in plasma in Alzheimer’s disease. Cytokine 2008, 44, 283–287. [Google Scholar] [CrossRef] [PubMed]
- Roher, A.E.; Esh, C.L.; Kokjohn, T.A.; Castaňo, E.M.; Van Vickle, G.D.; Kalback, W.M.; Patton, L.; Luehrs, D.C.; Daugs, I.D.; Kuo, Y.M.; et al. Amyloid beta peptides in human plasma and tissues and their significance for Alzheimer’s disease. Alzheimers Dement. 2009, 5, 18–29. [Google Scholar] [CrossRef] [PubMed]
- Sedaghat, F.; Dedousi, E.; Costa, V.; Dimitriadis, A.S.; Baloyannis, S.J. Plasma levels of amyloid beta1-42 are independent of neuronal function in Alzheimer’s disease. J. Alzheimers Dis. 2009, 17, 343–348. [Google Scholar] [CrossRef] [PubMed]
- Luis, C.A.; Abdullah, L.; Paris, D.; Quadros, A.; Mullan, M.; Mouzon, M.; Ait-Ghezala, G.; Crawford, F.; Mullan, M. Serum beta-amyloid correlates with neuropsychological impairment. Neuropsychol. Dev. Cogn. B Aging Neuropsychol. Cogn. 2009, 16, 203–218. [Google Scholar] [CrossRef]
- Cammarata, S.; Borghi, R.; Giliberto, L.; Pardini, M.; Pollero, V.; Novello, C.; Fornato, M.; Vitali, A.; Bracco, L.; Caltagirone, C.; et al. Amyloid-beta42 plasma levels are elevated in amnestic mild cognitive impairment. J. Alzheimers Dis. 2009, 18, 267–271. [Google Scholar] [CrossRef]
- Lui, J.K.; Laws, S.M.; Li, Q.X.; Villemagne, V.L. Plasma amyloid-beta as a biomarker in Alzheimer’s disease: The AIBL study of aging. J. Alzheimers Dis. 2010, 20, 1233–1242. [Google Scholar] [CrossRef]
- Konno, T.; Hata, S.; Hamada, Y.; Horikoshi-Sakuraba, Y.; Nakaya, T.; Saito, Y.; Yamamoto, T.; Yamamoto, T.; Maeda, M.; Ikeuchi, T.; et al. Coordinated increase of γ-secretase reaction products in the plasma of some female Japanese sporadic Alzheimer’s disease patients: Quantitative analysis of p3-Alcα with a new ELISA system. Mol. Neurodegener. 2011, 6, 76. [Google Scholar] [CrossRef]
- Han, Y.; Jia, J.; Jia, X.F.; Qin, W.; Wang, S. Combination of plasma biomarkers and clinical data for the detection of sporadic Alzheimer’s disease. Neurosci. Lett. 2012, 516, 232–236. [Google Scholar] [CrossRef]
- Zhang, J.; Jia, J.; Qin, W.; Wang, S. Combination of plasma tumor necrosis factor receptors signaling proteins, beta-amyloid and apolipoprotein E for the detection of Alzheimer’s disease. Neurosci. Lett. 2013, 541, 99–104. [Google Scholar] [CrossRef]
- Huang, C.W.; Wang, S.J.; Wu, S.J.; Yang, C.C.; Huang, M.W.; Lin, C.H.; Cheng, I.H. Potential blood biomarker for disease severity in the Taiwanese population with Alzheimer’s disease. Am. J. Alzheimers Dis. Other Dement. 2013, 28, 75–83. [Google Scholar] [CrossRef] [PubMed]
- Ruiz, A.; Pesini, P.; Espinosa, A.; Pérez-Grijalba, V.; Valero, S.; Sotolongo-Grau, O.; Alegret, M.; Monleón, I.; Laufente, A.; Buendia, M.; et al. Blood amyloid beta levels in healthy, mild cognitive impairment and Alzheimer’s disease individuals: Replication of diastolic blood pressure correlations and analysis of critical covariates. PLoS ONE 2013, 8, e81334. [Google Scholar]
- Wang, T.; Xiao, S.; Liu, Y.; Lin, Z.; Su, N.; Li, X.; Li, G.; Zhang, M.; Fang, Y. The efficacy of plasma biomarkers in early diagnosis of Alzheimer’s disease. Int. J. Geriatr. Psychiatry 2014, 29, 713–719. [Google Scholar] [CrossRef]
- Tzikas, S.; Schlak, D.; Sopova, K.; Gatsiou, A.; Stakos, D.; Stamatelopoulos, K.; Stellos, K.; Laske, C. Increased myeloperoxidase plasma levels in patients with Alzheimer’s disease. J. Alzheimers Dis. 2014, 39, 557–564. [Google Scholar] [CrossRef] [PubMed]
- Krishnan, S.; Rani, P. Evaluation of selenium, redox status and their association with plasma amyloid/tau in Alzheimer’s disease. Biol. Trace Elem. Res. 2014, 158, 158–165. [Google Scholar] [CrossRef] [PubMed]
- Kleinschmidt, M.; Schoenfeld, R.; Göttlich, C.; Bittner, D.; Metzner, J.E.; Leplow, B.; Demuth, H.U. Characterizing aging, mild cognitive impairment, and dementia with blood-based biomarkers and neuropsychology. J. Alzheimers Dis. 2016, 50, 111–126. [Google Scholar] [CrossRef] [PubMed]
- Jiao, S.; Bu, X.; Liu, Y.; Wang, Q.H.; Liu, C.H.; Yao, X.Q.; Zhou, X.F.; Wang, Y.J. Differential levels of p75NTR ectodomain in CSF and blood in patients with Alzheimer’s disease: A novel diagnostic marker. Transl. Psychiatry 2015, 5, e650. [Google Scholar] [CrossRef]
- Igarashi, K.; Yoshida, M.; Waragai, M.; Kashiwagi, K. Evaluation of dementia by acrolein, amyloid-β and creatinine. Clin. Chim. Acta 2015, 450, 56–63. [Google Scholar] [CrossRef]
- Kim, H.J.; Park, K.W.; Kim, T.E.; Im, J.Y.; Shin, H.S.; Kim, S.; Lee, D.H.; Ye, B.H.; Kim, J.H.; Kim, E.J.; et al. Elevation of the plasma Aβ40/Aβ42 ratio as a diagnostic marker of sporadic early-onset Alzheimer’s disease. J. Alzheimers Dis. 2015, 48, 1043–1050. [Google Scholar] [CrossRef]
- Poljak, A.; Crawford, J.D.; Smythe, G.A.; Brodaty, H.; Slavin, M.J.; Kochan, N.A.; Trollor, J.N.; Wen, W.; Mather, K.A.; Assareh, A.A.; et al. The relationship between plasma Aβ levels, cognitive function and brain volumetrics: Sydney memory and ageing study. Curr. Alzheimer Res. 2016, 13, 243–255. [Google Scholar] [CrossRef] [PubMed]
- Grewal, R.; Haghighi, M.; Huang, S.; Smith, A.G.; Cao, C.; Lin, X.; Lee, D.C.; Teten, N.; Hill, A.M.; Selenica, M.L.B. Identifying biomarkers of dementia prevalent among amnestic mild cognitively impaired ethnic female patients. Alzheimers Res. Ther. 2016, 8, 43. [Google Scholar] [CrossRef] [PubMed][Green Version]
- Yamashita, S.; Kiko, T.; Fujiwara, H.; Hashimoto, M.; Nakagawa, K.; Kinoshita, M.; Furukawa, K.; Arai, H.; Miyazawa, T. Alterations in the levels of amyloid-β, phospholipid hydroperoxide, and plasmalogen in the blood of patients with Alzheimer’s disease: Possible interactions between amyloid-β and these lipids. J. Alzheimers Dis. 2016, 50, 527–537. [Google Scholar] [CrossRef] [PubMed]
- Rani, P.; Krishnan, S.; Rani Cathrine, C. Study on analysis of peripheral biomarkers for Alzheimer’s disease diagnosis. Front. Neurol. 2017, 8, 328. [Google Scholar] [CrossRef]
- Sun, H.L.; Li, W.W.; Zhu, C.; Jin, W.S.; Liu, Y.H.; Zeng, F.; Wang, Y.J.; Bu, X.L. The correlations of plasma and cerebrospinal fluid amyloid-beta levels with platelet count in patients with Alzheimer’s disease. BioMed Res. Int. 2018, 1–7. [Google Scholar] [CrossRef]
- Chen, K.; Gao, T.; Bai, Z.; Yuan, Z. Circulating APP, NCAM and Aβ serve as biomarkers for Alzheimer’s disease. Brain Res. 2018, 1699, 117–120. [Google Scholar] [CrossRef] [PubMed]
- Le Bastard, N.; Aerts, L.; Leurs, J.; Blomme, W.; De Deyn, P.P.; Engelborghs, S. No correlation between time-linked plasma and CSF Aβ levels. Neurochem. Int. 2009, 55, 820–825. [Google Scholar] [CrossRef]
- Le Bastard, N.; Leurs, J.; Blomme, W.; De Deyn, P.P.; Engelborghs, S. Plasma amyloid-beta forms in Alzheimer’s disease and non-Alzheimer’s disease patients. J. Alzheimers Dis. 2010, 21, 291–301. [Google Scholar] [CrossRef]
- Sundelöf, J.; Sundström, J.; Hansson, O.; Eriksdotter-Jönhagen, M.; Giedraitis, V.; Larsson, A.; Degerman-Gunnarsson, M.; Ingelsson, M.; Minthon, L.; Blennow, K.; et al. Higher cathepsin B levels in plasma in Alzheimer’s disease compared to healthy controls. J. Alzheimers Dis. 2010, 22, 1223–1230. [Google Scholar] [CrossRef]
- Chou, C.T.; Liao, Y.C.; Lee, W.J.; Wang, S.J.; Fuh, J.L. SORL1 gene, plasma biomarkers, and the risk of Alzheimer’s disease for the Han Chinese population in Taiwan. Alzheimers Res. Ther. 2016, 8, 53. [Google Scholar] [CrossRef]
- Hsu, J.L.; Lee, W.J.; Liao, Y.C.; Lirng, J.F.; Wang, S.J.; Fuh, J.L. Plasma biomarkers are associated with agitation and regional brain atrophy in Alzheimer’s disease. Sci. Rep. 2017, 7, 5035. [Google Scholar] [CrossRef]
- Hanon, O.; Vidal, J.S.; Lehmann, S.; Bombois, S.; Allinquant, B.; Tréluyer, J.M.; Gelé, P.; Delmaire, C.; Blanc, F.; Mangin, J.F.; et al. Plasma amyloid levels within the Alzheimer’s process and correlations with central biomarkers. Alzheimers Dement. 2018, 14, 858–868. [Google Scholar] [CrossRef] [PubMed]
- Uslu, S.; Akarkarasu, Z.E.; Ozbabalik, D.; Ozkan, S.; Çolak, O.; Demirkan, E.S.; Ozkiris, A.; Demirustu, C.; Alatas, O. Levels of amyloid beta-42, interleukin-6 and tumor necrosis factor-alpha in Alzheimer’s disease and vascular dementia. Neurochem. Res. 2012, 37, 1554–1559. [Google Scholar] [CrossRef]
- Chiu, M.J.; Yang, S.Y.; Chen, T.F.; Chieh, J.J.; Huang, T.Z.; Yip, P.K.; Yang, H.C.; Cheng, T.W.; Chen, Y.F.; Hua, M.S.; et al. New assay for old markers-plasma beta amyloid of mild cognitive impairment and Alzheimer’s disease. Curr. Alzheimer Res. 2012, 9, 1142–1148. [Google Scholar] [CrossRef] [PubMed]
- Tzen, K.Y.; Yang, S.Y.; Chen, T.F.; Cheng, T.W.; Horng, H.E.; Wen, H.P.; Huang, Y.Y.; Shiue, C.Y.; Chiu, M.J. Plasma Aβ but not tau is related to brain PiB retention in early Alzheimer’s disease. ACS Chem. Neurosci. 2014, 5, 830–836. [Google Scholar] [CrossRef]
- Lee, N.C.; Yang, S.Y.; Chieh, J.J.; Huang, P.T.; Chang, L.M.; Chiu, Y.N.; Huang, A.C.; Chien, Y.H.; Hwu, W.L.; Chiu, M.J. Blood beta-amyloid and tau in Down syndrome: A comparison with Alzheimer’s disease. Front. Aging Neurosci. 2016, 8, 316. [Google Scholar] [CrossRef] [PubMed]
- Teunissen, C.E.; Chiu, M.J.; Yang, C.C.; Yang, S.H.; Scheltens, P.; Zetterberg, H.; Blennow, K. plasma amyloid-β (Aβ42) correlates with cerebrospinal fluid Aβ42 in Alzheimer’s disease. J. Alzheimers Dis. 2018, 62, 1857–1863. [Google Scholar] [CrossRef]
- Tang, S.C.; Yang, K.C.; Chen, C.H.; Yang, S.Y.; Chiu, M.J.; Wu, C.C.; Jeng, J.S. Plasma β-amyloids and tau proteins in patients with vascular cognitive impairment. Neuromol. Med. 2018, 20, 498–503. [Google Scholar] [CrossRef]
- Fan, L.Y.; Tzen, K.Y.; Chen, Y.F.; Chen, T.F.; Lai, Y.M.; Yen, R.F.; Huang, Y.Y.; Shiue, C.Y.; Yang, S.Y.; Chiu, M.J. The relation between brain amyloid deposition, cortical atrophy, and plasma biomarkers in amnesic mild cognitive impairment and Alzheimer’s disease. Front. Aging Neurosci. 2018, 10, 175. [Google Scholar] [CrossRef]
- Tsai, C.L.; Liang, C.S.; Lee, J.T.; Su, M.W.; Lin, C.C.; Chu, H.T.; Tsai, C.K.; Lin, G.Y.; Lin, Y.K.; Yang, F.C. Associations between plasma biomarkers and cognition in patients with Alzheimer’s disease and amnestic mild cognitive impairment: A cross-sectional and longitudinal study. J. Clin. Med. 2019, 8, 1893. [Google Scholar] [CrossRef]
- Janelidze, S.; Stomrud, E.; Palmqvist, S.; Zetterberg, H.; van Westen, D.; Jeromin, A.; Song, L.; Hanlon, D.; Tan Hehir, C.A.; Baker, D.; et al. Plasma β-amyloid in Alzheimer’s disease and vascular disease. Sci. Rep. 2016, 6, 26801. [Google Scholar] [CrossRef] [PubMed]
- Shi, Y.; Lu, X.; Zhang, L.; Shu, H.; Gu, L.; Wang, Z.; Gao, L.; Zhu, J.; Zhang, H.; Zhou, D.; et al. Potential value of plasma amyloid-β, total tau, and neurofilament light for identification of early Alzheimer’s disease. ACS Chem. Neurosci. 2019, 10, 3479–3485. [Google Scholar] [CrossRef] [PubMed]
- Mattsson, N.; Zetterberg, H.; Janelidze, S.; Insel, P.S.; Andreasson, U.; Stomrud, E.; Palmqvist, S.; Baker, D.; Tan Hehir, C.A.; Jeromin, A.; et al. Plasma tau in Alzheimer disease. Neurology 2016, 87, 1827–1835. [Google Scholar] [CrossRef] [PubMed]
- Foiani, M.S.; Woollacott, I.O.; Heller, C.; Bocchetta, M.; Heslegrave, A.; Dick, K.M.; Russell, L.L.; Marshall, C.R.; Mead, S.; Schott, J.M.; et al. Plasma tau is increased in frontotemporal dementia. J. Neurol. Neurosurg. Psychiatry 2018, 89, 804–807. [Google Scholar] [CrossRef] [PubMed]
- Chiu, M.J.; Chen, Y.F.; Chen, T.F.; Yang, S.H.; Yang, F.P.G.; Tseng, T.W.; Chieh, J.J.; Rare Chen, J.C.; Tzen, K.Y.; Hua, M.S.; et al. Plasma tau as a window to the brain-negative associations with brain volume and memory function in mild cognitive impairment and early Alzheimer’s disease. Hum. Brain Mapp. 2014, 35, 3132–3142. [Google Scholar] [CrossRef] [PubMed]
- Yang, C.C.; Chiu, M.J.; Chen, T.F.; Chang, H.L.; Liu, B.H.; Yang, S.Y. Assay of plasma phosphorylated tau protein (threonine 181) and total tau protein in early-stage Alzheimer’s disease. J. Alzheimers Dis. 2018, 61, 1323–1332. [Google Scholar] [CrossRef] [PubMed]
- Shekhar, S.; Kumar, R.; Rai, N.; Kumar, V.; Singh, K.; Upadhay, A.D.; Tripathi, M.; Dwivedi, S.; Dey, A.B.; Dey, S. Estimation of tau and phosphorylated tau181 in serum of Alzheimer’s disease and mild cognitive impairment patients. PLoS ONE 2016, 11, e0159099. [Google Scholar] [CrossRef]
- Jiang, T.; Gong, P.Y.; Tan, M.S.; Xue, X.; Huang, S.; Zhou, J.S.; Tan, L.; Zhang, Y.D. Soluble TREM1 concentrations are increased and positively correlated with total tau levels in the plasma of patients with Alzheimer’s disease. Aging Clin. Exp. Res. 2019, 31, 1801–1805. [Google Scholar] [CrossRef]
- Dage, J.L.; Wennberg, A.M.V.; Airey, D.C.; Hagen, C.E.; Knopman, D.S.; Machulda, M.M.; Roberts, R.O.; Jack, C.R., Jr.; Petersen, R.C.; Mielke, M.M. Levels of tau protein in plasma are associated with neurodegeneration and cognitive function in a population-based elderly cohort. Alzheimers Dement. 2016, 12, 1226–1234. [Google Scholar] [CrossRef]
- Mielke, M.M.; Hagen, C.E.; Wennberg, A.M.V.; Airey, D.C.; Savica, R.; Knopman, D.S.; Machulda, M.M.; Roberts, R.O.; Jack, C.R., Jr.; Petersen, R.C.; et al. Association of plasma total tau level with cognitive decline and risk of mild cognitive impairment or dementia in the Mayo Clinic study on aging. JAMA Neurol. 2017, 74, 1073–1080. [Google Scholar] [CrossRef]
- Deters, K.D.; Risacher, S.L.; Kim, S.; Nho, K.; West, J.D.; Blennow, K.; Zetterberg, H.; Shaw, L.M.; Trojanowski, J.Q.; Weiner, M.W.; et al. Plasma tau association with brain atrophy in mild cognitive impairment and Alzheimer’s disease. J. Alzheimers Dis. 2017, 58, 1245–1254. [Google Scholar] [CrossRef] [PubMed]
- Chiu, M.J.; Yang, S.Y.; Horng, H.E.; Yang, C.C.; Chen, T.F.; Chieh, J.J.; Chen, H.H.; Chen, T.C.; Ho, C.S.; Chang, S.F.; et al. Combined plasma biomarkers for diagnosing mild cognition impairment and Alzheimer’s disease. ACS Chem. Neurosci. 2013, 4, 1530–1536. [Google Scholar] [CrossRef] [PubMed]
- Choi, J.; Lee, H.W.; Suk, K. Plasma level of chitinase 3-like 1 protein increases in patients with early Alzheimer’s disease. J. Neurol. 2011, 258, 2181–2185. [Google Scholar] [CrossRef]
- Surendranathan, A.; Su, L.; Mak, E.; Passamonti, L.; Hong, Y.T.; Arnold, R.; Rodriguez, P.V.; Bevan-Jones, W.R.; Brain, S.A.E.; Fryer, T.; et al. Early microglial activation and peripheral inflammation in dementia with Lewy bodies. Brain 2018, 141, 3415–3427. [Google Scholar] [CrossRef] [PubMed]
- Villar-Piqué, A.; Schmitz, M.; Hermann, P.; Goebel, S.; Bunck, T.; Varges, D.; Ferrer, I.; Riggert, J.; Llorens, F.; Zerr, I. Plasma YKL-40 in the spectrum of neurodegenerative dementia. J. Neuroinflamm. 2019, 16, 145. [Google Scholar] [CrossRef]
- Kim, J.W.; Byun, M.S.; Sohn, B.K.; Yi, D.; Seo, E.H.; Choe, Y.M.; Kim, S.G.; Choi, H.J.; Lee, J.H.; Chee, I.S.; et al. Clinical dementia rating orientation score as an excellent predictor of the progression to Alzheimer’s disease in mild cognitive impairment. Psychiatry Investig. 2017, 14, 420–426. [Google Scholar] [CrossRef]
- Roberts, R.; Knopman, D.S. Classification and epidemiology of MCI. Clin. Geriatr. Med. 2013, 29, 753–772. [Google Scholar] [CrossRef]


| Biomarker | Database | Found | Qualified | Qualified Total |
|---|---|---|---|---|
| Amyloid beta | Medline | 1698 | 41 | 50 |
| PubMed | 1709 | 40 | ||
| Web of Science | 7133 | 48 | ||
| T-tau | Medline | 405 | 15 | 20 |
| PubMed | 397 | 16 | ||
| Web of Science | 1547 | 14 | ||
| YKL-40 | Medline | 14 | 4 | 5 |
| PubMed | 11 | 3 | ||
| Web of Science | 38 | 5 | ||
| Amyloid beta and t-tau combination | Medline | 281 | 5 | 4 |
| PubMed | 255 | 5 | ||
| Web of Science | 960 | 5 |
| Study | N | Groups (n) | Aβ40 Concentration [pg/mL] (SD or CI) | p | Aβ42 Concentration [pg/mL] (SD or CI) | p | Aβ42/Aβ40 (SD or CI) | p | Method |
|---|---|---|---|---|---|---|---|---|---|
| Mehta et al., 2000 [67] | 65 | AD (36), HC (29) | AD 272 (100–770) HC 219 (35–490) | 0.005 | AD 73 (25–880) HC 81 (25–905) | >0.05 | - | - | ELISA |
| Sobów et al., 2005 [68] | 158 | AD (54), MCI (39), HC (35) | AD 168.7 (32.2) MCI 160.1 (20.2) HC 160.1 (15.2) | >0.05 | AD 37.8 (10.3) MCI 56.8 (9.3) HC 36.3 (6.3) | <0.001 (MCI vs. AD + HC) | AD 4.6 (0.9) MCI 2.9 (0.6) HC 4.5 (0.6) | <0.001 (MCI vs. AD + HC) | ELISA |
| Pesaresi et al., 2006 [69] | 324 | AD (146), MCI (89), HC (89) | - | - | AD 38 MCI 52 HC 54 | <0.01 (AD vs. MCI + HC) | - | - | ELISA |
| Fagan et al., 2007 [70] | 114 | AD CDR1 (16), AD CDR0.5 (33), HC-CDR0 (65) | AD CDR 1 AD CDR 0.5 CDR 0 191 (61.3) | 0.51 | AD CDR1 36 (37.2) AD CDR0.5 41 (38.9) CDR0 36 (29.4) | 0.76 | Aβ40/42 AD CDR1 9.25 (7.0) AD CDR0.5 7.78 (6.5) CDR0 8.64 (8.9) | 0.82 | ELISA |
| Abdullah et al., 2007 [71] | 213 | AD (67), HC (146) | Serum AD 183.01 (6.23) HC 134.33 (2.79) Plasma AD 103.38 (4.27) HC 80.66 ± 1.86 | <0.05 <0.01 | Serum AD 9.87 (0.82) HC 9.02 (0.40) Plasma AD 4.53 (0.52) HC 5.66 (0.31) | >0.05 >0.05 | Serum AD 0.064 (0.011) HC 0.076 (0.005) Plasma AD 0.053 (0.008) HC 0.061 (0.006) | <0.05 >0.05 | ELISA |
| Baranowska-Bik et al., 2008 [72] | 124 | mildAD (29), m-sAD (28), HC (67) | - | - | HC > mildAD > mod-sevAD | <0.05 (mild vs. m-sAD) <0.01 (HC vs. mildAD) | - | - | ELISA |
| Xu et al., 2008 [73] | 268 | AD (113), HC (155) | AD 112 (39.51) pmol/L HC 95.38 (32.30) | <0.0002 | AD 10.29 (13.80) pmol/L HC 12.13 (12.29) | <0.0001 | Aβ40/42 AD 14.42 (10.00) HC 8.34 (3.83) | <0.0001 | ELISA |
| Ait-ghezala et al., 2008 [74] | 175 | AD (73), HC (102) | AD 91.99 (5.02) HC 81.04 (2.94) | <0.05 | AD 1.91 (0.14, 6.84) HC 2.82 (0.59, 5.38) | >0.05 | AD 0.015 (0.002, 0.097) HC 0.032 (0.008, 0.065) | >0.05 | ELISA |
| Roher et al., 2009 [75] | 38 | AD (17, HC (21) | AD 424.06 (147.73) HC 344.41 (132.43) | 0.088 | AD 139.91 (77.82) HC 124.71 (42.34) | 0.448 | AD 0.35 (0.16) HC 0.44 (0.30) | 0.292 | ELISA |
| Sedaghat et al., 2009 [76] | 35 | AD (29), HC (16) | - | - | AD 16.2 (2.6) HC 13.4 (1.4) | >0.05 | - | - | ELISA |
| Luis et al., 2009 [77] | 78 | AD (25), MCI (13), HC (40) | AD 181 (13.78) MCI 158 (17.55) HC 158 (7.65) | >0.05 | AD 13.89 (2.00) MCI 23 (5.93 pg/mL) HC 10 (1.84) | 0.015 0.02 (MCI vs. HC) | AD 0.086 (0.013) MCI 0.161 (0.045) HC 0.071 (0.014) | 0.021 | ELISA |
| Cammarata et al., 2009 [78] | 293 | MCI (191), HC (102) | MCI 294.7 (20.86) HC 315.6 (23.64) | >0.05 | MCI 26.62 (2.68) HC 16.46 (1.46) | <0.01 | MCI 0.12 (0.02) HC 0.09 (0.01) | <0.01 | ELISA |
| Lui et al., 2010 [79] | 1032 | AD (186), MCI (122), HC (724) | AD 155.1 (44.2) MCI 152.9 (51.5) HC 153.4 (40.2) | 0.877 | AD 30.0 (10.2) MCI 30.2 (11.9) HC 32.4 (9.7) | <0.001 | AD 0.199 (0.056) MCI 0.216 (0.120) HC 0.221 (0.097) | 0.001 | ELISA |
| Konno et al., 2011 [80] | 49 | AD (39), HC (21) | AD 378 (113) HC 254 (63) | <0.0001 | - | - | - | - | ELISA |
| Han et al., 2012 [81] | 343 | AD (112), VD (85), other dementias—OD (30), HC (116) | AD 90.7 (8.7) VD 93.6 (12.3) OD 93.1 (11.0) HC 92.4 (13.0) | >0.05 | AD 32.1 (3.0) VD 37.3 (7.5) OD 37.2 (5.5) HC 37.7 (7.6) | <0.001 | AD 0.29 (0.07) VD 0.4 (0.09) OD 0.4 (0.08) HC 0.41 (0.09) | <0.001 | ELISA |
| Zhang et al., 2013 [82] | 326 | AD (153), VD (53), HC (120) | AD 97.7 (30.6) VD 98.2 (20.5) HC 92.6 (26.7) | >0.05 | AD 11.5 (2.9) VD 13.2 (3.1) HC 13.3 (3.7) | <0.001 (AD vs. HC) <0.01 (AD vs. VD) | AD 0.12 (0.03) VD 0.14 (0.02) HC 0.14 (0.01) | <0.001 (AD vs. HC, AD vs. VD) | ELISA |
| Huang et al., 2013 [83] | 34 | AD (18), MCI + HC (16) | - | - | AD 17.19 (21.9) MCI + HC 7.31 (5.3) | 0.079 | - | - | ELISA |
| Ruiz et al., 2013 [84] | 140 | AD (51), MCI (36), HC (53) | AD 51 (16) MCI 58.9 (16) HC 44.4 (14) | <0.002 | AD 10.8 (7.5) MCI 14 (18) HC 13 (12) | <0.002 (n/s) | - | - | ELISA |
| Wang et al., 2014 [85] | 273 | AD 97 MCI 54 HC 122 | AD 59.10 (20.30) MCI 51.66 (26.03) HC 43.14 (22.57) | MCI vs. HC 0.027 MCI vs. AD 0.063 AD vs. HC <0.001 | AD 47.10 (2.29) MCI 47.49 (0.93) HC 47.53 (1.97) | 0.944 MCI vs. HC 0.474 MCI vs. AD 0.468 AD vs. HC | - | - | ELISA |
| Tzikas et al., 2014 [86] | 55 | AD (28), HC (27) | AD 39.65 (8.08) HC 36.30 (6.68) | 0.171 | AD 3.38 (2.34) HC 3.39 (2.64) | 0.849 | - | - | ELISA |
| Krishnan et al., 2014 [87] | 105 | AD (30), VD (35), HC (40) | - | - | AD 164.66 (66.76) VD 148.17 (60.24) HC 86.10 (43.75) | <0.001 (AD vs. HC, VD vs. HC) >0.05 (AD vs. VD) | - | - | ELISA |
| Kleinschmidt et al., 2015 [88] | 94 | AD (15), MCI (14), HC 18–30 years (13), HC 40–65 (13), HC 66–85 (19) | HC 66–85 > AD > HC 40–65 > MCI > HC 18–30 | <0.05 for AD vs. MCI <0.01 for MCI vs. HC 66–85 | HC 66–85 > HC 18-30 > HC 40–65 > AD > MCI | <0.05 for AD vs. HC 66-85 and MCI vs. HC 66-85 | HC 18-30 > HC 40–65 > HC 66–85 > MCI > AD | <0.01 (AD vs. HC 66–85) <0.05 (MCI vs. HC 66–85) | ELISA |
| Jiao et al., 2015 [89] | 285 | AD (156), HC (129) | AD 86.2 (55.5) HC 60.2 (34.7) | <0.001 | AD 68.4 (61.9) HC 49.3 (27.7) | 0.001 | - | - | ELISA |
| Igarashi et al., 2015 [90] | 153 | AD (70), MCI (50), HC (33) | Median AD 51.0 pmol/L MCI 50.0 HC 51.4 | >0.05 | Median AD 6.4 pmol/L MCI 6.2 HC 6.9 | >0.05 | Median Aβ40/42 AD 8.2 MCI 7.8 HC 6.9 | 0.01 (AD vs. HC) <0.05 (MCI vs. HC) | ELISA |
| Kim et al., 2015 [91] | 146 | AD (100), HC (46) | AD 58.7 (20.2) HC 54.2(25.0) | 0.371 | AD 9.0 (4.0) HC 10.4 (3.5) | 0.003 | Aβ40/42 AD 6.8 (2.1) HC 5.0 (1.7) | 0.000 | ELISA |
| Poljak et al., 2016 [92] | 251 | AD (39), MCI (93), HC (129) | AD 155.82 (75.11) MCI 233.64 (100.56) HC 254.85 (145.72) | AD vs. HC p < 0.001 MCI vs. HC p = 0.14 | AD 18.34 (32.10) MCI 37.58 (74.38) HC 65.63 (217.04) | <0.001 (AD vs. HC) 0.005 (MCI vs. HC) | AD 0.20 (0.64) MCI 0.23 (0.49) HC 0.26 (0.59) | <0.001 (AD vs. HC) 0.019 (MCI vs. HC) | ELISA |
| Grewal et al., 2016 [93] | 75 | 3 groups of 15 (aMCI) and 10 (HC) women of different races | LA aMCI 127.63 (23.76) CA aMCI 160.51 (25.91) AA aMCI 106.28 (9.57) LA HC 104.81 (18.66) CA HC 96.02 (20.24) AA HC 103.33 (14.77) | LA p < 0.05 CA p = 0.0001 all groups p = 0.0001 | LA aMCI 40.38 (4.76) CA aMCI 33.21 (2.81) AA aMCI 26.48 (2.61) LA HC 23.69 (2.34) C HC 34.82 (4.00) AA HC 26.95 (4.05) | <0.005 (LA) >0.05 (CA, AA) | LA aMCI 0.3 (0.05) C aMCI 0.16 (0.01) AA aMCI 0.41 (0.19) LA HC 0.4 (0.31) C HC 0.46 (0.09) AA HC 0.3 (0.05) | >0.05 | ELISA |
| Yamashita et al., 2016 [94] | 36 | AD (18), HC (18) | AD 103.6 (11.8) fmol/mL HC 81.2 (9.8) | >0.05 | AD 25.0 (5.3) HC 18.5 (2.8) | >0.05 | AD 0.3 (0.1) HC 0.3 (0.0) | >0.05 | ELISA |
| Rani et al., 2017 [95] | 90 | AD (45), HC (45) | - | - | AD 174.87 (62.15) HC 90.62 (42.35) | <0.001 | - | - | ELISA |
| Sun et al., 2018 [96] | 137 | AD (76), HC (61) | AD 215.25 (54.26) HC 144.62 (47.20) | <0.001 | AD 123.48 (45.89) HC 91.35 (36.39) | <0.001 | - | - | ELISA |
| Chen et al., 2018 [97] | 126 | AD (96), HC (30) | AD 649.68 (132.21) HC 423.52 (100.99) | <0.001 | AD 322.25 (76.04) HC 219.21 (62.51) | <0.001 | Aβ40/42 AD 2.13 (0.66) HC 2.15 (0.95) | >0.05 | ELISA |
| Bibl et al., 2007 [65] | 85 | AD (15), AD-CVD (20), VD (15), PD/PDD (20), HC (15) | AD 0.199 (0.099) AD-CVD 0.197 (0.083) VD 0.270 (0.103) PD/PDD 0.185 (0.069) HC 0.209 (0.087) | <0.05 (VD vs. HC) remaining p > 0.05 | AD 0.022 (0.007) AD-CVD 0.023 (0.013) VD 0.022 (0.008) PD/PDD 0.023 (0.007) HC 0.025 (0.007) | >0.05 | - | - | immunoblot |
| Le Bastard et al., 2009 [98] | 162 | AD (48), non-AD (46), MCI (39), HC (29) | - | - | AD 40.5 (32.8–50.9) non-AD 42.1 (33.1–48.6) MCI 44.3 (38.3–55.8) HC 38.9 (31.0–46.1) | 0.174 | - | - | xMAP |
| Le Bastard et al., 2010 [99] | 147 | AD (50), non-AD (50), HC (47) | AD 306.8 (268.7–336.8) non-AD 292.7 (238.9–334.9) HC 284.8 (240.6–333.6) | 0.347 | AD 40.4 (32.1–50.8) non-AD 41.7 (33.4–48.0) HC 39.4 (29.4–46.7) | 0.506 | AD 0.135 (0.110–0.160) non-AD 0.152 (0.122–0.185) HC 0.137 (0.111–0.153) | 0.056 | xMAP |
| Sundelöf et al., 2010 [100] | 213 | AD (101), MCI (84), HC (28) | AD 145.9 (64.3) MCI 166.8 (57.1) HC 91.9 (28.5) | <0.05 (AD vs. HC and MCI vs. HC) | AD 28.5 (10.7 MCI 36.9 (11.7) HC 22.0 (9.2) | <0.05 (AD vs. HC and MCI vs. HC) | - | - | xMAP |
| Chou et al., 2016 [101] | 781 | AD (592), MCI (119), HC (170) | AD 173.1 (79.3) MCI 178.7 (54.6) HC 171.6 (64.3) | 0.807 (AD vs. MCI) 0.318 (AD vs. HC) | AD 23.8 (15.1) MCI 23.6 (12.5) HC 23.7 (12.6) | 0.899 (AD vs. MCI) 0.969 (MCI vs. HC) | AD 0.15 (0.25) MCI 0.14 (0.07) HC 0.15 (0.08) | 0.904 (AD vs. HC) 0.189 (MCI vs. HC) | xMAP |
| Hsu et al., 2017 [102] | 335 | AD (177), MCI (60), HC (108) | AD 170.3 (63.9) MCI 171.1 (54.5) HC 143.7 (34.9) | 0.0001 (AD vs. HC) 0.0013 (MCI vs. HC) | AD 37.2 (14.1) MCI 34.9 (9.5) HC 33.6 (10.2) | 0.025 (AD vs. HC) 0.38 (MCI vs. HC) | AD 0.232 (0.095) MCI 0.210 (0.06) HC 0.239 (0.064) | 0.14 (AD vs. HC) 0.0032 (MCI vs. HC) | xMAP |
| Hanon et al., 2018 [103] | 1040 | AD (501), aMCI (417), naMCI (122) | AD 263 (80) aMCI 269 (68) naMCI 272 (52) | 0.04 | AD 36.9 (11.7) aMCI 38.2 (11.9) naMCI 39.7 (10.5) | 0.01 | - | - | xMAP |
| Uslu et al., 2012 [104] | 60 | AD (18), MCI (16), HC (26) | AD 53.21 (34.69) MCI 47.98 (16.20) HC 65.84 (13.47) | >0.05 | AD 34.22 (31.62) MCI 22.66 (20.83) HC 15.79 (0.56) | 0.001 (AD vs. HC) | AD 0.6906 (0.3363) MCI 0.4502 (0.1864) HC 0.2464 (0.0370) | <0.001 (AD vs. HC and MCI vs. HC) | IMR |
| Chiu et al., 2012 [105] | 60 | AD (18), MCI (16), HC (26) | AD 53.21 (34.69) MCI 47.98 ± 16.20 HC 65.84 (13.47) | >0.05 | AD 34.22 (31.62) MCI 22.66 (20.83) HC 15.79 (0.56) | 0.001 (AD vs. HC) | AD 0.6906 (0.3363) MCI 0.4502 (0.1864) HC 0.2464 (0.0370) | AD vs. MCI p < 0.001 MCI vs. HC p < 0.0001 | IMR |
| Tzen et al., 2014 [106] | 45 | AD (14), MCI (11), HC (20) | AD 36.9 (1.6) MCI 41.4 (1.8) HC 60.9 (6.4) | <0.001 | AD 18.9 (0.3) MCI 17.2 (0.3) HC 15.9 (0.3) | <0.001 | AD 0.52 (0.07) MCI 0.42 (0.07) HC 0.26 (0.03) | <0.001 | IMR |
| Lee et al., 2017 [107] | 140 | AD (62), HC (78) | AD 43.9 (22.1) HC 61.1 (6.3) and 60.7 (6.9) | <0.001 | AD 23.2 (18.4) HC 15.8 (0.3) and 16.0 (0.5) | <0.001 | AD 0.55 (0.23) HC 0.26 (0.03) and 0.27 (0.04) | <0.001 | IMR |
| Teunissen et al., 2018 [108] | 106 | AD 63 HC 43 | AD 17.9 (4.3) HC 15.5 (2.1) | <0.001 | - | - | - | - | IMR |
| Tang et al., 2018 [109] | 79 | AD (21), VD (34), HC (24) | HC >VD >AD | 0.01 (AD vs. HC) <0.01 (VD vs. HC) | AD > VD > HC | <0.05 (AD vs. HC) <0.01 (AD vs. VD) <0.05 (VD vs. HC) | - | - | IMR |
| Fan et al., 2018 [110] | 80 | AD (16), MCI (25), HC (39) | AD 39.5 (5.8) MCI 41.5 (3.9) HC 59.2 (11.1) | <0.001 (AD vs. HC, MCI vs. HC) | AD 19.0 (2.7) MCI 17.0 (2.0) HC 16.1 (1.8) | <0.001 (AD vs. MCI, MCI vs. HC) | - | - | IMR |
| Tsai et al., 2019 [111] | 90 | AD (37), MCI (40), HC (13) | AD 51.7 (3.7) MCI 51.9 (4.9) HC 51.8 (5.1) | >0.05 | AD 17.4 (1.0) MCI 17.0 (0.7) HC 16.7 (0.7) | <0.05 (AD + MCI vs. HC) | AD 0.338 (0.032) MCI 0.330 (0.035) HC 0.326 (0.035) | >0.05 | IMR |
| Startin et al., 2019 [28] | 54 | AD (27), HC (27) | AD 160.80 (43.60–420.00) HC 144.40 (26.88–355.60) | 0.506 | AD 13.32 (4.28–18.84) HC 14.76 (2.00–45.62) | 0.710 | AD 0.08 (0.04–0.11) HC 0.10 (0.07–0.17) | <0.001 | Simoa |
| Janelidze et al., 2016 [112] | AD (57), MCI (214), HC (274) | AD 244.3 (105.8) MCI 287.6 (77.0) HC 276.7 (66.1) | <0.001 (AD vs. HC) <0.0001 (AD vs. MCI) | AD 13.2 (7.3) MCI 18.8 (6.1) HC 19.6 (5.2) | <0.0001 (AD vs. HC) <0.0001 (AD vs. MCI) | AD 0.057 (0.022) MCI 0.066 (0.015) HC 0.073 (0.023) | 0.0001 (AD vs. HC) 0.002 (MCI vs. HC) 0.003 (AD vs. MCI) | Simoa | |
| Shi et al., 2009 [113] | 155 | MCI (68), HC (87) | MCI 157.65 (64.50) HC 183.76 (61.87) | 0.011 | MCI 5.95 (2.60) HC 8.14 (3.12) | 0.000 | - | - | Simoa |
| Kim et al., 2020 [66] | 40 | AD (20), HC (20) | AD 184 (67.8) HC 159 (78.0) | 0.26 | AD 6.49 (5.02) HC 19.3 (15.5) | <0.001 | AD median approx. 0.1 HC median approx. 0.05 (from the graph) | <0.000001 | CNT |
| Study | N | Groups (n) | Tau Concentration in Serum (SD or CI) [pg/mL] | p | Method |
|---|---|---|---|---|---|
| Chiu et al., 2014 [116] | 60 | AD (10), MCI (20), HC (30) | AD 53.9 (11.7) MCI 32.7 (5.8) HC 15.6 (6.9) | <0.01 (MCI vs. AD) >0.05 (MCI vs. HC) | IMR |
| Tzen et al., 2014 [106] | 45 | AD (14), MCI (11), HC (20) | AD 46.7 (2.0) MCI 33.5 (2.2) HC 13.5 (5.5) | <0.001 | IMR |
| Lee et al., 2017 [107] | 140 | AD (62), HC (78) | AD 47.5 (18.9) HC 15.0 (7.3) and 14.9 (5.5) | <0.001 | IMR |
| Tang et al., 2018 [109] | 79 | AD (21), VD (34), HC (24) | AD > VD > HC | <0.001 (AD vs. HC) <0.01 (AD vs. VD) <0.05 (VD vs. HC) | IMR |
| Yang et al., 2018 [117] | 73 | AD (21), MCI (29), HC (23) | AD 37.54 (12.29) MCI 32.98 (10.18) HC 18.85 (10.16) | < 0.001 (AD vs. HC + MCI) >0.05 (MCI vs. HC) | IMR |
| Tsai et al., 2019 [111] | 90 | AD (37), MCI (40), HC (13) | AD 27.1 (4.8) MCI 24.5 (4.0) HC 22.5 (3.4) | <0.05 | IMR |
| Wang et al., 2014 [85] | 273 | AD (97), MCI (54), HC (122) | AD 213.95 (44.57) MCI 209.61 (39.65) HC 214.94 (43.23) | 0.457 (MCI vs. HC) remaining comparisons p > 0.05 | ELISA |
| Krishnan et al., 2014 [87] | 105 | AD (30), VD (35), HC (40) | AD 458.62 (253.82) VD 718.3 (326.24) HC 879.19 (389.53) | <0.05 (AD vs. VD) <0.001 (AD vs. HC) | ELISA |
| Jiao et al., 2015 [89] | 285 | AD (156), HC (129) | AD 227.1 (102.2) HC 181.0 (103.2) | <0.001 | ELISA |
| Shekhar et al., 2016 [118] | 113 | AD (39), MCI (37), HC (37) | AD 47.49 (9.00) MCI 39.26 (7.78) HC 34.92 (6.58) | <0.001 (AD vs. HC) <0.001 (AD vs. MCI) 0.059 (MCI vs. HC) | ELISA |
| Rani et al., 2017 [95] | 90 | AD (45), HC (45) | AD 451.76 (240.82) HC 836.93 (369.31) | <0.001 | ELISA |
| Jiang et al., 2019 [119] | 238 | AD (110), HC (128) | AD 26.14 (11.52) HC 15.02 (9.04) | <0.001 | ELISA |
| Dage et al., 2016 [120] | 439 | MCI (161), HC (378) | MCI 4.34 HC 4.14 | 0.078 | Simoa |
| Mattson et al., 2016 [114] | 563 + 547 (two cohorts) | I: AD (179), MCI (195), HC (189), II: AD (61), MCI (212), HC (274) | AD 3.12 (1.50) and 5.37 (2.56) MCI 2.71 (1.32) and 5.46 (2.71) HC 2.58 (1.19) and 5.58 (2.51) | 0.0017 and 0.58 (AD vs. MCI + HC) | Simoa |
| Mielke et al., 2017 [121] | 458 | MCI (123) HC (335) | MCI 4.5 (1.8) HC 4.2 (1.5) | 0.28 | Simoa |
| Deters et al., 2017 [122] | 508 | AD (168), MCI (174), HC (166) | AD 3.13 (1.3) MCI 2.81 (1.2) HC 2.71 (1) | 0.002 (AD vs. MCI + HC) | Simoa |
| Mielke et al., 2018 [39] | 267 | AD (40), MCI (57), HC (172) | AD 7.2 (2.8) MCI 5.9 (2.8) HC 5.9 (1.9) | 0.029 (AD vs. MCI) 0.001 (AD vs. HC) >0.05 (MCI vs. HC) | Simoa |
| Foiani et al., 2018 [115] | 176 | BvFTD (71), PPA (83), HC (22) | BvFTD 1.96 (1.07) PPA 2.65 (2.15) HC 1.67 (0.50) | <0.05 (FTD vs. HC) | Simoa |
| Shi et al., 2019 [113] | 155 | MCI (68), HC (87) | MCI 3.71 (2.3) HC 3.56 (1.84) | 0.865 | Simoa |
| Kim et al., 2020 [66] | 40 | AD (20), HC (20) | AD 32.2 (16.4) HC 13.4 (13.2) | <0.001 | CNT |
| Study | N | Groups (n) | T-tau/Aβ42 (SD/CI) | p | Method |
|---|---|---|---|---|---|
| Krishnan et al., 2014 [87] | 105 | AD (30), VD (35), HC (40) | AD 3.42 (2.66) VD 5.76 (3.84) HC 15.06 (10.64) | <0.05 (AD vs. VD) <0.001 (AD vs. HC and VD vs. HC) | ELISA |
| Rani et al., 2017 [95] | 90 | AD (45), HC (45) | AD 3.08 (2.35) HC 13.36 (4.42) | <0.001 | ELISA |
| Startin et al., 2019 [28] | 54 | AD (27), HC (27) | AD 10.23 (0.77-52) HC 10.59 (1.14–82.25) | >0.05 | Simoa |
| Kim et al., 2020 [66] | 40 | AD (20), HC (20) | AD median about 5.5 HC median 2 (read from the figure) | <0.000001 | CNT |
| Study | N | Groups (n) | YKL-40 Concentration in Serum (SD or CI) [ng/mL] | p | Method |
|---|---|---|---|---|---|
| Craig-Schapiro et al., 2010 [45] | 237 | AD (CDR1 and CDR0.5), HC | AD (CDR1): 91.9 (15) AD (CDR 0.5): 81.1 (8) HC (CDR 0): 62.5 (3.4) | 0.031 (AD CDR1 vs. HC) 0.046 (AD CDR0.5 vs. AD) | ELISA |
| Choi et al., 2011 [124] | 141 | AD (61), MCI (41), HC (35) | AD: 376.86 (54.1) MCI:176.49 (25.69) HC: 96.91 (11.02) | 0.014 (AD vs. HC) 0.008 (AD vs. MCI) | ELISA |
| Grewal et al., 2016 [93] | 75 | 15 (aMCI) and 10 (HC) women of white race (CA), Afro-Americans (AA) and people of Latino origin (LA) | LA aMCI 114.08 (30.02) CA aMCI 93.39 (12.70) AA aMCI 54.26 (10.12) LA HC 54.2 (8.37) CA HC 70.92 (15.96) AA HC 54.66 (14.42) | 0.033 (LA) 0.418 (CA) 0.988 (AA) | ELISA |
| Surendranatan et al., 2018 [125] | 35 | DLB (19), HC (16) | DLB 64.150 (46.616) HC 43.034 (28.357) | 0.115 | ELISA |
| Villar-Pique et al., 2019 [126] | 315 | CJD (78), AD (50), DLB (34), FTD (17), VD (22), ND (44), HC (70) | DLB: 167 (157) CJD: 189 (167) FTD: 125 (108) VD: 140 (150) AD: 133 (110) ND: 95 (61) HC: 84 (84) | <0.001 (CJD vs. HC) remaining p > 0.05 | ELISA |
Publisher’s Note: MDPI stays neutral with regard to jurisdictional claims in published maps and institutional affiliations. |
© 2020 by the authors. Licensee MDPI, Basel, Switzerland. This article is an open access article distributed under the terms and conditions of the Creative Commons Attribution (CC BY) license (http://creativecommons.org/licenses/by/4.0/).
Share and Cite
Wilczyńska, K.; Waszkiewicz, N. Diagnostic Utility of Selected Serum Dementia Biomarkers: Amyloid β-40, Amyloid β-42, Tau Protein, and YKL-40: A Review. J. Clin. Med. 2020, 9, 3452. https://doi.org/10.3390/jcm9113452
Wilczyńska K, Waszkiewicz N. Diagnostic Utility of Selected Serum Dementia Biomarkers: Amyloid β-40, Amyloid β-42, Tau Protein, and YKL-40: A Review. Journal of Clinical Medicine. 2020; 9(11):3452. https://doi.org/10.3390/jcm9113452
Chicago/Turabian StyleWilczyńska, Karolina, and Napoleon Waszkiewicz. 2020. "Diagnostic Utility of Selected Serum Dementia Biomarkers: Amyloid β-40, Amyloid β-42, Tau Protein, and YKL-40: A Review" Journal of Clinical Medicine 9, no. 11: 3452. https://doi.org/10.3390/jcm9113452
APA StyleWilczyńska, K., & Waszkiewicz, N. (2020). Diagnostic Utility of Selected Serum Dementia Biomarkers: Amyloid β-40, Amyloid β-42, Tau Protein, and YKL-40: A Review. Journal of Clinical Medicine, 9(11), 3452. https://doi.org/10.3390/jcm9113452