Resting Energy Expenditure and Body Composition in Overweight Men and Women Living in a Temperate Climate

 , ,
, ,  , , , , , ,
  and
and
Abstract
1. Introduction
2. Material and Methods
2.1. Patients
2.2. General Procedures
2.3. Resting Metabolic Rate
2.4. Physical Activity
2.5. Statistical Analysis
3. Results
4. Discussion
5. Conclusions
Supplementary Materials
Author Contributions
Funding
Acknowledgments
Conflicts of Interest
References
- Redman, L.M.; Kraus, W.E.; Bhapkar, M.; Das, S.K.; Racette, S.B.; Martin, C.K.; Fontana, L.; Wong, W.W.; Roberts, S.B.; Ravussin, E. Energy requirements in nonobese men and women: Results from calerie. Am. J. Clin. Nutr. 2014, 99, 71–78. [Google Scholar] [PubMed]
- Frankenfield, D.; Roth-Yousey, L.; Compher, C. Comparison of predictive equations for resting metabolic rate in healthy nonobese and obese adults: A systematic review. J. Am. Diet. Assoc. 2005, 105, 775–789. [Google Scholar] [CrossRef] [PubMed]
- Schofield, W.N. Predicting basal metabolic rate, new standards and review of previous work. Hum. Nutr. Clin. Nutr. 1985, 39 (Suppl. 1), 5–41. [Google Scholar]
- Frankenfield, D.C.; Muth, E.R.; Rowe, W.A. The harris-benedict studies of human basal metabolism: History and limitations. J. Am. Diet. Assoc. 1998, 98, 439–445. [Google Scholar] [CrossRef]
- Henry, C.J.; Rees, D.G. New predictive equations for the estimation of basal metabolic rate in tropical peoples. Eur. J. Clin. Nutr. 1991, 45, 177–185. [Google Scholar] [PubMed]
- Roza, A.M.; Shizgal, H.M. The harris benedict equation reevaluated: Resting energy requirements and the body cell mass. Am. J. Clin. Nutr. 1984, 40, 168–182. [Google Scholar] [CrossRef] [PubMed]
- FAO; WHO; UNU. Human Energy Requirements: Report of a Joint FAO/WHO/UNU Expert Consultation. In FAO Food and Nutrition Technical Report Series; FAO: Rome, Italy, 2001; pp. 1–96. [Google Scholar]
- Mifflin, M.D.; St Jeor, S.T.; Hill, L.A.; Scott, B.J.; Daugherty, S.A.; Koh, Y.O. A new predictive equation for resting energy expenditure in healthy individuals. Am. J. Clin. Nutr. 1990, 51, 241–247. [Google Scholar] [CrossRef]
- Frankenfield, D.C.; Rowe, W.A.; Smith, J.S.; Cooney, R.N. Validation of several established equations for resting metabolic rate in obese and nonobese people. J. Am. Diet. Assoc. 2003, 103, 1152–1159. [Google Scholar] [CrossRef]
- Frankenfield, D.C. Bias and accuracy of resting metabolic rate equations in non-obese and obese adults. Clin. Nutr. 2013, 32, 976–982. [Google Scholar] [CrossRef]
- Cancello, R.; Soranna, D.; Brunani, A.; Scacchi, M.; Tagliaferri, A.; Mai, S.; Marzullo, P.; Zambon, A.; Invitti, C. Analysis of predictive equations for estimating resting energy expenditure in a large cohort of morbidly obese patients. Front. Endocrinol. 2018, 9, 367. [Google Scholar] [CrossRef]
- Rolfe, D.F.; Brown, G.C. Cellular energy utilization and molecular origin of standard metabolic rate in mammals. Physiol. Rev. 1997, 77, 731–758. [Google Scholar] [CrossRef] [PubMed]
- Arciero, P.J.; Goran, M.I.; Poehlman, E.T. Resting metabolic rate is lower in women than in men. J. Appl. Physiol. 1993, 75, 2514–2520. [Google Scholar] [CrossRef] [PubMed]
- Spaeth, A.M.; Dinges, D.F.; Goel, N. Resting metabolic rate varies by race and by sleep duration. Obesity 2015, 23, 2349–2356. [Google Scholar] [CrossRef] [PubMed]
- Klausen, B.; Toubro, S.; Astrup, A. Age and sex effects on energy expenditure. Am. J. Clin. Nutr. 1997, 65, 895–907. [Google Scholar] [CrossRef] [PubMed]
- Johannsen, D.L.; Knuth, N.D.; Huizenga, R.; Rood, J.C.; Ravussin, E.; Hall, K.D. Metabolic slowing with massive weight loss despite preservation of fat-free mass. J. Clin. Endocrinol. Metab. 2012, 97, 2489–2496. [Google Scholar] [CrossRef] [PubMed]
- Lonac, M.C.; Richards, J.C.; Schweder, M.M.; Johnson, T.K.; Bell, C. Influence of short-term consumption of the caffeine-free, epigallocatechin-3-gallate supplement, teavigo, on resting metabolism and the thermic effect of feeding. Obesity 2011, 19, 298–304. [Google Scholar] [CrossRef]
- Speakman, J.R.; Selman, C. Physical activity and resting metabolic rate. Proc. Nutr. Soc. 2003, 62, 621–634. [Google Scholar] [CrossRef]
- Haugen, H.A.; Melanson, E.L.; Tran, Z.V.; Kearney, J.T.; Hill, J.O. Variability of measured resting metabolic rate. Am. J. Clin. Nutr. 2003, 78, 1141–1145. [Google Scholar] [CrossRef]
- Creber, C.; Cooper, R.S.; Plange-Rhule, J.; Bovet, P.; Lambert, E.V.; Forrester, T.E.; Schoeller, D.; Riesen, W.; Korte, W.; Cao, G.; et al. Independent association of resting energy expenditure with blood pressure: Confirmation in populations of the african diaspora. BMC Cardiovasc. Disord. 2018, 18, 4. [Google Scholar] [CrossRef] [PubMed]
- Luke, A.; Adeyemo, A.; Kramer, H.; Forrester, T.; Cooper, R.S. Association between blood pressure and resting energy expenditure independent of body size. Hypertension 2004, 43, 555–560. [Google Scholar] [CrossRef]
- Huang, K.C.; Kormas, N.; Steinbeck, K.; Loughnan, G.; Caterson, I.D. Resting metabolic rate in severely obese diabetic and nondiabetic subjects. Obes. Res. 2004, 12, 840–845. [Google Scholar] [CrossRef] [PubMed]
- Lazzer, S.; Bedogni, G.; Lafortuna, C.L.; Marazzi, N.; Busti, C.; Galli, R.; De Col, A.; Agosti, F.; Sartorio, A. Relationship between basal metabolic rate, gender, age, and body composition in 8780 white obese subjects. Obesity 2010, 18, 71–78. [Google Scholar] [CrossRef] [PubMed]
- Muller, M.J.; Bosy-Westphal, A.; Kutzner, D.; Heller, M. Metabolically active components of fat-free mass and resting energy expenditure in humans: Recent lessons from imaging technologies. Obes. Rev. 2002, 3, 113–122. [Google Scholar] [CrossRef] [PubMed]
- Wang, Z.; Heshka, S.; Wang, J.; Gallagher, D.; Deurenberg, P.; Chen, Z.; Heymsfield, S.B. Metabolically active portion of fat-free mass: A cellular body composition level modeling analysis. Am. J. Physiol. Endocrinol. Metab. 2007, 292, E49–E53. [Google Scholar] [CrossRef]
- Lazzer, S.; Agosti, F.; Resnik, M.; Marazzi, N.; Mornati, D.; Sartorio, A. Prediction of resting energy expenditure in severely obese italian males. J. Endocrinol. Investig. 2007, 30, 754–761. [Google Scholar] [CrossRef] [PubMed]
- Lazzer, S.; Agosti, F.; Silvestri, P.; Derumeaux-Burel, H.; Sartorio, A. Prediction of resting energy expenditure in severely obese italian women. J. Endocrinol. Investig. 2007, 30, 20–27. [Google Scholar] [CrossRef] [PubMed]
- Karhunen, L.; Franssila-Kallunki, A.; Rissanen, A.; Kervinen, K.; Kesaniemi, Y.A.; Uusitupa, M. Determinants of resting energy expenditure in obese non-diabetic caucasian women. Int. J. Obes. Relat. Metab. Disord. 1997, 21, 197–202. [Google Scholar] [CrossRef]
- Muller, M.J.; Bosy-Westphal, A.; Klaus, S.; Kreymann, G.; Luhrmann, P.M.; Neuhauser-Berthold, M.; Noack, R.; Pirke, K.M.; Platte, P.; Selberg, O.; et al. World health organization equations have shortcomings for predicting resting energy expenditure in persons from a modern, affluent population: Generation of a new reference standard from a retrospective analysis of a german database of resting energy expenditure. Am. J. Clin. Nutr. 2004, 80, 1379–1390. [Google Scholar]
- Marra, M.; Cioffi, I.; Sammarco, R.; Montagnese, C.; Naccarato, M.; Amato, V.; Contaldo, F.; Pasanisi, F. Prediction and evaluation of resting energy expenditure in a large group of obese outpatients. Int. J. Obes. 2017, 41, 697–705. [Google Scholar] [CrossRef]
- Owen, O.E.; Holup, J.L.; D’Alessio, D.A.; Craig, E.S.; Polansky, M.; Smalley, K.J.; Kavle, E.C.; Bushman, M.C.; Owen, L.R.; Mozzoli, M.A.; et al. A reappraisal of the caloric requirements of men. Am. J. Clin. Nutr. 1987, 46, 875–885. [Google Scholar] [CrossRef]
- Johnstone, A.M.; Rance, K.A.; Murison, S.D.; Duncan, J.S.; Speakman, J.R. Additional anthropometric measures may improve the predictability of basal metabolic rate in adult subjects. Eur. J. Clin. Nutr. 2006, 60, 1437–1444. [Google Scholar] [CrossRef] [PubMed]
- Bernstein, R.S.; Thornton, J.C.; Yang, M.U.; Wang, J.; Redmond, A.M.; Pierson, R.N., Jr.; Pi-Sunyer, F.X.; Van Itallie, T.B. Prediction of the resting metabolic rate in obese patients. Am. J. Clin. Nutr. 1983, 37, 595–602. [Google Scholar] [CrossRef] [PubMed]
- Johnson, F.; Mavrogianni, A.; Ucci, M.; Vidal-Puig, A.; Wardle, J. Could increased time spent in a thermal comfort zone contribute to population increases in obesity? Obes. Rev. 2011, 12, 543–551. [Google Scholar] [CrossRef] [PubMed]
- Valdes, S.; Maldonado-Araque, C.; Garcia-Torres, F.; Goday, A.; Bosch-Comas, A.; Bordiu, E.; Calle-Pascual, A.; Carmena, R.; Casamitjana, R.; Castano, L.; et al. Ambient temperature and prevalence of obesity in the spanish population: The diabet.Es study. Obesity 2014, 22, 2328–2332. [Google Scholar] [CrossRef] [PubMed]
- Aranceta-Bartrina, J.; Perez-Rodrigo, C.; Alberdi-Aresti, G.; Ramos-Carrera, N.; Lazaro-Masedo, S. Prevalence of general obesity and abdominal obesity in the spanish adult population (aged 25–64 years) 2014–2015: The enpe study. Rev. Esp. Cardiol. 2016, 69, 579–587. [Google Scholar] [CrossRef] [PubMed]
- De Pablos-Velasco, P.L.; Martinez-Martin, F.J.; Rodriguez-Perez, F. Prevalence of obesity in a canarian community. Association with type 2 diabetes mellitus: The guia study. Eur. J. Clin. Nutr. 2002, 56, 557–560. [Google Scholar] [CrossRef]
- Gallus, S.; Lugo, A.; Murisic, B.; Bosetti, C.; Boffetta, P.; La Vecchia, C. Overweight and obesity in 16 european countries. Eur. J. Nutr. 2015, 54, 679–689. [Google Scholar] [CrossRef]
- Turner, J.B.; Kumar, A.; Koch, C.A. The effects of indoor and outdoor temperature on metabolic rate and adipose tissue—The Mississippi perspective on the obesity epidemic. Rev. Endocr. Metab. Disord. 2016, 17, 61–71. [Google Scholar] [CrossRef]
- Calbet, J.A.L.; Ponce-Gonzalez, J.G.; Calle-Herrero, J.; Perez-Suarez, I.; Martin-Rincon, M.; Santana, A.; Morales-Alamo, D.; Holmberg, H.C. Exercise preserves lean mass and performance during severe energy deficit: The role of exercise volume and dietary protein content. Front. Physiol. 2017, 8, 483. [Google Scholar] [CrossRef]
- Pickering, T.G.; Hall, J.E.; Appel, L.J.; Falkner, B.E.; Graves, J.; Hill, M.N.; Jones, D.W.; Kurtz, T.; Sheps, S.G.; Roccella, E.J. Recommendations for blood pressure measurement in humans and experimental animals: Part 1: Blood pressure measurement in humans: A statement for professionals from the subcommittee of professional and public education of the american heart association council on high blood pressure research. Hypertension 2005, 45, 142–161. [Google Scholar]
- Isbell, T.R.; Klesges, R.C.; Meyers, A.W.; Klesges, L.M. Measurement reliability and reactivity using repeated measurements of resting energy expenditure with a face mask, mouthpiece, and ventilated canopy. JPEN J. Parenter. Enter. Nutr. 1991, 15, 165–168. [Google Scholar] [CrossRef] [PubMed]
- Perez-Suarez, I.; Martin-Rincon, M.; Gonzalez-Henriquez, J.J.; Fezzardi, C.; Perez-Regalado, S.; Galvan-Alvarez, V.; Juan-Habib, J.W.; Morales-Alamo, D.; Calbet, J.A.L. Accuracy and precision of the cosmed k5 portable analyser. Front. Physiol. 2018, 9, 1764. [Google Scholar] [CrossRef] [PubMed]
- Peronnet, F.; Massicotte, D. Table of nonprotein respiratory quotient: An update. Can. J. Sport Sci. 1991, 16, 23–29. [Google Scholar] [PubMed]
- Lin, L.I. A concordance correlation coefficient to evaluate reproducibility. Biometrics 1989, 45, 255–268. [Google Scholar] [CrossRef] [PubMed]
- Harris, J.A.; Benedict, F.G. A biometric study of human basal metabolism. Proc. Natl. Acad. Sci. USA 1918, 4, 370–373. [Google Scholar] [CrossRef]
- Owen, O.E.; Kavle, E.; Owen, R.S.; Polansky, M.; Caprio, S.; Mozzoli, M.A.; Kendrick, Z.V.; Bushman, M.C.; Boden, G. A reappraisal of caloric requirements in healthy women. Am. J. Clin. Nutr. 1986, 44, 1–19. [Google Scholar] [CrossRef]
- FAO; WHO; UNU. Energy and Protein Requirements: Report of a Joint FAO/WHO/UNU Expert Consultation; World Health Organization technical report series; WHO: Geneva, Switzerland, 1985; Volume 724. [Google Scholar]
- Betz, M.J.; Enerback, S. Human brown adipose tissue: What we have learned so far. Diabetes 2015, 64, 2352–2360. [Google Scholar] [CrossRef]
- Blondin, D.P.; Tingelstad, H.C.; Mantha, O.L.; Gosselin, C.; Haman, F. Maintaining thermogenesis in cold exposed humans: Relying on multiple metabolic pathways. Compr. Physiol. 2014, 4, 1383–1402. [Google Scholar]
- Van der Lans, A.A.; Hoeks, J.; Brans, B.; Vijgen, G.H.; Visser, M.G.; Vosselman, M.J.; Hansen, J.; Jorgensen, J.A.; Wu, J.; Mottaghy, F.M.; et al. Cold acclimation recruits human brown fat and increases nonshivering thermogenesis. J. Clin. Investig. 2013, 123, 3395–3403. [Google Scholar] [CrossRef]
- Periasamy, M.; Maurya, S.K.; Sahoo, S.K.; Singh, S.; Sahoo, S.K.; Reis, F.C.G.; Bal, N.C. Role of serca pump in muscle thermogenesis and metabolism. Compr. Physiol. 2017, 7, 879–890. [Google Scholar]
- Ye, L.; Wu, J.; Cohen, P.; Kazak, L.; Khandekar, M.J.; Jedrychowski, M.P.; Zeng, X.; Gygi, S.P.; Spiegelman, B.M. Fat cells directly sense temperature to activate thermogenesis. Proc. Natl. Acad. Sci. USA 2013, 110, 12480–12485. [Google Scholar] [CrossRef]
- Davis, T.R.; Johnston, D.R. Seasonal acclimatization to cold in man. J. Appl. Physiol. 1961, 16, 231–234. [Google Scholar] [CrossRef] [PubMed]
- Livingston, E.H.; Kohlstadt, I. Simplified resting metabolic rate-predicting formulas for normal-sized and obese individuals. Obes. Res. 2005, 13, 1255–1262. [Google Scholar] [CrossRef] [PubMed]
- Johnstone, A.M.; Murison, S.D.; Duncan, J.S.; Rance, K.A.; Speakman, J.R. Factors influencing variation in basal metabolic rate include fat-free mass, fat mass, age, and circulating thyroxine but not sex, circulating leptin, or triiodothyronine. Am. J. Clin. Nutr. 2005, 82, 941–948. [Google Scholar] [CrossRef] [PubMed]
- Korth, O.; Bosy-Westphal, A.; Zschoche, P.; Gluer, C.C.; Heller, M.; Muller, M.J. Influence of methods used in body composition analysis on the prediction of resting energy expenditure. Eur. J. Clin. Nutr. 2007, 61, 582–589. [Google Scholar] [CrossRef]
- Robertson, J.D.; Reid, D.D. Standards for the basal metabolism of normal people in britain. Lancet 1952, 1, 940–943. [Google Scholar] [CrossRef]
- Cunningham, J.J. A reanalysis of the factors influencing basal metabolic rate in normal adults. Am. J. Clin. Nutr. 1980, 33, 2372–2374. [Google Scholar] [CrossRef]
- Daly, J.M.; Heymsfield, S.B.; Head, C.A.; Harvey, L.P.; Nixon, D.W.; Katzeff, H.; Grossman, G.D. Human energy requirements: Overestimation by widely used prediction equation. Am. J. Clin. Nutr. 1985, 42, 1170–1174. [Google Scholar] [CrossRef]
- Garrel, D.R.; Jobin, N.; de Jonge, L.H. Should we still use the harris and benedict equations? Nutr. Clin. Pract. 1996, 11, 99–103. [Google Scholar] [CrossRef]
- De Luis, D.A.; Aller, R.; Izaola, O.; Romero, E. Prediction equation of resting energy expenditure in an adult spanish population of obese adult population. Ann. Nutr. Metab. 2006, 50, 193–196. [Google Scholar] [CrossRef]
- Dobratz, J.R.; Sibley, S.D.; Beckman, T.R.; Valentine, B.J.; Kellogg, T.A.; Ikramuddin, S.; Earthman, C.P. Predicting energy expenditure in extremely obese women. JPEN J. Parenter. Enter. Nutr. 2007, 31, 217–227. [Google Scholar] [CrossRef] [PubMed]
- Carrasco, F.; Rojas, P.; Ruz, M.; Rebolledo, A.; Mizon, C.; Codoceo, J.; Inostroza, J.; Papapietro, K.; Csendes, A. Agreement between measured and calculated by predictive formulas resting energy expenditure in severe and morbid obese women. Nutr. Hosp. 2007, 22, 410–416. [Google Scholar] [PubMed]
- Weijs, P.J.; Vansant, G.A. Validity of predictive equations for resting energy expenditure in belgian normal weight to morbid obese women. Clin. Nutr. 2010, 29, 347–351. [Google Scholar] [CrossRef] [PubMed]
- Martin-Rincon, M.; Gonzalez-Henriquez, J.J.; Losa-Reyna, J.; Perez-Suarez, I.; Ponce-Gonzalez, J.G.; de La Calle-Herrero, J.; Perez-Valera, M.; Perez-Lopez, A.; Curtelin, D.; Cherouveim, E.D.; et al. Impact of data averaging strategies on vo2max assessment: Mathematical modeling and reliability. Scand. J. Med. Sci. Sports 2019, 29, 1473–1488. [Google Scholar] [CrossRef]


| Men (n = 88) | Women (n = 86) | p-Value | |||||||||
|---|---|---|---|---|---|---|---|---|---|---|---|
| Mean | ± | SD | Range | Mean | ± | SD | Range | ||||
| (Min-Max) | (Min-Max) | ||||||||||
| Age (years) | 40.8 | ± | 9.3 | 22.0 | 67.9 | 42.6 | ± | 10.4 | 19.8 | 65.2 | 0.231 |
| Weight (kg) | 105.2 | ± | 13.0 | 80.8 | 144.9 | 86.4 | ± | 10.5 | 70.8 | 135.1 | <0.001 |
| Height (cm) | 177.0 | ± | 6.5 | 161.1 | 190.4 | 162.3 | ± | 5.5 | 149.9 | 177.5 | <0.001 |
| BMI (kg m−2) | 33.5 | ± | 3.0 | 26.9 | 41.3 | 32.7 | ± | 2.9 | 27.7 | 45.4 | 0.086 |
| Body fat (%) | 37.0 | ± | 4.6 | 26.3 | 51.3 | 46.9 | ± | 3.7 | 38.9 | 56.1 | <0.001 |
| Total lean mass (kg) | 62.8 | ± | 8.0 | 48.1 | 89.7 | 43.2 | ± | 4.4 | 33.1 | 56.4 | <0.001 |
| Distance (km d−1) | 7.5 | ± | 3.3 | 1.4 | 19.1 | 6.8 | ± | 2.7 | 2.0 | 13.8 | 0.129 |
| Steps d−1 | 11,160 | ± | 3731 | 1767 | 24,044 | 11,491 | ± | 3455 | 5345 | 21,747 | 0.553 |
| Men | Women | Total | |
|---|---|---|---|
| Smokers a | 10 | 13 | 23 |
| Asthma b | 3 | 8 | 11 |
| Type 2 diabetes c | 6 | 4 | 10 |
| - Metformin | 4 | 2 | 6 |
| Hypertension | 21 | 23 | 44 |
| - Diuretics and ACE inhibitors or ARE blockers | 8 | 21 | 29 |
| - Betablockers | 3 | 4 | 7 |
| - Calcium channel blockers | 5 | 5 | 10 |
| Hypercholesterolemia | 24 | 14 | 38 |
| - Statins | 8 | 7 | 15 |
| - Fenofibrate | 1 | 1 | |
| Oral contraceptives | 9 | 9 | |
| Postmenopausal | 20 | 20 |
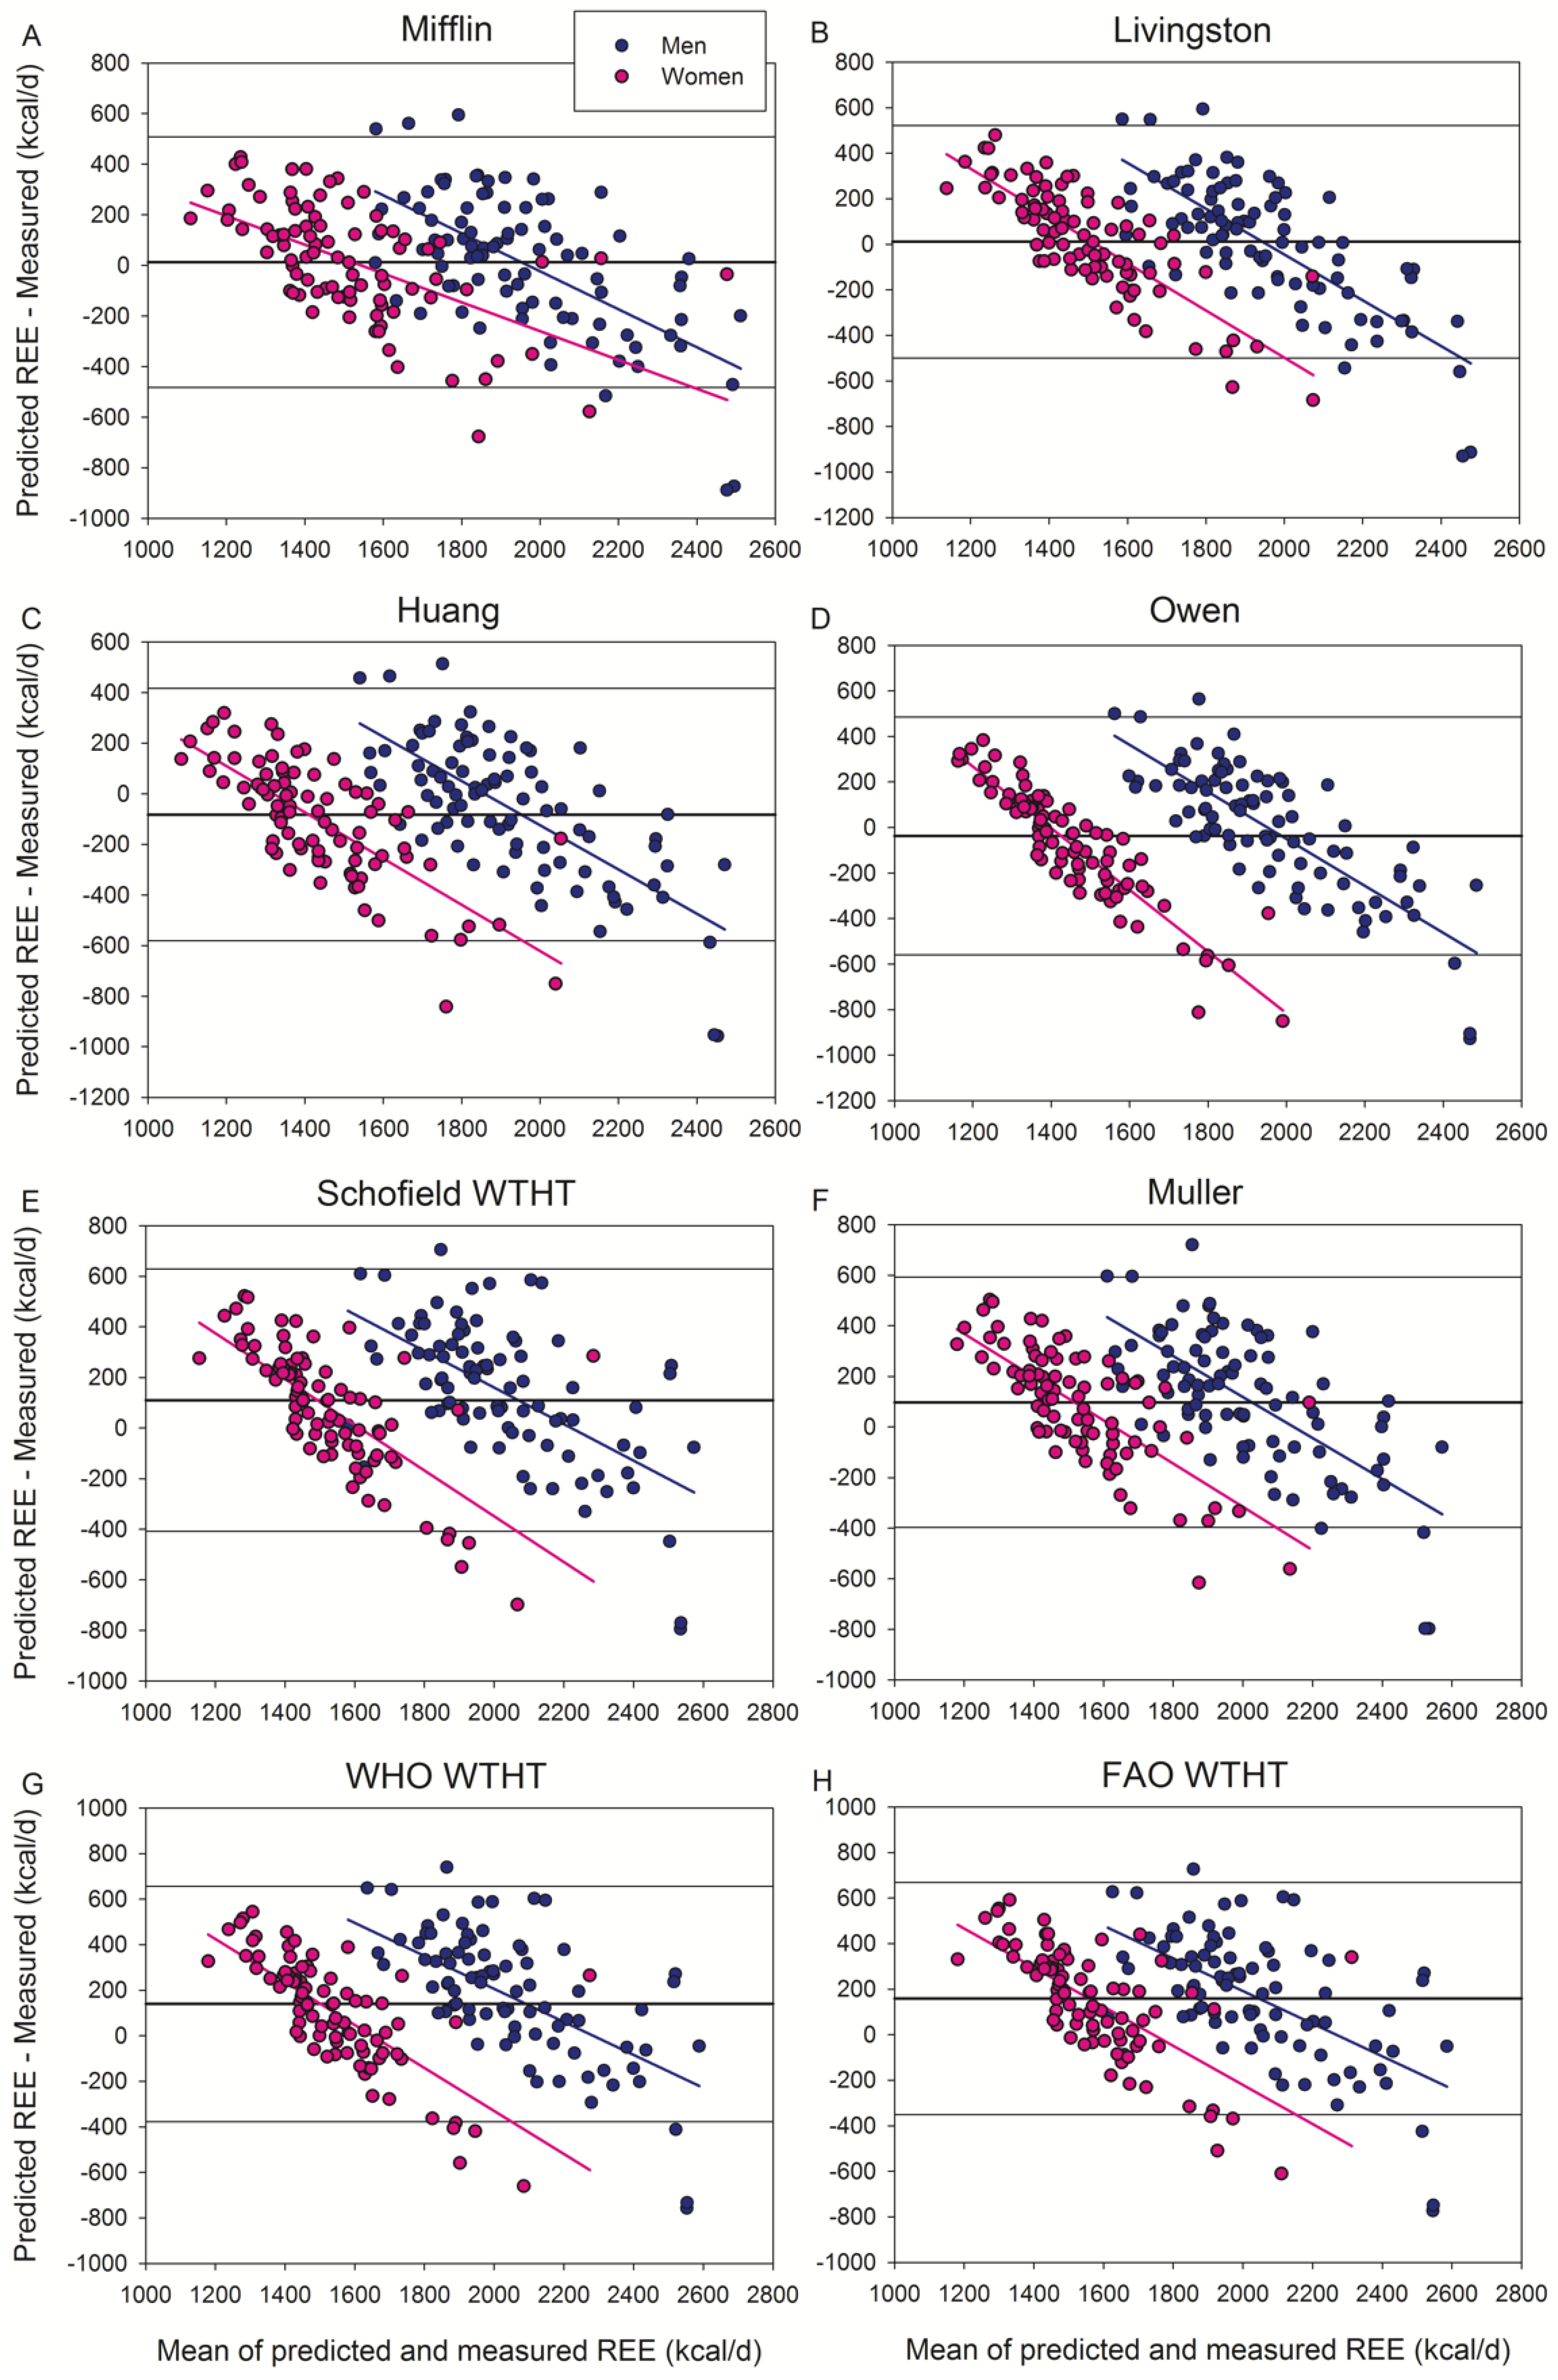
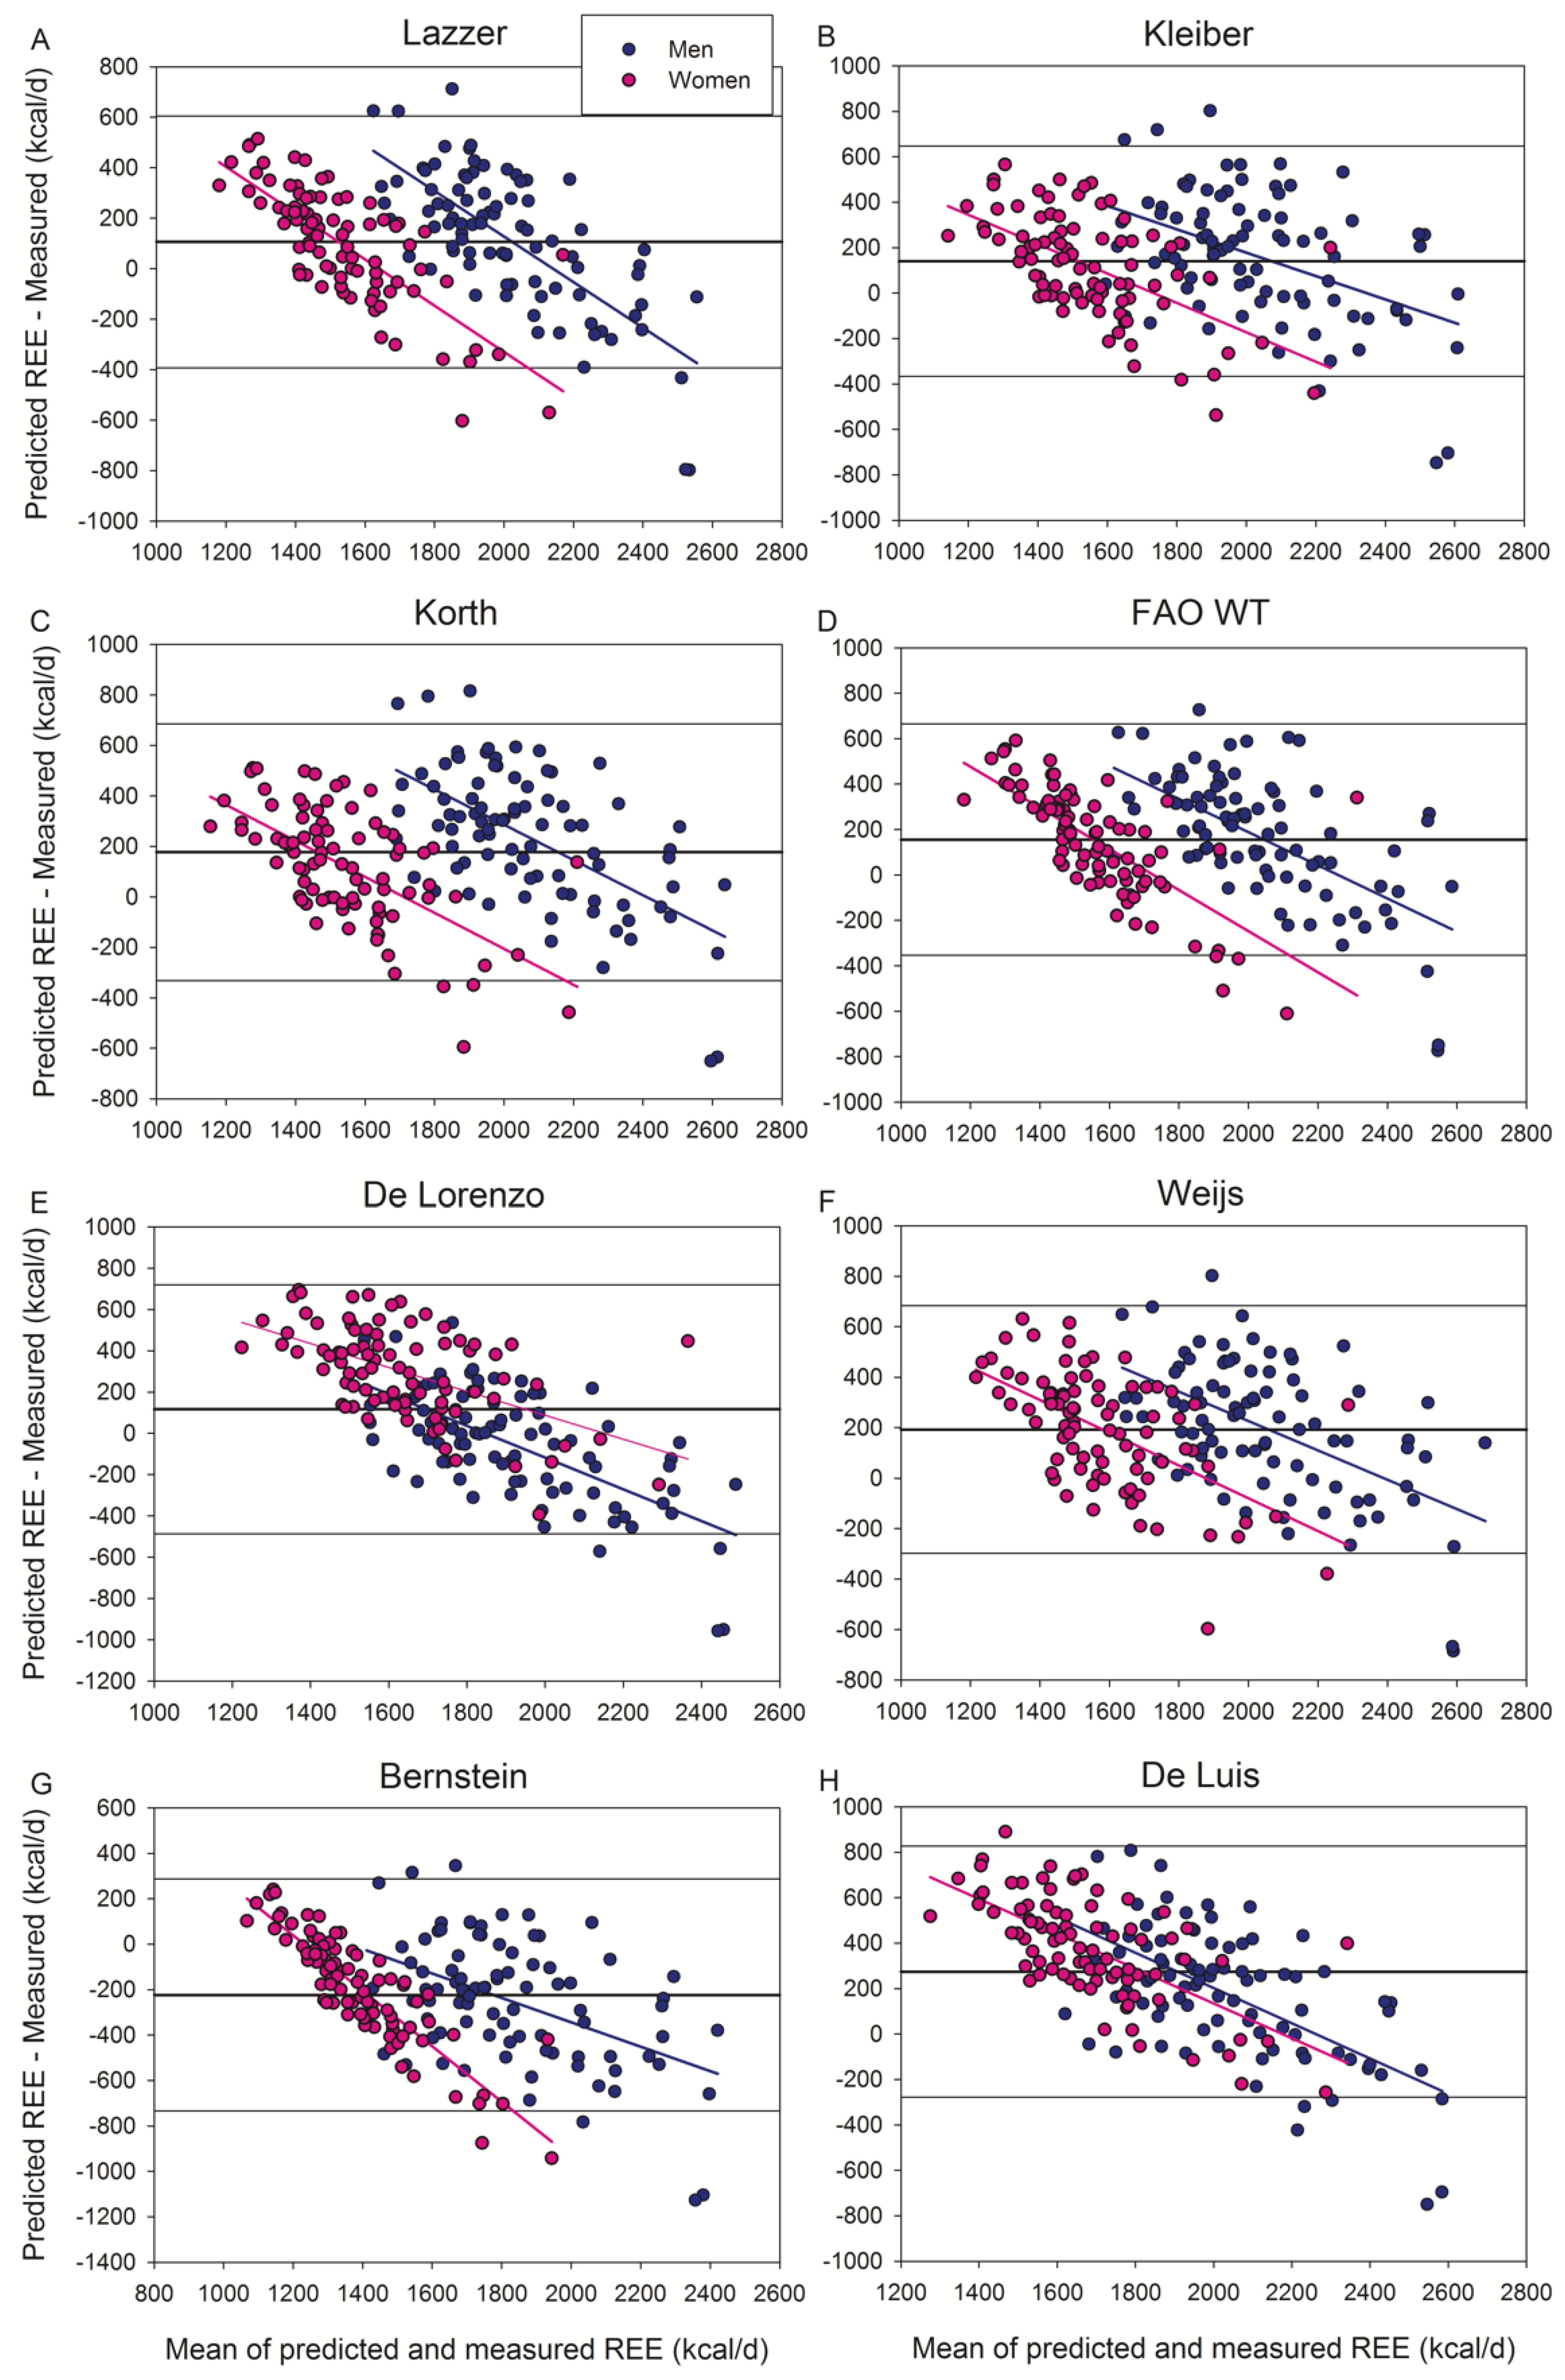
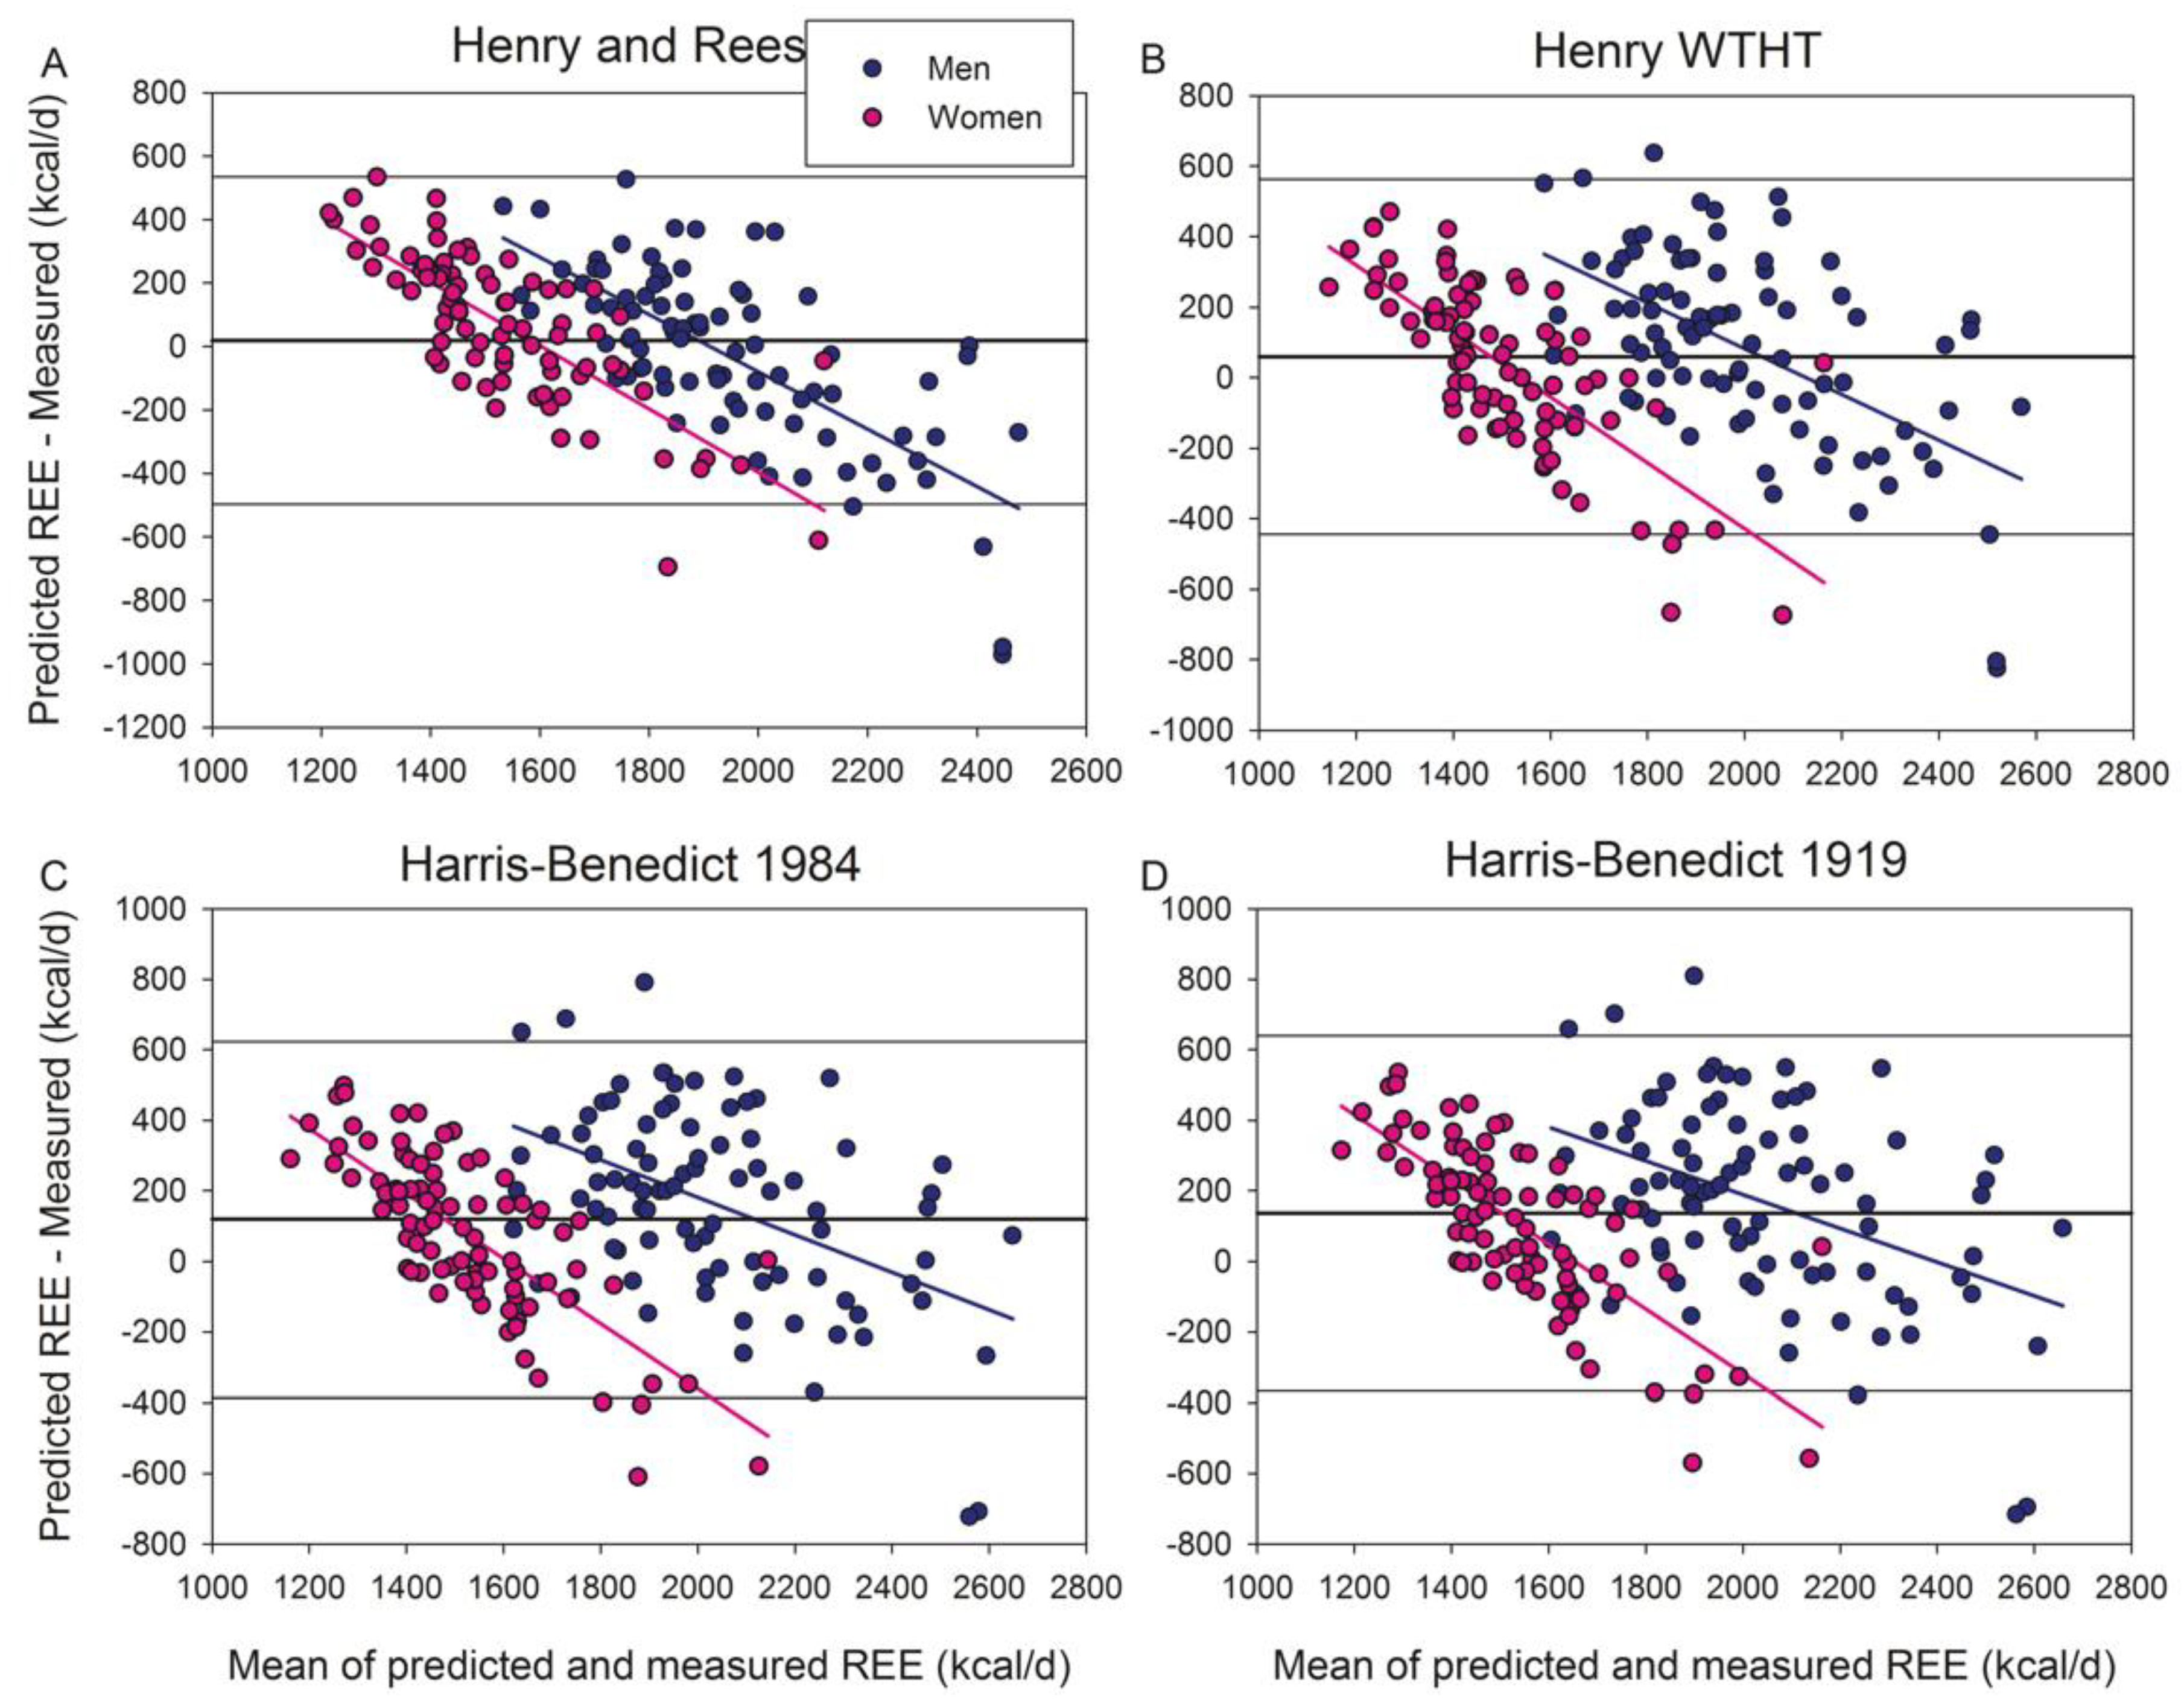
| REE (kcal/d) | t-Test | Bias | LLA | ULA | Bias | LLA | ULA | Maximal Error | Prediction | |||||||
|---|---|---|---|---|---|---|---|---|---|---|---|---|---|---|---|---|
| Equation | Mean | SD | RMSD | p-Value | kcal/d | kcal/d | kcal/d | % | % | % | Under % | Over % | CCC | Accurate % | Under % | Over % |
| REE Measured | 1727 | 389 | 100 | |||||||||||||
| Mifflin | 1737 | 282 | 252 | 0.51 | 12.8 | −483 | 508 | 0.7 | −27.3 | 28.8 | −37 | 35 | 0.72 | 51.1 | 20.1 | 28.7 |
| Livingston | 1735 | 257 | 261 | 0.59 | 10.7 | −501 | 522 | 0.6 | −28.2 | 29.5 | −38 | 38 | 0.68 | 51.1 | 18.4 | 30.5 |
| Henry WTHT | 1784 | 307 | 263 | 0.003 | 59.3 | −444 | 563 | 3.4 | −25.0 | 31.9 | −36 | 37 | 0.72 | 50.6 | 13.8 | 35.6 |
| Henry and Rees * | 1752 | 228 | 265 | 0.35 | 19.1 | −497 | 535 | 1.1 | −28.0 | 30.2 | −40 | 41 | 0.65 | 48.5 | 18.9 | 32.5 |
| Huang | 1642 | 294 | 267 | 0.000 | −82.1 | −581 | 417 | −4.8 | −33.0 | 23.5 | −48 | 30 | 0.71 | 47.7 | 34.5 | 17.8 |
| Owen | 1687 | 290 | 268 | 0.07 | −37.3 | −560 | 485 | −2.2 | −31.8 | 27.5 | −46 | 32 | 0.69 | 47.7 | 28.2 | 24.1 |
| Schofield WTHT | 1835 | 310 | 286 | 0.000 | 110.5 | −408 | 629 | 6.4 | −22.7 | 35.5 | −34 | 41 | 0.68 | 45.4 | 10.3 | 44.3 |
| Muller | 1822 | 289 | 270 | 0.000 | 97.9 | −397 | 593 | 5.7 | −22.3 | 33.7 | −33 | 39 | 0.70 | 44.8 | 11.5 | 43.7 |
| H–B 1984 | 1844 | 329 | 283 | 0.000 | 119.4 | −386 | 624 | 6.9 | −21.4 | 35.2 | −32 | 42 | 0.70 | 44.3 | 9.2 | 46.6 |
| H–B 1919 | 1861 | 324 | 291 | 0.000 | 136.8 | −368 | 641 | 7.9 | −20.4 | 36.3 | −30 | 43 | 0.69 | 44.3 | 7.5 | 48.3 |
| Lazzer 2010 | 1830 | 281 | 275 | 0.000 | 106.0 | −393 | 605 | 6.1 | −22.1 | 34.4 | −32 | 40 | 0.68 | 44.3 | 10.9 | 44.8 |
| WHO WTHT | 1864 | 312 | 298 | 0.000 | 139.8 | −377 | 657 | 8.1 | −20.9 | 37.2 | −32 | 42 | 0.67 | 44.3 | 7.5 | 48.3 |
| FAO WTHT | 1869 | 314 | 301 | 0.000 | 144.5 | −374 | 663 | 8.4 | −20.7 | 37.4 | −32 | 42 | 0.66 | 43.7 | 7.5 | 48.9 |
| Kleiber | 1864 | 320 | 294 | 0.000 | 139.9 | −367 | 647 | 8.1 | −20.3 | 36.6 | −29 | 43 | 0.68 | 41.4 | 9.2 | 49.4 |
| Korth | 1901 | 339 | 313 | 0.000 | 176.9 | −332 | 686 | 10.3 | −18.0 | 38.6 | −32 | 45 | 0.67 | 40.8 | 6.9 | 52.3 |
| FAO WT | 1880 | 289 | 302 | 0.000 | 155.5 | −354 | 665 | 9.0 | −19.8 | 37.9 | −30 | 44 | 0.64 | 39.7 | 8.6 | 51.7 |
| De Lorenzo | 1841 | 184 | 328 | 0.000 | 117.0 | −486 | 720 | 6.8 | −28.0 | 41.6 | −39 | 51 | 0.45 | 39.7 | 15.5 | 44.8 |
| Weijs | 1917 | 301 | 315 | 0.000 | 193.0 | −297 | 683 | 11.2 | −16.8 | 39.2 | −32 | 47 | 0.64 | 37.4 | 6.3 | 56.3 |
| Bernstein | 1500 | 263 | 343 | 0.000 | −223.9 | −734 | 287 | −13.0 | −41.9 | 15.9 | −50 | 21 | 0.56 | 35.6 | 58.6 | 5.7 |
| De Luis | 1999 | 209 | 393 | 0.000 | 274.8 | −278 | 827 | 15.9 | −16.3 | 48.2 | −29 | 61 | 0.43 | 27.0 | 5.2 | 67.8 |
| REE (kcal/d) | t-Test | Bias | LLA | ULA | Bias | LLA | ULA | Maximal Error | Prediction | ||||||||
|---|---|---|---|---|---|---|---|---|---|---|---|---|---|---|---|---|---|
| Equation | Mean | SD | RMSD | p-Value | kcal/d | kcal/d | kcal/d | % | % | % | Under % | Over % | CCC | MAPE | Acc % | Und % | Over % |
| REE Measured | 1958 | 100 | |||||||||||||||
| Henry and Rees *& | 1930 | 156 | 280 | 0.33 | −29.8 | −578 | 518 | −1.5 | −28.3 | 25.2 | −40 | 30 | 0.43 | 10.5 | 53.5 | 24.4 | 22.1 |
| Livingston | 1955 | 141 | 283 | 0.95 | 2.0 | −555 | 559 | 0.1 | −27.3 | 27.5 | −38 | 35 | 0.39 | 11.3 | 53.4 | 19.3 | 27.3 |
| Henry WTHT | 2038 | 196 | 283 | 0.004 | 85.5 | −447 | 618 | 4.4 | −21.8 | 30.6 | −33 | 35 | 0.49 | 12.1 | 52.3 | 11.4 | 36.4 |
| De Lorenzo & | 1894 | 176 | 277 | 0.047 | −58.4 | −593 | 476 | −3.0 | −29.3 | 23.4 | −39 | 30 | 0.47 | 10.5 | 52.3 | 28.4 | 19.3 |
| Huang | 1895 | 158 | 277 | 0.050 | −57.7 | −592 | 477 | −3.0 | −29.2 | 23.3 | −39 | 30 | 0.45 | 10.5 | 51.1 | 28.4 | 20.5 |
| Owen | 1952 | 133 | 275 | 0.99 | −0.3 | −543 | 543 | −0.02 | −26.7 | 26.6 | −38 | 32 | 0.41 | 11.1 | 50.0 | 20.5 | 29.5 |
| Mifflin | 1962 | 179 | 273 | 0.76 | 9.1 | −528 | 546 | 0.5 | −26.1 | 27.1 | −36 | 34 | 0.48 | 10.1 | 50.0 | 22.7 | 27.3 |
| Muller | 2064 | 169 | 294 | 0.000 | 111.6 | −425 | 648 | 5.7 | −20.7 | 32.1 | −32 | 39 | 0.43 | 12.9 | 47.7 | 10.2 | 42.0 |
| Lazzer 2010 | 2070 | 154 | 298 | 0.000 | 117.5 | −423 | 658 | 6.0 | −20.6 | 32.7 | −32 | 38 | 0.40 | 13.2 | 45.5 | 11.4 | 43.2 |
| Schofield WTHT | 2096 | 185 | 312 | 0.000 | 143.0 | −404 | 690 | 7.3 | −19.5 | 34.2 | −31 | 38 | 0.41 | 13.8 | 45.5 | 8.0 | 46.6 |
| H–B 1919 | 2123 | 228 | 324 | 0.000 | 170.9 | −372 | 714 | 8.8 | −18.0 | 35.5 | −28 | 43 | 0.45 | 14.5 | 44.3 | 4.5 | 51.1 |
| WHO WTHT | 2129 | 185 | 329 | 0.000 | 176.4 | −370 | 723 | 9.0 | −17.9 | 35.9 | −30 | 40 | 0.39 | 14.9 | 44.3 | 4.5 | 51.1 |
| FAO WT | 2116 | 184 | 321 | 0.000 | 163.7 | −381 | 708 | 8.4 | −18.3 | 35.1 | −30 | 39 | 0.40 | 14.4 | 44.3 | 6.8 | 48.9 |
| H–B 1984 | 2116 | 218 | 318 | 0.000 | 163.2 | −374 | 701 | 8.4 | −18.1 | 34.9 | −28 | 42 | 0.45 | 14.2 | 43.2 | 5.7 | 51.1 |
| FAO WTHT | 2133 | 187 | 331 | 0.000 | 180.7 | −367 | 728 | 9.3 | −17.7 | 36.2 | −30 | 40 | 0.38 | 15.1 | 43.2 | 4.5 | 52.3 |
| Kleibler | 2113 | 222 | 324 | 0.000 | 160.9 | −393 | 715 | 8.2 | −19.0 | 35.5 | −29 | 42 | 0.44 | 14.4 | 43.2 | 6.8 | 50.0 |
| Weijs | 2149 | 207 | 331 | 0.000 | 196.7 | −329 | 722 | 10.1 | −15.8 | 36.0 | −26 | 42 | 0.43 | 15.1 | 42.0 | 5.7 | 52.3 |
| De Luis & | 2125 | 180 | 335 | 0.000 | 172.3 | −395 | 740 | 8.8 | −19.3 | 36.9 | −29 | 46 | 0.35 | 15.2 | 39.8 | 8.0 | 52.3 |
| Korth | 2189 | 188 | 360 | 0.000 | 236.4 | −299 | 772 | 12.1 | −14.4 | 38.6 | −25 | 45 | 0.36 | 16.7 | 38.6 | 3.4 | 58.0 |
| Bernstein | 1702 | 217 | 371 | 0.000 | −251.0 | −790 | 288 | −12.9 | −40.4 | 14.7 | −48 | 21 | 0.38 | 14.3 | 36.4 | 60.2 | 3.4 |
| REE (kcal/d) | t-Test | Bias | LLA | ULA | Bias | LLA | ULA | Maximal Error | Prediction | ||||||||
|---|---|---|---|---|---|---|---|---|---|---|---|---|---|---|---|---|---|
| Equation | Mean | SD | RMSD | p-Value | kcal/d | kcal/d | kcal/d | % | % | % | Under % | Over % | CCC | MAPE | Acc % | Und % | Over % |
| Measured | 1491 | 288 | 100 | ||||||||||||||
| Mifflin | 1507 | 152 | 230 | 0.51 | 16.5 | −435 | 468 | 1.1 | −28.5 | 30.7 | −37 | 35 | 0.50 | 12.9 | 52.3 | 17.4 | 30.2 |
| Livingston | 1510 | 113 | 236 | 0.44 | 19.7 | −444 | 483 | 1.3 | −29.0 | 31.6 | −34 | 38 | 0.41 | 13.1 | 48.8 | 17.4 | 33.7 |
| Henry WTHT | 1523 | 129 | 240 | 0.21 | 32.5 | −437 | 502 | 2.2 | −28.5 | 32.9 | −36 | 37 | 0.42 | 13.5 | 48.8 | 16.3 | 34.9 |
| Owen | 1416 | 75 | 261 | 0.007 | −75.2 | −567 | 417 | −5.0 | −36.9 | 26.9 | −46 | 31 | 0.27 | 12.9 | 45.3 | 36.0 | 18.6 |
| H–B 1984 | 1565 | 128 | 243 | 0.004 | 74.5 | −382 | 530 | 5.0 | −25.0 | 35.0 | −32 | 39 | 0.43 | 14.1 | 45.3 | 12.8 | 41.9 |
| Schofield WTHT | 1568 | 136 | 256 | 0.005 | 77.2 | −404 | 558 | 5.2 | −26.1 | 36.5 | −34 | 41 | 0.38 | 14.8 | 45.3 | 12.8 | 41.9 |
| H–B 1919 | 1593 | 128 | 252 | 0.000 | 102.0 | −353 | 557 | 6.8 | −23.2 | 36.8 | −30 | 41 | 0.41 | 14.9 | 44.2 | 10.5 | 45.3 |
| FAO WTHT | 1598 | 137 | 266 | 0.000 | 107.4 | −371 | 586 | 7.2 | −24.0 | 38.4 | −32 | 42 | 0.37 | 15.7 | 44.2 | 10.5 | 45.3 |
| Huang | 1384 | 130 | 256 | 0.000 | −107.2 | −565 | 351 | −7.2 | −37.0 | 22.6 | −48 | 27 | 0.40 | 12.5 | 44.2 | 40.7 | 15.1 |
| WHO WTHT | 1593 | 129 | 263 | 0.000 | 102.3 | −374 | 579 | 6.9 | −24.3 | 38.0 | −32 | 42 | 0.37 | 15.5 | 44.2 | 10.5 | 45.3 |
| Henry and Rees *& | 1568 | 118 | 244 | 0.009 | 69.7 | −394 | 533 | 4.7 | −25.5 | 34.9 | −38 | 41 | 0.38 | 13.7 | 43.4 | 13.3 | 43.4 |
| Korth | 1607 | 158 | 257 | 0.000 | 116.0 | −337 | 569 | 7.8 | −22.0 | 37.5 | −32 | 40 | 0.45 | 15.2 | 43.0 | 10.5 | 46.5 |
| Lazzer 2010 | 1585 | 128 | 249 | 0.000 | 94.3 | −360 | 549 | 6.3 | −23.7 | 36.3 | −32 | 40 | 0.42 | 14.8 | 43.0 | 10.5 | 46.5 |
| Muller | 1575 | 136 | 243 | 0.001 | 83.9 | −366 | 534 | 5.6 | −24.0 | 35.3 | −33 | 39 | 0.45 | 14.3 | 41.9 | 12.8 | 45.3 |
| Kleiber | 1609 | 168 | 259 | 0.000 | 118.4 | −336 | 573 | 7.9 | −21.8 | 37.7 | −28 | 43 | 0.46 | 15.3 | 39.5 | 11.6 | 48.8 |
| FAO WT | 1638 | 134 | 282 | 0.000 | 147.1 | −327 | 621 | 9.9 | −21.1 | 40.8 | −29 | 44 | 0.35 | 17.2 | 34.9 | 10.5 | 54.7 |
| Bernstein | 1295 | 90 | 311 | 0.000 | −196.2 | −672 | 280 | −13.2 | −43.6 | 17.3 | −50 | 21 | 0.25 | 14.7 | 34.9 | 57.0 | 8.1 |
| Weijs | 1680 | 168 | 298 | 0.000 | 189.3 | −266 | 644 | 12.7 | −17.2 | 42.6 | −32 | 47 | 0.39 | 18.6 | 32.6 | 7.0 | 60.5 |
| De Lorenzo & | 1787 | 178 | 373 | 0.000 | 296.4 | −150 | 743 | 19.9 | −9.4 | 49.1 | −20 | 51 | 0.31 | 24.2 | 26.7 | 2.3 | 70.9 |
| De Luis & | 1870 | 150 | 444 | 0.000 | 379.6 | −75 | 835 | 25.5 | −4.5 | 55.4 | −11 | 61 | 0.21 | 29.7 | 14.0 | 2.3 | 83.7 |
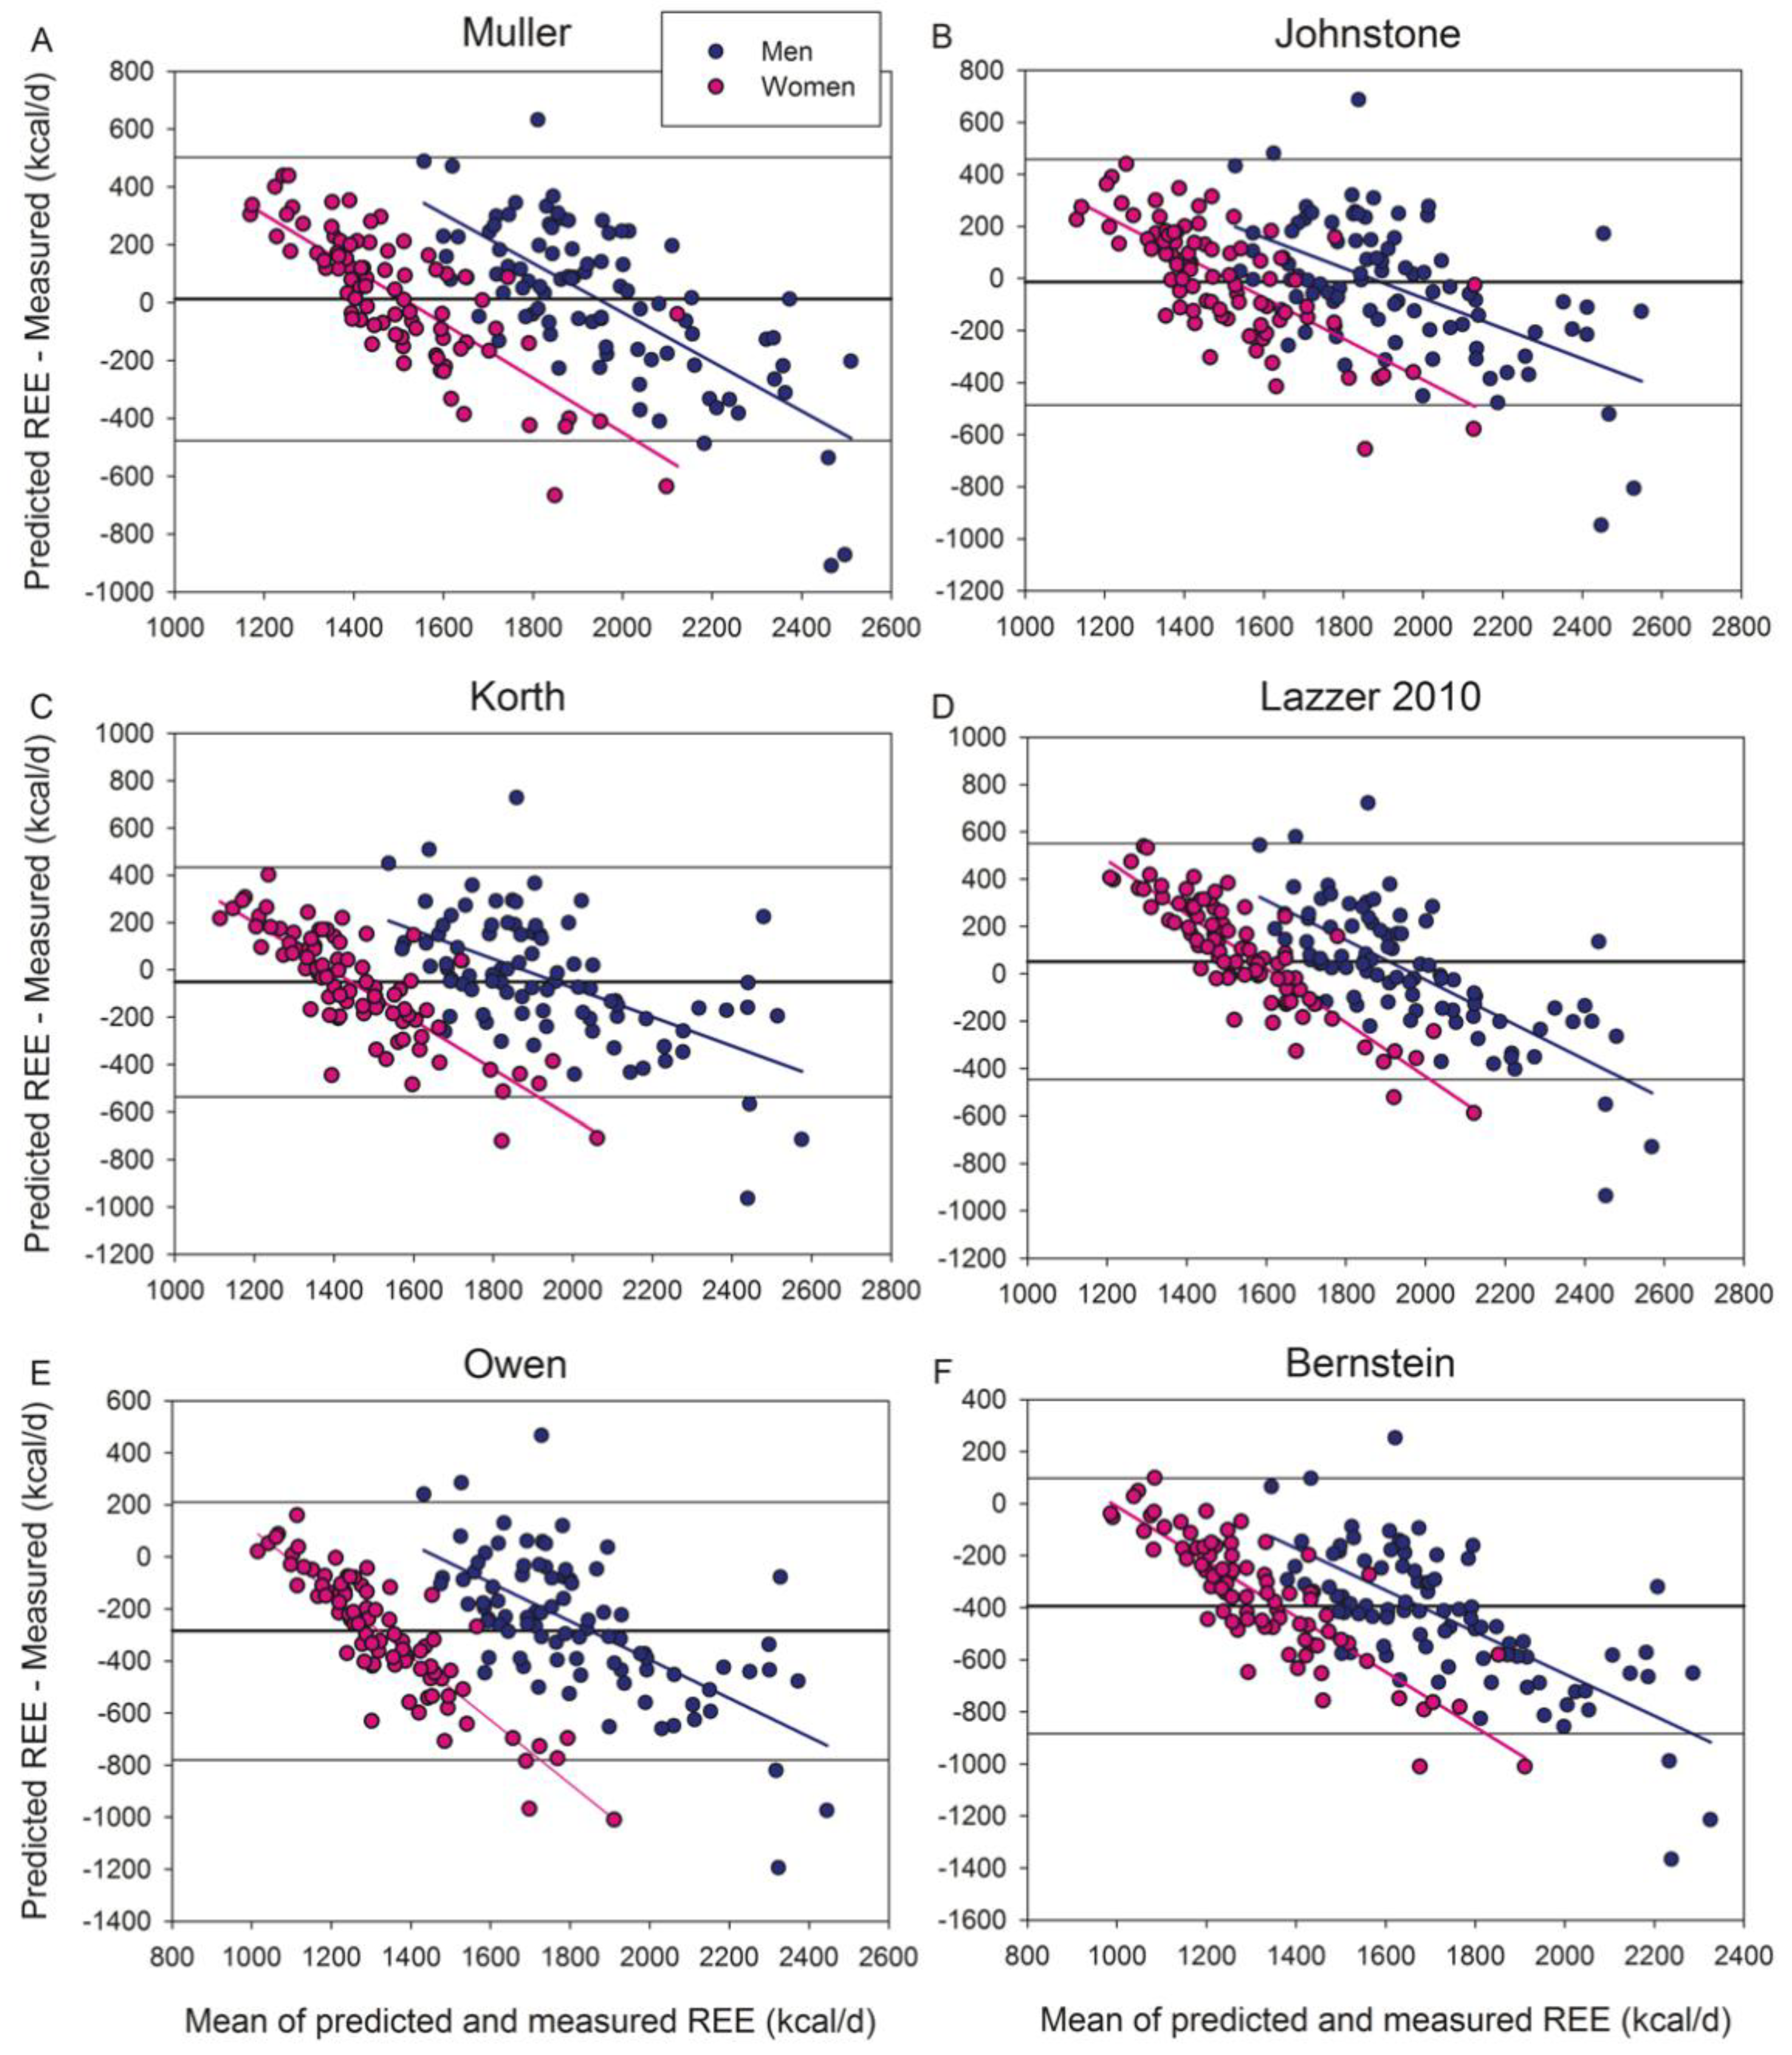
| REE (kcal/d) | t-Test | Bias | LLA | ULA | Bias | LLA | ULA | Maximal Error | Prediction | ||||||||
|---|---|---|---|---|---|---|---|---|---|---|---|---|---|---|---|---|---|
| Equation | Mean | SD | RMSD | p-Value | kcal/d | kcal/d | kcal/d | % | % | % | Under % | Over % | CCC | MAPE | Acc % | Und % | Over % |
| REE Measured | 1727 | 389 | 100 | ||||||||||||||
| Muller ALL | 1737 | 265 | 250 | 0.51 | 12.7 | −477 | 503 | 0.7 | −27.0 | 28.5 | −37 | 35 | 0.72 | 52.9 | 17.8 | 29.3 | |
| Muller men § | 1957 | 160 | 268 | 0.88 | 4.4 | −524 | 533 | 0.2 | −25.8 | 26.2 | −37 | 35 | 0.47 | 10.7 | 55.7 | 18.2 | 26.1 |
| Muller women § | 1512 | 123 | 229 | 0.40 | 21.1 | −429 | 471 | 1.4 | −28.2 | 31.0 | −36 | 35 | 0.46 | 12.9 | 50.0 | 17.4 | 32.6 |
| Johnstone ALL | 1710 | 273 | 241 | 0.43 | −14.5 | −487 | 458 | −0.8 | −27.8 | 26.1 | −39 | 37 | 0.74 | 52.9 | 20.7 | 26.4 | |
| Johnstone men | 1915 | 205 | 260 | 0.18 | −37.4 | −545 | 470 | −1.9 | −27.1 | 23.3 | −39 | 37 | 0.56 | 10.0 | 56.8 | 21.6 | 21.6 |
| Johnstone women | 1500 | 143 | 219 | 0.71 | 8.9 | −423 | 440 | 0.6 | −27.9 | 29.0 | −35 | 35 | 0.53 | 12.3 | 48.8 | 19.8 | 31.4 |
| Korth ALL | 1673 | 295 | 252 | 0.007 | −51.2 | −536 | 434 | −3.0 | −30.7 | 24.7 | −40 | 39 | 0.73 | 51.7 | 28.7 | 19.5 | |
| Korth men § | 1916 | 200 | 263 | 0.200 | −36.1 | −550 | 478 | −1.9 | −27.5 | 23.8 | −39 | 39 | 0.54 | 10.3 | 59.1 | 22.7 | 18.2 |
| Korth women § | 1424 | 111 | 240 | 0.009 | −66.6 | −521 | 388 | −4.5 | −34.2 | 25.2 | −40 | 33 | 0.41 | 12.3 | 44.2 | 34.9 | 20.9 |
| Lazzer 2010 ALL | 1776 | 231 | 259 | 0.008 | 51.6 | −446 | 550 | 3.0 | −25.8 | 31.7 | −38 | 42 | 0.67 | 50.6 | 14.9 | 34.5 | |
| Lazzer 2010 men § | 1963 | 161 | 265 | 0.72 | 10.1 | −513 | 533 | 0.5 | −25.5 | 26.5 | −38 | 39 | 0.48 | 10.6 | 58.0 | 15.9 | 26.1 |
| Lazzer 2010 women | 1585 | 96 | 251 | 0.000 | 94.0 | −365 | 554 | 6.3 | −24.0 | 36.6 | −28 | 42 | 0.37 | 15.0 | 43.0 | 14.0 | 43.0 |
| Owen ALL | 1440 | 289 | 380 | 0.000 | −284.4 | −780 | 211 | −16.5 | −45.1 | 12.1 | −57 | 27 | 0.54 | 27.0 | 70.7 | 2.3 | |
| Owen men &¶ | 1690 | 178 | 372 | 0.000 | −262.9 | −780 | 254 | −13.5 | −39.0 | 12.1 | −51 | 27 | 0.35 | 14.4 | 30.7 | 65.9 | 3.4 |
| Owen women ¶ | 1184 | 87 | 389 | 0.000 | −306.4 | −778 | 165 | −20.6 | −50.1 | 9.0 | −57 | 14 | 0.18 | 19.4 | 23.3 | 75.6 | 1.2 |
| Bernstein ALL | 1330 | 232 | 467 | 0.000 | −394.2 | −885 | 97 | −22.9 | −49.2 | 3.5 | −61 | 16 | 0.39 | 12.6 | 86.8 | 0.6 | |
| Bernstein men ¶ | 1513 | 166 | 511 | 0.000 | −439.8 | −954 | 74 | −22.5 | −47.4 | 2.3 | −61 | 16 | 0.21 | 14.3 | 10.2 | 88.6 | 1.1 |
| Bernstein women ¶ | 1143 | 106 | 416 | 0.000 | −347.5 | −799 | 104 | −23.3 | −51.3 | 4.7 | −60 | 9 | 0.19 | 14.7 | 15.1 | 84.9 | 0.0 |
© 2020 by the authors. Licensee MDPI, Basel, Switzerland. This article is an open access article distributed under the terms and conditions of the Creative Commons Attribution (CC BY) license (http://creativecommons.org/licenses/by/4.0/).
Share and Cite
Martin-Rincon, M.; Perez-Valera, M.; Morales-Alamo, D.; Perez-Suarez, I.; Dorado, C.; Gonzalez-Henriquez, J.J.; Juan-Habib, J.W.; Quintana-Garcia, C.; Galvan-Alvarez, V.; Pedrianes-Martin, P.B.; et al. Resting Energy Expenditure and Body Composition in Overweight Men and Women Living in a Temperate Climate. J. Clin. Med. 2020, 9, 203. https://doi.org/10.3390/jcm9010203
Martin-Rincon M, Perez-Valera M, Morales-Alamo D, Perez-Suarez I, Dorado C, Gonzalez-Henriquez JJ, Juan-Habib JW, Quintana-Garcia C, Galvan-Alvarez V, Pedrianes-Martin PB, et al. Resting Energy Expenditure and Body Composition in Overweight Men and Women Living in a Temperate Climate. Journal of Clinical Medicine. 2020; 9(1):203. https://doi.org/10.3390/jcm9010203
Chicago/Turabian StyleMartin-Rincon, Marcos, Mario Perez-Valera, David Morales-Alamo, Ismael Perez-Suarez, Cecilia Dorado, Juan J. Gonzalez-Henriquez, Julian W. Juan-Habib, Cristian Quintana-Garcia, Victor Galvan-Alvarez, Pablo B. Pedrianes-Martin, and et al. 2020. "Resting Energy Expenditure and Body Composition in Overweight Men and Women Living in a Temperate Climate" Journal of Clinical Medicine 9, no. 1: 203. https://doi.org/10.3390/jcm9010203
APA StyleMartin-Rincon, M., Perez-Valera, M., Morales-Alamo, D., Perez-Suarez, I., Dorado, C., Gonzalez-Henriquez, J. J., Juan-Habib, J. W., Quintana-Garcia, C., Galvan-Alvarez, V., Pedrianes-Martin, P. B., Acosta, C., Curtelin, D., Calbet, J. A. L., & de Pablos-Velasco, P. (2020). Resting Energy Expenditure and Body Composition in Overweight Men and Women Living in a Temperate Climate. Journal of Clinical Medicine, 9(1), 203. https://doi.org/10.3390/jcm9010203