NEWS2 Is Superior to qSOFA in Detecting Sepsis with Organ Dysfunction in the Emergency Department

 , , ,
, , ,
Abstract
1. Introduction
2. Methods
2.1. Patients
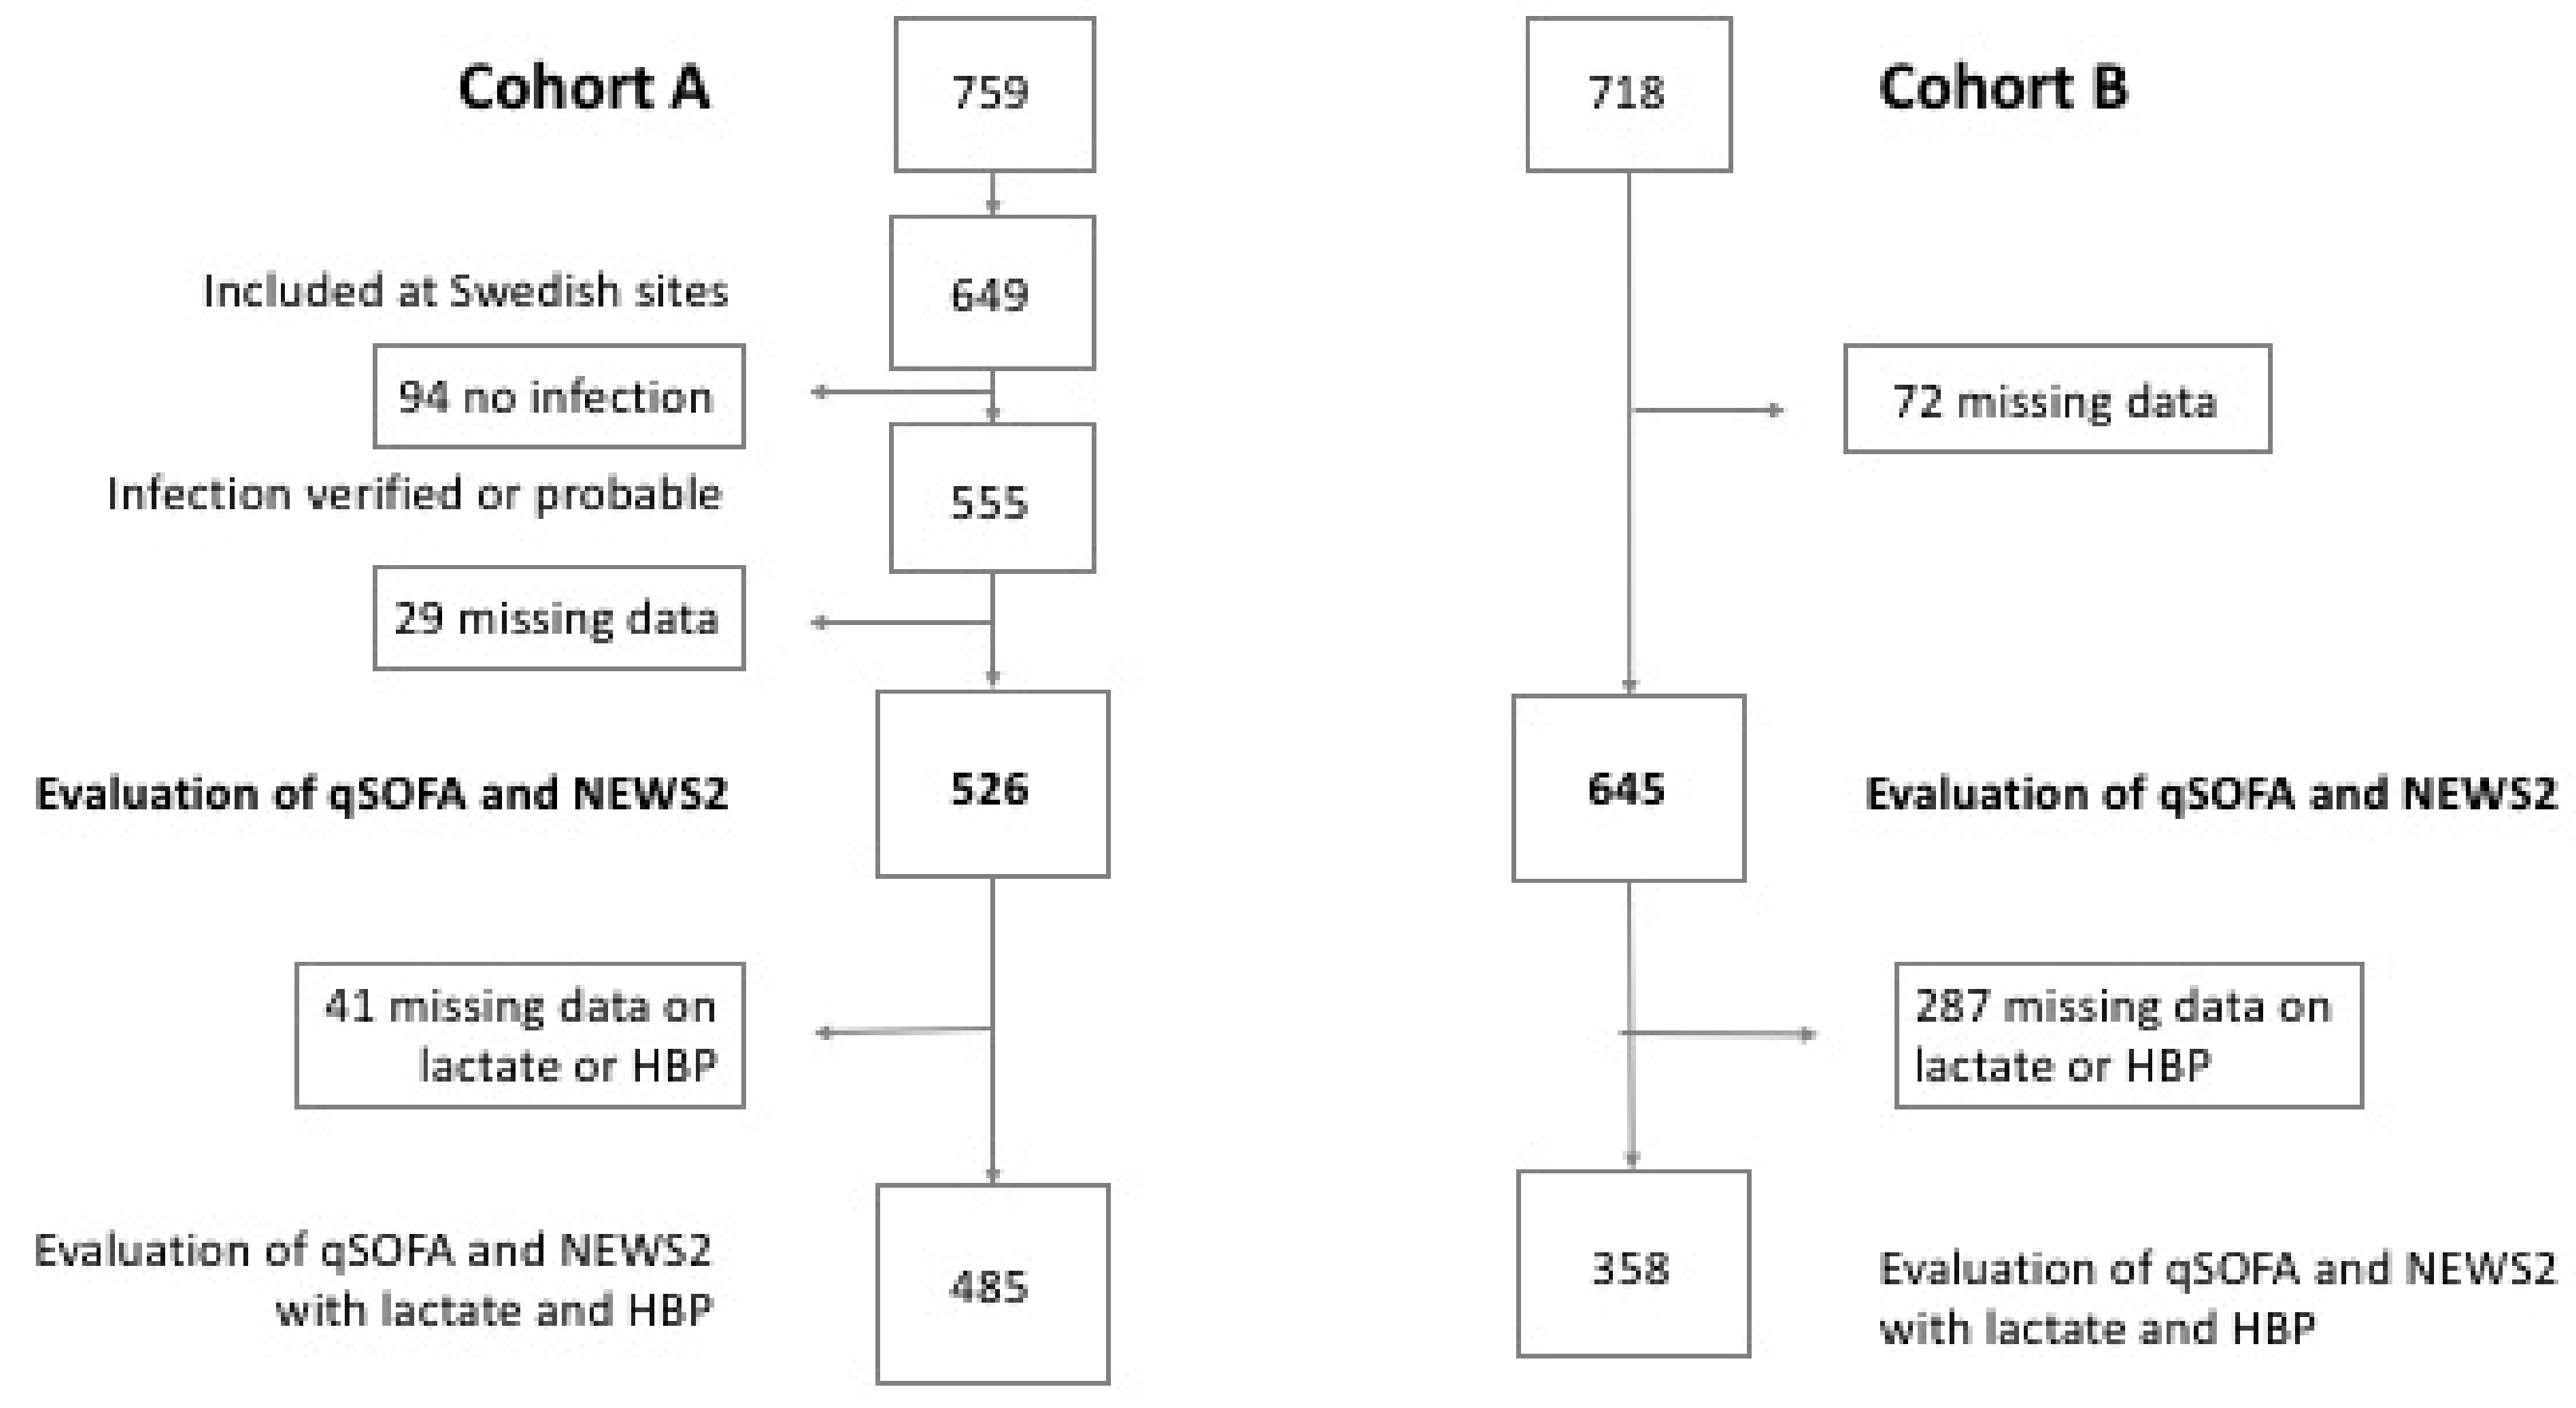
2.1.1. Cohort A
2.1.2. Cohort B
2.2. Definitions
2.3. Statistical Methods
3. Results
3.1. Cohort A—Patients with Suspected Infection
3.1.1. Patient Demographics
3.1.2. Performances of the Risk Stratification Scores for the Composite Outcome and Mortality
3.1.3. The Effect of Adding Biomarkers to qSOFA and NEWS2
3.1.4. Sensitivity Analyses—Outcome
3.1.5. Sensitivity Analyses—Missing Data
3.2. Cohort B—Patients, with and without Infection
3.2.1. Patient Demographics
3.2.2. Performance of the Risk Stratification Scores for the Composite Outcome and Mortality
3.2.3. The Effect of Adding Biomarkers to qSOFA and NEWS2
3.2.4. Sensitivity Analyses—Outcome
3.2.5. Sensitivity Analyses—Missing Data
3.2.6. Sensitivity Analyses—Inclusion Bias
4. Discussion
5. Conclusions
Supplementary Materials
Author Contributions
Funding
Conflicts of Interest
References
- Rhee, C.; Dantes, R.; Epstein, L.; Murphy, D.J.; Seymour, C.W.; Iwashyna, T.J.; Kadri, S.S.; Angus, D.C.; Danner, R.L.; Fiore, A.E.; et al. Incidence and trends of sepsis in US hospitals using clinical vs. claims data, 2009–2014. Jama 2017, 318, 1241–1249. [Google Scholar] [CrossRef] [PubMed]
- Mellhammar, L.; Wullt, S.; Lindberg, A.; Lanbeck, P.; Christensson, B.; Linder, A. Sepsis incidence: A population-based study. Open Forum Infect Dis. 2016, 3, ofw207. [Google Scholar] [CrossRef] [PubMed]
- Seymour, C.W.; Kahn, J.M.; Martin-Gill, C.; Callaway, C.W.; Yealy, D.M.; Scales, D.; Angus, D.C. Delays from first medical contact to antibiotic administration for sepsis. Crit. Care Med. 2017, 45, 759–765. [Google Scholar] [CrossRef] [PubMed]
- Seymour, C.W.; Liu, V.X.; Iwashyna, T.J.; Brunkhorst, F.M.; Rea, T.D.; Scherag, A.; Rubenfeld, G.; Kahn, J.M.; Shankar-Hari, M.; Singer, M.; et al. Assessment of clinical criteria for sepsis: For the third international consensus definitions for Sepsis and Septic Shock (Sepsis-3). Jama 2016, 315, 762–774. [Google Scholar] [CrossRef] [PubMed]
- Bone, R.C.; Balk, R.A.; Cerram, F.B.; Dellinger, R.P.; Fein, A.M.; Knaus, W.A.; Schein, R.M.; Sibbald, W.A. Definitions for sepsis and organ failure and guidelines for the use of innovative therapies in sepsis. The ACCP/SCCM Consensus Conference Committee. American College of Chest Physicians/Society of Critical Care Medicine. Chest 1992, 101, 1644–1655. [Google Scholar] [CrossRef] [PubMed]
- Churpek, M.M.; Snyder, A.; Han, X.; Sokol, S.; Pettit, N.; Howell, M.D.; Edelson, D.P. Quick sepsis-related organ Failure assessment, systemic inflammatory response syndrome, and early warning scores for detecting clinical deterioration in infected patients outside the intensive care unit. Am. J. Respir. Crit. Care Med. 2017, 195, 906–911. [Google Scholar] [CrossRef] [PubMed]
- Physicians RCo. National Early Warning Score (NEWS) 2: Standardising the Assessment of Acute-Illness Severity in the NHS; RCP: London, UK, 2017. [Google Scholar]
- Rosenqvist, M.; Fagerstrand, E.; Lanbeck, P.; Melander, O.; Akesson, P. Sepsis Alert—A triage model that reduces time to antibiotics and length of hospital stay. Infect Dis. (Lond). 2017, 49, 507–513. [Google Scholar] [CrossRef] [PubMed]
- Idrees, M.; Macdonald, S.P.; Kodali, K. Sepsis Early Alert Tool: Early recognition and timely management in the emergency department. Emerg. Med. Australas. 2016, 28, 399–403. [Google Scholar] [CrossRef]
- Freund, Y.; Lemachatti, N.; Krastinova, E.; Van Laer, M.; Claessens, Y.E.; Avondo, A.; Occelli, C.; Feral-Pierssens, A.L.; Truchot, J.; Ortega, M.; et al. Prognostic accuracy of Sepsis-3 criteria for in-hospital mortality among patients with suspected infection presenting to the emergency department. Jama 2017, 317, 301–308. [Google Scholar] [CrossRef]
- Williams, J.M.; Greenslade, J.H.; McKenzie, J.V.; Chu, K.; Brown, A.F.T.; Lipman, J. Systemic inflammatory response syndrome, quick sequential organ function assessment, and organ dysfunction: Insights from a prospective database of ED patients with infection. Chest 2017, 151, 586–596. [Google Scholar] [CrossRef]
- Askim, A.; Moser, F.; Gustad, L.T.; Stene, H.; Gundersen, M.; Asvold, B.O.; Dale, J.; Bjornsen, L.P.; Damas, J.K.; Solligard, E. Poor performance of quick-SOFA (qSOFA) score in predicting severe sepsis and mortality—A prospective study of patients admitted with infection to the emergency department. Scand. J. Trauma Resusc. Emerg. Med. 2017, 25, 56. [Google Scholar] [CrossRef] [PubMed]
- Singer, M.; Deutschman, C.S.; Seymour, C.W.; Shankar-Hari, M.; Annane, D.; Bauer, M.; Bellomo, R.; Bernard, G.R.; Chiche, J.D.; Coopersmith, C.M.; et al. The third international consensus definitions for Sepsis and Septic Shock (Sepsis-3). Jama 2016, 315, 801–810. [Google Scholar] [CrossRef] [PubMed]
- Rhee, C.; Kadri, S.S.; Danner, R.L.; Suffredini, A.F.; Massaro, A.F.; Kitch, B.T.; Lee, G.; Klompas, M. Diagnosing sepsis is subjective and highly variable: A survey of intensivists using case vignettes. Crit. Care. 2016, 20, 89. [Google Scholar] [CrossRef] [PubMed]
- Soehnlein, O.; Xie, X.; Ulbrich, H.; Kenne, E.; Rotzius, P.; Flodgaard, H.; Eriksson, E.E.; Lindbom, L. Neutrophil-derived heparin-binding protein (HBP/CAP37) deposited on endothelium enhances monocyte arrest under flow conditions. J. Immunol. 2005, 174, 6399–6405. [Google Scholar] [CrossRef] [PubMed]
- Herwald, H.; Cramer, H.; Morgelin, M.; Russell, W.; Sollenberg, U.; Norrby-Teglund, A.; Flodgaard, H.; Lindbom, L.; Bjorck, L. M protein, a classical bacterial virulence determinant, forms complexes with fibrinogen that induce vascular leakage. Cell 2004, 116, 367–379. [Google Scholar] [CrossRef]
- Kahn, F.; Morgelin, M.; Shannon, O.; Norrby-Teglund, A.; Herwald, H.; Olin, A.I.; Bjorck, L. Antibodies against a surface protein of Streptococcus pyogenes promote a pathological inflammatory response. PLoS Pathog. 2008, 4, e1000149. [Google Scholar] [CrossRef] [PubMed]
- Linder, A.; Christensson, B.; Herwald, H.; Bjorck, L.; Akesson, P. Heparin-binding protein: an early marker of circulatory failure in sepsis. Clin. Infect. Dis. 2009, 49, 1044–1050. [Google Scholar] [CrossRef]
- Gautam, N.; Olofsson, A.M.; Herwald, H.; Iversen, L.F.; Lundgren-Akerlund, E.; Hedqvist, P.; Arfors, K.E.; Flodgaard, H.; Lindbom, L. Heparin-binding protein (HBP/CAP37): a missing link in neutrophil-evoked alteration of vascular permeability. Nat. Med. 2001, 7, 1123–1127. [Google Scholar] [CrossRef]
- Kahn, F.; Tverring, J.; Mellhammar, L.; Wetterberg, N.; Blackberg, A.; Studahl, E.; Hadorn, N.; Kahn, R.; Nueesch, S.; Jent, P.; et al. Heparin-binding protein as a prognostic biomarker of sepsis and disease severity at The Emergency Department. Shock 2019. [Google Scholar] [CrossRef]
- Linder, A.; Arnold, R.; Boyd, J.H.; Zindovic, M.; Zindovic, I.; Lange, A.; Paulsson, M.; Nyberg, P.; Russell, J.A.; Pritchard, D.; et al. Heparin-binding protein measurement improves the prediction of severe infection with organ dysfunction in the emergency department. Crit. Care Med. 2015, 43, 2378–2386. [Google Scholar] [CrossRef]
- Levy, M.M.; Fink, M.P.; Marshall, J.C.; Abraham, E.; Angus, D.; Cook, D.; Cohen, J.; Opal, S.M.; Vincent, J.L.; Ramsay, G. 2001 SCCM/ESICM/ACCP/ATS/SIS international sepsis definitions conference. Intensive Care Med. 2003, 29, 530–538. [Google Scholar] [CrossRef] [PubMed]
- Severinghaus, J.W. Simple, accurate equations for human blood O2 dissociation computations. J. Appl. Physiol. Respir. Environ. Exerc. Physiol. 1979, 46, 599–602. [Google Scholar] [CrossRef] [PubMed]
- Dellinger, R.P.; Levy, M.M.; Rhodes, A.; Annane, D.; Gerlach, H.; Opal, S.M.; Sevransky, J.E.; Sprung, C.L.; Douglas, I.S.; Jaeschke, R.; et al. Surviving Sepsis Campaign: international guidelines for management of severe sepsis and septic shock, 2012. Intensive Care Med. 2013, 39, 165–228. [Google Scholar] [CrossRef] [PubMed]
- Bentzer, P.; Fisher, J.; Kong, H.J.; Morgelin, M.; Boyd, J.H.; Walley, K.R.; Russell, J.A.; Linder, A. Heparin-binding protein is important for vascular leak in sepsis. Intensive Care Med. Exp. 2016, 4, 33. [Google Scholar] [CrossRef] [PubMed]
- Usman, O.A.; Usman, A.A.; Ward, M.A. Comparison of SIRS, qSOFA, and NEWS for the early identification of sepsis in the Emergency Department. Am. J. Emerg. Med. 2018. [Google Scholar] [CrossRef] [PubMed]
- Silcock, D.J.; Corfield, A.R.; Rooney, K.D.; Staines, H. Superior performance of National Early Warning Score compared with quick Sepsis-related Organ Failure Assessment Score in predicting adverse outcomes: A retrospective observational study of patients in the prehospital setting. Eur. J. Emerg. Med. 2018. [Google Scholar] [CrossRef]
- Brink, A.; Alsma, J.; Verdonschot, R.; Rood, P.P.M.; Zietse, R.; Lingsma, H.F.; Schuit, S.C.E. Predicting mortality in patients with suspected sepsis at the Emergency Department; A retrospective cohort study comparing qSOFA, SIRS and National Early Warning Score. PLoS One 2019, 14, e0211133. [Google Scholar] [CrossRef]
- Bergh, C.; Fall, K.; Udumyan, R.; Sjoqvist, H.; Frobert, O.; Montgomery, S. Severe infections and subsequent delayed cardiovascular disease. Eur. J. Prev. Cardiol. 2017, 24, 1958–1966. [Google Scholar] [CrossRef]
- Prescott, H.C.; Osterholzer, J.J.; Langa, K.M.; Angus, D.C.; Iwashyna, T.J. Late mortality after sepsis: Propensity matched cohort study. BMJ 2016, 353, i2375. [Google Scholar] [CrossRef]
- Linder, A.; Guh, D.; Boyd, J.H.; Walley, K.R.; Anis, A.H.; Russell, J.A. Long-term (10-year) mortality of younger previously healthy patients with severe sepsis/septic shock is worse than that of patients with nonseptic critical illness and of the general population. Crit. Care Med. 2014, 42, 2211–2218. [Google Scholar] [CrossRef]
- Finkelsztein, E.J.; Jones, D.S.; Ma, K.C.; Pabon, M.A.; Delgado, T.; Nakahira, K.; Arbo, J.E.; Berlin, D.A.; Schenck, E.J.; Choi, A.M.; et al. Comparison of qSOFA and SIRS for predicting adverse outcomes of patients with suspicion of sepsis outside the intensive care unit. Crit. Care. 2017, 21, 73. [Google Scholar] [CrossRef] [PubMed]
- Giamarellos-Bourboulis, E.J.; Tsaganos, T.; Tsangaris, I.; Lada, M.; Routsi, C.; Sinapidis, D.; Koupetori, M.; Bristianou, M.; Adamis, G.; Mandragos, K.; et al. Validation of the new Sepsis-3 definitions: proposal for improvement in early risk identification. Clin. Microbiol. Infect. 2017, 23, 104–109. [Google Scholar] [CrossRef] [PubMed]
- Singer, A.J.; Ng, J.; Thode, H.C., Jr.; Spiegel, R.; Weingart, S. Quick SOFA scores predict mortality in adult emergency department patients with and without suspected infection. Ann. Emerg. Med. 2017, 69, 475–479. [Google Scholar] [CrossRef] [PubMed]
- Goulden, R.; Hoyle, M.C.; Monis, J.; Railton, D.; Riley, V.; Martin, P.; Martina, R.; Nsutebu, E. qSOFA, SIRS and NEWS for predicting inhospital mortality and ICU admission in emergency admissions treated as sepsis. Emerg. Med. J. 2018, 35, 345–349. [Google Scholar] [CrossRef] [PubMed]


| System | Values |
|---|---|
| Cardiovascular | SBP < 90 mmHg ∆SBP > −40 MAP < 70 Vasopressor |
| Respiratory, Cohort A | SaO2 < 90% |
| Respiratory, Cohort B | SaO2 < 90% For COPD SaO2 < 87% For SaO2 90%–94% and O2 PaO2/FiO2 ratio < 300 with COPD and SaO2 87%–95% PaO2/FiO2 ratio < 250 |
| Renal | creatinine increase > 44 µmol/L urinary output < 0.5mL/kg/h for >2 h initiation of dialysis |
| Hepatic | bilirubin > 35 μmol/L |
| Haematologic | platelet count < 100 × 109/L INR > 1.5 unless use of anticoagulants |
| Metabolic | lactate > 3.2 mmol/L |
| Cohort A, n = 526 | Cohort B, n = 645 | |||||
|---|---|---|---|---|---|---|
| With Composite Outcome n = 238 | Without Composite Outcome n = 288 | p | With Composite Outcome n = 191 | Without Composite Outcome n = 454 | p | |
| Age, median | 70 | 52 | <0.01 | 76 | 71 | <0.01 |
| Female, n (%) | 109 (46) | 125 (43) | 0.60 | 94 (49) | 218 (48) | 0.80 |
| Comorbidities n (%) | ||||||
| Diabetes | 48 (20) | 30 (10) | <0.01 | 43 (23) | 80 (18) | 0.16 |
| Cardiovascular disease | 80 (34) | 34 (12) | <0.01 | 99 (52) | 205 (45) | 0.14 |
| Renal disease | 16 (6) | 32 (13) | <0.01 | 56 (29) | 111 (24) | 0.20 |
| Liver disease | 1 (0) | 3 (1) | 0.63 | 12 (6) | 13 (3) | 0.05 |
| Malignancy | 24 (10) | 21 (7) | 0.28 | 31 (16) | 57 (13) | 0.21 |
| Immunodeficiency | 9 (4) | 10 (4) | 1 | 8 (4) | 6 (1) | 0.04 |
| Respiratory disease | 32 (13) | 22 (8) | 0.03 | 32 (17) | 50 (11) | 0.05 |
| No comorbidities | 98 (41) | 195 (68) | <0.01 | 31 (16) | 148 (33) | <0.01 |
| Sepsis-2 organ dysfunction, n (%) | ||||||
| No organ dysfunction | 5 (2) | 281 (98) | <0.01 | 0 (0) | 212 (47) | <0.01 |
| Neurologic | 30 (13) | 7 (2) | <0.01 | 52 (27) | 91 (20) | 0.05 |
| Cardiovascular | 174 (91) | - | - | 126 (66) | 130 (29) | <0.01 |
| Respiratory | 63 (27) | - | - | 112 (59) | 83 (18) | <0.01 |
| Renal | 28 (12) | - | - | 50 (26) | 33 (7) | <0.01 |
| Haematological | 25 (11) | - | - | 19 (10) | 26 (6) | 0.05 |
| Hepatic | 9 (4) | - | - | 7 (4) | 6 (1) | 0.06 |
| Intensive Care, n (%) | 14 (6) | - | - | 18 (10) | 30 (7) | 0.25 |
| Three-days mortality, n (%) | 3 (1) | - | - | 7 (4) | 18 (4) | 0.86 |
| qSOFA | NEWS2 | |||
|---|---|---|---|---|
| ≥2 | <2 | ≥ 5 | <5 | |
| Cohort A (n = 526) | ||||
| Composite outcome + | 40 | 198 | 155 | 83 |
| Composite outcome – | 8 | 280 | 57 | 231 |
| Sensitivity | 0.17 (0.12–0.22) | 0.65 (0.59–0.71) | ||
| Specificity | 0.97 (0.95–0.99) | 0.80 (0.75–0.85) | ||
| AUC | 0.71 (0.66–0.75) | 0.80 (0.75–0.83) | ||
| p compared to qSOFA | reference | <0.01 | ||
| 30-days mortality + | 6 | 7 | 9 | 4 |
| 30-days mortality – | 42 | 471 | 203 | 310 |
| AUC 30-days mortality | 0.72 (0.54–0.90) | 0.75 (0.60–0.90) | ||
| Cohort B (n = 645) | ||||
| Composite outcome + | 67 | 124 | 160 | 31 |
| Composite outcome – | 75 | 379 | 287 | 167 |
| Sensitivity | 0.35 (0.28–0.42) | 0.84 (0.78–0.89) | ||
| Specificity | 0.83 (0.80–0.87) | 0.37 (0.32–0.41) | ||
| AUC | 0.62 (0.57–0.67) | 0.70 (0.65–0.74) | ||
| p compared to qSOFA | reference | 0.02 | ||
| 30-days mortality + | 18 | 32 | 45 | 5 |
| 30-days mortality – | 79 | 338 | 289 | 128 |
| AUC 30-days mortality | 0.62 (0.53–0.70) | 0.70 (0.63–0.70) | ||
| qSOFA | qSOFA Incl Lactate | qSOFA Incl HBP | NEWS2 | NEWS2 Incl Lactate | NEWS2 Incl HBP | |
|---|---|---|---|---|---|---|
| Cohort A, n = 485 | ||||||
| Composite outcome excl lactate and CNS OD | ||||||
| AUC | 0.70 (0.66–0.75) | 0.73 (0.68–0.77) | 0.78 (0.74–0.82) | 0.79 (0.75–0.83) | 0.80 (0.76–0.84) | 0.81 (0.78–0.85) |
| p compared to qSOFA | reference | 0.37 | 0.01 | <0.01 | <0.01 | <0.01 |
| p compared to NEWS2 | <0.01 | 0.06 | 0.74 | reference | 0.73 | 0.73 |
| Composite outcome incl lactate excl CNS OD | ||||||
| AUC | 0.71 (0.66–0.75) | 0.74 (0.70–0.78) | 0.78 (0.74–0.82) | 0.79 (0.75–0.83) | 0.80 (0.76–0.84) | 0.82 (0.78–0.85) |
| p compared to qSOFA | reference | 0.47 | 0.03 | 0.01 | <0.01 | <0.01 |
| p compared to NEWS2 | 0.01 | 0.11 | 0.73 | reference | 0.73 | 0.30 |
| Composite outcome incl lactate and CNS OD | ||||||
| AUC | 0.72 (0.68–0.77) | 0.76 (0.71–0.80) | 0.80 (0.76–0.84) | 0.81 (0.77–0.85) | 0.82 (0.78–0.86) | 0.83 (0.80–0.87) |
| p compared to qSOFA | reference | 0.21 | 0.01 | <0.01 | <0.01 | <0.01 |
| p compared to NEWS2 | <0.01 | 0.09 | 0.73 | reference | 0.72 | 0.47 |
| Cohort B, n = 358 | ||||||
| Composite outcome excl lactate and CNS OD | ||||||
| AUC | 0.62 (0.55–0.68) | 0.64 (0.58–0.70) | 0.66 (0.60–0.73) | 0.67 (0.61–0.73) | 0.68 (0.62–0.73) | 0.69 (0.63–0.75) |
| p compared to qSOFA | reference | 0.66 | 0.37 | 0.26 | 0.18 | 0.11 |
| p compared to NEWS2 | 0.26 | 0.50 | 0.82 | reference | 0.82 | 0.65 |
| Composite outcome incl lactate excl CNS OD | ||||||
| AUC | 0.62 (0.55–0.68) | 0.64 (0.58–0.70) | 0.66 (0.60–0.73) | 0.67 (0.61–0.73) | 0.68 (0.62–0.73) | 0.69 (0.63–0.75) |
| p compared to qSOFA | reference | 0.66 | 0.37 | 0.26 | 0.18 | 0.11 |
| p compared to NEWS2 | 0.26 | 0.50 | 0.82 | reference | 0.82 | 0.65 |
| Composite outcome incl lactate and CNS OD | ||||||
| AUC | 0.62 (0.56–0.68) | 0.64 (57–0.70) | 0.67 (0.61–0.73) | 0.68 (0.62–0.74) | 0.68 (0.62–0.74) | 0.69 (0.63–0.75) |
| p compared to qSOFA | reference | 0.66 | 0.26 | 0.18 | 0.18 | 0.11 |
| p compared to NEWS2 | 0.18 | 0.36 | 0.82 | reference | 1 | 0.82 |
© 2019 by the authors. Licensee MDPI, Basel, Switzerland. This article is an open access article distributed under the terms and conditions of the Creative Commons Attribution (CC BY) license (http://creativecommons.org/licenses/by/4.0/).
Share and Cite
Mellhammar, L.; Linder, A.; Tverring, J.; Christensson, B.; Boyd, J.H.; Sendi, P.; Åkesson, P.; Kahn, F. NEWS2 Is Superior to qSOFA in Detecting Sepsis with Organ Dysfunction in the Emergency Department. J. Clin. Med. 2019, 8, 1128. https://doi.org/10.3390/jcm8081128
Mellhammar L, Linder A, Tverring J, Christensson B, Boyd JH, Sendi P, Åkesson P, Kahn F. NEWS2 Is Superior to qSOFA in Detecting Sepsis with Organ Dysfunction in the Emergency Department. Journal of Clinical Medicine. 2019; 8(8):1128. https://doi.org/10.3390/jcm8081128
Chicago/Turabian StyleMellhammar, Lisa, Adam Linder, Jonas Tverring, Bertil Christensson, John H. Boyd, Parham Sendi, Per Åkesson, and Fredrik Kahn. 2019. "NEWS2 Is Superior to qSOFA in Detecting Sepsis with Organ Dysfunction in the Emergency Department" Journal of Clinical Medicine 8, no. 8: 1128. https://doi.org/10.3390/jcm8081128
APA StyleMellhammar, L., Linder, A., Tverring, J., Christensson, B., Boyd, J. H., Sendi, P., Åkesson, P., & Kahn, F. (2019). NEWS2 Is Superior to qSOFA in Detecting Sepsis with Organ Dysfunction in the Emergency Department. Journal of Clinical Medicine, 8(8), 1128. https://doi.org/10.3390/jcm8081128